exploratory data analysis.ppt - nc state universitync state university introduction l intelligent...
TRANSCRIPT
NC STATE UNIVERSITY
Exploratory Analysis of Massive Data for Distribution Fault Diagnosis in Smart Grids
Yixin Cai, Mo-Yuen ChowElectrical and Computer Engineering,
North Carolina State UniversityJuly 2009

NC STATE UNIVERSITY Outline
l Introduction
l Integrate data
l Evaluate a single feature
l Build a fault cause classifier
l Summary
Exploratory Analysis of Massive Data for Distribution Fault Diagnosis in Smart Grids 2
NC STATE UNIVERSITY Introduction
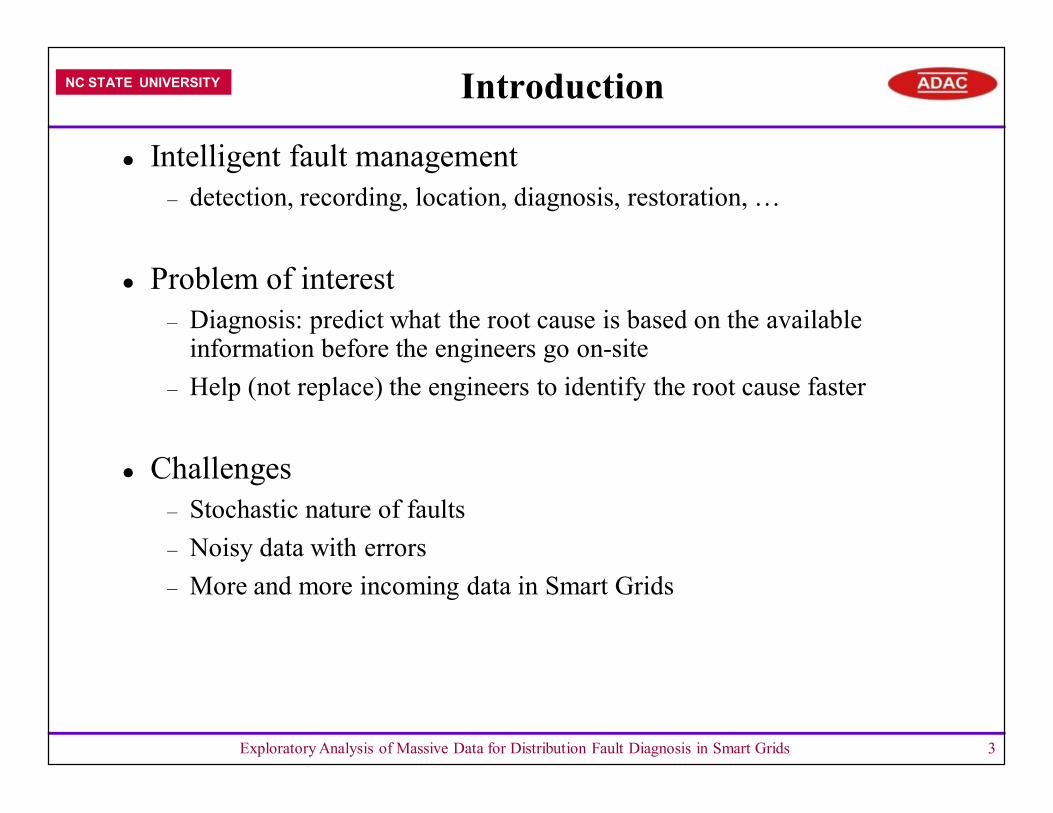
l Intelligent fault management– detection, recording, location, diagnosis, restoration, …
l Problem of interest– Diagnosis: predict what the root cause is based on the available
information before the engineers go on-site– Help (not replace) the engineers to identify the root cause faster
l Challenges– Stochastic nature of faults– Noisy data with errors– More and more incoming data in Smart Grids
Exploratory Analysis of Massive Data for Distribution Fault Diagnosis in Smart Grids 3

NC STATE UNIVERSITY Data Integration
l Data sources– Utility OMS database
Exploratory Analysis of Massive Data for Distribution Fault Diagnosis in Smart Grids 4
NC STATE UNIVERSITY Data Integration
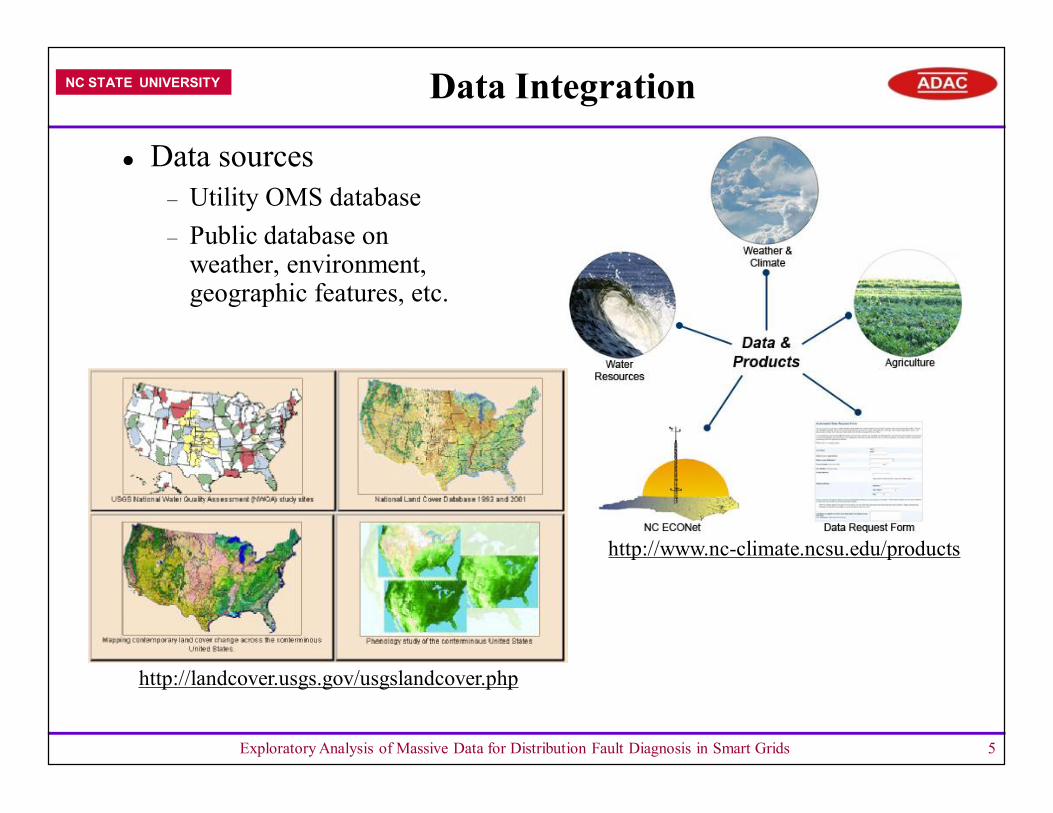
l Data sources– Utility OMS database– Public database on
weather, environment, geographic features, etc.
Exploratory Analysis of Massive Data for Distribution Fault Diagnosis in Smart Grids 5
http://www.nc-climate.ncsu.edu/products
http://landcover.usgs.gov/usgslandcover.php

NC STATE UNIVERSITY Data Integration
l Data sources– Utility OMS database– Public database on
weather, environment, geographic features, etc.
– Private venders
Exploratory Analysis of Massive Data for Distribution Fault Diagnosis in Smart Grids 6
http://www.mapmart.com/Default.aspx
NC STATE UNIVERSITY Data Integration
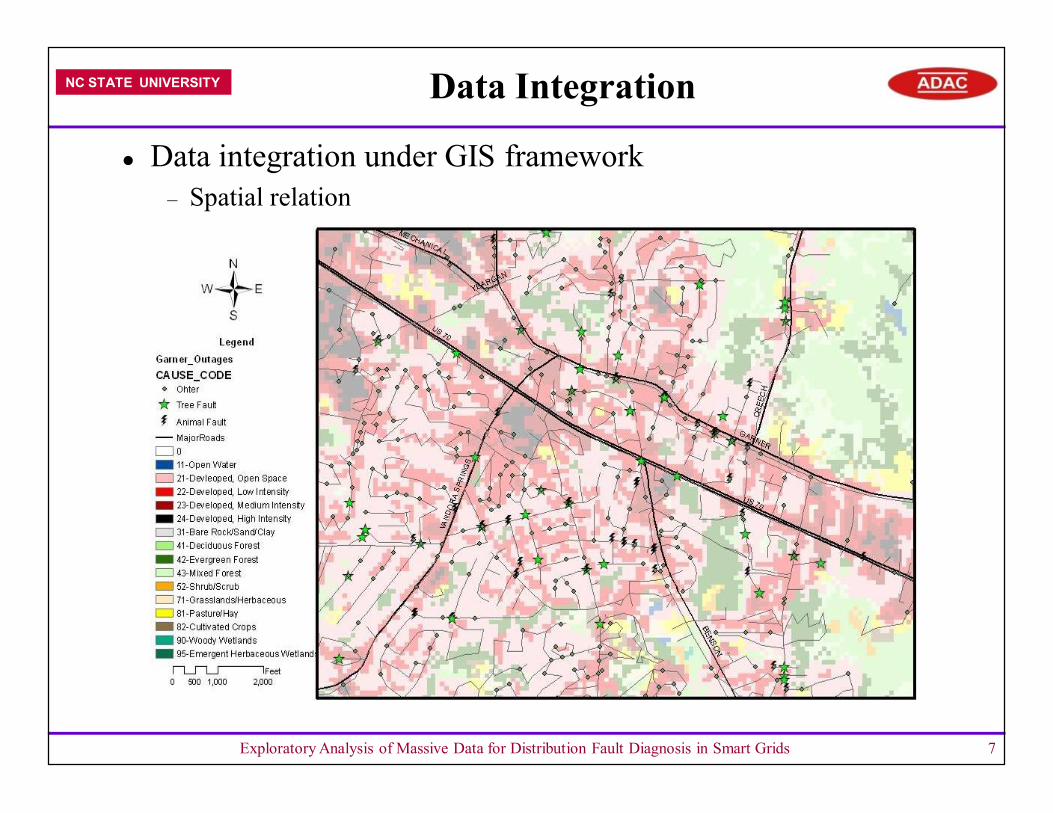
l Data integration under GIS framework– Spatial relation
Exploratory Analysis of Massive Data for Distribution Fault Diagnosis in Smart Grids 7

NC STATE UNIVERSITY Data Integration
l Data integration under GIS framework– Spatial relation– Spatial-temporal relation
Exploratory Analysis of Massive Data for Distribution Fault Diagnosis in Smart Grids 8

NC STATE UNIVERSITY Evaluate a Single Feature
Exploratory Analysis of Massive Data for Distribution Fault Diagnosis in Smart Grids 9
l Data preprocess– Define the root cause of interest– Clean errors and noises– Extract features
l Categorical features– Likelihood measure– (Mosaic) plot
,, ( | ) i j
i j i jj
NL P o X x
N= = =
Weather vs. Tree Faults
1:Clear Weather, 2: Extreme Temperature, 4:Raining, 6:Thunderstorm, 8:WindyWeather Conditinos
Tre
e Fa
ults
1 2 4 6 8
01
Season vs. Tree Faults
1:Spring, 2:Summer, 3:Fall, 4:WinterSeason
Tre
e Fa
ults
1 2 3 4
01
Land Use vs. Tree Faults
21~24:Developed, 41~43:Forest, 71:Grassland, 81~82:Cultivated, 90:WetlandsLand Use
Tre
e Fa
ults
21 22 23 2431 41 42 43 52 71 81 82 90
01

NC STATE UNIVERSITY Evaluate a Single Feature
Exploratory Analysis of Massive Data for Distribution Fault Diagnosis in Smart Grids 10
l Continuous features– Likelihood measure– plot
0 50 100 150 200 250 300
0.00
0.05
0.10
0.15
0.20
0.25
0.30
Distance to Trees vs. Tree Faults
Distance to Trees (meters)
Tre
e F
ault
Like
lihoo
d
0 200 400 600 800
0.00
0.05
0.10
0.15
0.20
0.25
0.30
Distance to Roads vs. Tree Faults
Distance to Roads (meters)
Tre
e F
ault
Like
lihoo
d
0 10 20 30 40
0.3
0.4
0.5
0.6
0.7
0.8
Wind Speed vs. Tree Faults
Hourly Max Wind Speed (miles/hour)
Tre
e F
ault
Like
lihoo
d
,, ( | ) i j
i j i jj
NL P o X x
N= ≥ =

NC STATE UNIVERSITY Build a Fault Cause Classifier
l Linear discriminant analysis (LDA)
l Logistic regression (LR)
l Comparison
Exploratory Analysis of Massive Data for Distribution Fault Diagnosis in Smart Grids 11
1
NT
i ii
D w f=
= = ∑w f 11 0[ ( )]TD −= ∑ −μ μ f
( 1)logit( 1) ln( 0)
TP ccP c
α=
= = = +=
β f 1( 1)1
TP ce α− −
= =+ β f
LDA LRModel linear classifier non-linear classifierData assumption normal distributed
with equal variancenone
Computation matrix manipulation maximum likelihood
NC STATE UNIVERSITY Case Study
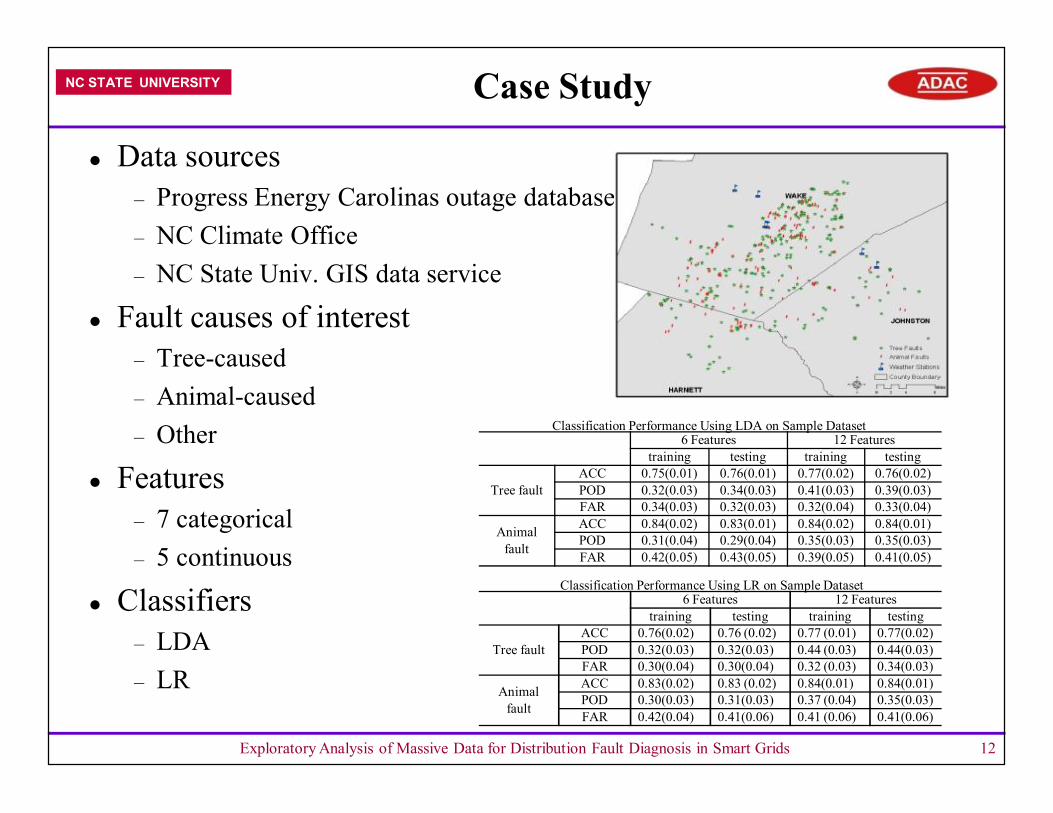
l Data sources– Progress Energy Carolinas outage database– NC Climate Office– NC State Univ. GIS data service
l Fault causes of interest– Tree-caused– Animal-caused– Other
l Features– 7 categorical – 5 continuous
l Classifiers– LDA– LR
Exploratory Analysis of Massive Data for Distribution Fault Diagnosis in Smart Grids 12
6 Features 12 Featurestraining testing training testing
Tree faultACC 0.75(0.01) 0.76(0.01) 0.77(0.02) 0.76(0.02)POD 0.32(0.03) 0.34(0.03) 0.41(0.03) 0.39(0.03)FAR 0.34(0.03) 0.32(0.03) 0.32(0.04) 0.33(0.04)
Animal fault
ACC 0.84(0.02) 0.83(0.01) 0.84(0.02) 0.84(0.01)POD 0.31(0.04) 0.29(0.04) 0.35(0.03) 0.35(0.03)FAR 0.42(0.05) 0.43(0.05) 0.39(0.05) 0.41(0.05)
6 Features 12 Featurestraining testing training testing
Tree faultACC 0.76(0.02) 0.76 (0.02) 0.77 (0.01) 0.77(0.02)POD 0.32(0.03) 0.32(0.03) 0.44 (0.03) 0.44(0.03)FAR 0.30(0.04) 0.30(0.04) 0.32 (0.03) 0.34(0.03)
Animal fault
ACC 0.83(0.02) 0.83 (0.02) 0.84(0.01) 0.84(0.01)POD 0.30(0.03) 0.31(0.03) 0.37 (0.04) 0.35(0.03)FAR 0.42(0.04) 0.41(0.06) 0.41 (0.06) 0.41(0.06)
Classification Performance Using LDA on Sample Dataset
Classification Performance Using LR on Sample Dataset

NC STATE UNIVERSITY Summary
l Methods for exploratory data analysis– Integrate data from multiple sources under GIS framework– Use likelihood measure to evaluate both categorical and continuous
features– Apply LDA and LR as fault cause classifiers
l Findings– LDA and LR performs similar– Adding new features helps fault diagnosis
l Future work– Systematic feature selection methods– Advanced fault diagnosis algorithms– Novel sampling strategy
Exploratory Analysis of Massive Data for Distribution Fault Diagnosis in Smart Grids 13