exploratory climate data visualization and analysis · pdf fileexploratory climate data...
TRANSCRIPT
Exploratory Climate Data Visualization and Analysis Using DV3D and UVCDAT
Thomas Maxwell NASA Center for Climate Simulation
Goddard Space Flight Center Greenbelt, MD
AbstrucJ- Earth system scientists are being inundated by an explosion of data generated by ever-increasing resolution in both global models and remote sensors. Advanced tools for accessing, analyzing, and visualizing very large and complex climate data are required to maintain rapid progress in Earth system research. To meet this need, NASA, in collaboration with the Ultra-scale Visualization Climate Data Analysis Tools (UVC OAT) consortium, is developing exploratory climate data analysis and visualization tools which provide data analysis capabilities for the Earth System Grid (ESG).
This paper describes DV3D, a UV·COAT package that enables exploratory analysis of climate simulation and observation datasets. OV3D provides user-fr iendly interfaces for visualization and analysis of climate data at a level appropriate for scientists. It features workflow inte rfaces, interactive 40 data exploration, hyperwall and stereo visualization, automated provenance generation, a nd parallel task execution. DV30's integration with CDAT's climate data management system (C OMS) and other climate data analysis tools provides a wide range of high performance climate data analysis operations. DV3D expands the scientists' toolbox by incorporating a suite of rich new exploratory visualization and analysis methods fo r addres~ing the complexity of climate datasets.
Keywords-climatej visualizatioll,' mllllysis; simulatioll,'
I. INTRODUCfION
In recent years substant ial progress in understanding Earth's climate system is driving an explosion, both in scale and complexity, of climate related data. Current climate models are capable of generating petabytes of data from a single run. The complexity of these datasets is also increasi ng as models encompass an increasingly wide range of earth systems, adding many new variables to the datasets and requiring integration of an increasingly wide range of observational data sources.
The process of knowledge discovery in climate science requires effective lools to discover, access, manipulate, and visualize the dala sets of interest. Recent developments are driving the need for a new generation of climate knowledge discovery tools as the scientists ' traditional toolkit is progressively being overwhelmed and rendered obsolete by the "data tsunami". Key technical challenges include the seamless integration of advanced exploratory visuali zation tools, workflow and provenance support, and high perfomlance computing.
I!. TECHNICAL CHALLENGES
A. Exploratory Visualization
Deriving actionable information from climate simulations requires the capacity to detect, compare, and analyze features spanning large heterogeneous, multi-variate, multi-dimensional datasets with spatial and temporal references. The brain's capacity to detect visual patterns is invaluable in this knowledge discovery process. Visual mapping techniques are very effective in express ing the results of feature detection and analysis algorithms as they naturally employ the visual information processing capacity of the cerebral cortex, which is extremely difficult to emulate using stati stical and machine learning approaches alone. Graphical representations are very effective at summarizing data, exposing unusual features, and communicating "interesting" and information rich concepts, relationships, and processes that are latent in the data. Exploratory climate data analysis relies heavi ly on such mapping techniques but has traditionally been confi ned to two dimension views such as contour plots, line and scatter graphs, and histograms. The complexity of the climate knowledge discovery process is increasing due to the increasing complexity of climate datasels. Visual representations, which play an important role in addressing data complexity, can be enhanced by an increase in the number of "degrees of freedom" in the visual mapping process. Interactive three-dimensional views into complex high dimensions datasets can offer a widened perspective and a more comprehensive gestalt fac il itating the recognition of significant features and the discovery of important patterns.
B. Work flows and Provenance
The climate knowledge discovery process typically involves the assembly of complex computational processes, often requiring the combination of disparate appl ications, libraries, and data sources. These processes may generate many intermediate and final data products, adding to the complexity of task management. Workflow systems have been shown to be an effective tool in addressing these challenges [I]. Not only do they support the automation of repetitive tasks, but they can also embody complex analytical processes at various levels of encapsulation and facilitate the integrat ion of multiple tools, languages, and approaches within a cohesive framework. Each module within a workflow can wrap a distinct tool , script, or library, providing a unified
interface to disparate programming paradigms. The workflow infrastructure transparently maps the data structures exported from each module into the data structures required as inputs to the connected modules, providing an invisible "glue" facilitating application integration. Structuring the computation as a set of interchangeable building blocks simplifies application development. The workflow framework can also transparently automate provenance collection.
A comprehensive provenance infrastructure records detailed history information about the steps followed and data derived in the course of an exploratory knowledge discovery task [2]. It maintains a record of every step of the workflow development and configuration process, as well as the datasets and parameters used in each workflow execution. It transparently documents every step of the discovery process enabling users to readily regenerate any analysis product. The providence trai l allows users to query, interact with, and understand the history of an analysis process. It enables users to easily navigate through the space of pipelines created for a given exploration task and compare analysis products as well as their corresponding work flows. Users can easily back up to earlier sages of the exploration and start a new branch of investigation without losing the previous results. Provenance facilitates the flexible reuse of workflows, as knowledge embedded in existing workflows can be reused to simplify the construction of new work flows.
[ R
C VisIt
GVie~ [ Matlab
[ Workflow UY-CDAT }, I Builder GUI Scripling
1.:\' 1 -----r--, -CO--AT- Cor. i JI·~t' &11:: [ ,
} ~h~ ~ I ~sTrails ~~~vcs -J IrQ, VI r------~ :. w - -.
t'[U( Provenance Stor.g. ) . VTK/para!'!'.w J J
UV·CDAT
loosely eoo,iIed I~egralon
T~hity Coopled Integration
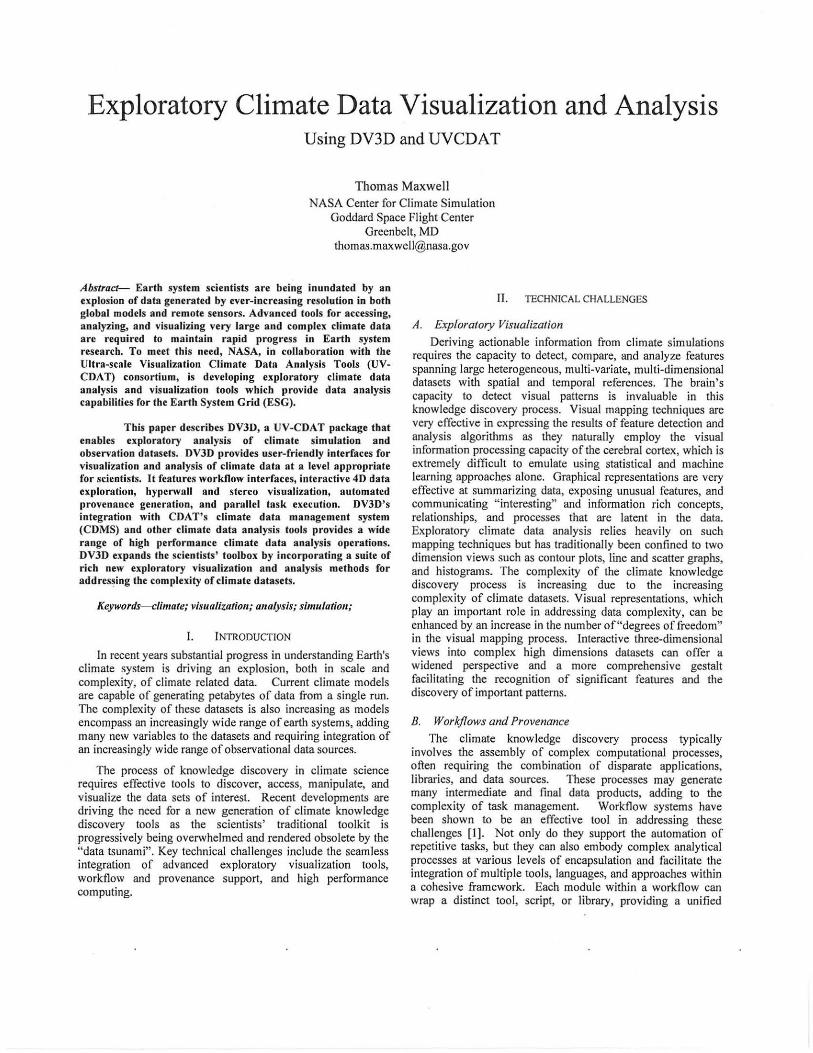
Figure 1. The UV-DCA T architecture.
Ill. FACILITATING EXPLORATORY KOWLEDGE DISCOVERY
This project is motivated by the observation that climate scientists can benefit greatly from comprehensive workflow, provenance, and 3D exploratory visualization infrastructure, but they rarely employ these methodologies. Even though advances in computer hardware and applications have yie lded a number of innovative and promising solutions, most of them are not yet available to climate scientists because the existing interfaces are too complex and/or generic. Support for climate-specific operations (e.g. climate data access, processing, and custom display) are generally lacking_ Advanced visualization modalities have been relegated to visualization professionals. Tools supporting these important methods have largely been confined to the realm of computer
science research and play little jf any role in climate scientists' interactive knowledge discovery process.
To address these technical challenges, researchers at NASA have been developing the DV3D [3] climate data analysis and visualization tool and collaborating with the UV-CDAT development consortium [4]. DV3D has been developed as a module within the Vistrails [5] scientific workflow and provenance management system and later integrated into the UV -CDA T framework, which is also build upon Vistrails (Fig. I). UV-CDAT is a workflow-based, provenance-enabled system that integrates numerous climate data analysis libraries and visualization tools in an end-to-end application. UVCDAT (with DV3D) enables users to build complex data analysis and visualization workflows that utilize user-defined processing operations as well as predefined components for data transformation, data collection from disparate data sources including the Earth System Grid (ESG), and interactive visualization.
.. .. .
-"-._. -.--_N __
--~-. - L ___ ....,!;;=!:.!.:::.L_.J.==-...
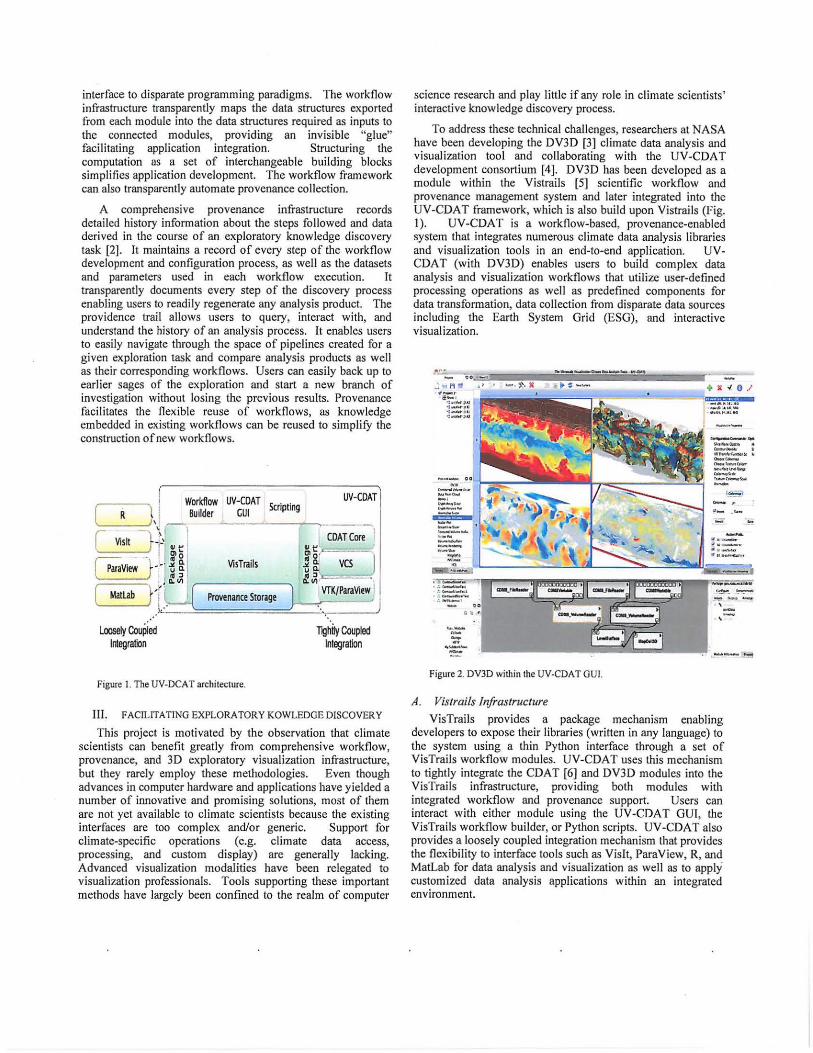
Figure 2. DV3D within the UV-CDAT GUI.
A. Vistrails Infrastructure
VisTrails provides a package mechanism enabling developers to expose their libraries (written in any language) to the system using a thin Python interface through a set of VisTrails workflow modules. UV-CDAT uses this mechanism to tightly integrate the CDA T [6J and DV3D modules into the VisTrails infrastructure, providing both modules with integrated workflow and provenance support. Users can interact with either module using the UV-CDAT GUI, the VisTrails workflow builder, or Python scripts. UV-CDAT also provides a loosely coupled integration mechanism that provides the flexibility to interface tools such as Visit, ParaView, R. and MatLab for data analysis and visualization as well as to apply customized data analysis applications within an integrated environment.
B. The DV3D Package
DV3D is a Vistrails package of high-level modules for UVCDAT providing user~friendly workflow interfaces for advanced visualization and analysis of climate data at a level appropriate for scientists. DV3D's straightforward QUI interface is designed for scientists who would have little interest in taking time away from research to become visualization experts. The application incorporates numerous features specifically designed for climate data analysis. It builds on VTK [7], an open-source, object-oriented library, for visualization and analysis . DV3D provides the high-level interfaces, too ls, and application integrations required to make the analysis and visualization power of VTK readily accessible to users without exposing details such as actors, cameras, renderers, and transfer functions. It can run as a desktop application or distributed over a set of nodes for hyperwall or distributed visualization applications.
C. DV3D Plot Types
The DV3D package offers scientists a set of coordinated interactive 3D views (Le. plots) into their datasets. Each DV3D plot type offers a unique perspective by highlighting particular features of the data. Multiple plots can be combined synergistically (within a single cell or across multiple cells) to facilitate understanding of the natural processes underlying the data. For example, the plot types include:
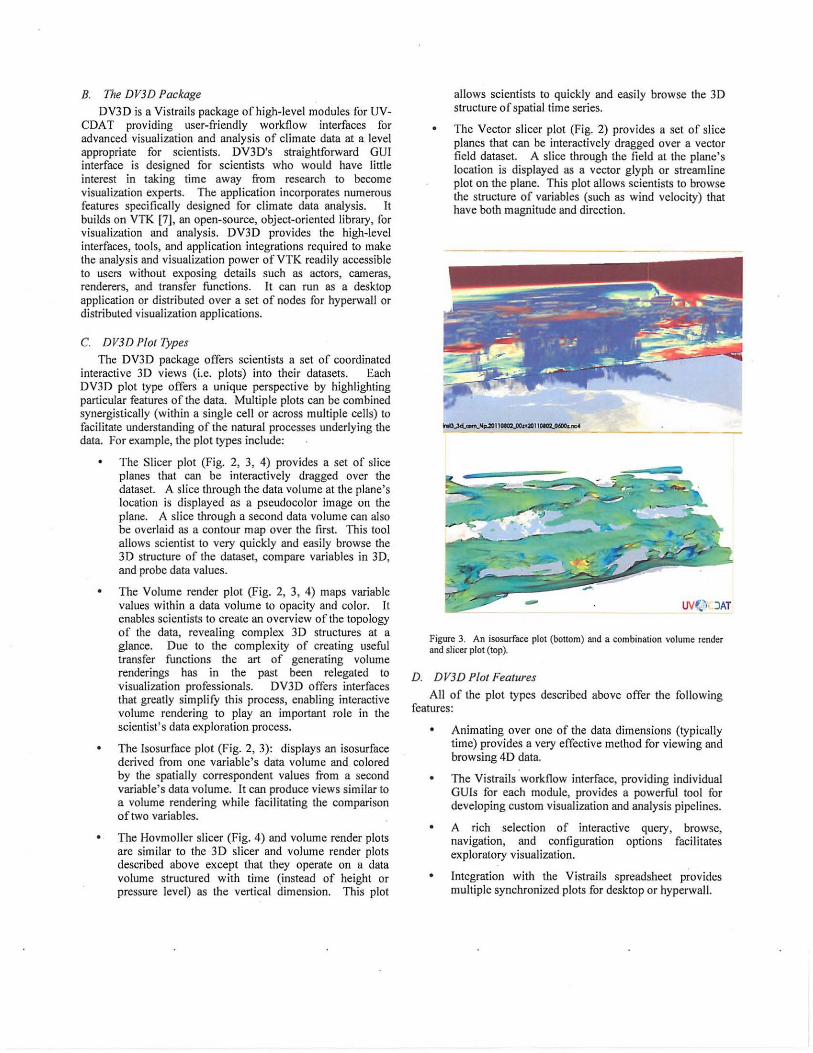
The Slicer plot (Fig. 2, 3, 4) provides a set of slice planes that can be interactively dragged over the dataset. A slice through the data volume at the plane's location is displayed as a pseudocolor image on the plane. A slice through a second data volume can also be overlaid as a contour map over the first. This tool a llows scientist to very quickly and easily browse the 3D structure of the dataset, compare variables in 3D, and probe data values.
• The Volume render plot (Fig. 2, 3, 4) maps variable values within a data volume to opacity and color. It enables scientists to create an overview of the topology of the data, revealing complex 3D structures at a glance. Due to the complexity of creating useful transfer functions the art of generating volume renderings has in the past been relegated to visualization professionals. DV3D offers interfaces that greatly simplify this process, enabling interactive volume rendering to play an important role in the scientist ' s data exploration process.
The lsosurface plot (Fig. 2, 3): displays an isosurface derived from one variable's data vo lume and colored by the spatially correspondent values from a second variable ' s data volume. It can produce views simi lar to a volume rendering while facilitating the comparison of two variables.
• The Hovmollcr slicer (Fig. 4) and volume render plots arc similar to the 3D slicer and volume render plots described above except that they operate on a data volume structured with time (instead of height or prcssure level) as the vertical dimension. This plot
allows scientists to qu ickly and easily browse the 3D structure of spatial time series.
The Vector slicer plot (Fig. 2) provides a set of slice planes that can be interactively dragged over a vector field dataset. A slice through the field at the plane's location is displayed as a vector glyph or streamline plot on the plane. This plot allows scientists to browse the structure of variables (such as wind velocity) that have both magnitude and direction.
- uv( '.· JAT
Figure 3. An isosurface plot (bottom) and a combination volume render and slicer plot (top).
D. DV3D Plat Features
All of the plot types described above offer the following features:
• Animating over one of the data dimensions (typically time) provides a very effective method for viewing and browsing 4D data.
The Vistrails workflow interface, providing individual GUIs for each module, provides a powerful tool for developing custom visual ization and analysis pipelines.
A rich selection of interactive query> browse, navigation, and configuration options facilitates exploratory visualization.
Integration with the Vistrails spreadsheet provides multiple synchronized plots for desktop or hyperwall .
Integration with the Vistrails provenance architecture provides transparent collection and comprehensive management of workflow and data provenance.
The underlying VTK architecture provides active and passive 3D stereo visualization support.
Seamless integration with CDA Ts climate data management system (CDMS) [8] and other climate data analysis tools provides extensive climate data processing and analysis functionality.
E. The UVCDAT GUf
Fig. 2 displays DV3D within the UV-CDAT GUI, which extends the Vistrails spreadsheet (middle), a rcsizable grid of visualization cell s. Visualizations can be created, modified, copied, rearranged, and compared using drag-and-drop operations. Spreadsheets maintain their provenance and can be saved and re loaded. Visualizations can be used for data exploration and decision-making, whi le at the same time being fully customizable and reproducible. Around the spreadsheet are tools for building visualizations. The project view (top left) facilitates the organization of spreadsheets into projects. The plot view (bottom left) provides a palette of available plots, exposing a list of prebuilt workflows from DV3D and other Vistrails packages. The" variable view (top right) provides an interface for selecting and editing variables. The bottom right contains tools for executing data processing and analysis operations on variables using either a command-line or calculator interface.
F. The DV3D Interface
The DV3D package is composed of a set of Vistrails modules. Each DV3D module offers a distinctive GUt interface (accessible from the Vistrai ls workflow builder) enabling the configuration of workflow parameters. These modules can be selected from a palette and linked to create custom workflows using the Vistrails workflow builder. The DV3D spreadsheet cells also offer a wide range of interactive key press and mouse drag operations facilitat ing the configuration of colormaps, transfer functions, and other display and execution options. For example, pressing a button in a configuration panel and then clicking and dragging in a spreadsheet cell displaying a DV3D volume render plOl initiates a leveling operation that controls the shape of the plot's opacity or color transfer function. The volume render plot changes interactively as the user drags the mouse around the cell.
All configuration operations are saved as Vistrails provenance. The provenance trail contains a record of all workflow construction and configuration operations that contributed to the current visualization, making it easy to revert to an earlier configuration of the workflow at any stage of development. The user can maintain multiple developmental branches of a single workflow and easily switch back and forth between them.
G. DV3D Workflows
A DV3D workflow begins with a set of modules encapsulating CDMS operations for accessing and processing climate data from the local file system, the Earth System Grid Federation, or the ParaView server on a remole supercomputer. The CDA T toolkit provides a wide range of climate data analysis operations, e.g. simple arithmetic operations, regridding, conditioned comparisons, weighted averages, various statistical operations, etc. A DV3D translation module converts the proccssed CDMS data volumes into VTK image data instances to initialize the visualization branch of a DV3D workflow. DV3D visualization modules encapsulate complex VTK pipelines with numerous supporting objects such as actors, cameras, renderers, interaction observers, data mappers, and transfer functions. Each visualization pipeline implements a unique interactive 3D plot. Each branch of a DV3D workflow terminates in a DV3D ce ll module, which represents a custom cell in the UVCDAT spreadsheet. The DV3D cell module includes a configurable base map. navigation controls, onscreen dataset and variable labels, a pick operation display, and legendlcolormap displays. Cells in the spreadsheet can be individually activated or deactivated by selection. Configuration and navigation operations are propagated to all active cells.
H. Distributed Visualization/or the Hyperwall
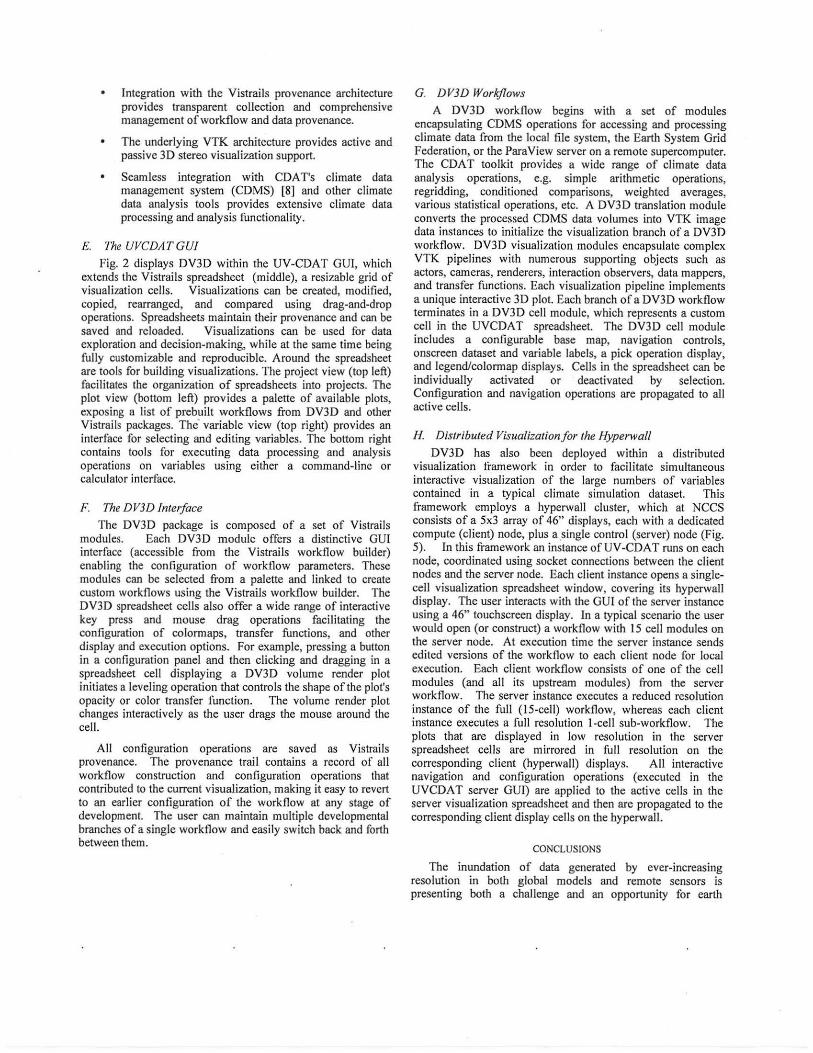
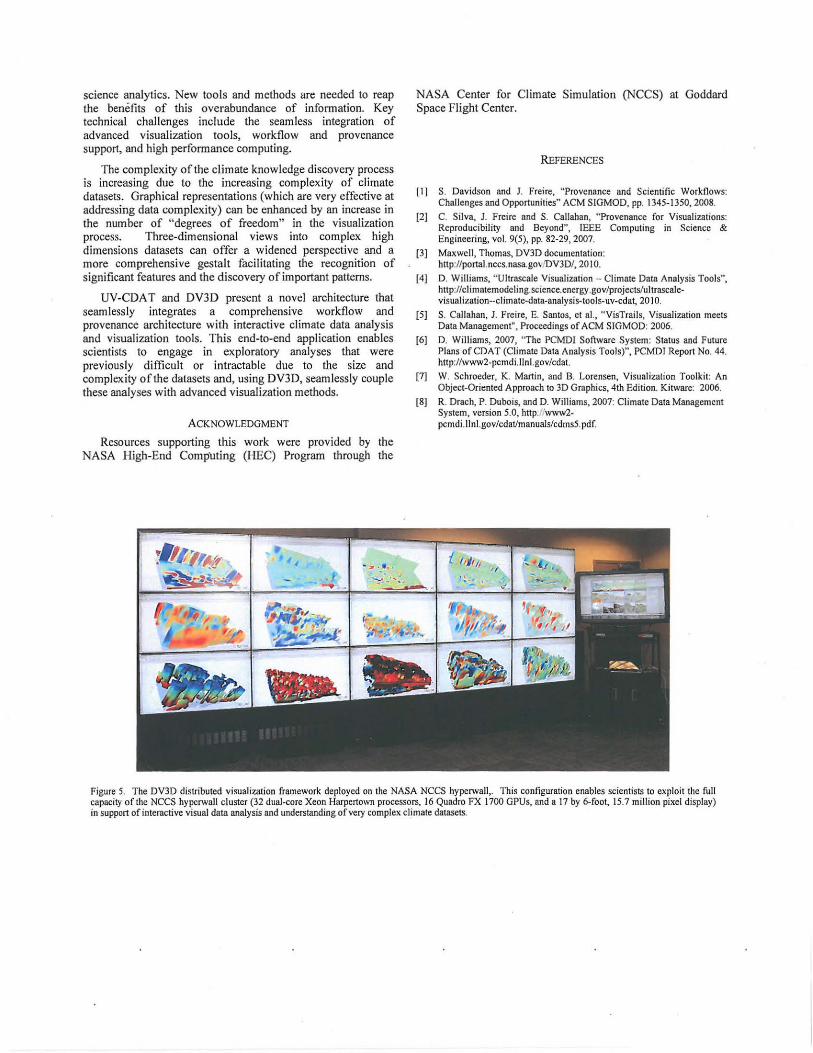
DV3D has also been deployed with in a distributed visualization framework in order to facilitate simultaneous interactive visualization of the large numbers of variables contained in a typical climate simulation dataset. This framework employs a hyperwall cluster, which at NCCS consists of a 5x3 array of 46" displays, each with a dedicated compute (client) node, plus a .single control (server) node (Fig. 5). In this framework an instance of UV -CDA T runs on each node, coordinated using socket connections between the client nodes and the server node. Each client instance opens a singlecell visualization spreadsheet window, covering its hyperwall display. The user interacts with the GUI of the server instance us ing a 46" touchscreen display. In a typical scenario the user would open (or construct) a workflow with 15 cell modules on the server node. At execution time the server instance sends edited versions of the workflow to each client node for local execution. Each client workflow consists of one of the cell modules (and all its upstream modules) from the server workflow. The server instance executes a reduced resolution instance of the full (I5-cell) workflow, whereas each client instance executes a full resolution I-cell sub-workflow. The plots that are displayed in low resolution in the server spreadsheet cells are mirrored in fu ll resolution on the corresponding client (hyperwall) displays. All interactive navigation and configuration operat ions (executed in the UVCDAT server GUI) are applied to the active cells in the server visualization spreadsheet and then are propagated to the corresponding client display cells on the hyperwall .
CONCLUSIONS
The inundation of data generated by ever-increasing resolution in both global models and remote sensors is presenting both a challenge and an opportunity for earth
science analytics. New tools and methods are needed to reap the benefits of this overabundance of information. Key technical challenges include the seamless integration of advanced visualization tools, workflow and provenance support. and high performance comput ing.
The complexity of the climate knowledge discovery process is increasing due to the increasing complexity of climate datasets. Graphical representations (which are very effective at addressing data complexity) can be enhanced by an increase in the number of "degrees of freedom" in the visualization process. Three-dimensional views into complex high dimensions datasets can offer a widened perspective and a more comprehensive gestalt facili tating the recognition of significant features and the d iscovery of important patterns.
UV-CDA T and DV3D present a novel architecture that seamlessly integrates a comprehensive workflow and provenance architecture with interact ive climate data analysis and visualization tools. This end-ta-end application enables scientists to engage in exploratory analyses that were previously difficult or intractable due to the size and complexity afthe datasets and, using DV3D, seamlessly couple these analyses with advanced visualization methods.
A CKNOWLEDGMENT
Resources supporting this work were provided by the NASA High-End Computing (HEC) Program through the
'F .• ~. , ,
"::-~ -..... ,,
NASA Center for Climate Simulation (NCCS) at Goddard Space Flight Center.
REFERENCES
[1) S. Davidson and 1. Freire, "Provenance and Scientific Workflows: Challenges and Opponunities" ACM SIGMOD, pp. 1345-1350, 2008.
[2J C. Silva. 1. Freire and S. Callahan, "Provenance for Visualizations: Reproducibility and Beyond", IEEE Computing in Science & Engineering, vol. 9(5), pp. 82-29, 2007.
[3] Maxwell, Thomas, DV3D documentation: http://ponal.nccs.nasa.govIDV3Df,2010.
[4] D. Williams, "Ultrascale Visualization - Climate Dala Analysis Tools", hnp:llclimatemodeling.science.energy.govfprojectslultrascalevisualizalion"-clim atc.data-analysis-tools-uv-cdat, 20 I O.
[5] S. Callahan. 1. Frei re, E. Santos, et ai., "VisTrails, Visualization meets Data Management" , Proceedings of ACM SIGMOD: 2006.
[6J D. Will iams, 2007, "The PCMDI Software System: Status and Future Plans of CD AT (Climate Data Analysis Too ls)", PCMDI Repon No. 44. http://www2-pcmdi .llnl. govlcdat.
[7J W. Schroeder, K. Martin, and B. Lorensen, Visualization Toolkit: An Object-Oriented Approach to 3D Graphics. 4th Edition. Kilware: 2006.
(8) R. Drach, P. Dubois, and D. Williams, 2007: Climate Data Management System, version 5.0, http.liwww2-pcmdi. 1lnl .gov/cdatfmanuaJslcdms5. pd r.
{ 1II Ih
Figure 5. The DV3D distributcd visualization framework deployed on the NASA NCCS hypclWall,. This configuration enables scientists to exploit the full capacity of the NCCS hYPClWall cluster (32 dual·core Xeon Harpertown processors, 16 Quadro FX 1700 OPUs, and a 17 by 6-foot, 15.7 million pixel display) in support of interactive visual data analysis and understanding of very complex climate datasets.