exploratory analysis of gpd gis data - preliminary report
TRANSCRIPT


Exploratory Analysis of GPD GIS Data - Preliminary Report January 26, 2016
1

Exploratory Analysis of GPD GIS Data - Preliminary Report January 26, 2016
2
Summary of Exploratory Data Analysis of Greensboro Police Department TS (Traffic Stops) Excel
Spreadsheet and Census_Counts Excel Spreadsheet
The sixteen tables in this document provide a preliminary exploratory analysis of data regarding traffic
stops and searches using the Greensboro Police Department (GPD) TS Excel spreadsheet and
Census_and_Counts spreadsheet. The data contained in these spreadsheets includes information
regarding stops and searches between January 2, 2009 and June 29, 2015 and data from the 2010
Census. The intent of this report is to provide information to lend itself to a discussion about traffic
stops and traffic searches in the City of Greensboro, NC and the concerns about implicit racial bias
among GPD organization. The end of this report provides a summary of this initial exploratory analysis, a
discussion of implications for GPD, and recommendations are made for further research.
Table of Contents
Methodology Table 1 – Stops by Gender and Race Table 2 – Stops by Violation Table 3 – Searches by Race Table 4 – Searches by Search Type and Race Table 5 – Searches by Search Base and Race Table 6 – Searches by PV Search and Race Table 7 – Traffic Stops by Census block groups Table 8 – Searches by Census block groups Table 9 – Count Type Field by Census block groups Table 10 – Missing Data Table 11 - Indicators (or Predictors) of Traffic Stops (TSCOUNT) Table 12 - Indicators (or Predictors) of Calls for Service (CFSSELFCOUNT) Table 13 - Indicators (or Predictors) of Calls for Service (CFSCITCOUNT) Table 14 - Indicators (or Predictors) of Traffic Stop Searches (TSSEARCHCOUNT) Table 15 - Crime Counts and Associated Census block groups Predominant Race Statistics Table 16 - Crime Counts and Associated Census block groups Percent Poverty Statistics Summary of Findings Implicit Bias Greensboro Police Department Traffic Stop Practices, Policies, Greensboro Police Department Organizational Culture and Community Relations – Policy and Practice Discussion and Implications Implicit Bias, Data Collection, and Language – Poverty, Additional Variables and the Conversation: Recommendations for Further Research Methods
The tables in this document contain an exploratory statistical analysis of the geographical information system data
sets provided by the Greensboro Police Department. The TS.xls file contains data from each traffic stop performed
between January 2, 2009 and June 29, 2015. The Census_and_Count.xls file contains traffic stop data coupled with
2010 census data for the city of Greensboro. Statistical analyses run on these data sets include percent proportion
and regression. In some instances census block frequency data is presented in conjunction with census tract
poverty data within which a particular census block is nested.
Tables 1 – 9 below contain percent proportion statistics regarding traffic stops and searches recorded in the TS.xls
file. Percent proportions of violations, search type, search base, articles found during searches, and type of
violation by race are described by the descriptive statistics in these tables.

Exploratory Analysis of GPD GIS Data - Preliminary Report January 26, 2016
3
Table 10 is the missing data calculations.
Tables 11 – 14 include regression analysis data for traffic stops and searches with models including the variables
for race, field interviews, crime count, part I crime count, calls for service police initiated, and calls for service
citizen initiated.
Table 15 contains frequency data for crime counts, traffics stops, and traffic searches for the highest frequencies
by census block groups. This data is coupled with the predominant race data by the census track within which each
block is nested in order to provide racial context by the total population.
Table 16 contains frequency data for crime counts, traffics stops, and traffic searches for the highest frequencies by census block groups. This data is coupled with the percent below the poverty level data by the census track within which each block is nested in order to provide poverty context by the total population.
Chi-squares returned statistically significance at alpha .05
Descriptive Statistics from data in TS.xls spreadsheet
Stop and search data below include data from 2009 – 2015.
Table 1 below presents stop data by gender and by race. Gender data demonstrates that males are stopped more
than females. Race data demonstrates that blacks are stopped at a higher percentage than whites.
Table 1
Stops – Gender and Race
Frequency Percent
Gender
Male 175028 59.3
Female 120199 40.7
Total 295227
Race
A 5255 1.8
B 158872 53.8
I 1508 0.5
U 1601 0.5
W 127991 43.4
Total 295227
A = Asian or Pacific Islander B = Black I = American Indian/Alaskan Native U = Other W = White
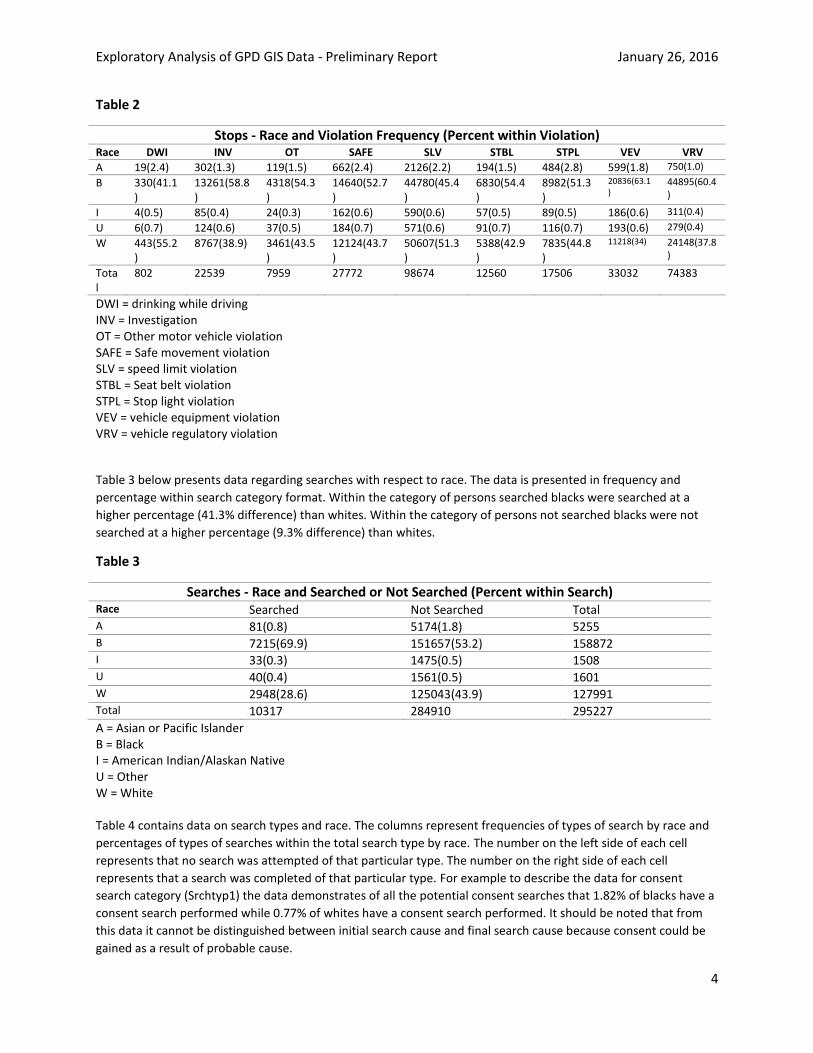
Table 2 below presents stop data regarding violations with respect to race. The data is presented in frequency and
percentage within violation format. Stop violation categories where percentage of whites is higher than
percentage of blacks include drinking while driving (DWI) and speed limit violation (SLV). Stop violation categories
where percentage of blacks is higher than percentage of whites include investigation (INV), other motor vehicle
violation (OT), safe movement violation (SAFE), seat belt violation (STBL), stop light violation (STPL), vehicle
equipment violation (VEV), and vehicle regulatory violation (VRV).
Exploratory Analysis of GPD GIS Data - Preliminary Report January 26, 2016
4
Table 2
Stops - Race and Violation Frequency (Percent within Violation) Race DWI INV OT SAFE SLV STBL STPL VEV VRV
A 19(2.4) 302(1.3) 119(1.5) 662(2.4) 2126(2.2) 194(1.5) 484(2.8) 599(1.8) 750(1.0)
B 330(41.1)
13261(58.8)
4318(54.3)
14640(52.7)
44780(45.4)
6830(54.4)
8982(51.3)
20836(63.1)
44895(60.4)
I 4(0.5) 85(0.4) 24(0.3) 162(0.6) 590(0.6) 57(0.5) 89(0.5) 186(0.6) 311(0.4)
U 6(0.7) 124(0.6) 37(0.5) 184(0.7) 571(0.6) 91(0.7) 116(0.7) 193(0.6) 279(0.4)
W 443(55.2)
8767(38.9) 3461(43.5)
12124(43.7)
50607(51.3)
5388(42.9)
7835(44.8)
11218(34) 24148(37.8)
Total
802 22539 7959 27772 98674 12560 17506 33032 74383
DWI = drinking while driving INV = Investigation OT = Other motor vehicle violation SAFE = Safe movement violation SLV = speed limit violation STBL = Seat belt violation STPL = Stop light violation VEV = vehicle equipment violation VRV = vehicle regulatory violation
Table 3 below presents data regarding searches with respect to race. The data is presented in frequency and
percentage within search category format. Within the category of persons searched blacks were searched at a
higher percentage (41.3% difference) than whites. Within the category of persons not searched blacks were not
searched at a higher percentage (9.3% difference) than whites.
Table 3
Searches - Race and Searched or Not Searched (Percent within Search) Race Searched Not Searched Total A 81(0.8) 5174(1.8) 5255 B 7215(69.9) 151657(53.2) 158872 I 33(0.3) 1475(0.5) 1508 U 40(0.4) 1561(0.5) 1601 W 2948(28.6) 125043(43.9) 127991 Total 10317 284910 295227
A = Asian or Pacific Islander B = Black I = American Indian/Alaskan Native U = Other W = White Table 4 contains data on search types and race. The columns represent frequencies of types of search by race and
percentages of types of searches within the total search type by race. The number on the left side of each cell
represents that no search was attempted of that particular type. The number on the right side of each cell
represents that a search was completed of that particular type. For example to describe the data for consent
search category (Srchtyp1) the data demonstrates of all the potential consent searches that 1.82% of blacks have a
consent search performed while 0.77% of whites have a consent search performed. It should be noted that from
this data it cannot be distinguished between initial search cause and final search cause because consent could be
gained as a result of probable cause.

Exploratory Analysis of GPD GIS Data - Preliminary Report January 26, 2016
5
Table 4
Searches – Search Type and Race (Frequency and Percent within Total Srchtyp Category) Race Srchtyp1
(No/Yes) Srchtyp2 (No/Yes)
Srchtyp3 (No/Yes)
Srchtyp4 (No/Yes)
Srchtyp5 (No/Yes)
A frequency 5196/59 5255/0 5221/34 5238/17 5242/13 A percent within total
1.76/0.02 1.78/0 1.77/0.01 1.77/0.01 1.78/0
B frequency 153505/5367 158867/5 155252/3620 157679/1193 157897/975 B percent within total
52/1.82 53.81/0 52.59/1.23 53.41/0.40 53.48/0.33
I frequency 1483/25 1508/0 1494/14 1503/5 1506/2 I percent within total
0.52/0.01 0.51/0 0.51/0 0.51/0 0.51/0
U frequency 1564/37 1601/0 1592/9 1596/5 1594/7 U percent within total
0.53/.01 0.54/0 0.54/0 0.54/0 0.54/0
W frequency 125730/2261 127989/2 126657/1334 127416/575 127689/302 W percent within total
42.59/0.77 43.35/0 42.90/0.45 43.16/0.19 43.25/0.10
Srchtyp1 = consent Srchtyp2 = search warrant Srchtyp3 = probable cause Srchtyp4 = incident to arrest Srchtyp5 = protective frisk
For the data in table 5 it should be noted that officers can check all that apply with respect to search base.
Therefore the data in this table traffic stop and potential traffic searches may be counted in multiple search base
categories. The highest search base categories for blacks are erratic/suspicious behavior, observation of suspected
contraband, and other official information. The highest search base category for whites is erratic/suspicious
behavior.
Table 5
Searches – Search Base and Race (Frequency and Percent within Total Srchbas Category) Race Srchbas1
(No/Yes) Srchbas2 (No/Yes)
Srchbas3 (No/Yes)
Srchbas4 (No/Yes)
Srchbas5 (No/Yes)
Srchbas6 (No/Yes)
A frequency 5215/40 5227/28 5217/38 5233/22 5253/2 5253/2 A percent within total
1.8/0 1.8/0 1.8/0 1.8/0 1.8/0 1.8/0
B frequency 154443/4429 155526/3346 156225/2647 156425/2447 158780/92 158741/131 B percent within total
52.3/1.5 52.7/1.1 52.9/0.9 53.0/0.8 53.8/0 53.8/0
I frequency 1488/20 1493/15 1497/11 1502/6 1508/0 1508/0 I percent within total
0.5/0 0.5/0 0.5/0 0.5/0 0.5/0 0.5/0
U frequency 1581/20 1584/17 1580/21 1586/15 1601/0 1601/0 U percent within total
0.5/0 0.5/0 0.5/0 0.5/0 0.5/0 0.5/0
W frequency 125947/2044 126721/1270 127031/960 127067/924 127941/50 127941/50 W percent 42.7/0.7 42.9/0.4 43.0/0.3 43.0/0.3 43.4/0 43.3/0

Exploratory Analysis of GPD GIS Data - Preliminary Report January 26, 2016
6
within total
Srchbas1 = erratic/suspicious behavior Srchbas2 = observation of suspected contraband Srchbas3 = other official information Srchbas4 = suspicious movement Srchbas5 = informant tip Srchbas6 = witness observation
For the data collected on traffic stops the race of passengers is not recorded consistently. For this reason we will
only discuss PVSearch1 and PVsearch2. PV search3 and PVsearch4 contain passenger data and race cannot be
determined from these data. The data in Table 6 below demonstrates that of all vehicles searched 69.9 percent of
drivers are black and 28.6 percent of drivers are white. The data demonstrates that of all drivers searched 70.2
percent of drivers are black and 28.3 percent of drivers are white.
Table 6
Searches – PV Search and Race (Frequency and Percent within Total Pvsearch Category) Race Pvsearch1
(No/Yes) Pvsearch2 (No/Yes)
Pvsearch 3 (No/Yes)
Pvsearch 4 (No/Yes)
A frequency 5170/85 5165/90 5222/33 5204/51 A percent within total 1.8/0.8 1.8/0.8 1.8/0.7 1.8/1.0 B frequency 151016/7856 150912/7960 155694/3178 155367/3505 B percent within total 53.2/69.9 53.2/70.2 53.5/71.3 53.6/67.4 I frequency 1473/75 1475/33 1495/13 1489/19 I percent within total 0.5/0.3 0.5/0.3 0.5/0.3 0.5/0.4 U frequency 1554/47 1556/45 1584/17 1587/14 U percent within total 0.5/0.4 0.5/0.4 0.5/0.4 0.5/0.3 W frequency 124777/3214 124776/3215 126777/1214 126379/1612 W percent within total 43.9/28.6 44.0/28.3 43.6/27.3 43.6/31.0
Pvsearch1 = vehicle searched Pvsearch2 = driver searched Pvsearch3 = passenger searched Pvsearch4 = personal effects of driver searched/passenger searched
Table 7 below provides traffic stop frequency data and percent of total traffic stops data on top twelve census
block groups where over 1% of traffic stops occur. The table also includes % predominant race and total population
for each census block group listed. The traffic stop data may contain additional census block groups that fall
between 1.0 and 1.5% of total traffic stops. The exploration stopped here as a result of time constraints.
The % predominant race data Census_and_Counts data spread sheet originates from 2010 Census data. The traffic
stops in Table 7 represent 21.9% of the total traffic stops that occurred in the TS data set. 4 of the 12 census block
groups represented in Table 7 are predominantly white. 8 of the 12 census block groups represented in Table 7 are
predominantly black

Exploratory Analysis of GPD GIS Data - Preliminary Report January 26, 2016
7
Table 7
Traffic Stops (TS>1%) by Census block groups
Census block groups TS Frequency % of Total Stops Total Population by Census Block Group
% Predominant Race
370810108002 8531 2.9 (8531/295227) 1541 White 48.35
370810102001 6021 2.0 1535 Black 56.81
370810103002 5640 1.9 1231 Black 32.74
370810110001 5636 1.9 553 Black 82.82
370810126011 5356 1.8 1416 White 61.79
370810126012 5274 1.8 1959 White 47.47
370810126081 5270 1.8 2392 Black 47.49
370810126091 4970 1.7 2379 Black 45.73
370810171001 4634 1.6 2236 White 68.87
370810127072 4587 1.6 1547 Black 78.80
370810127071 4472 1.5 1042 Black 64.11
370810126121 4428 1.5 2459 Black 75.52
Table 8 below provides traffic stop search frequency data and percent of total search data on the top twelve
census block groups where over 1% of traffic stops occur. The table also includes percent predominant race and
total population for each census block group listed. The top three census block groups where the highest number
of traffic stops occur are 370810108002, 370810102001, 370810103002.
The % predominant race data from Census_and_Counts data spreadsheet originates from 2010 Census data. The
searches in Table 8 represent 22.4% of the total searches that represented in the TS data set. 4 of the 12 census
block groups represented in Table 8 are predominantly white. 8 of the 12 census block groups represented in Table
8 are predominantly black

Exploratory Analysis of GPD GIS Data - Preliminary Report January 26, 2016
8
Table 8
Search (TS > 1%) by Census block groups
Census block groups Search Frequency % of Total Searches Total Population by Census Block
Group
% Predominant Race
370810108002 393 3.8 (393/10317) 1541 White 48.35
370810102001 157 1.5 1535 Black 56.81
370810103002 169 1.6 1231 Black 32.74
370810110001 262 2.5 553 Black 82.82
370810126011 130 1.3 1416 White 61.79
370810126012 142 1.5 1959 White 47.47
370810126081 236 2.3 2392 Black 47.49
370810126091 138 1.3 2379 Black 45.73
370810171001 97 0.9 2236 White 68.87
370810127072 213 2.1 1547 Black 78.80
370810127071 212 2.1 1042 Black 64.11
Figure 1 below shows the census blocks (in Table 8) with highest frequencies of traffic stops.

Exploratory Analysis of GPD GIS Data - Preliminary Report January 26, 2016
9
Table 9 below provides frequency data on field interviews, crime counts, part I crime counts, calls for service,
police initiated calls for service, and citizen initiated calls for service in census block groups where over 1% of
traffics stops occur. The predominant race by census track each of the census block groups is nested inside of is
also contained in the table. Of the twelve census block groups listed in the Table 9 four census block groups have a
predominantly white population and eight census block groups have a predominantly black population.
Table 9
Count Type Field (TS > 1%) by Census block groups
Census block groups
Field Interviews
Crime Count
Part I Crime Count
Calls for Service
Police Initiated CFS
Citizen Initiated CFS
*% Predominant Race
370810108002 1217 6449 4623 102458 55939 46519 White 48.35
370810102001 195 1470 566 16786 9238 7548 Black 56.81
370810103002 681 3499 1310 46138 25104 21034 Black 32.74
370810110001 417 2455 1041 21479 10484 10995 Black 82.82
370810126011 162 1496 685 16631 8224 8407 White 61.79
370810126012 193 2113 937 19993 8359 11634 White 47.47
370810126081 792 3571 1434 26328 9885 16443 Black 47.49
370810126091 556 3157 1384 21006 8895 12111 Black 45.73
370810171001 3 91 2 6814 5853 961 White 68.87
370810127072 607 2691 1359 19651 8040 11611 Black 78.80
370810127071 359 1849 757 16106 7686 8420 Black 64.11
370810126121 372 1975 887 18582 8040 10542 Black 75.52
*From communitycommons.org by census tract
Table 10 below contains TS.xlxs spreadsheet missing data information. 2.1% of the driver ethnicity data is missing.
0.5% of the observations in the spreadsheet are coded as ethnicity “unknown”.
Table 10 Missing Basic Stop Information from Motor-Vehicle Violations
Stop Feature Missing Information
n %
Date 0 0
Time 0 0
Location 0 0
Officer could not determine
Driver race* 0 0
Driver ethnicity 6313 2.1
Driver sex 0 0
Driver age 0 0
* 1,601 observations coded "unknown" (0.5%)

Exploratory Analysis of GPD GIS Data - Preliminary Report January 26, 2016
10
Regression Models - Analysis below used data from Census_and_Counts GPD Excel File
The models in Table 11 below describe indicators for traffic stop. The data used to perform this analysis includes
total number of traffic stops for blacks and whites in specific locations (GEOID), number of field interviews and
crime counts in specific locations, and calls for service in specific locations.
Model 1 indicates that race is a positive indicator of traffics stops for blacks and a negative indicator of traffic stops
for whites. Model 1 for drivers age 18 and over indicates that race is a positive indicator of traffics stops for blacks
and a negative indicator of traffic stops for whites.
Model 2 adds the GEOID10 nonmetric indicator to Model 1 and the GEOID10 nonmetric indicator proves to be a
non-significant indicator of traffics stops when added.
Model 3 indicates that number of field interviews and number of part I crime counts are negative indicators of
traffic stops. Model 3 indicates that crime count and police initiated calls for service are positive indicators of
traffic stops. Model 3 indicates that citizen initiated calls for service is a negative indicator of traffic stops but it is
not statistically significant at p-values of 0.05 and 0.01. It should be noted here that crime count are reported
crimes. Areas with higher are policed more and officers that see activity may initiate call themselves.
Model 4 adds race to Model 3. When race is added to the model all indicators remain in the same direction as they
presented in Models 1, 2, and 3.
Table 11 Indicators (or Predictors) of Traffic Stops (TSCOUNT)
Variable Model 1 Model 1 (over age 18)
Model 2 Model 3 Model 4
Black 0.538* 0.831* 0.529* 0.041 White -.343* -0.0381* -0.348* -0.050 Location (GEOID10)
-9.365E-5
F1Count -2.817* -2.834* CrimeCount 1.832* 1.722* CrimePICount -1.212* -1.088** CFSSELFCount 0.166* 0.170* CFSCITCount -0.053 -0.049 B-value 1023.465 949.683 235.104 276.9 CFSCount was excluded from Model 3 and Model 4. CFSCount is not significant indicator for model 3 and Model 4. *= Significant at 0.05 p-value and 0.01 p-value **= Significant at only 0.05 p-value Equations like the example equation for Model 1 (over age 18) from Table 11 (Example Equation for Model 1 in Table 12 - Y (tscount)= .831(black)+ 0.0381(white)+ 949.683) may be used to model the number of traffic stops that may occur when the number of people in the population by race (black and white) are known.
The models in Table 12 below describe indicators for police initiated calls for service. The data used to perform this
analysis includes total number of traffic stops for blacks and whites in specific locations (GEOID) and number of
police initiated calls for service in specific locations. The only indicators in Table 13 that are statistically significant
at p-values 0.05 or 0.01 are the black race for age 18 and older in model 2 (over age 18) and the total population
variable in model 2 (over age 18).

Exploratory Analysis of GPD GIS Data - Preliminary Report January 26, 2016
11
Table 12 Indicators (or Predictors) of Calls for Service (CFSSELFCOUNT)
Variable Model 1 Model 2 Model 2 (over age 18) Black -0.344 5.158* White -2.390 1.974 Total Population -0.338 1.325 -2.308* B-value 2412.674 2438.299 *= Significant at 0.05 p-value and 0.01 p-value **= Significant at only 0.05 p-value
The models in Table 13 describe indicators for citizen initiated calls for service. The data used to perform this
analysis includes total number of traffic stops for blacks and whites in specific locations (GEOID) and number of
citizen initiated calls for service in specific locations. The only indicator in Table 14 that is statistically significant at
p-values 0.05 or 0.01 is the black race for age 18 and older in model 2 (over age 18).
Table 13 Indicators (or Predictors) of Calls for Service (CFSCITCOUNT)
Variable Model 1 Model 2 Model 2 (over age 18) Black -0.432 4.449* White -3.979 -0.532 Total Population 0.061 2.794 -0.529 B-value 2772.009 2929.471 *= Significant at 0.05 p-value and 0.01 p-value **= Significant at only 0.05 p-value
The models in Table 14 describe indicators for traffic stop searches. The data used to perform this analysis includes
total number of traffic stop searches, total number of traffic stops for blacks and whites in specific locations
(GEOID), number of field interviews and crime counts in specific locations, and calls for service in specific locations.
Model 1 indicates that race is a positive indicator of traffics stop searches for blacks and a negative indicator of
traffic stop searches for whites. Model 1 for drivers age 18 and over indicates that race is a positive indicator of
traffics stops for blacks and a negative indicator of traffic stops for whites.
Model 2 adds the GEOID10 nonmetric indicator to Model 1 and the GEOID10 nonmetric indicator proves to be a
non-significant indicator of traffics stop searches when added.
Model 3 indicates that number of part 1 crime count and number of citizen initiated calls for service are negative
indicators of traffic stop searches. Model 3 indicates that the number of field interviews, crime count and police
initiated calls for service are positive indicators of traffic stops.
Model 4 adds race to Model 3. When race is added to the model all indicators remain in the same direction as they
presented in Models 1, 2, and 3.

Exploratory Analysis of GPD GIS Data - Preliminary Report January 26, 2016
12
Table 14 Indicators (or Predictors) of Traffic Stop Searches (TSSEARCHCOUNT)
Variable Model 1 Model 1 (over age 18)
Model 2 Model 3 Model 4
Black 0.029* 0.043* 0.028* 0.009** White -0.021* -0.026* -0.022* -0.006** Location (GEOID10)
-4.695E-6
F1Count 0.097* 0.097* CrimeCount 0.101* 0.085* CrimePICount -0.124* -0.106* CFSSELFCount 0.005* 0.005* CFSCITCount -0.006* -0.006* B - value 39.377 37.638 5.239 8.365 *= Significant at 0.05 p-value and 0.01 p-value **= Significant at only 0.05 p-value Equations like the example equation for Model 3 from Table 14 (Example Equation for Model 3 in Table 15 - Y (tssearch)= .097(F1count)+ .101(CrimeCount)+ -.124(CrimePICount) + .005(CFSSELF Count)+ -.006(CFSCITCount)+5.239) may be used to model the number of traffic searches that may occur when the crime counts are known.
Census block groups and Context - Race Population and Poverty
When we asked the following question the researcher provided Table 16. Will disparity of traffic stops change when we consider census block groups with high percent black population and high percent white population census block groups?
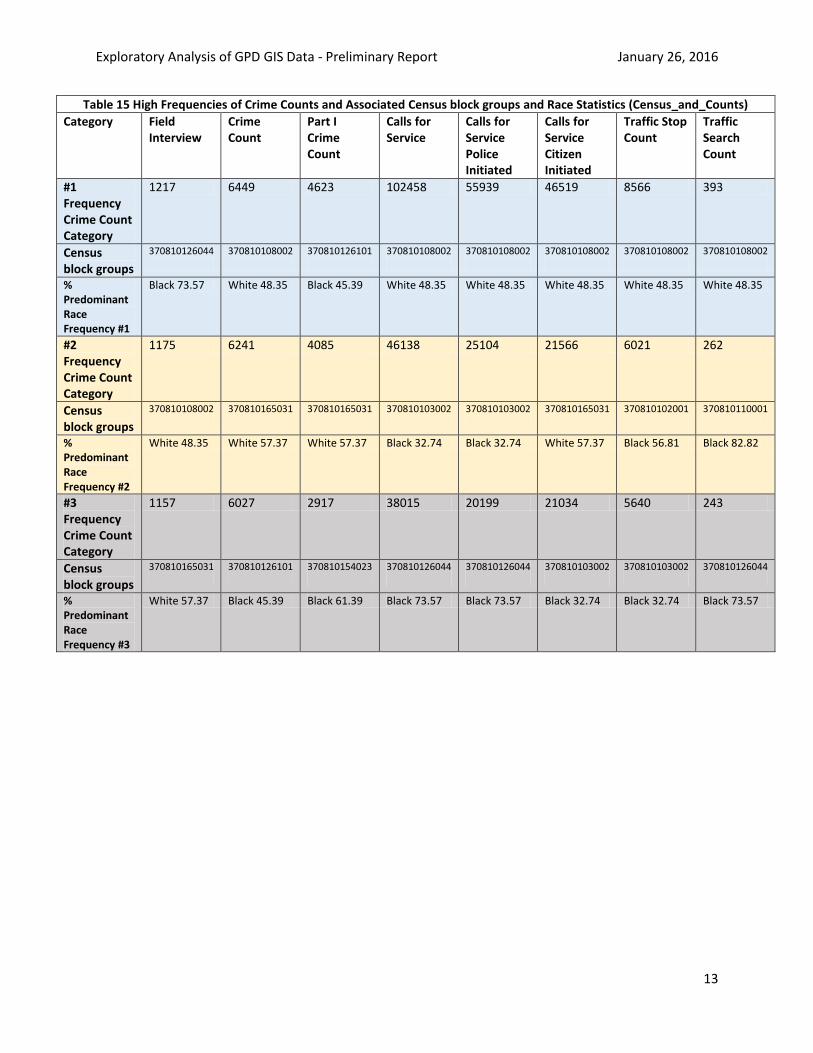
The information contained in table 15 below describes the crime counts for the three census block groups with the
highest frequencies in the crime count categories. Census block group 370810108002, which is predominantly
white, is where the highest number of crime counts, calls for service police initiated, calls for service citizen
initiated, traffic stops, and traffic searches occurred. Census block group 370810126044, which is predominately
black, is where the highest number of field interviews occurred. Census block group 370810126101, which is
predominantly black is where the highest number of crime count part I occurred. It is noted that the number of
calls for service, the number of calls for service police initiated, and the number of calls for service citizen initiated
have a percent difference between the #1 frequency and the #2 frequency categories of 55% decrease, 55%
decrease, and 54% decrease respectively.
The percent difference in traffic stops between #1 frequency category and #2 frequency category 30% decrease.
Census block group 370810108002, which is predominantly white, is where the highest number of traffic stops
occurred. Census block group 370810102001, which is predominantly black, is where the second highest number
of traffic stops occurred. Census block group 370810103002, which is predominantly black, is where the third
highest number of traffic stops occurred.
Census block group 370810108002, which is predominantly white, is where the highest number of traffic searches
occurred. Census block group 370810110001, which is predominantly black, is where the second highest number
of traffic searches occurred. Census block group 370810126044, which is predominantly black, is where the third
highest number of traffic searches occurred.
Exploratory Analysis of GPD GIS Data - Preliminary Report January 26, 2016
13
Table 15 High Frequencies of Crime Counts and Associated Census block groups and Race Statistics (Census_and_Counts)
Category Field Interview
Crime Count
Part I Crime Count
Calls for Service
Calls for Service Police Initiated
Calls for Service Citizen Initiated
Traffic Stop Count
Traffic Search Count
#1 Frequency Crime Count Category
1217 6449 4623 102458 55939 46519 8566 393
Census block groups
370810126044
370810108002
370810126101
370810108002
370810108002
370810108002
370810108002
370810108002
% Predominant Race Frequency #1
Black 73.57 White 48.35 Black 45.39 White 48.35 White 48.35 White 48.35 White 48.35 White 48.35
#2 Frequency Crime Count Category
1175 6241 4085 46138 25104 21566 6021 262
Census block groups
370810108002
370810165031
370810165031
370810103002
370810103002
370810165031
370810102001
370810110001
% Predominant Race Frequency #2
White 48.35 White 57.37 White 57.37 Black 32.74 Black 32.74 White 57.37 Black 56.81 Black 82.82
#3 Frequency Crime Count Category
1157 6027 2917 38015 20199 21034 5640 243
Census block groups
370810165031
370810126101
370810154023
370810126044
370810126044
370810103002
370810103002
370810126044
% Predominant Race Frequency #3
White 57.37 Black 45.39 Black 61.39 Black 73.57 Black 73.57 Black 32.74 Black 32.74 Black 73.57

Exploratory Analysis of GPD GIS Data - Preliminary Report January 26, 2016
14
Figure 2, Figure 3, and Figure 4 below shows the location of the census blocks (in Table 15) with high frequency
crime counts.

Exploratory Analysis of GPD GIS Data - Preliminary Report January 26, 2016
15

Exploratory Analysis of GPD GIS Data - Preliminary Report January 26, 2016
16

Exploratory Analysis of GPD GIS Data - Preliminary Report January 26, 2016
17
When asked the following question the researcher developed Table 16. What does the poverty data look like in the census block groups with the highest crime counts? Poverty statistics for 2010 Census were researched using the Community Commons website. Data and maps at Community Commons are provided as a community service by Center for Applied Research and Environmental Systems (CARES). The census block groups with the highest frequency of traffic stops and searches is nested within a census tract where 25.48 percent of the total population lives below the poverty line. The census block groups with the second highest frequency of traffic stops is nested within a census tract where 35.65 percent of the total population lives below the poverty line. The census block groups with the second highest frequency of traffic searches is nested within a census tract where 41.11 percent of the total population live below the poverty line. The census block groups with the third highest frequency of traffic stops is nested within a census tract where 33.16 percent of the total population live below the poverty line. The census block groups with the third highest frequency of traffic searches is nested within a census tract where 18.56 percent of the total population live below the poverty line.
Table 16 High Frequencies of Crime Counts and Associated Census block groups and Poverty Statistics (Census_and_Counts)
Category Field Interview
Crime Count
Part I Crime Count
Calls for Service
Calls for Service Police Initiated
Calls for Service Citizen Initiated
Traffic Stop Count
Traffic Search Count
#1 Frequency Crime Count Category
1217 6449 4623 102458 55939 46519 8566 393
Census block groups
370810126044
370810108002
370810126101
370810108002
370810108002
370810108002
370810108002
370810108002
*% Below Poverty Level Frequency #1
18.56 25.48 32.24 25.48 25.48 25.48 25.48 25.48
#2 Frequency Crime Count Category
1175 6241 4085 46138 25104 21566 6021 262
Census block groups
370810108002
370810165031
370810165031
370810103002
370810103002
370810165031
370810102001
370810110001
*% Below Poverty Level Frequency #2
25.48 9.38 9.38 33.16 33.16 9.38 35.65 41.11
#3 Frequency Crime Count Category
1157 6027 2917 38015 20199 21034 5640 243
Census block groups
370810165031
370810126101
370810154023
370810126044
370810126044
370810103002
370810103002
370810126044
*% Below Poverty Level Frequency #3
9.38 32.24 3.75 18.56 18.56 33.16 33.16 18.56
*Poverty Statistics from communitycommons.org by census tract that the census block groups is nested within

Exploratory Analysis of GPD GIS Data - Preliminary Report January 26, 2016
18
Figure 5, Figure 6, and Figure 7 below shows the location of the census blocks (in Table 16) with high frequency
crime counts.

Exploratory Analysis of GPD GIS Data - Preliminary Report January 26, 2016
19

Exploratory Analysis of GPD GIS Data - Preliminary Report January 26, 2016
20
Exploratory Analysis of GPD GIS Data - Preliminary Report January 26, 2016
21
Summary of Findings
This exploration of the TS and Census GPD GIS data files is preliminary and not exhaustive. Gender data
demonstrate that males are stopped more than females. Race data demonstrate that blacks are stopped at a
higher percentage than whites. Looking at the TS data by stop violation categories demonstrate that percentage of
whites is higher than percentage of blacks for DWI and SLV stop violations. Stop violation categories where
percentage of blacks is higher than percentage of whites include INV, OT, SAFE, STBL, STPL, VEV, and VRV.
Within the category of persons searched, blacks were searched at a higher percentage (41.3% difference) than
whites.
The data for consent search category (Srchtyp1) demonstrate of all the potential consent searches that 1.82
percent of blacks have a consent search performed while 0.77 percent of whites have a consent search performed.
The highest search base categories (Srchbas) for blacks are erratic/suspicious behavior, observation of suspected
contraband, and other official information. The highest search base category for whites is erratic/suspicious
behavior.
PVsrch data demonstrate that of all vehicles searched 69.9 percent of drivers are black and 28.6 percent of drivers
are white. The data demonstrate that of all drivers searched 70.2 percent of drivers are black and 28.3 percent of
drivers are white.
Some regression models may include variables that indicate the number of traffic stops and traffic searches to be expected. For example, equations like the example equation for Model 1 (over age 18) from Table 11 (Example Equation for Model 1 in Table 12 - Y (tscount)= .831(black)+ 0.0381(white)+ 949.683) may be used to model the number of traffic stops that may occur when the number of people in the population by race (black and white) are known. The models should be tested. The top three census block groups where the highest number of traffic stops occur are 370810108002
(predominantly white census block group), 370810102001 (predominantly black census block group),
370810103002 (predominantly black census block group).
The census block groups with the highest frequency of traffic stops and searches is nested within a census tract
where 25.48 percent of the total population lives below the poverty line. The census block groups with the second
highest frequency of traffic stops is nested within a census tract where 35.65 percent of the total population lives
below the poverty line. The census block groups with the second highest frequency of traffic searches is nested
within a census tract where 41.11 percent of the total population live below the poverty line. The census block
groups with the third highest frequency of traffic stops is nested within a census tract where 33.16 percent of the
total population live below the poverty line. The census block groups with the third highest frequency of traffic
searches is nested within a census tract where 18.56 percent of the total population live below the poverty line.
Implicit Bias Greensboro Police Department Traffic Stop Practices, Policies, Greensboro Police Department
Organizational Culture and Community Relations – Policy and Practice Discussion and Implications
The mission of the Greensboro Police Department is “Partnering to Fight Crime for a Safer Greensboro”. It is our
understanding that the self-study being conducted by GPD may be used to inform their internal discussions around
the impact organizational culture may have on community perceptions of GPD as well as to inform conversations
between GPD and the Greensboro community. This proactive approach, while it may be prompted by national
level issues between the communities and police departments under scrutiny because of the real situations that
have occurred where individual police officers have inappropriately used their power and influence to intentionally
harm and in some cases murder citizens, should be recognized and perhaps modeled by other police departments
charged to serve and protect their communities.

Exploratory Analysis of GPD GIS Data - Preliminary Report January 26, 2016
22
Upon consideration of the historical race issues in the Southeast United States coupled with historical race issues specific to the state of North Carolina and the city of Greensboro the lens through which we examine the actions of the Greensboro Police Department must include the arm of institutional racism that exists. For example, we know that ordinances developed over a hundred years ago continue to dictate the communities where blacks live and whites live in the city of Greensboro (Chafe, 1980). Parallel to the historical context of racism we must also consider the heightened awareness that programs and policy have brought to the issue of racism in a manner to expose and address the potential issues associated with implicit bias (COPS, 2014; Weisel, 2012). There are multiple societal factors at work that create the environment and conversation around each individual’s perception of the GPD and their actions in creating a safe environment.
While the court system, prison system, and police departments are three arms of the criminal justice system, there is a fourth arm that must be integrated into the conversation. This fourth arm is the citizens and the community that the citizens create. Solution-focused forums on building trust between law enforcement and the communities they serve is a national trend that deserves attention (COPS, 2014). We hope that sharing the information contained in this report with inter-departmental staff that have influence over departmental practices and policies in a manner that they can use this information to inform their decisions is helpful and meaningful. We also hope that the information contained in this report will lead to focused communications and collaborations with citizens in the communities that appear to be most affected in a manner that leads to understanding and solution-focused approaches.
There is some thought that as a result of advances in data collection and statistical methods that when these
methods are applied to study racial bias and traffic stops, there is enough support for a legal rule. The conclusions
drawn legal researchers are that strong statistical associations in well-developed studies should constitute first
impression evidence as sufficient to prove discriminatory intent (Whitney, 2008). This kind of thinking establishes
the importance that GPD continue in the work of examining organizational practices. This kind of thinking also
requires GPD to study the context within which the department exists and to communicate and collaborate with
the Greensboro community by sharing information and searching for meaningful solutions. Perhaps the census
block groups and the tracts within which they are nested which have the highest frequency counts for traffic stops
and traffic searches may be a starting place for conversations around the issue of traffic stops. This leads us to
question: What kinds of data do we need to collect to answer questions around traffics stops and implicit bias?
Implicit Bias, Data Collection, and Language – Poverty, Additional Variables and the Conversation:
Recommendations for Further Research
We know that when a traffic stop occurs if we assume that race is a factor in the traffic stop we must also consider
that officers are making an assumption of the driver’s race. The default position is bias, what other factors that we
do not know need to be considered before concluding bias? Questions that arose during discussions about this
exploratory analysis present avenues for further research, especially in the areas of organizational policy,
organizational culture, and community understanding and relationship building.
Organizational Policy and Organizational Culture Related Questions
Are all traffic stops reported? Perhaps there are some that aren't, and are given informal warnings.
In order to make comparisons and design quasi-experiments we need to collect data on variables such as licenses
by age, race, and ethnicity in the city. Additionally, baseline or known expectation of the demographics of drivers
at any given time on the road in Greensboro in unknown.
Are there specific behaviors that put certain drivers at greater risk of being stopped? For example, when examining
the traffic stops and types of violations drivers are stopped for the data demonstrates that for VEV and VRV black
are stopped more frequently than whites (Table 2). In this example lies the question of whether these stops are
related to economics and poverty. What additional lens do we need to examine this information through in
addition to bias? Economics? Poverty?
Exploratory Analysis of GPD GIS Data - Preliminary Report January 26, 2016
23
Regarding regression Table 12 - Why did the addition of crime counts to the model change the factor for race
particularly for blacks? How might citizens perception of safety be different for part I crimes than for other crimes.
All part I crimes are in some manner reported to the media. Burglary and auto thefts make the news however,
certain property crimes such as larceny (e.g. shop-lifting and larceny from automobile) which are reported more
frequently do not make the news. Perhaps this is a place explore further in future studies as well as in inter-
departmental conversations.
What additional approaches to analyzing this data may lend itself to the discussion of traffic stops and racial bias in
a manner that is productive and provides an opportunity to address the issues that may exist in
departmental/organizational culture and in the preparation of cadets in the police academy?
How to tease out the amount of time spent on the road: just because blacks are 40 percent of the population and
whites are 47 percent does not mean they have the same proportion of licenses, minutes on the road, similar
times on the road, etc. What variable could we use to determine this?
Timeline/benchmarking and establish points where traffic stop data process has been established in November
2015. Behavior and kind of traffic stops changed in November 2015. Traffic stops proportion by equipment
violation should decrease significantly post November 2015.
Should other types of searches be considered? Is there a way to categorize searches as high discretion searches/ low discretion searches?
Community Understanding and Relationship Building Related Questions
When applied to studies of police departments in Cincinnati, OH and Syracuse, NY, the veil of darkness method
determined that there was no racial disparity in traffic stops (Ridgeway, 2009’ Worden, McLean, & Wheeler, 2012).
Perhaps a time series analysis that looks at other reasons why veil of darkness is significant in the opposite
direction, such as season may shed light on how this experimental design lends itself to the implicit bias
conversation.
Has anyone actually tested whether the veil of darkness actually exists? That is, if night reduces the officer's ability
to distinguish race prior to a stop? Maybe black/white is distinguishable, but not Hispanic, Asian, etc. What about
other signals, such as tattoos, dress, etc.? Does the undercover nature of the veil of darkness offer police less
scrutiny from passers-by, so they feel more comfortable racially profiling? Does the veil of darkness trigger officer
fear responses more; people seem more suspicious at night?
Why is the veil of darkness study run on stops, rather than searches? This analysis suggests searches are more
biased than stops. Perhaps because searches occur after an officer knows the race, but might be interesting to look
at.
Perhaps one experimental design model could examine the types of work that people are traveling to/from at
given times (e.g. shift work vs 9-5). This might confound factors such as SES/race.
Disparity in traffic stops started to increase in 2008 (Baumgartner). What was occurring in 2008? Equipment and
regulatory violations, economy tanked around 2008. How does poverty inform this discussion?
Why is there more disparity in searches than stops? Is there something inherent in searches that contributes to one race being searched more than another race? Is there something occurring in the traffic stop that occurs more with certain races than others? What are the underlying causes of the searches and how can we address these causes?

Exploratory Analysis of GPD GIS Data - Preliminary Report January 26, 2016
24
References
Barumgartner, F.R., Epp, D.A., Love, B. (2014). Police Searches of Black and White Motorists. University of North
Carolina – Chapel Hill: Department of Political Science.
Chafe, W.H. (1981). Civilities and Civil Rights: Greensboro, North Carolina, and the Black Struggle for Freedom.
Oxford Press: New York.
Community Commons (2010). http://www.communitycommons.org/maps-data/
COPS (2014). Strengthening the relationship between law enforcement and communities of color: Developing an
Agenda for Action. The Office of Community Oriented Policing Services: Department of Justice.
http://trustandjustice.org/resources/guide/strengthening-the-relationship-between-law-enforcement-and-
communities
Ridgeway, G. (2009). Cincinnati Police Department Traffic Stops: Applying RAND’s Framework to Analyze Racial
Disparities. RAND Corporation: Santa Monica CA.
Weisel, D.L. (). Racial and ethnic disparity in traffic stops in North Carolina, 2000-2011: Examining the evidence.
North Carolina Central University.
Whitney, M. (2008). The statistical evidence of racial profiling in traffic stops and searches: Rethinking the use of
statistics to prove discriminatory intent. Boston Law Review. 49(263).
Worden, R.E., McLean, S.J., Wheeler, A.P. (2012). Testing for racial profiling with the veil-of-darkness method.
Police Quarterly. 15(1) 92-111.