exploration production refining … is now poised to overtake germany as the largest automotive...
TRANSCRIPT

SIBIR ENERGY PLCANNUAL REPORT & ACCOUNTSFOR THE YEAR ENDED 31DECEMBER 2007
EXPLORATIONPRODUCTION REFINING MARKETING
SIBIR ENERGY PLC
104946 Sibir07_covers_AW 27/6/08 10:33 am Page 1

SIBIR ENERGY PLC EXPLORATION, PRODUCTION, REFINING, MARKETING
DRILLING RIGS AT THE SALYM OIL FIELDS IN WESTERN SIBERIA
RUSSIAN AND INTERNATIONAL
104946 Sibir07_covers_AW 27/6/08 10:34 am Page 2
BUSINESS IN HARMONY2007 HighlightsReport of the Chairman and Chief ExecutiveOperations ReviewFinancial ReviewBoard of DirectorsThe Workings of the Board and its CommitteesRemuneration ReportDirectors’ ReportStatement of Directors’ Responsibilities for the GroupIndependent Auditors’ Report for the Group
126
20283032343738
Consolidated Group Income StatementConsolidated Group Balance SheetStatement of Changes in Shareholders’ EquityConsolidated Group Cash Flow StatementNotes to the Consolidated Financial StatementsStatement of Directors’ Responsibilities for the CompanyIndependent Auditors’ Report for the CompanyCompany Balance SheetNotes to the Company Financial StatementsCorporate Directory
394041424389909192
102
1 SIBIR ENERGY PLC EXPLORATION, PRODUCTION, REFINING, MARKETING
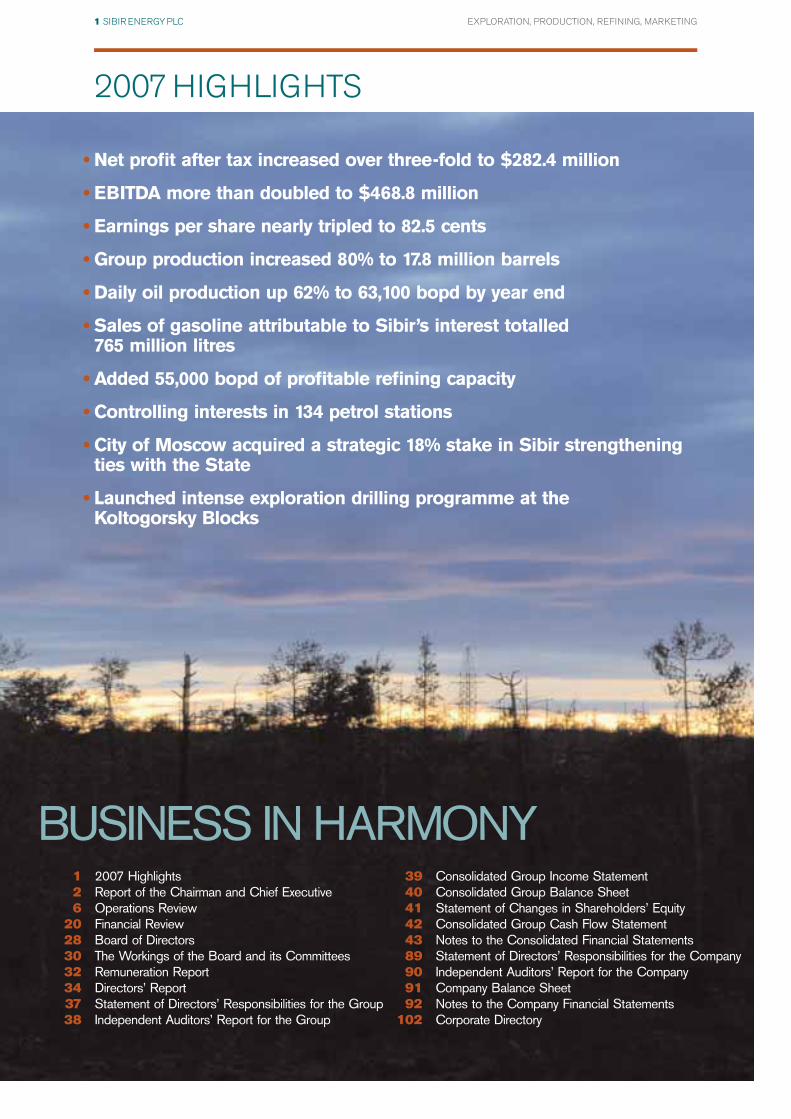
2007 HIGHLIGHTS
• Net profit after tax increased over three-fold to $282.4 million
• EBITDA more than doubled to $468.8 million
• Earnings per share nearly tripled to 82.5 cents
• Group production increased 80% to 17.8 million barrels
• Daily oil production up 62% to 63,100 bopd by year end
• Sales of gasoline attributable to Sibir’s interest totalled 765 million litres
• Added 55,000 bopd of profitable refining capacity
• Controlling interests in 134 petrol stations
• City of Moscow acquired a strategic 18% stake in Sibir strengthening ties with the State
• Launched intense exploration drilling programme at the Koltogorsky Blocks

2 SIBIR ENERGY PLC EXPLORATION, PRODUCTION, REFINING, MARKETING
REPORT OF THE CHAIRMAN AND CHIEF EXECUTIVE
GETTING THEFUNDAMENTALSRIGHT

The importance of this development was two fold:
First, we aligned the interests of the Russian Federation and the
other shareholders in Sibir through shared ownership of Sibir,
an essential move in a world where resource nationalism has
gained momentum.
Second, we increased the extent to which our vertically integrated
company participates in the full value chain of the sector – from well
head to gasoline pump. With 100,000 barrels a day of refining
capacity at Moscow Refinery, Sibir now holds an enviable position in
the fastest growing and most dynamic fuels markets in Europe. The
City of Moscow and the Moscow Region has a combined population
of 17 million, making it the largest metropolitan area on the continent
of Europe. Russia is now poised to overtake Germany as the largest
automotive market in Europe, something that looked a remote
possibility only a handful of years ago.
One challenge remained, namely that strained relations with fellow
shareholders at Moscow Refinery created some anxiety in the
financial markets as to our ability to maintain our position there.
We expressed our aspirations and confidence that we would find
a way to operate the Refinery without shareholder controversy. We
confidently predict that we are days away from announcing that the
security of our position at the Moscow Refinery will be well and
truly established in an equitable and evergreen fashion. Together
with Gazprom Neft, the oil subsidiary of state owned Gazprom, the
world’s largest gas company, we will agree to operate the Refinery
on a parity basis and through an independent management team of
industry experts. Any agreement entered into will have a binding
mechanism, independent of shareholders, to deal with deadlock
issues should they arise.
Partnering with majors has been a hallmark of Sibir and being
able to add Gazprom Neft to the list of our existing partners – Shell,
TNK-BP and the City of Moscow – is a formidable achievement for
your company.
We believe the positive spirit and the professionalism of the
negotiations with Gazprom Neft and recent announcements by
the Russian government about reductions in Mineral Extraction
Taxes for oil production, the lowering of export duties on certain
refined products, coupled with the overall growth rate of the Russian
economy have confirmed our optimism in Russia’s long-term
prospects and the opportunities that they provide for Sibir’s continued
development.
In our view, the investment environment in Russia for Sibir has never
been more stable or predictable. One of the fundamentals by now
must be clear to all. The Russian government wants to see Russian
control over its natural resources through state owned companies or
Russian owned entities. Sibir anticipated these developments many
years ago and has intentionally pursued a strategy of majority
Russian ownership. In 2007 we have strengthened our position in
this regard by bringing in an important arm of the Russian State,
namely the City of Moscow, as a strategic shareholder bringing the
total number of Sibir shares in Russian hands to 67% on a fully
diluted basis. As our growth over the years has shown, this is a
strategy which has worked and we believe it will continue so to do.
With the development of Salym in full swing, and as a sign of our
confidence, we embarked upon our quest for replacement reserves.
In March 2007 we acquired our first exploration asset – the eight
Koltogorsky Exploration blocks – and launched an intensive
exploration drilling programme to be completed by the end of 2008,
3 SIBIR ENERGY PLC EXPLORATION, PRODUCTION, REFINING, MARKETING
In September 2007 when we last reported to you we wrote about the importanceof the City of Moscow becoming a strategic shareholder in Sibir as a result ofSibir acquiring 100% of Moscow Oil and Gas Company (“MOGC”). The predictedbenefits from this development have continued to accrue as the Sibir shareincreased 37% in value from £5.11p on the day before the announcement of the deal to over £7 as we go to press.
CHAIRMAN MR. WILLIAM GUINNESS CHIEF EXECUTIVE MR. HENRY CAMERON
weather permitting. To date, 3 of the 8 wells have been drilled and
we are encouraged that the wells drilled so far have encountered
hydrocarbon-bearing sands.
When we completed the MOGC deal, we agreed with the City of
Moscow that we would undertake, on a best endeavours basis, to
seek admission of Sibir’s shares to the Official List of the London
Stock Exchange. We are taking all necessary steps to complete this
move by the end of 2008. However, there are certain opportunities
that your company is pursuing that may delay this move to the first
half of 2009. In either case, the move to the Official List is a top
priority of your management and will be completed in the earliest
timeframe possible.
We declared our maiden dividend in August last year and re-stated
our commitment to pursue a robust and regular dividend policy.
To achieve this, we are engaged in a restructuring of the Group
designed to facilitate this policy. Further announcements can be
expected after publication of our half year interim report in
September.
Production Performance
Upstream production in 2007 rose 80% to a record high of
17.8 million barrels with 15.3 million barrels contributed by SPD and
2.5 million barrels coming from Magma’s upstream unit. The Group’s
total daily production rate closed the year at 63,100 barrels of oil per
day (bopd), an increase of over 60% compared to year-end 2006
production of 38,900 bopd.
In the downstream sector the Moscow Refinery processed 72.9
million barrels of crude in 2007. Sibir’s share of barrels refined
averaged 58,630 bopd, as our tolling quota increased from 45,000
bopd to 100,000 bopd following the completion of the MOGC
acquisition. Sibir’s portfolio of three retail fuel networks in Moscow and
the Moscow Region sold over 1.5 billion litres of gasoline and diesel.
Approximately 765 million litres of this is attributable to Sibir’s interest.
Financial Performance
Sibir presents its 2007 accounts in US dollars as Sibir’s primary
commercial activities, the sale of oil and oil products, are dollar
denominated. This will minimise the effect of currency fluctuations of
the US dollar versus the British pound and thus more accurately
reflect the true operating performance of our business.
This is the first time that we present our accounts in accordance with
International Financial Reporting Standards (IFRS) in compliance with
London Stock Exchange regulations.
2007 was the year when Sibir’s long held aspirations were realised
in hard production and financial numbers. These include record
results in profits and cash flow created by robust production growth
at Salym, strong downstream trading margins from both our refining
and retail operations, and rising crude prices. In addition, our refining
operations at Moscow Refinery increased in volume in the fourth
quarter of 2007 following our MOGC acquisition. This breakthrough
performance is the harvest of many years of investment and industry
and, as we complete 10 years of a Chairman and Chief Executive
team innings, you can well imagine our pleasure in reporting to you.
4 SIBIR ENERGY PLC EXPLORATION, PRODUCTION, REFINING, MARKETING
REPORT OF THE CHAIRMAN AND CHIEF EXECUTIVE (CONTINUED)
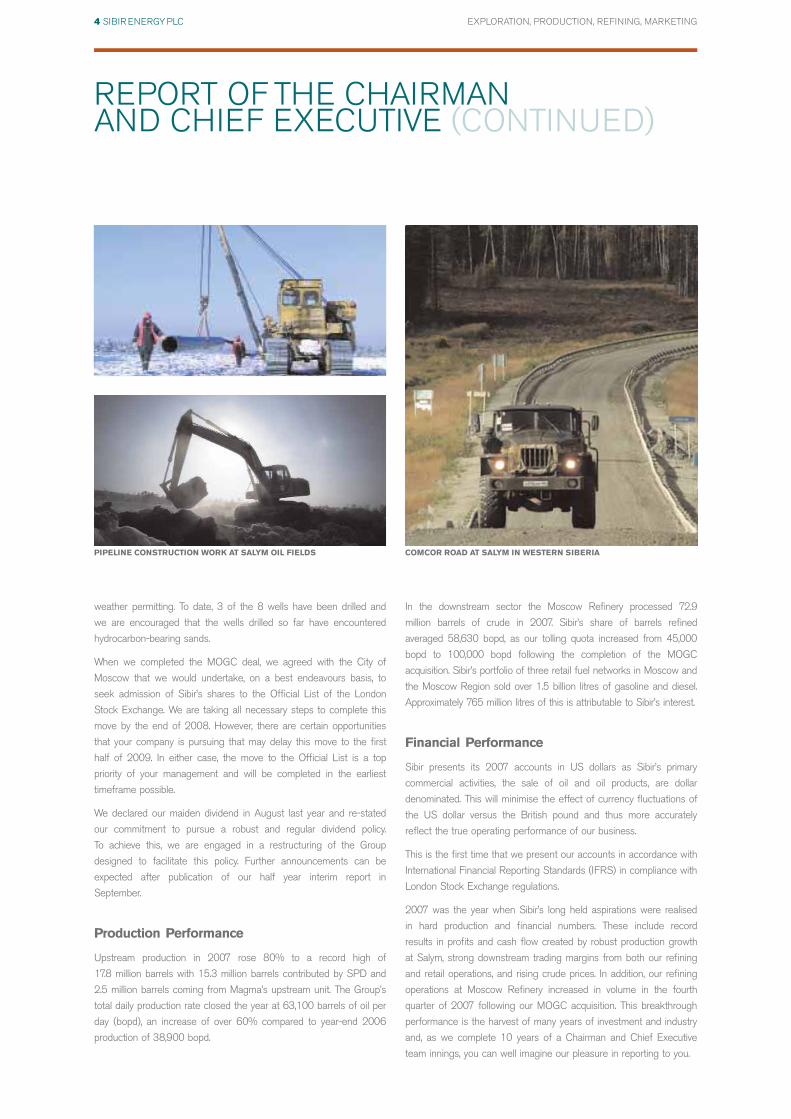
COMCOR ROAD AT SALYM IN WESTERN SIBERIAPIPELINE CONSTRUCTION WORK AT SALYM OIL FIELDS
Earnings contributions from our upstream operations at Magma and
Salym grew over 255% to $249.6 million bolstered by growing
production, strong oil prices and the realisation of income which
had been deferred for accounting reasons. Downstream oil products
trading, retail and refining operations contributed an additional
$148.5 million, a 84% increase over 2006 as we took full advantage
of our increased quota at the Moscow Refinery and enjoyed strong
wholesale and retail refined products margins.
In September, we advised that after years of containing general and
administrative costs, we expected them to increase. We draw your
attention to the Financial Review where you will find an analysis of
these costs. You will appreciate our growth comes at a cost but
we have embarked upon a course of pruning and expect to make
reductions through economies of scale in the second half of 2008.
The net results of these significant developments is that EBITDA more
than doubled to $468.8 million and Net Profit after Tax grew 217% to
$282.4 million compared to $89.0 million in net profit in 2006.
Earnings per Share increased by 169% to 82.5 cents compared to
30.6 cents in 2006.
Legacy Issue
Over time we have had to crave your indulgence in terms of the time
it was taking to pursue restitution of our losses following the dilution
of our interest in Sibneft Yugra. This matter is now being pursued by
a Provisional Liquidator of Yugraneft (the subsidiary of Sibir which
held the Sibneft Yugra interest) appointed by the High Court in
England. Preliminary pleadings essentially on issues of whether the
English Courts have jurisdiction over the defenders and the efficacy
of the appointment of the Provisional Liquidator, are to be heard over
the two weeks beginning 7 July, 2008. We shall report the outcome
of these preliminary issues as and when they are reported by the
Provisional Liquidator.
Looking Forward
In September 2007 we wrote in general terms of ambitious plans to
double the size of the company in 18 months. In the same general
way we are pleased to report that these plans to materially increase
the size of your company remain on track save only that if the plan
does materialise, it is likely to be sooner than later and well within
the earlier 18 month forecast.
None of Sibir’s recent achievements or future plans would be
possible without the extraordinary and ordinary contribution of the
people who show up to work every day to make Sibir’s business a
success. A number of them are being groomed to carry on the work
of the last 10 years, thereby ensuring seamless succession. Sibir is a
young company, an energetic company and its people enthusiastically
embrace the opportunities around them in the new Russia. They are
a good sign that Sibir’s best days are still ahead.
5 SIBIR ENERGY PLC EXPLORATION, PRODUCTION, REFINING, MARKETING
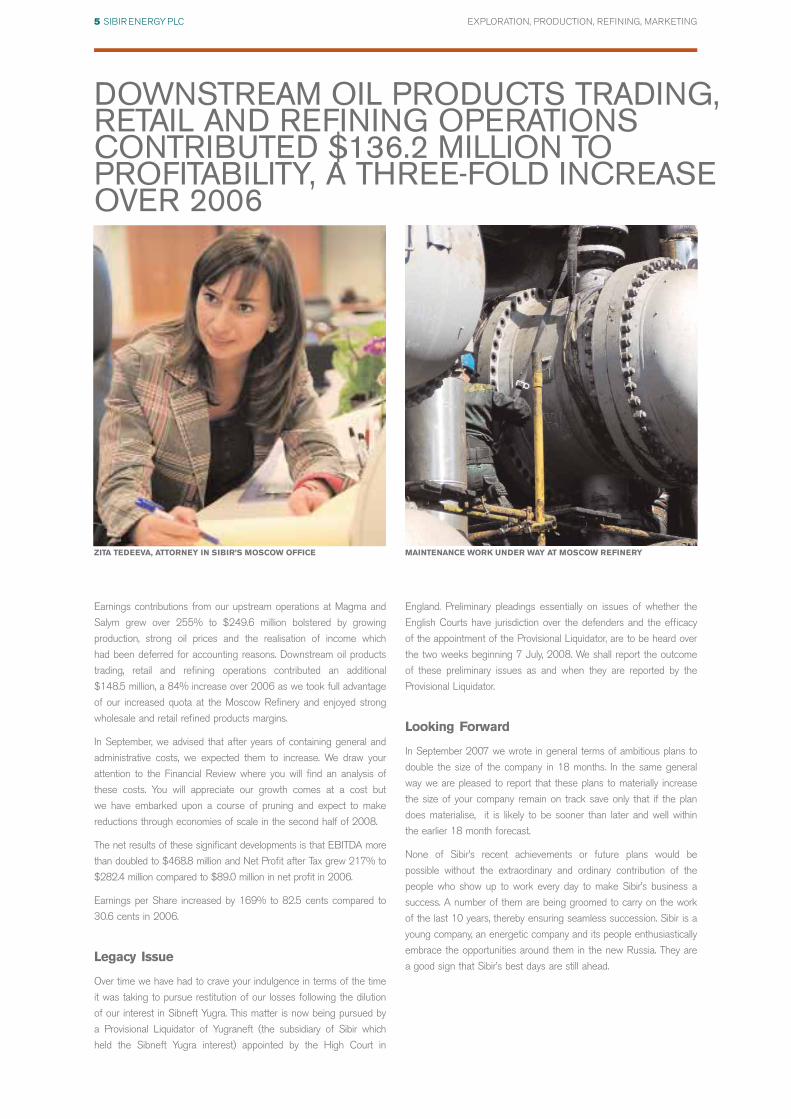
DOWNSTREAM OIL PRODUCTS TRADING,RETAIL AND REFINING OPERATIONSCONTRIBUTED $136.2 MILLION TOPROFITABILITY, A THREE-FOLD INCREASEOVER 2006
ZITA TEDEEVA, ATTORNEY IN SIBIR’S MOSCOW OFFICE MAINTENANCE WORK UNDER WAY AT MOSCOW REFINERY

6 SIBIR ENERGY PLC EXPLORATION, PRODUCTION, REFINING, MARKETING
OPERATIONS REVIEW
UPSTREAM:• SALYM DAILY PRODUCTION UP 77%TO 113,000 BOPD
• 45 MW GAS POWER PLANTCOMMISSIONED
• THREE EXPLORATION WELLSDRILLED AT KOLTOGORSKY BLOCKS
DOWNSTREAM:• MOGC ACQUISITION A LANDMARKEVENT IN THE HISTORY OF SIBIR
• MOSCOW REFINERY PROCESSED 72.9 MILLION BARRELS
• RETAIL SALES VOLUMES EXCEED 750 MILLION LITRES
CENTRAL PROCESSING FACILITIES AT SALYM OIL FIELDS IN WESTERN SIBERIA

7 SIBIR ENERGY PLC EXPLORATION, PRODUCTION, REFINING, MARKETING
STRONGPRODUCTIONGROWTH

The Group’s daily production, at year end, grew 62% to 63,143
barrels of oil per day (bopd) up from 38,901 bopd at the close of
2006 due to continued strong production growth at Salym.
SPD and Magma made significant investments to increase utilisation
of gas associated with oil production which would otherwise be
flared wastefully. A 45MW Power Generation Plant was constructed
at Salym and is now fully operational, providing 65% of the field’s
long-term electricity needs. In 2007 a wet gas pipe line for sale of
gas to Sibur/Gazprom will allow for cessation of associated gas
flaring at Yuzhnoye and Orekhovskoye fields and will be completed
by the end of 2008.
In the spring of 2007 Sibir took its first major steps into exploration
with the acquisition of eight exploration licences, known collectively
as the Koltogorsky blocks, in the Khanty-Mansiysk District of
Western Siberia. By the end of 2007 the first of eight exploration
wells had already been drilled and six exploration rigs had been
contracted to carry out an aggressive exploration drilling program in
2008. The Koltogorsky project is now one of the leading exploration
programmes in the region. With its proximity to the Yuzhnoye and
Orekhovskoye fields, the exploration program is operated by Magma,
resulting in many economies of scale.
Capital and Exploration Expense
The Group’s upstream capital expenditure for 2007 totalled $191.7
million of which $172.4 million was attributable to Sibir’s share of
capex in the Salym fields and $19.3 million was invested at Magma’s
Yuzhnoye and Orekhovskoye fields. Exploration expenditure in 2007
for the Koltogorsky blocks totalled $9.8 million.
The Group’s upstream capital expenditure in 2008 is expected to
total $164.5 million, with $128.7 million attributable to Sibir’s share
8 SIBIR ENERGY PLC EXPLORATION, PRODUCTION, REFINING, MARKETING
UPSTREAM OPERATIONS REVIEWSibir enjoyed excellent performance across its entire upstream asset portfolioas Group production rose 80% to 17.8 million barrels. Of the total, 15.3 millionbarrels was produced by Salym Petroleum Development (SPD), Sibir’s 50:50joint venture with Shell which operates the Salym oil fields in the KhantyMansiysk District of Western Siberia, and the remainder was produced bySibir’s subsidiary, Magma, which operates the Yuzhnoye and Orekhovskoyefields in the same region. Total Group production is expected to reach 25 million barrels in 2008.
OPERATIONS REVIEW (CONTINUED)
WIM VAN BEERS, SENIOR WELL ENGINEER AT SALYM PETROLEUM DEVELOPMENT
of capex in the Salym fields and $35.8 million attributed to the
Yuzhnoye ($9.6 million) and Orekhovskoye ($26.2 million) oil fields.
2008 exploration expenditure for the Koltogorsky blocks is expected
to total $69.8 million, while SPD’s exploration at Salym attributable to
Sibir is $7.5 million. Sibir share of abandonment expenditures in the
Salym fields will be $2.2 million.
Operating Environment
Operations at all operating units were significantly hampered by
remarkably mild and short winters, resulting in record high flood-
waters in the swamp-like fields of western Siberia in 2007 and
2008. Changes in the Federal permitting process for construction
and development likewise led to delays in the development of the
Orekhovskoye oil field. The experience of the past several years
suggests these mild weather conditions could become a permanent
feature of the operating environment in Western Siberia and future
operations plans will have to take this into account.
Despite these climatic and administrative challenges, Sibir’s
upstream team delivered impressive production results and laid the
groundwork for continued growth in the future as the following
detailed report shows.
Magma Oil Company
Magma (95% Sibir owned) is the operator of the Koltogorsky
Exploration Blocks on behalf of the wholly owned Sibir subsidiary
licencee and is also the licence holder and operator of the Yuzhnoye
and Orekhovskoye oil fields in Khanty-Mansiysk District of West
Siberia. Magma’s operations in 2007 focused primarily on
development of the Orekhovskoye field and the exploration of the
Koltogorsky resource.
Koltogorsky Exploration Blocks
The Koltogorsky exploration blocks cover 2,100 square kilometres
and are located some 200 kilometres northeast of Nizhnevartovsk,
Magma’s operation base. The licence area comprises a syncline
structure and is surrounded by developed oil fields including the giant
Samotlor oil field some 70 kilometres to the west. In accordance with
Russian GKZ categorisation the Blocks are estimated to contain a
total of 970 million barrels of Russian category C3 oil resources.
These estimates are based on the interpretation of 2,574 kilometres
of 2D seismic profiles. In total, some 34 structures thought to bear
hydrocarbons have been identified by the seismic profile
interpretations.
The Blocks feature excellent available infrastructure including a
Transneft oil pipe line, a Sibur wet gas pipe line, as well as paved
roads and power lines passing through the licence area. This
should limit eventual capex outlays and lead to earlier production
should the exploration program be successful and move to the
development stage.
The Koltogorsky exploration licences require Sibir to drill and test
eight wells (one per block) and acquire an additional 180 kilometres
of 2D seismic profiles by the end of February, 2009. Should the
exploration program be successful, Sibir will apply for an extension
9 SIBIR ENERGY PLC EXPLORATION, PRODUCTION, REFINING, MARKETING
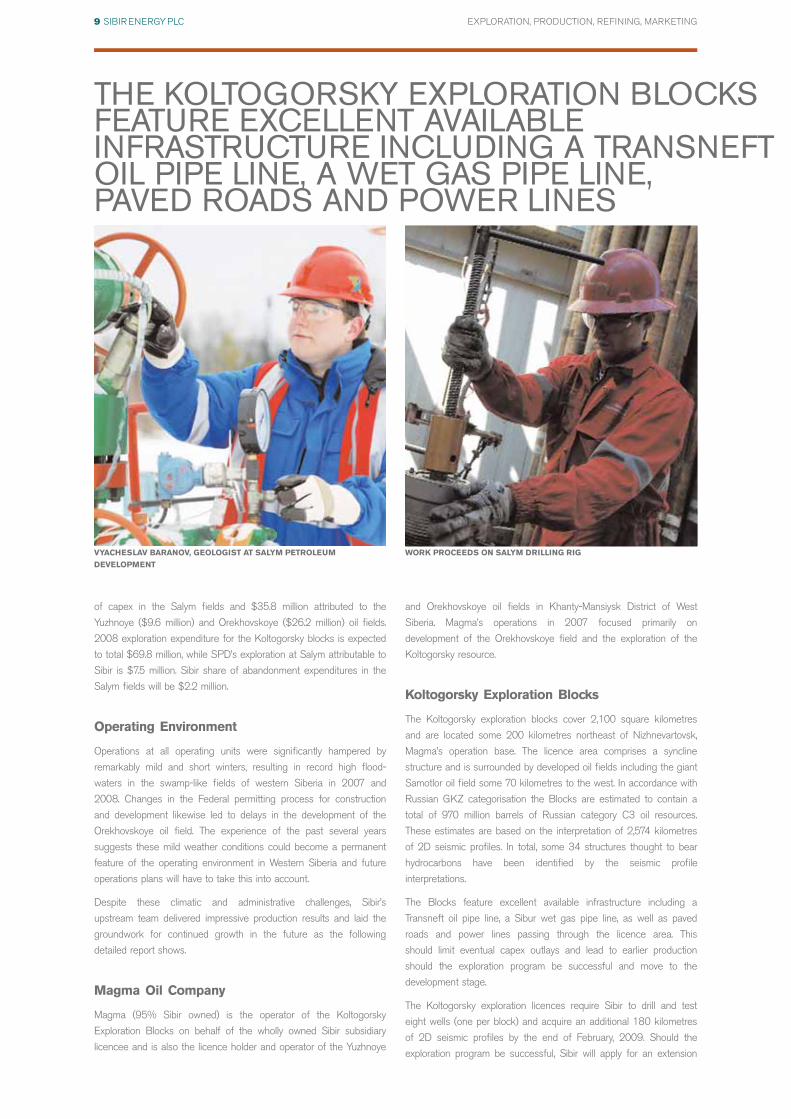
VYACHESLAV BARANOV, GEOLOGIST AT SALYM PETROLEUM
DEVELOPMENT
WORK PROCEEDS ON SALYM DRILLING RIG
THE KOLTOGORSKY EXPLORATION BLOCKSFEATURE EXCELLENT AVAILABLEINFRASTRUCTURE INCLUDING A TRANSNEFTOIL PIPE LINE, A WET GAS PIPE LINE, PAVED ROADS AND POWER LINES
and conversion of the licences to 20/25 years exploration, appraisal
and development licences. To meet the tight timeline of the licence
requirements, Magma has engaged three drilling contractors, each
providing two rigs, as well as several construction and testing
services contractors.
The first well (141P) was spudded in Q4 2007 and reached total
depth of 3,200 metres on Christmas Eve. After acquisition of a
vertical seismic profile the rig was disassembled and remobilised to
drill the second exploration well.
Koltogorsky Exploration Blocks 2008 Preview
By the end of the 2007-2008 winter season Magma had completed
71 kilometres of permanent and winter roads, prepared 7 well pads
and mobilised five exploration rigs. The second exploration well (111P)
was spudded in early April 2008 and reached total depth of 3,500
metres by late May. A third well (121P) was spudded at the end of
April, and fourth well (151P) is expected to spud in July. Two additional
wells (71P and 101P) are scheduled for September and the last two
(81P and 91P) in December. Sibir is encouraged by the initial results
from the first three wells as drilling cores and well logs show
hydrocarbon saturations in Middle and Upper Jurassic sandstones.
Yuzhnoye Oil Field
The Yuzhnoye oil field lies 60 kilometres to the southwest of
Magma’s operations base in Nizhnevartovsk. In 2007 Yuzhnoye
celebrated the 15th anniversary of the start of production during
which time it has produced over 24.5 million barrels of oil.
In 2007 Magma completed design documents and land surveys for
construction of a 27 kilometre wet gas pipeline from the Yuzhnoye
Central Processing Facility (CPF) to a tie-in point for deliveries to
Gazprom affiliate Sibur. Currently under construction, the pipeline will
allow Magma to sell its associated wet gas, thus eliminating flaring in
compliance with its licence obligations.
In 2007 three wells totalling 8,451 linear metres were drilled, ten
wells were completed or recompleted, fifty-seven well workovers
were carried and eighty-five well service jobs performed including
nine hydraulic fracturing treatments. A new modelling and design
plan (Technological Schema) for the Yuzhnoye field was submitted to
the authorities for approval.
Yuzhnoye 2008 Preview
Activities at Yuzhnoye in 2008 are focused on completion of the wet
gas pipeline to eliminate flaring. On the basis of results of recent
development drilling (2004 to 2007) a revised Technological Schema
will be approved in course of 2008 and is expected to include
further development drilling in the southern area of Yuzhnoye.
Orekhovskoye Oil Field
The Orekhovskoye field is a greenfield property which lies 22
kilometres to the northwest of the Yuzhnoye oil field. Sibir acquired
the licence for Orekhovskoye as part of its purchase of Magma in
1997, but development was delayed because the economics of the
project were thought to be unattractive in the lower oil price
environment that prevailed at the time. Taking into consideration the
10 SIBIR ENERGY PLC EXPLORATION, PRODUCTION, REFINING, MARKETING
OPERATIONS REVIEW (CONTINUED)
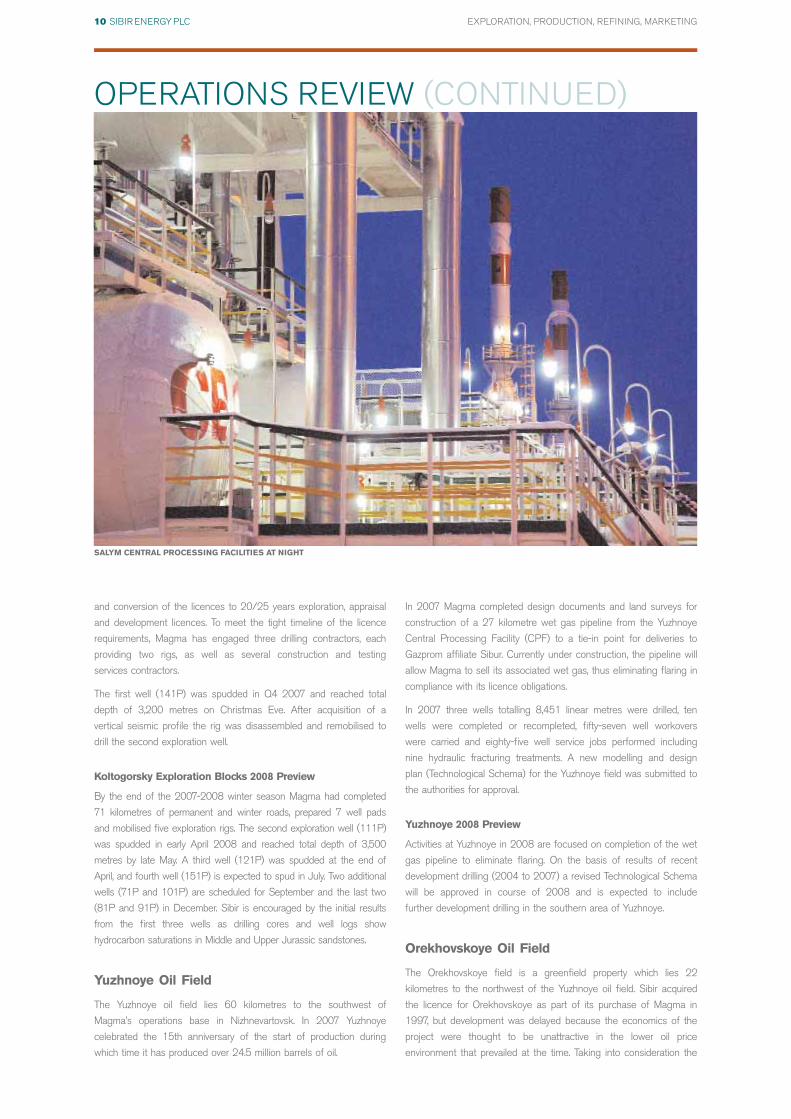
SALYM CENTRAL PROCESSING FACILITIES AT NIGHT
MOSCOW
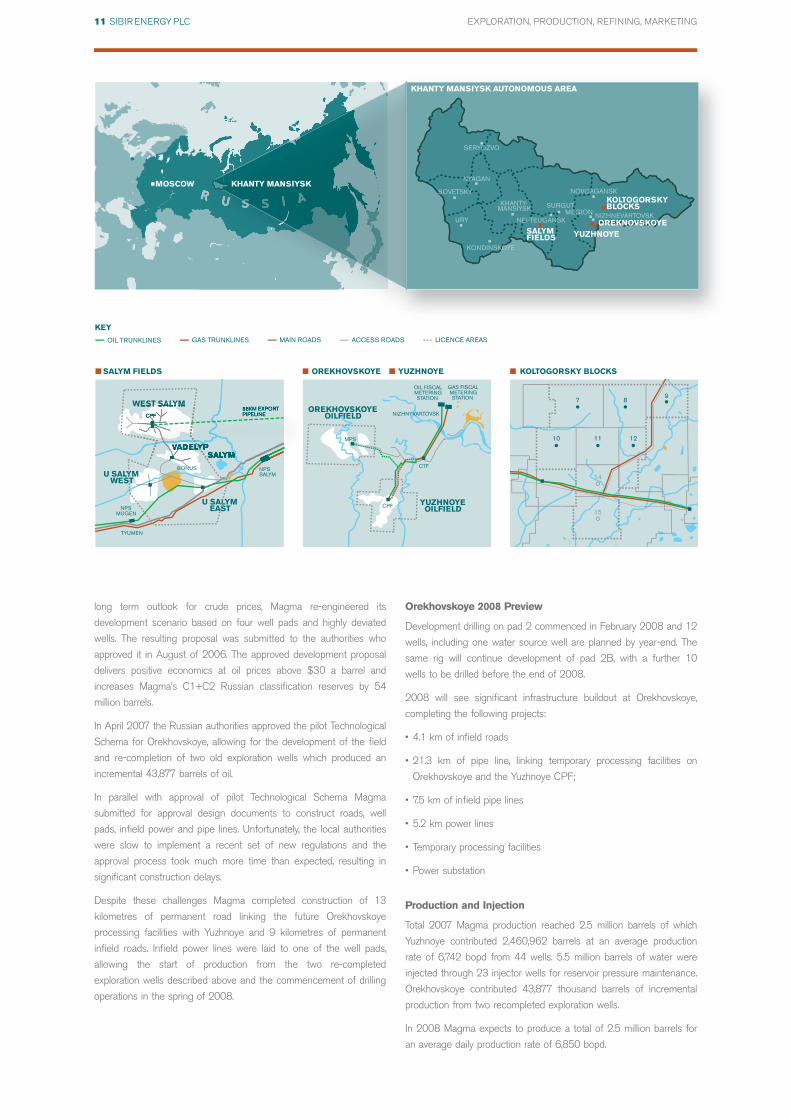
KOLTOGORSKYBLOCKS
SALYMFIELDS
KHANTY MANSIYSK AUTONOMOUS AREA
KHANTY MANSIYSK
OREKNOVSKOYEYUZHNOYE
SOVETSKY
URY
KONDINSKOYE
KHANTY-MANSIYSK SURGUT
NEFTEUGANSK
NOVOAGANSK
MEGION NIZHNEVARTOVSK
NYAGAN
SERYOZVO
KOLTOGORSKY BLOCKS
WEST SALYM
U SALYMWEST
U SALYMEAST
SALYM
BONUS NPSSALYM
88KM EXPORT PIPELINECPF
NPSMUGEN
TYUMEN
VADELYP
SALYM FIELDS
MPS
CPF
CTF
OIL FISCALMETERINGSTATION
GAS FISCALMETERINGSTATION
OREKHOVSKOYEOILFIELD
YUZHNOYEOILFIELD
NIZHNYVARTOVSK
7 89
1211
14
15
10
OREKHOVSKOYE YUZHNOYE
OIL TRUNKLINES
KEY
GAS TRUNKLINES MAIN ROADS ACCESS ROADS LICENCE AREAS
long term outlook for crude prices, Magma re-engineered its
development scenario based on four well pads and highly deviated
wells. The resulting proposal was submitted to the authorities who
approved it in August of 2006. The approved development proposal
delivers positive economics at oil prices above $30 a barrel and
increases Magma’s C1+C2 Russian classification reserves by 54
million barrels.
In April 2007 the Russian authorities approved the pilot Technological
Schema for Orekhovskoye, allowing for the development of the field
and re-completion of two old exploration wells which produced an
incremental 43,877 barrels of oil.
In parallel with approval of pilot Technological Schema Magma
submitted for approval design documents to construct roads, well
pads, infield power and pipe lines. Unfortunately, the local authorities
were slow to implement a recent set of new regulations and the
approval process took much more time than expected, resulting in
significant construction delays.
Despite these challenges Magma completed construction of 13
kilometres of permanent road linking the future Orekhovskoye
processing facilities with Yuzhnoye and 9 kilometres of permanent
infield roads. Infield power lines were laid to one of the well pads,
allowing the start of production from the two re-completed
exploration wells described above and the commencement of drilling
operations in the spring of 2008.
Orekhovskoye 2008 Preview
Development drilling on pad 2 commenced in February 2008 and 12
wells, including one water source well are planned by year-end. The
same rig will continue development of pad 2B, with a further 10
wells to be drilled before the end of 2008.
2008 will see significant infrastructure buildout at Orekhovskoye,
completing the following projects:
• 4.1 km of infield roads
• 21.3 km of pipe line, linking temporary processing facilities on
Orekhovskoye and the Yuzhnoye CPF;
• 7.5 km of infield pipe lines
• 5.2 km power lines
• Temporary processing facilities
• Power substation
Production and Injection
Total 2007 Magma production reached 2.5 million barrels of which
Yuzhnoye contributed 2,460,962 barrels at an average production
rate of 6,742 bopd from 44 wells. 5.5 million barrels of water were
injected through 23 injector wells for reservoir pressure maintenance.
Orekhovskoye contributed 43,877 thousand barrels of incremental
production from two recompleted exploration wells.
In 2008 Magma expects to produce a total of 2.5 million barrels for
an average daily production rate of 6,850 bopd.
11 SIBIR ENERGY PLC EXPLORATION, PRODUCTION, REFINING, MARKETING
12 SIBIR ENERGY PLC EXPLORATION, PRODUCTION, REFINING, MARKETING
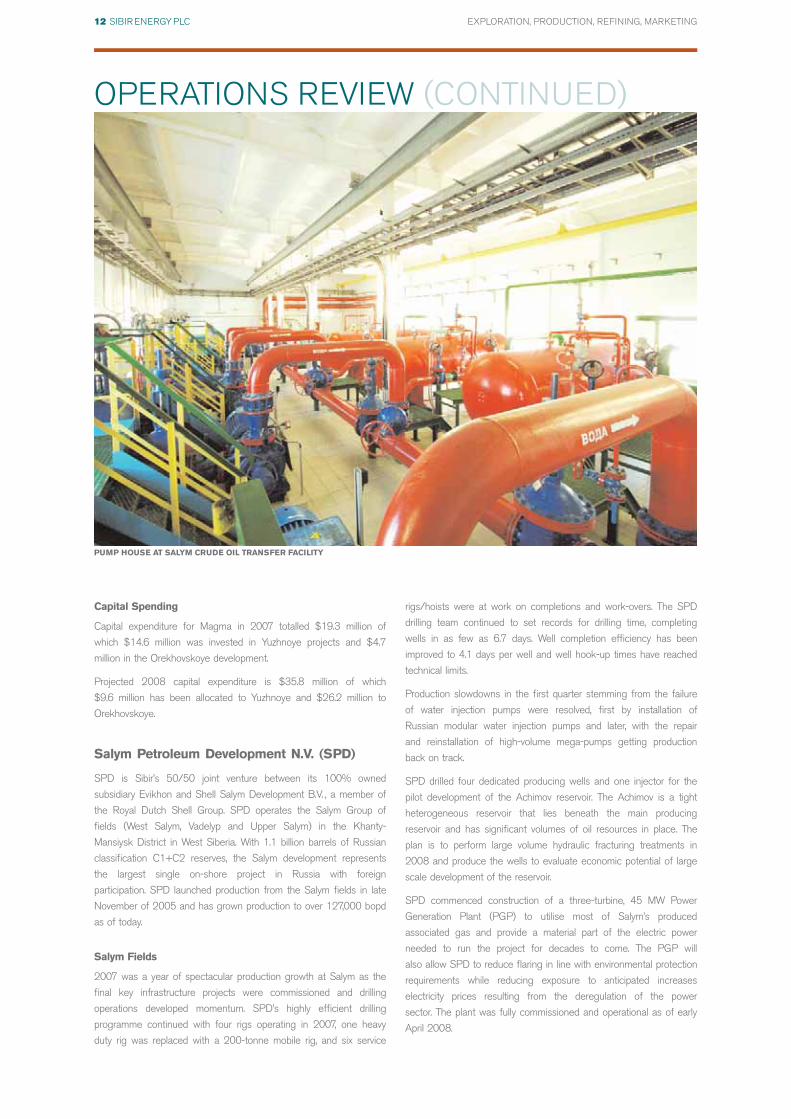
PUMP HOUSE AT SALYM CRUDE OIL TRANSFER FACILITY
OPERATIONS REVIEW (CONTINUED)
Capital Spending
Capital expenditure for Magma in 2007 totalled $19.3 million of
which $14.6 million was invested in Yuzhnoye projects and $4.7
million in the Orekhovskoye development.
Projected 2008 capital expenditure is $35.8 million of which
$9.6 million has been allocated to Yuzhnoye and $26.2 million to
Orekhovskoye.
Salym Petroleum Development N.V. (SPD)
SPD is Sibir’s 50/50 joint venture between its 100% owned
subsidiary Evikhon and Shell Salym Development B.V. , a member of
the Royal Dutch Shell Group. SPD operates the Salym Group of
fields (West Salym, Vadelyp and Upper Salym) in the Khanty-
Mansiysk District in West Siberia. With 1.1 billion barrels of Russian
classification C1+C2 reserves, the Salym development represents
the largest single on-shore project in Russia with foreign
participation. SPD launched production from the Salym fields in late
November of 2005 and has grown production to over 127,000 bopd
as of today.
Salym Fields
2007 was a year of spectacular production growth at Salym as the
final key infrastructure projects were commissioned and drilling
operations developed momentum. SPD’s highly efficient drilling
programme continued with four rigs operating in 2007, one heavy
duty rig was replaced with a 200-tonne mobile rig, and six service
rigs/hoists were at work on completions and work-overs. The SPD
drilling team continued to set records for drilling time, completing
wells in as few as 6.7 days. Well completion efficiency has been
improved to 4.1 days per well and well hook-up times have reached
technical limits.
Production slowdowns in the first quarter stemming from the failure
of water injection pumps were resolved, first by installation of
Russian modular water injection pumps and later, with the repair
and reinstallation of high-volume mega-pumps getting production
back on track.
SPD drilled four dedicated producing wells and one injector for the
pilot development of the Achimov reservoir. The Achimov is a tight
heterogeneous reservoir that lies beneath the main producing
reservoir and has significant volumes of oil resources in place. The
plan is to perform large volume hydraulic fracturing treatments in
2008 and produce the wells to evaluate economic potential of large
scale development of the reservoir.
SPD commenced construction of a three-turbine, 45 MW Power
Generation Plant (PGP) to utilise most of Salym’s produced
associated gas and provide a material part of the electric power
needed to run the project for decades to come. The PGP will
also allow SPD to reduce flaring in line with environmental protection
requirements while reducing exposure to anticipated increases
electricity prices resulting from the deregulation of the power
sector. The plant was fully commissioned and operational as of early
April 2008.

13 SIBIR ENERGY PLC EXPLORATION, PRODUCTION, REFINING, MARKETING
PRESSURE MONITORING GAUGE AT SALYM CPF
Other operational highlights at Salym included:
• Completion of the second phase of Custody Transfer Facilities
(CTF) with two 20,000m3 tanks, transfer pumps and fire pumps;
• Construction of 5 new pads with infield roads, power lines and
pipe lines
• Total of 100 new wells drilled, 78 on West Salym, 1 on Upper
Salym and 21 on Vadelyp
• 106 new wells hooked up
• 108 initial well completions
• 118 well workovers and well service jobs
• 8 hydraulic fracturing treatments
• Expansion of the operations base with two accommodation units,
office block, car wash and covered storage area
• Completion of an office block on the Salym CPF
• Construction of phase one of waste handling and processing
facilities
• Installation of modular water injection facilities on Upper Salym;
Production and Injection
Total 2007 production at Salym doubled to 30.7 million barrels
(15.3 million barrels Sibir share) up from 14.9 million barrels
(7.5 million barrels Sibir share) in 2006. The daily production rate
grew 77% from 64,000 bopd at the beginning of the year to
113,000 bopd by year end. Water injection for reservoir pressure
maintenance totalled 36.4 million barrels reaching required volumes
to balance depletion and manage reservoir pressure support.
Capital Expenditure
Sibir’s share of capital, exploration and abandonment expenses
for the period totalled $172.4 million including $87.9 million for
construction of facilities and infield infrastructure and $79.5 for
drilling and completion of the wells. $1.9 million was spent on
exploration and $3.1 million on abandonment expenditures.
Operational Highlights by Field
West Salym:
West Salym continues to be the focus of SPD’s activities as the field
contains some 70% of total Salym reserves. 2007 operational
highlights for West Salym include:
• Three well pads completed, drilling, completions and hook-ups
under way, production commenced;
• Infield infrastructure (oil and injection water pipe lines, roads and
power lines) completed for 3 pads;
• Water Injection facilities fully in place with two big flow serve
(15,000m3/day each) and back up Russian modular pumps;
• 78 wells drilled;
• 85 wells completed;
• 54 new producing wells brought on stream;

• 5 dedicated Achimov wells drilled and one hydraulically fractured;
• Construction of phase 2 Custody Transfer Facilities (CTF) at the tie
in of the export pipeline to Transneft pipeline system completed;
• Phase one of waste processing facilities completed.
Upper Salym
The Upper Salym licence area has significant potential. SPD is
continuing studies and investments to fully valuate its upside. 2007
accomplishments at Upper Salym include:
• Completion of modular pump station for water injection;
• Completion of well pad K-2;
• 1 well drilled;
• Preparation of new Technological Schema.
Vadelyp profile
Vadelyp consists of two structures, Vadelyp North and Vadelyp South.
The development of Vadelyp North commenced in 2006, and
continued during 2007. Studies and preparation of the development
of Vadelyp South took place in 2007 to be continued through 2009.
In 2007, the following progress was recorded at Vadelyp:
• new well pad built;
• 21 wells drilled;
• 23 wells completed.
Salym 2008 Preview
Continued development of the Salym fields in 2008 is expected to
bring total production of up to 45 million barrels. Daily production is
expected to reach 130,000 bopd by year-end based on currently
approved projects. SPD is preparing several incremental projects
such as hydraulic fracturing treatments, flank and in-fill drilling
which could bring 2008 year-end production to 140,000 bopd and
add incremental production in the years to come.
Development projects for 2008:
• To support steady production growth SPD plans to drill additional
water source wells to increase water injection capacity injection of
water for reservoir pressure maintenance.
• Exploration and appraisal activities at Salym will continue in 2008,
with the Achimov Pilot Development on West Salym, and the
drilling of exploration wells on Upper Salym and South Vadelyp.
SPD plans to drill two more prospects on Upper Salym (Lebed and
Glukhar) in the winter 2008/2009 and pilot development of Middle
Cretaceous BS8 reservoir on Upper Salym. This pilot, consisting of
9 wells, will be initiated in 2008 and will continue during 2009.
• The CPF on West Salym will be upgraded with two 100m3 inlet
separators, one 100m3 final stage separator and two 5,000m3
water skim tanks.
• Two new well pads will be completed, and the three pads already
completed in 2007 (21, 25 and 27) will produce first oil in 2008.
14 SIBIR ENERGY PLC EXPLORATION, PRODUCTION, REFINING, MARKETING
OPERATIONS REVIEW (CONTINUED)
CONTRACT DRILLING RIG OPERATOR AT THE SALYM OIL FIELDS IN WESTERN SIBERIA

.• An operations base fuel filling station, sport hall and ambulance
garage will be completed.
• Drilling with four rigs, and completions and well servicing with
6-7 rigs/hoists will continue.
• To manage remaining volumes of associated gas not utilised by the
45MW power plant, SPD has entered into an agreement with a
third party which will build and operate an LPG plant next to the
Salym CPF. The plant will take wet gas deliveries from Salym as
well as neighbouring producing properties and is expected to be
commissioned in 2010.
Group Reserves Summary
The Group’s interests in commercial reserves of oil as of 31
December 2007 are included in the unaudited table below:
RUSSIAN RESERVES CLASSIFICATION (1)
Million barrels A+B+C1 C2 Total
Magma’s Yuzhnoye and 125 11 136
Orekhovskoye Oil Fields
Salym Group of Fields 376 156 532
(50%) (2)
Total 501 167 668
1. RUSSIAN RESERVES ARE CLASSIFIED AS FOLLOWS:
A = RESERVES PROVED AND DEVELOPED IN ACCORDANCE WITH APPROVED
(BY RUSSIAN AUTHORITIES) DEVELOPMENT PLAN.
B = RESERVES PROVED AND DEVELOPED IN ACCORDANCE WITH EARLY
DEVELOPMENT PLAN.
C1 = RESERVES TESTED AND MOSTLY PROVED BUT NOT DEVELOPED.
C2 = RESERVES CONTIGUOUS TO C1 AND SUBSTANTIATED BY GEOLOGICAL
DATA AND LIE WITHIN PROBABLE, POSSIBLE AND CONTINGENT.
2. AS NOTED IN PREVIOUS REPORTS, SPD USES A RESERVES CLASSIFICATION
KNOWN AS PROVEN, EXPECTED AND SCOPE FOR RECOVERY RESERVE
ESTIMATE BASED ON THE FIELD DEVELOPMENT PLAN WHICH TOTAL 888
MILLION BARRELS (OR SIBIR SHARE – 444 MILLION BARRELS). THE
DIFFERENCE BETWEEN THE SPD ESTIMATES AND THE RUSSIAN RESERVES
NUMBERS ARE DUE PRIMARILY TO THE EXCLUSION OF THE LOWER
RESERVOIRS IN THE SPD NUMBERS.
15 SIBIR ENERGY PLC EXPLORATION, PRODUCTION, REFINING, MARKETING
HEAD LABORATORY TECHNICIAN, IRINA SHUVALOVA, AT MAGMA’S YUZHNOYE OIL FIELD IN WESTERN SIBERIA

The completion of the MOGC deal has also allowed for a resolution
of the long-standing conflicts between shareholders at the Moscow
Refinery, thus clearing the way for long overdue investment to make
it a world class facility. Likewise our ownership of the MTK and MNP
retail fuels networks has allowed us to start implementing an
aggressive plan to upgrade those networks to ensure a leadership
position in the marketplace.
In summary, 2007 was a watershed year for Sibir’s downstream
business and set the stage for 2008 during which the planning,
designing, securing of building permits, and the building of the
management team will allow us to start to turn our vision into
growing operations that will deliver enhanced earnings quality for
years to come.
The Moscow Market
The City of Moscow and the surrounding Moscow Region represent
one of the largest and most dynamic fuels markets in Europe. The
region has a combined population of over 17 million making it the
largest metropolitan area on the continent of Europe. With Russia’s
economic revival Moscow has become a magnet for domestic and
foreign investment, leading to increases in living standards and
consumer spending which are reflected in a 10% annual growth rate
in the number of automobiles on the road over the past three years.
Russia is now poised to overtake Germany as the largest automotive
market in Europe by the end of 2008 supporting continued strong
growth in fuels demand.
Moscow Refinery
The Moscow Refinery is a 240,000 bopd nameplate capacity facility
currently processing 200,000 bopd and supplies over 50% of
Moscow’s motor fuel requirements. Located in the southeastern
district of the city it receives crude supply via the Russian national
Transneft pipeline system whilst refined products are supplied to local
markets and export customers through pipelines, rail cars and trucks.
Over 3,200 staff are employed at the facility.
The Moscow Refinery is designed to process a high sulphur Urals
blend crude slate. The facility comprises over forty processing units
producing approximately 57% high-value light products including
16 SIBIR ENERGY PLC EXPLORATION, PRODUCTION, REFINING, MARKETING
OPERATIONS REVIEW (CONTINUED)
DOWNSTREAM OPERATIONS REVIEWIn the second half of 2007 Sibir successfully completed its acquisition of MOGC, materially increasing its interests in the downstream business – truly a landmark event in the history of the company.
MAINTENANCE WORKER AT MOSCOW REFINERY

gasoline (RON octane grades 80, 92 and 95), Diesel (winter and
summer) and aviation kerosene (jet fuel). The Refinery is also a
leading producer of heating oil, bitumen and LPG. A large part of the
Refinery’s output is sold into the local market, though a significant
percentage (up to 50%) of diesel is exported.
The Refinery operates as a tolling operation and does not buy crude
or sell oil products itself. Trading activities are carried out by trading
companies which supply crude to the Refinery, pay the Refinery a
per-barrel tolling fee to process the crude and then market the
refined product directly. The Refinery’s tolling fees are sufficient
to cover operating costs, regular maintenance, on-going capital
expenditure leaving profits sufficient to cover payment of dividends
on preferred shares. Thus, the full economic value of the refining
operation is reflected in the results of our trading operation.
Refining Volumes
In 2007 the Moscow Refinery processed 72.9 million barrels of
crude. Sibir’s share of total tolling capacity was 21.4 million barrels or
an average 58,630 bopd, an increase over 2006 as Sibir benefited
from increased tolling capacity after the completion of the MOGC
acquisition in September. Refinery production was temporarily
reduced by nearly 40% during the month of October due to routine
maintenance.
2008 total crude processing volumes are expected to be 71.4 million
barrels of which Sibir is expected to have tolling access to 35.7
million barrels or 97,800 bopd. Maintenance works are expected to
slow processing in April and May, resulting in lower volumes for the
first half of the year.
Future Development Plans
The Moscow Refinery has recently completed a feasibility study
which outlines several scenarios for upgrading the facility over the
next several years. The most likely option currently under study
anticipates a robust, three-stage investment program to increase light
high-value products yields to 90%, improve capacity utilisation and
produce Euro 5 specification motor fuels. Total capital expenditure for
the upgrade is expected to be in excess of $1 billion which will be
the shared responsibility of the shareholders.
Marketing and Distribution
With increasing car ownership, population and affluence, Moscow and
the Moscow region are witnessing record fuel consumption growth.
However, due to a lack of available real estate in Moscow suitable for
petrol service station construction, the market remains significantly
under supplied in terms of the number of filling stations (845 in total).
The market is thus characterised by very high and growing per-station
throughput volumes and retail fuels margins well above European
averages. This is not expected to change anytime soon.
17 SIBIR ENERGY PLC EXPLORATION, PRODUCTION, REFINING, MARKETING
MR. JEFF FRANKS, HEAD OF RETAIL OPERATIONS MAINTENANCE WORK UNDER WAY AT MOSCOW REFINERY

Sibir has a significant position in this exciting market with an interest
in over 185 petrol service stations in Moscow and surrounding
region. Our retail assets are held through three distinct entities:
Moscow Fuel Company: a network of 71 wholly-owned and operated
MTK-branded service stations in the city of Moscow with sales of
over 485 million litres of motor fuels in 2007. It is the largest network
of existing stations in the city. The company also has a 100%
interest in a large oil products storage and distribution terminal in the
northwest district of Moscow.
The MTK network is primarily a fuels only network which has had
minimal investment over the past 20 years. Sibir has announced a
major investment program of over $200 million over the next five
years to significantly upgrade this network to international retail
standards to include modern, multi-product fuelling facilities,
convenience retail stores, ready-to-serve food offering and automatic
carwashes where real estate dimensions permit. In 2008 the
company’s activities will focus on planning and securing the necessary
building permits to launch this ambitious development program.
Mosnefteproduct: A network of 63 NEFTO-branded service stations
51% owned by Sibir in the economically vibrant region surrounding
Moscow. This region is experiencing tremendous development and
growth as Muscovites have developed a taste for suburban living. This
is leading to increased road construction, development of housing and
consumer retail facilities and local employment. The NEFTO-branded
network is comprised of Soviet-era facilities that have suffered from
years of under-investment as reflected in its 2007 sales volumes of
65 million litres. Approximately half of the network stations are being
18 SIBIR ENERGY PLC EXPLORATION, PRODUCTION, REFINING, MARKETING
OPERATIONS REVIEW (CONTINUED)
PUMP ATTENDANT, MIKHAIL DUDKIN, AT MTK’S SUSHEVSKY VAL
SERVICE STATION IN MOSCOW
ABOVE TOP: MTK’S YUZHNOYE BUTOVO PETROL STATION IN MOSCOW
ABOVE: BP PETROL STATION IN MOSCOW
WITH 2007 SALESOF OVER 988MILLION LITRES,THE BP NETWORKIS THE CLEARMARKET LEADERIN MOSCOW

targeted for demolition and rebuild over the next 5 years requiring
some $75 million in capital investment. The renewed network will form
the basis for significant expansion to develop a leading position in the
Moscow region and surrounding territory.
STBP: In 2006 Sibir acquired its 25% +1 share interest in this
BP-branded service station network of 51 facilities in Moscow and
the surrounding region. Established over 10 years ago, the BP
network is a greenfield development that has been built to the
highest international retail standards. All facilities feature modern,
high-volume fuelling facilities, large convenience stores with in-
store bakeries and cafes. Automatic carwashes are available on
approximately fifty percent of locations. With 2007 sales of over 988
million litres the BP network is the clear market leader in Moscow.
Future development plans call for the network to grow to between
90 and 120 filling stations over the next 5 years.
Retail Sales Summary
2007 retail fuels sales volumes from all networks totalled 1.5 billion
litres of which 765.15 million litres are attributable to Sibir
Total Sales Sibir Net Sibirmltrs Interest % Share mltrs
MTK Network 485,000 100 485,000
Mosnefteproduct 65,000 51 33,150
STBP 988,000 25 247,000
Total 1,538,000 765,150
19 SIBIR ENERGY PLC EXPLORATION, PRODUCTION, REFINING, MARKETING
REFRIGERATED PRODUCTS AT MTK CONVENIENCE STORE IN MOSCOW NADEZHDA SURKOVA, EMPLOYEE AT MTK SERVICE STATION
CONVENIENCE STORE IN MOSCOW
20 SIBIR ENERGY PLC EXPLORATION, PRODUCTION, REFINING, MARKETING
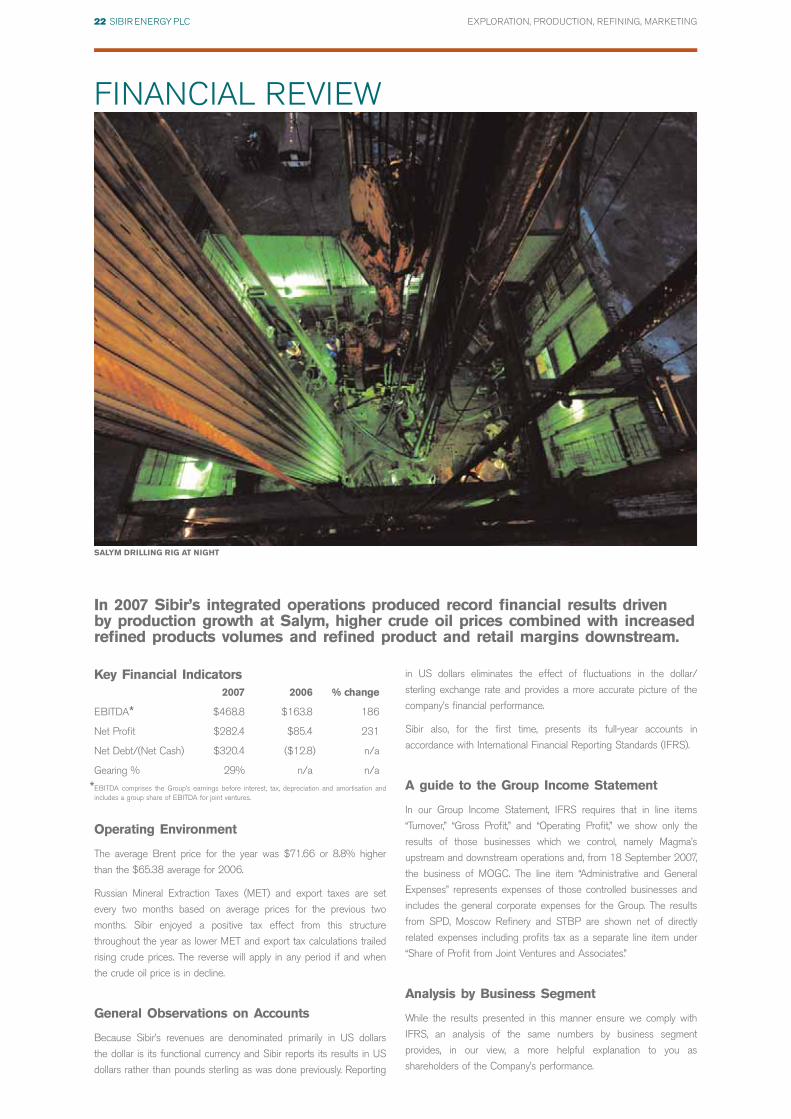
FINANCIAL REVIEW
CRUDE STORAGE TANK AT SALYM
21 SIBIR ENERGY PLC EXPLORATION, PRODUCTION, REFINING, MARKETING
RECORDFINANCIALRESULTS
22 SIBIR ENERGY PLC EXPLORATION, PRODUCTION, REFINING, MARKETING
Key Financial Indicators2007 2006 % change
EBITDA* $468.8 $163.8 186
Net Profit $282.4 $85.4 231
Net Debt/(Net Cash) $320.4 ($12.8) n/a
Gearing % 29% n/a n/a
*EBITDA comprises the Group’s earnings before interest, tax, depreciation and amortisation andincludes a group share of EBITDA for joint ventures.
Operating Environment
The average Brent price for the year was $71.66 or 8.8% higher
than the $65.38 average for 2006.
Russian Mineral Extraction Taxes (MET) and export taxes are set
every two months based on average prices for the previous two
months. Sibir enjoyed a positive tax effect from this structure
throughout the year as lower MET and export tax calculations trailed
rising crude prices. The reverse will apply in any period if and when
the crude oil price is in decline.
General Observations on Accounts
Because Sibir’s revenues are denominated primarily in US dollars
the dollar is its functional currency and Sibir reports its results in US
dollars rather than pounds sterling as was done previously. Reporting
in US dollars eliminates the effect of fluctuations in the dollar/
sterling exchange rate and provides a more accurate picture of the
company’s financial performance.
Sibir also, for the first time, presents its full-year accounts in
accordance with International Financial Reporting Standards (IFRS).
A guide to the Group Income Statement
In our Group Income Statement, IFRS requires that in line items
“Turnover,” “Gross Profit,” and “Operating Profit,” we show only the
results of those businesses which we control, namely Magma’s
upstream and downstream operations and, from 18 September 2007,
the business of MOGC. The line item “Administrative and General
Expenses” represents expenses of those controlled businesses and
includes the general corporate expenses for the Group. The results
from SPD, Moscow Refinery and STBP are shown net of directly
related expenses including profits tax as a separate line item under
“Share of Profit from Joint Ventures and Associates.”
Analysis by Business Segment
While the results presented in this manner ensure we comply with
IFRS, an analysis of the same numbers by business segment
provides, in our view, a more helpful explanation to you as
shareholders of the Company’s performance.
FINANCIAL REVIEW
In 2007 Sibir’s integrated operations produced record financial results driven by production growth at Salym, higher crude oil prices combined with increasedrefined products volumes and refined product and retail margins downstream.
SALYM DRILLING RIG AT NIGHT

The segment analysis below breaks out contributions to profitability
from the key business segments in upstream and downstream
sectors. Administrative expenses of Magma and MOGC are similarly
broken out from the corporate expenses in the IFRS accounts and
allocated to the relevant segment to provide a clear picture of
segment profitability.
Profit contribution by segment
2007 2006 %$000 $000 Change
Upstream
Salym 219,109 49,774 340
Yuzhnoye and Orekhovskoye 30,500 20,537 49
Total Upstream Contribution 249,609 70,311 255
Downstream
Products trading, refining and retail 127,482 80,797 58
Share of Net Profit from BP retail 21,049 -
Total Downstream Results 148,531 80,797 84
Corporate expenses (31,753) (22,843) 39
Finance Costs (22,715) (16,290) 39
Tax (61,245) (23,005) 166
Net profit 282,427 88,970 217
Upstream
Total Sibir Group crude oil production in 2007 rose 80% to 17.8
million barrels of which 15.3 million barrels came from Sibir’s share
of growing production from SPD and the remainder from the Magma
production unit. Sibir’s 50% share of Salym production increased
33% in the second half of 2007 to 8.77 million barrels from 6.57
million barrels in the first half while Magma production held steady.
Salym
Salym’s contribution to profitability in 2007 increased 340% to
$219.1 million and is made up of three components: $90.3 million,
which represents Sibir’s 50% share of SPD’s net income after tax;
$77.7 million of interest income before tax earned by Sibir on its
outstanding loans to the SPD joint venture (these loans totalled
$598.4 million at year-end); and $51.1 million before-tax gain on the
recognition of a free carry from Shell now realised in 2007.
Production at Salym in 2007 doubled to 30.7 million barrels (15.3
million barrels Sibir share) up from 14.9 million barrels (7.5 million
Sibir share) in 2006. SPD turnover in 2007 increased to $1,330.5
million and gross profit, after depletion, grew to $408.6 million from
$165.7 million. Operating Profit rose to $320.9 million from $93.3
million in 2006.
Per barrel production expenses at SPD decreased by 45% to
$4.06/barrel compared to $7.78/barrel in 2006 due to a doubling of
production and the achievement of economies of scale associated
with such a large production ramp-up.
23 SIBIR ENERGY PLC EXPLORATION, PRODUCTION, REFINING, MARKETING
IRINA KOLTSOVA AND KSENIA KOSHELEVA OF SIBIR’S MAGMA
TRADING GROUP
SALYM DRILLING RIGS WORK AROUND THE CLOCK
Yuzhnoye and Orekhovskoye as operated by Magma
Magma’s upstream production unit, comprising the Yuzhnoye and
Orekhovskoye fields, contributed $30.5 million before tax, an
increase of 50% from $20.5 million in 2006.
Of Magma’s total 2.5 million barrels of production, approximately
43% was exported and the balance delivered for processing at
the Moscow Refinery. Magma’s trading unit (part of the downstream
segment) also purchases Sibir’s share of the 29% of Salym
production sold domestically for processing at the Moscow Refinery.
Transfer pricing for crude processed at the Moscow Refinery is
calculated on an arm’s length basis.
Production expenses at Magma increased 15% in 2007 due to a
$1.7/barrel increase in MET and an increase in operating expense
from an average of $3.16/barrel in 2006 to $4.38/barrel in 2007.
The increase operating expenses resulted from cost inflation of
oil treatment charges, wages, oil field services, electric power and
appreciation of the rouble against the dollar.
Downstream
Downstream contributions to profitability in 2007 grew 84% to
$148.5 million. Contributions to earnings from oil products trading
and crude processing represent $127.5 million, a 58% increase over
2006 and were due to strong product margins and an increase in
our processing quota from 45,000 bopd to 100,000 bopd (average
58,630 bopd for the year) following the completion of the MOGC
deal. Sibir’s share of earnings from the Moscow Refinery was modest
because the Refinery runs as a tolling operation and the bulk of the
profits being captured in the trading business. The contribution from
MOGC to operating profit amounted to a loss of $8.5 million for the
period following completion of the MOGC deal and includes $19.2
million in corporate expenses and $7.8 million of depreciation. This
level of expense in MOGC is clearly excessive and a restructuring
plan will eliminate such losses in the future.
For the first time, Sibir consolidates earnings from its 25% share of the
BP retail joint venture, consolidating $21.0 million in net income after
tax from this outstanding retail network of only 51 stations. These
stations sold together 988 million litres for the year making average
per-station throughput volumes amongst the highest in the world.
Corporate Expenses
As advised in September corporate expenses (which in this business
segment analysis, exclude expenses of MOGC and Magma)
increased 39% from $22.8 million to $31.8 million due to increases
in banking and consulting fees paid in association with the MOGC
acquisition, legal fees incurred in pursuing legacy issues of the
Sibneft-Yugra dilution and increases in salaries and bonuses for key
personnel.
Administrative Expenses in the IFRS income statement amount to
$73.2 million. For the segment analysis referred to above, those were
broken out in the following manner: $35.8 million are attributable
directly to Sibir Group overheads and administrative expenses; $3.5
was allocated to Magma’s Upstream Production units (at Yuzhnoye
24 SIBIR ENERGY PLC EXPLORATION, PRODUCTION, REFINING, MARKETING
FINANCIAL REVIEW (CONTINUED)
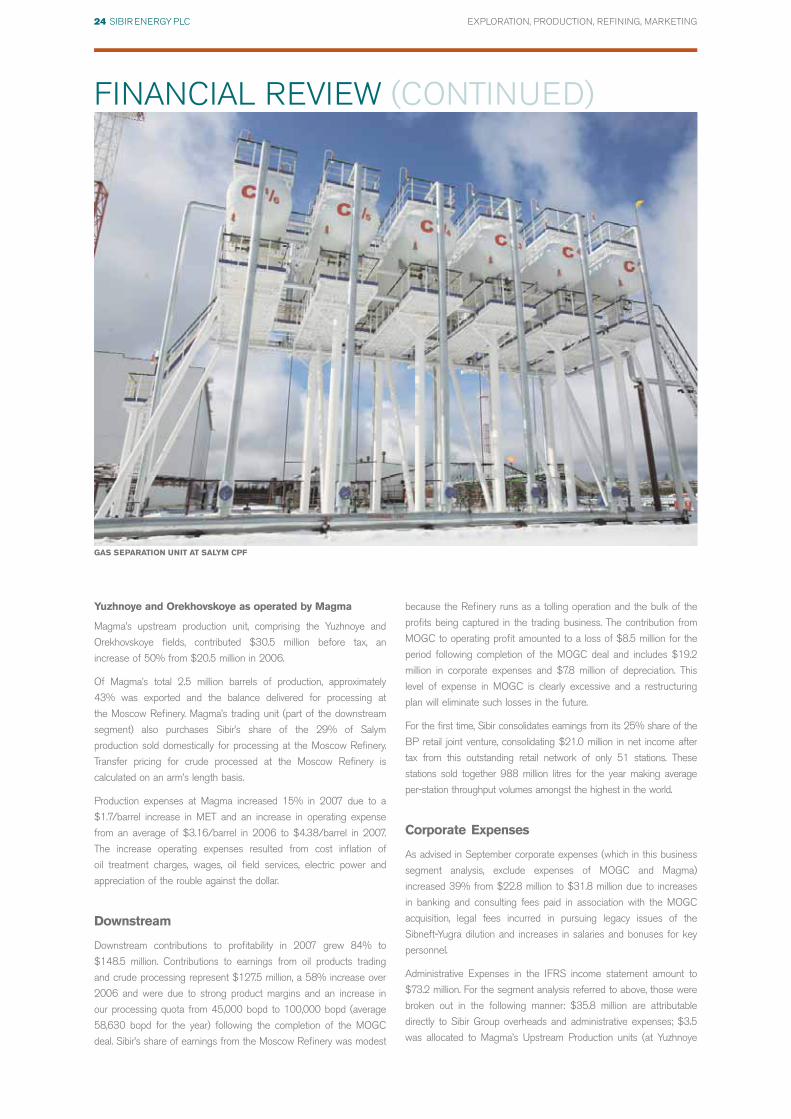
GAS SEPARATION UNIT AT SALYM CPF

and Orekhovskoye), $6.9 million was allocated to Magma’s products
trading unit; and $27 million (including depreciation) was attributable
to overheads at MOGC.
Finance Costs
Net Interest expense of $22.7 million was up 39% in 2007 from
$16.3 million in 2006. Of the total, $17.6 million was related to
interest receivable from bank deposits, loans to MOGC and Central
Fuel Company. The balance was made up of $38.9 million of interest
payable on bank loans used to finance the MOGC and Koltogorsky
acquisitions as well as lines of credit drawn to finance expanded
domestic crude oil purchases due to Magma’s increased processing
quota at the Moscow Refinery and increases in domestic crude prices.
Taxation
The 2007 taxation charge of $61.2 million, predominantly comprises
profits tax payable by our Russian operating subsidiaries, Magma and
MOGC, of $41.0 million (2006: $22.3 million) and $2.9 million
respectively, and $17.8 million payable by Evikhon on the non
recurring carry item of $51.1 million realised during 2007.
Net Profit and Earnings per share (EPS)
Group Net Profit after interest and taxation was $282.4 million in
2007 compared net profit of $89.0 million in 2006, a 217% increase
and an improvement in financial performance of $193.4 million.
Earnings per share (EPS) increased by 169% to 82.50 cents in
2007 from 30.65 cents in 2006.
Balance Sheet
As at 31 December 2007, the Group’s net assets have increased by
$1,082 million to $2,124 million reflecting the acquisition of MOGC
group of companies on 18 September 2007.
Net debt for the Group grew to $320.4 million at the end of 2007
from a net cash position of $12.8 million in 2006 reflecting
increased borrowings to finance the cash portion of the MOGC
share acquisition and expanded use of trade finance to support
increased trading activity arising from the doubling of Magma’s
processing quota at the Moscow Refinery. Despite this increase in
borrowings, the company’s ability to service its debt is extremely solid,
as evidenced by the Group’s 2007 EBITDA of $468.8 million being
greater than the Group’s net debt of $320.4 million.
The Group’s net current assets for 2007 increased $60.5 million to
$291.0 million compared to $230.5 million as at 31 December
2006 due predominantly to increases in the Group’s cash balances.
Total non-current liabilities increased to $492.0 million from $109.7
million as at 31 December 2006 as a result of increased borrowings
used to finance the Group’s acquisitions of MOGC and the
Koltogorsky exploration blocks and expanded cash requirements for
crude purchases arising from the increase in the tolling quota at the
Moscow Refinery. The increase in non-current liabilities also resulted
from deferred tax and other tax provisions included within MOGC
group prior to its acquisition by Sibir.
25 SIBIR ENERGY PLC EXPLORATION, PRODUCTION, REFINING, MARKETING
DRILLING RIG ROTARY TABLE AT THE YUZHNOYE OIL FIELD WELL WORKOVER UNDER WAY AT THE YUZHNOYE OIL FIELD

26 SIBIR ENERGY PLC EXPLORATION, PRODUCTION, REFINING, MARKETING
Total assets less current liabilities as at 31 December 2007
was $2,615.8 million compared with $1,151.3 million as of
31 December 2006.
Total shareholder’s equity as at 31 December 2007 was $2,123.9
million compared to $1,041.6 million as at 31 December 2006.
Cash Flow
Cash flow from operating activities:
In 2007, the Group recorded a net cash inflow from operating
activities of $73.8 million compared to a net cash outflow of $61.5
million in 2006. This is a reflection of the increased profitability of
the Group, coupled with a significant improvement in the Group’s
working capital position.
Cash flow from investing activities:
The Group financed capital expenditure of $13.5 million at Magma,
acquired the Koltogorsky Exploration Blocks for $50.0 million,
incurred subsequent exploration expenditure of $4.4 million, lent
$31.0 million to SPD as payment of cash calls in the early part of
2007 and received loan repayments from SPD in the later part of
2007 in the amount of $76.0 million. The Group also received loan
repayments from other entities in the amount of $43.2 million,
received dividends from STBP in the amount of $16.1 million and
spent $293.9 million in connection with the cash component of the
MOGC transaction (net of cash acquired).
Cash flow from financing activities:
The Group paid dividends in the amount of $44.2 million, drew down
trade finance and other loans in the amount of $630.2 million
and repaid borrowings and trade finance lines in the amount of
$330.8 million.
The year closed with a cash and cash equivalent balance of $293.3
million compared to $216.7 million as at 31 December 2006.
Financial Instruments
The Group’s financial instruments comprise borrowings, cash and
liquid resources, and various items, such as trade debtors, and trade
creditors which arise directly from its operations. The main purpose of
these financial instruments is to finance the Group’s operations. It is,
and has been throughout the period under review, the Group’s policy
that there be no trading in financial instruments. The main risks
arising from the Group’s financial instruments are foreign currency
risk, oil price risk, interest rate and liquidity risk (further information is
contained in note 3 to the financial statements).
The Board reviews and agrees policies for managing each of these
risks and they are summarised as follows under the following two
headings:
FINANCIAL REVIEW (CONTINUED)
GAS SEPARATOR UNITS AT SALYM CPF AT NIGHT
27 SIBIR ENERGY PLC EXPLORATION, PRODUCTION, REFINING, MARKETING
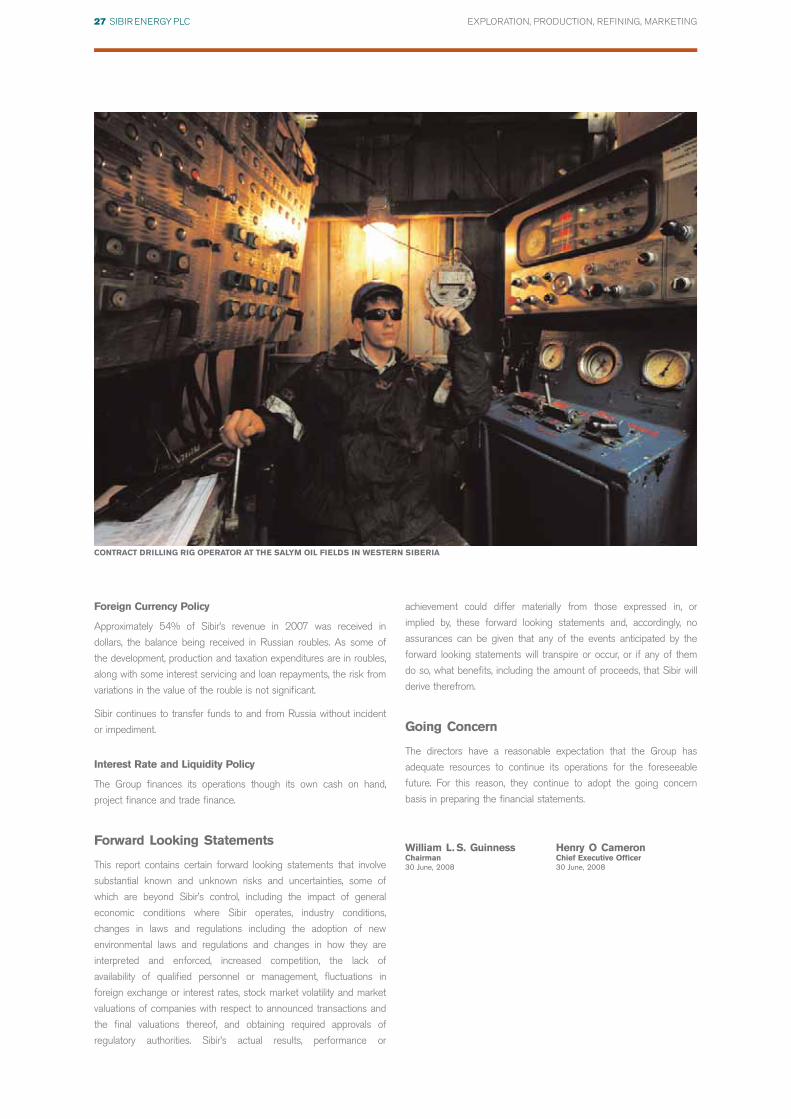
CONTRACT DRILLING RIG OPERATOR AT THE SALYM OIL FIELDS IN WESTERN SIBERIA
Foreign Currency Policy
Approximately 54% of Sibir’s revenue in 2007 was received in
dollars, the balance being received in Russian roubles. As some of
the development, production and taxation expenditures are in roubles,
along with some interest servicing and loan repayments, the risk from
variations in the value of the rouble is not significant.
Sibir continues to transfer funds to and from Russia without incident
or impediment.
Interest Rate and Liquidity Policy
The Group finances its operations though its own cash on hand,
project finance and trade finance.
Forward Looking Statements
This report contains certain forward looking statements that involve
substantial known and unknown risks and uncertainties, some of
which are beyond Sibir’s control, including the impact of general
economic conditions where Sibir operates, industry conditions,
changes in laws and regulations including the adoption of new
environmental laws and regulations and changes in how they are
interpreted and enforced, increased competition, the lack of
availability of qualified personnel or management, fluctuations in
foreign exchange or interest rates, stock market volatility and market
valuations of companies with respect to announced transactions and
the final valuations thereof, and obtaining required approvals of
regulatory authorities. Sibir’s actual results, performance or
achievement could differ materially from those expressed in, or
implied by, these forward looking statements and, accordingly, no
assurances can be given that any of the events anticipated by the
forward looking statements will transpire or occur, or if any of them
do so, what benefits, including the amount of proceeds, that Sibir will
derive therefrom.
Going Concern
The directors have a reasonable expectation that the Group has
adequate resources to continue its operations for the foreseeable
future. For this reason, they continue to adopt the going concern
basis in preparing the financial statements.
William L. S. Guinness Henry O CameronChairman Chief Executive Officer30 June, 2008 30 June, 2008

28 SIBIR ENERGY PLC EXPLORATION, PRODUCTION, REFINING, MARKETING
William Guinness
Non-ExecutiveChairman
Henry Cameron
Chief ExecutiveOfficer
Stuard Detmer
Deputy ChiefExecutive Officer
Chalva Tchigirinski
Non-Executive Director
BOARD OF DIRECTORS
KEY EXECUTIVES
Alexander Betsky
Finance Director
Oleg Ivanchenko
Head of Oil Sales
Roman Ilyukhin
Chief Economist
Andrew Harrison
Company Secretary
Pavle Uroda
Chief UpstreamOperations Officer
29 SIBIR ENERGY PLC EXPLORATION, PRODUCTION, REFINING, MARKETING
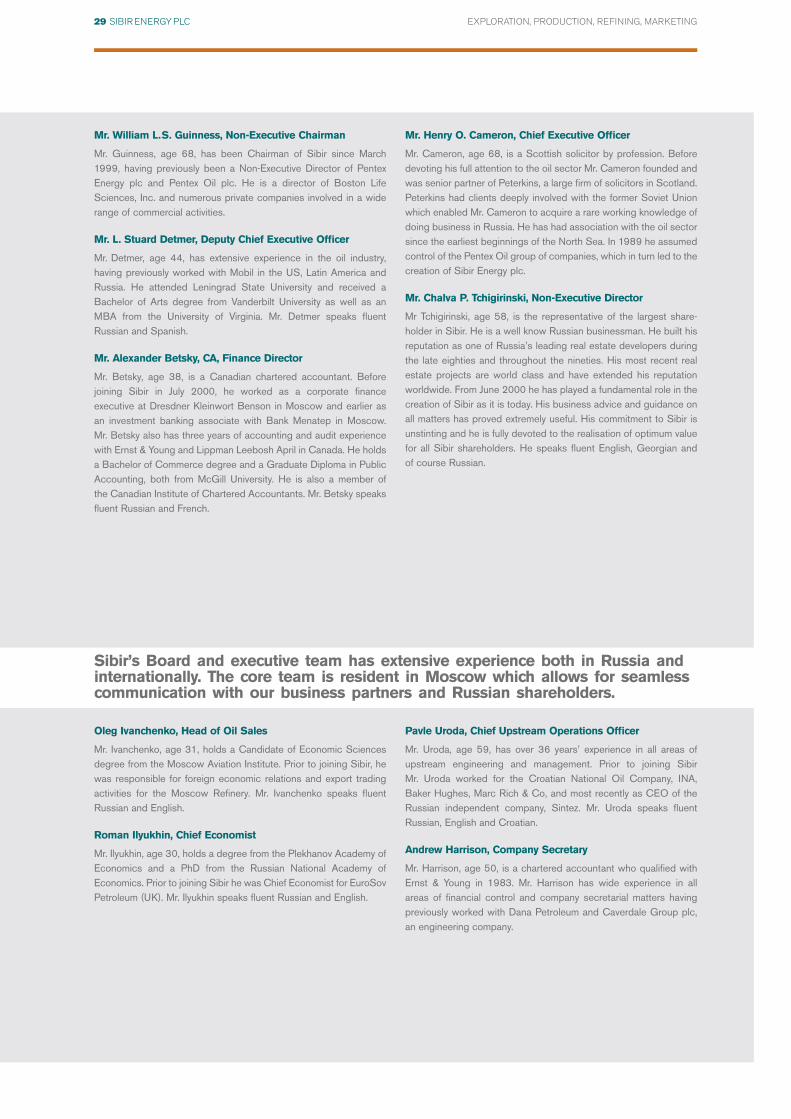
Oleg Ivanchenko, Head of Oil Sales
Mr. Ivanchenko, age 31, holds a Candidate of Economic Sciencesdegree from the Moscow Aviation Institute. Prior to joining Sibir, hewas responsible for foreign economic relations and export tradingactivities for the Moscow Refinery. Mr. Ivanchenko speaks fluentRussian and English.
Roman Ilyukhin, Chief Economist
Mr. Ilyukhin, age 30, holds a degree from the Plekhanov Academy ofEconomics and a PhD from the Russian National Academy ofEconomics. Prior to joining Sibir he was Chief Economist for EuroSovPetroleum (UK). Mr. Ilyukhin speaks fluent Russian and English.
Pavle Uroda, Chief Upstream Operations Officer
Mr. Uroda, age 59, has over 36 years’ experience in all areas ofupstream engineering and management. Prior to joining Sibir Mr. Uroda worked for the Croatian National Oil Company, INA,Baker Hughes, Marc Rich & Co, and most recently as CEO of theRussian independent company, Sintez. Mr. Uroda speaks fluentRussian, English and Croatian.
Andrew Harrison, Company Secretary
Mr. Harrison, age 50, is a chartered accountant who qualified withErnst & Young in 1983. Mr. Harrison has wide experience in all areas of financial control and company secretarial matters havingpreviously worked with Dana Petroleum and Caverdale Group plc,an engineering company.
Sibir’s Board and executive team has extensive experience both in Russia andinternationally. The core team is resident in Moscow which allows for seamlesscommunication with our business partners and Russian shareholders.
Mr. William L.S. Guinness, Non-Executive Chairman
Mr. Guinness, age 68, has been Chairman of Sibir since March1999, having previously been a Non-Executive Director of PentexEnergy plc and Pentex Oil plc. He is a director of Boston LifeSciences, Inc. and numerous private companies involved in a widerange of commercial activities.
Mr. L. Stuard Detmer, Deputy Chief Executive Officer
Mr. Detmer, age 44, has extensive experience in the oil industry,having previously worked with Mobil in the US, Latin America andRussia. He attended Leningrad State University and received aBachelor of Arts degree from Vanderbilt University as well as anMBA from the University of Virginia. Mr. Detmer speaks fluentRussian and Spanish.
Mr. Alexander Betsky, CA, Finance Director
Mr. Betsky, age 38, is a Canadian chartered accountant. Beforejoining Sibir in July 2000, he worked as a corporate financeexecutive at Dresdner Kleinwort Benson in Moscow and earlier as an investment banking associate with Bank Menatep in Moscow. Mr. Betsky also has three years of accounting and audit experiencewith Ernst & Young and Lippman Leebosh April in Canada. He holdsa Bachelor of Commerce degree and a Graduate Diploma in PublicAccounting, both from McGill University. He is also a member of the Canadian Institute of Chartered Accountants. Mr. Betsky speaksfluent Russian and French.
Mr. Henry O. Cameron, Chief Executive Officer
Mr. Cameron, age 68, is a Scottish solicitor by profession. Beforedevoting his full attention to the oil sector Mr. Cameron founded andwas senior partner of Peterkins, a large firm of solicitors in Scotland.Peterkins had clients deeply involved with the former Soviet Unionwhich enabled Mr. Cameron to acquire a rare working knowledge ofdoing business in Russia. He has had association with the oil sectorsince the earliest beginnings of the North Sea. In 1989 he assumedcontrol of the Pentex Oil group of companies, which in turn led to thecreation of Sibir Energy plc.
Mr. Chalva P. Tchigirinski, Non-Executive Director
Mr Tchigirinski, age 58, is the representative of the largest share-holder in Sibir. He is a well know Russian businessman. He built hisreputation as one of Russia’s leading real estate developers duringthe late eighties and throughout the nineties. His most recent realestate projects are world class and have extended his reputationworldwide. From June 2000 he has played a fundamental role in thecreation of Sibir as it is today. His business advice and guidance onall matters has proved extremely useful. His commitment to Sibir isunstinting and he is fully devoted to the realisation of optimum valuefor all Sibir shareholders. He speaks fluent English, Georgian and of course Russian.

The Board
At 31 December 2007 the Board comprised three executive Directors and two non-executive Directors, whose details are included on
pages 28 and 29.
The Board is responsible to the shareholders for the proper management of the Group. It meets formally four times a year, to review trading
performance, set and monitor strategy, examine acquisition and divestment possibilities, approve major capital expenditure projects, corporate
overhead costs, significant financing matters and report to shareholders. Matters reserved for the Board are communicated in advance of
formal meetings.
The following committees deal with specific aspects of the Group’s affairs:
Audit Committee
The Company currently does not have an Audit Committee, however it is the intention that this situation will not continue as and when new
non-executive Directors are appointed to the Board. The Audit Committee will then, once again, provide a forum for reporting by the Group’s
external auditors. It is the intention that these meetings will be attended, by invitation, by the Finance Director, the auditors and the CEO.
Remuneration Committee
The Remuneration Committee is responsible for recommending to the Board the remuneration of the executive Directors and the ongoing
review of the remuneration and other benefits of the executive Directors and senior executives; recommending from time to time the
introduction, variation or discontinuance of any benefits, including bonuses and share options and keeping under review the line of succession
of senior executives in the Group. The Remuneration Committee comprises all non-executive Directors.
The report on the Directors’ remuneration, which includes details of the Directors’ interests in options together with information on service
contracts, is set out on pages 32 and 33.
Relations with Shareholders
Communication with shareholders is conducted through correspondence, face to face meetings, press announcements, stock exchange
releases and Sibir’s website, www.sibirenergy.com. The Report of the Chairman and Chief Executive and the Financial Review include a
detailed summary of the business and future developments. The Board proposes to use Annual General Meetings (AGM) to communicate
with private and institutional investors, and welcomes their participation.
Internal controls
The Group has not complied with the Turnbull guidance on internal controls, and the Board believes that due to the current size of the
Company’s business it is not necessary to do so. Whilst the Company is quoted on AIM and as such is not required to comply with the
Turnbull guidance, the Directors continue to monitor and review the Group’s procedures and policies on internal control.
The Board acknowledges that it is responsible for establishing and maintaining the Group’s system of internal control, the effectiveness of
which is reviewed on a regular basis. The internal control system is designed to meet particular needs of the Group and the risks to which it is
exposed, and by its nature can provide reasonable, but not absolute, assurance against material misstatement or loss. In view of the size of the
Company, the Board does not consider that an internal audit function is required at present, however, the Board intends to keep this under
review.
The Group’s internal controls and the need for an internal audit function, are being considered in the light of the Group’s stated intention to
IPO in the second half of 2008 or the first half of 2009.
The key procedures which the Directors have established with a view to providing effective internal control are as follows:
30 SIBIR ENERGY PLC EXPLORATION, PRODUCTION, REFINING, MARKETING
THE WORKINGS OF THE BOARD AND ITS COMMITTEES

Management structure
The Board has overall responsibility for the Group and there is a formal schedule of matters specifically reserved for decision by the Board.
Each executive has been given responsibility for specific aspects of the Group’s affairs. The executive Directors together with the key senior
executives constitute the Executive Committee, which meets as required to discuss operational matters.
Quality and integrity of personnel
The integrity and competence of personnel is ensured through supervision and training. High quality personnel are seen as an essential part of
the control environment.
Identification of business risks
The Board is responsible for identifying the major business risks faced by the Group and for determining the appropriate course of action to
manage those risks.
Budgetary process
Each year the Board approves the annual budget. Key risk areas are identified. Performance is monitored and relevant actions taken
throughout the year through the monthly reporting to the Board of variances from the budget, updated forecasts for the year together with
information on the key risk areas.
Investment appraisal
Capital expenditure is regulated by the budgetary process and authorisation levels. For expenditure beyond specified levels, detailed written
proposals have to be submitted to the Board. Reviews are carried out after the acquisition is complete and, for some projects, during the
acquisition period, to monitor expenditure. Major overruns are investigated.
The Directors continue to monitor and review the Group’s procedures and policies on internal controls on an annual basis.
31 SIBIR ENERGY PLC EXPLORATION, PRODUCTION, REFINING, MARKETING
Policy
Whilst not mandatory for an AIM Company, the Directors have produced a Directors Remuneration Report. This report is not intended to
comply with the provisions of Schedule 7A to the Companies Act.
The Remuneration Committee comprises non-executive Directors only. The role of the Committee is to make recommendations to the Board
within agreed terms of reference on the Company’s framework of executive remuneration and its cost and to determine, on their behalf,
specific remuneration packages for each of the executive Directors including pension rights and any compensation payments. The Committee
also determines the overall remuneration policy for staff and reviews the recommendations of the executive Directors in respect of the annual
salary reviews of employees.
Directors remuneration packages are designed to attract, motivate and retain Directors of the quality needed and with the appropriate skills
and experience. Remuneration packages currently comprise basic salary and pension contributions. The Company has implemented a share
options scheme which it recognises as an important element of the remuneration package as employees are rewarded for their contribution to
enhancing shareholder value.
The fees of non-executive Directors are reviewed periodically to ensure that they are in line with the current practice. Changes are
recommended by the Chief Executive and approved by all executive Directors. The Company’s Articles of Association restrict non-executive
Director’s remuneration to an aggregate of $300,000 per annum or such other sum as the Company, in general meeting, shall from time to
time determine.
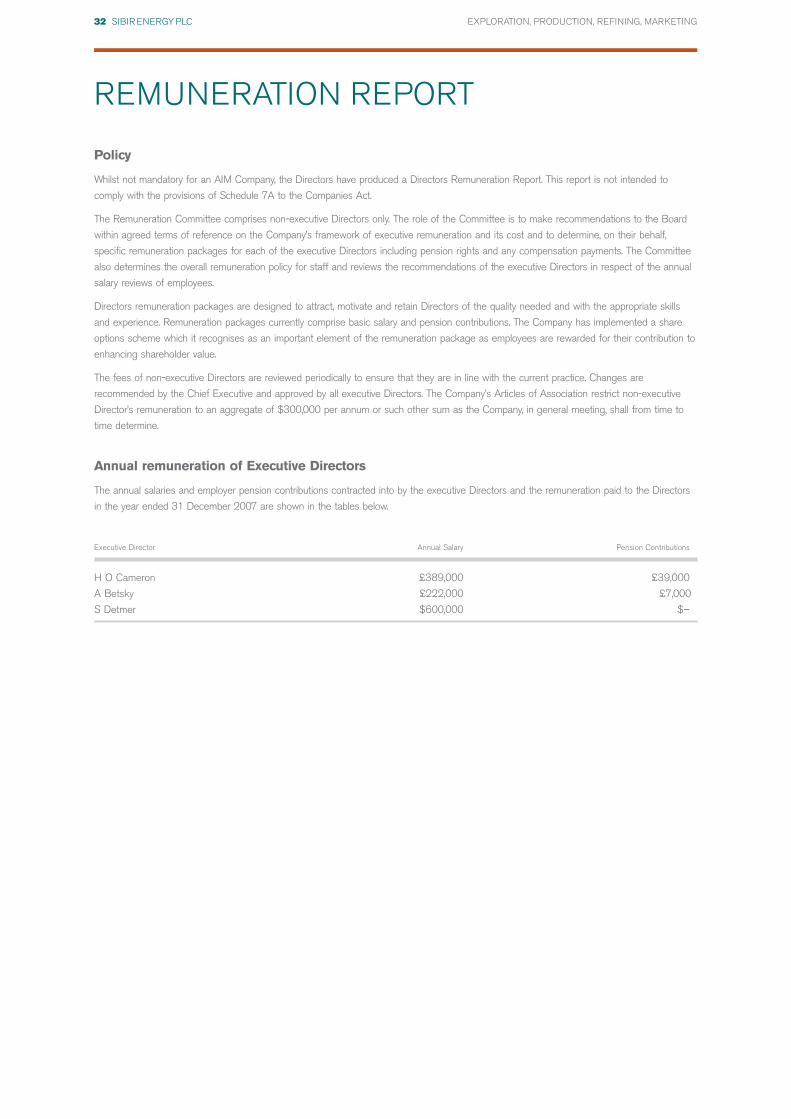
Annual remuneration of Executive Directors
The annual salaries and employer pension contributions contracted into by the executive Directors and the remuneration paid to the Directors
in the year ended 31 December 2007 are shown in the tables below.
Executive Director Annual Salary Pension Contributions
H O Cameron £389,000 £39,000
A Betsky £222,000 £7,000
S Detmer $600,000 $–
32 SIBIR ENERGY PLC EXPLORATION, PRODUCTION, REFINING, MARKETING
REMUNERATION REPORT
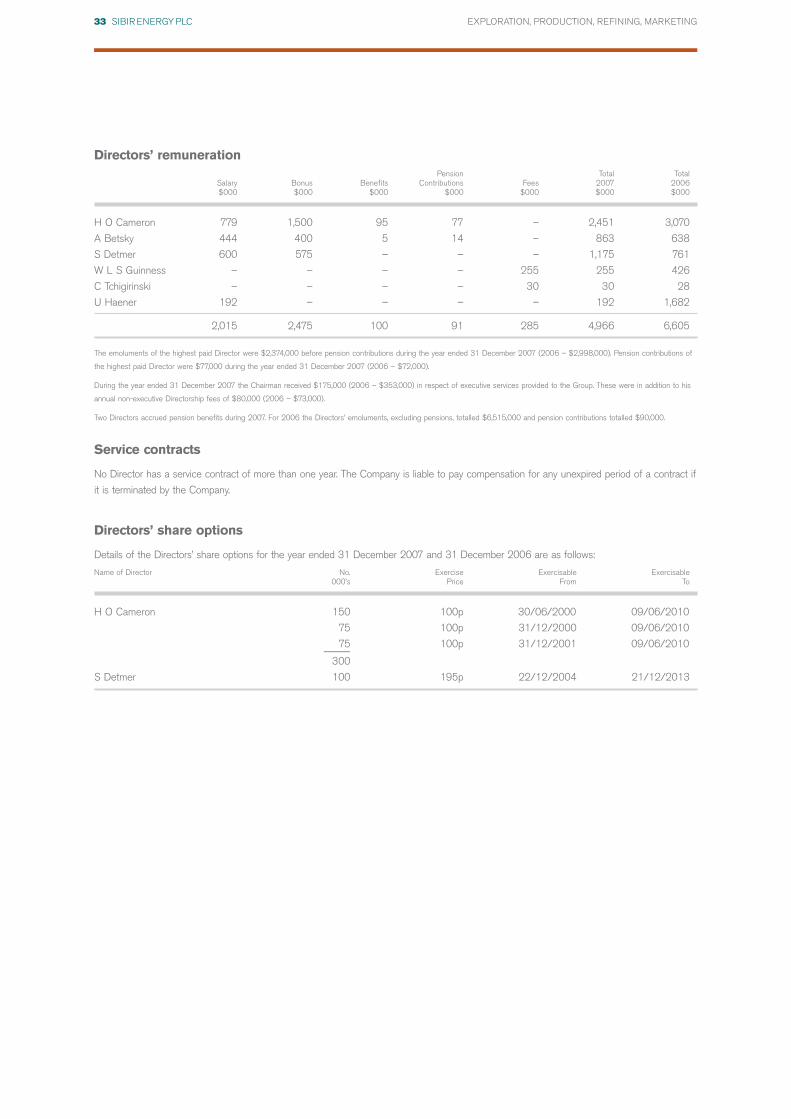
Directors’ remunerationPension Total Total
Salary Bonus Benefits Contributions Fees 2007 2006$000 $000 $000 $000 $000 $000 $000
H O Cameron 779 1,500 95 77 – 2,451 3,070
A Betsky 444 400 5 14 – 863 638
S Detmer 600 575 – – – 1,175 761
W L S Guinness – – – – 255 255 426
C Tchigirinski – – – – 30 30 28
U Haener 192 – – – – 192 1,682
2,015 2,475 100 91 285 4,966 6,605
The emoluments of the highest paid Director were $2,374,000 before pension contributions during the year ended 31 December 2007 (2006 – $2,998,000). Pension contributions of
the highest paid Director were $77,000 during the year ended 31 December 2007 (2006 – $72,000).
During the year ended 31 December 2007 the Chairman received $175,000 (2006 – $353,000) in respect of executive services provided to the Group. These were in addition to his
annual non-executive Directorship fees of $80,000 (2006 – $73,000).
Two Directors accrued pension benefits during 2007. For 2006 the Directors’ emoluments, excluding pensions, totalled $6,515,000 and pension contributions totalled $90,000.
Service contracts
No Director has a service contract of more than one year. The Company is liable to pay compensation for any unexpired period of a contract if
it is terminated by the Company.
Directors’ share options
Details of the Directors’ share options for the year ended 31 December 2007 and 31 December 2006 are as follows:
Name of Director No. Exercise Exercisable Exercisable000’s Price From To
H O Cameron 150 100p 30/06/2000 09/06/2010
75 100p 31/12/2000 09/06/2010
75 100p 31/12/2001 09/06/2010–––––
300
S Detmer 100 195p 22/12/2004 21/12/2013
33 SIBIR ENERGY PLC EXPLORATION, PRODUCTION, REFINING, MARKETING

The Directors present their report and the Group financial statements for the year ended 31 December 2007.
Results and Dividends
The Group’s profit for the year amounted to $282,427,000 (2006: profit $88,970,000).
Principal activities
The Company is an independent oil and gas exploration and production Company and is also engaged in the refining of oil and the sale of oil
and gas products. The Group’s areas of oil and gas exploration and production activity are in the Khanty-Mansiysk Okrug in Western Siberia in
the Russian Federation.
The Group’s key financial and other performance indicators performance during the year were as follows:
2007 2006 Change$000 $000 %
Group turnover 1,766,842 1,049,895 68
Operating profit 175,987 78,491 124
Share of profit from joint ventures and associate after interest and tax 112,662 3,360 n/m
Profit after tax and minority interests 282,427 88,970 217
Shareholders’ funds 2,050,161 1,030,698 99
Average no. of employees 1,003 288 248
A full review of the business for 2007 is given in the Chairman and Chief Executive’s review and the operations and financial reviews on
pages 2 to 27.
Share capital
At an Extraordinary General Meeting of the Company held on 18 September 2007 shareholders approved all the resolutions necessary for
the Directors to complete the acquisition of MOGC.
As a result Central Fuel Company (CFC), a company owned by the Moscow City Government, has subscribed for 69,714,254 new ordinary
shares in the Company in exchange for the transfer of 35,010 common shares in MOGC to the Company. The new ordinary shares were
admitted to trading on AIM at 8.00 am on 19 September 2007. At the same time, Sibir completed the acquisition of the 7,780 preferred
shares in MOGC from CFC in exchange for $200 million.
As a result, the Group now owns 100% of MOGC, and CFC owns shares in the Company representing 18.03% of Sibir’s issued share
capital. In addition CFC holds an option over a further 3.16% of the issued share capital of the Company.
Events since the Balance sheet date
MOGC and Gazpromneft shareholder agreement
MOGC and OAO Gazpromneft announced on 17 January 2008 that they have agreed the terms of a Memorandum of Understanding (MOU)
which provides for a board and management structure of the Moscow Oil Refinery (MOR) acceptable to all concerned. The MOU provides for
the steps and mechanisms to ensure a long term and transparent relationship between the parties as shareholders at the MOR.
The underlying principle of the MOU is that of parity and transparency in respect of all key issues. The new structure, when implemented
following the formal documentation of the MOU into a shareholders’ agreement, will also allow the parties to participate fully in the
implementation of the planned upgrade of the MOR.
Orton Oil Company Limited and Gradison Consultant Inc
On 12 March 2008 and 14 March 2008 the Company entered into agreements with Orton Oil Company Limited and Gradison Consultant Inc
(both related parties of the Group) respectively to procure the sale of their shares in Avtocard and Korimos (representing 50% of the ordinary
shares of these companies). The sale is conditional upon the Company managing the businesses for a period not exceeding six months. The
Company has indemnified the vendors against any losses which may occur as a result of the Company’s management.
During this period of management the Company will finalise the acquisition price which will be not less than $60 million and not more than
$96 million. In consideration of the above the Company has paid deposits of $38 million to Orton Oil Company Limited and $10 million to
Gradison Consultant Inc both of which are fully refundable should the Company decide not to proceed with the acquisition.
The Group’s joint venture, the Moscow Oil Refinery, owns the other 50% interest in these companies.
34 SIBIR ENERGY PLC EXPLORATION, PRODUCTION, REFINING, MARKETING
DIRECTORS’ REPORT

Directors
The Directors holding office at the end of the year ended 31 December 2007 had the following interests in the New Ordinary Shares of the
Company:
31 December 2007 1 January 2007or the date of appointment, if later
Ordinary Shares Options Ordinary Shares Options
W L S Guinness[i] 1,264,993 – 1,264,993 –
H O Cameron 1,026,427 300,000 1,026,427 300,000
A Betsky – – – –
C Tchigirinski[ii] 180,336,643 – 180,336,643 –
S Detmer – 100,000 – 100,000
All the holdings are beneficially held unless otherwise indicated.
[i] Held by a company owned by a trust in which Mr Guinness has a discretionary interest.
[ii] Held through the ownership of Bennfield Limited, in which Mr Tchigirinski has an interest.
No Director had any interest in the shares of subsidiary undertakings or any other Group undertakings.
On 9 February 2008 Mr Cameron gifted a total of 330,000 ordinary shares of 10p (20c) each in the capital of the Company to members of his immediate family.
Directors’ qualifying third party indemnity provisions
The Company has a Directors and Officers insurance policy to cover the Directors and Officers against liability in respect of proceedings
brought by third parties, subject to the conditions set out in the Companies Act 1985. Such qualifying third party indemnity provision remains
in force as at the date of approving the Directors’ Report.
Substantial Shareholders
At 1 June 2008 the Company had been notified of the following interests of 3% or more in the nominal value of the Company’s ordinary
shares.
No. of shares %
Bennfield Limited 180,336,643 46.65
Central Fuel Company 69,714,254 18.03
M & G Investment Management Limited 24,546,117 6.35
BlackRock Investment Management Limited 22,052,242 5.70
Creditors payment policy
It is the Company’s policy that payments to suppliers are made in accordance with those terms and conditions agreed between the Company
and its individual suppliers, provided that all trading terms and conditions have been complied with.
At 31 December 2007, the Company had an average of 30 days purchases outstanding in trade creditors.
35 SIBIR ENERGY PLC EXPLORATION, PRODUCTION, REFINING, MARKETING

Conversion to IFRS
To satisfy its reporting obligations, the Company is now preparing its financial statements in accordance with International Financial Reporting
Standards (IFRS).
Under AIM rules the Company was required to adopt IFRS during 2007 with effect from 1 January 2006. As a result of the Company’s
intended move to the Official List, and the resulting requirement to include three years of historical financial information in its Prospectus, the
Board has elected that the date of transition to IFRS will be with effect from 1 January 2005, one year earlier than required by the AIM rules.
This election was made to enable the Company to present the 2005 financial information on a consistent basis with the 2006 and 2007
financial information to be included in the Prospectus.
As a result of the Company’s date of transition to IFRS being one year earlier than mandated, the Company has been required to separately
publish its 2006 financial statements, with 2005 presented as comparative financial information, in accordance with IFRS.
In addition, the Board has also taken the opportunity to change the Company’s reporting currency from Pound Sterling to US Dollars. This is in
line with the reporting currency of other companies within Sibir’s sector, and also reflects the fact that the majority of the Group’s businesses
are influenced by pricing of commodities with a US Dollar economic environment.
The 2006 US Dollar IFRS financial statements, together with the special purpose audit report thereon, are available on the Company’s
website, www.sibirenergy.com.
Disclosure of information to the auditors
So far as each person who was a Director at the date of approving this report is aware, there is no relevant audit information, being
information needed by the auditor in connection with preparing its report, of which the auditor is unaware. Having made enquiries of fellow
Directors and the Group’s auditor, each Director has taken all the steps that he is obliged to take as a Director in order to make himself aware
of any relevant audit information and to establish that the auditor is aware of that information.
Auditors
Ernst & Young LLP have expressed their willingness to continue as auditors and their reappointment will be proposed at the Annual General
Meeting in accordance with Section 385 of the Companies Act 1985.
Board changes during 2008
In accordance with the Articles of Association, Messrs Cameron and Tchigirinski retire by rotation and, being eligible, offer themselves for
re-election.
By order of the Board
A Harrison
Secretary
Date: 30 June 2008
36 SIBIR ENERGY PLC EXPLORATION, PRODUCTION, REFINING, MARKETING
The Directors are responsible for preparing the Annual Report and the Group financial statements in accordance with applicable United
Kingdom law and those International Financial Reporting Standards as adopted by the European Union.
The Directors are required to prepare Group financial statements for each financial year which present fairly the financial position of the Group
and the financial performance and cash flows of the Group for that period. In preparing those Group financial statements the Directors are
required to:
• select suitable accounting policies in accordance with IAS 8: Accounting Policies, Changes in Accounting Estimates and Errors and then
apply them consistently;
• present information, including accounting policies, in a manner that provides relevant, reliable, comparable and understandable
information;
• provide additional disclosures when compliance with the specific requirements in IFRSs is insufficient to enable users to understand the
impact of particular transactions, other events and conditions on the Group’s financial position and financial performance; and
• state that the Group has complied with IFRSs, subject to any material departures disclosed and explained in the financial statements.
The Directors are responsible for keeping proper accounting records which disclose with reasonable accuracy at any time the financial position
of the Group and enable them to ensure that the Group financial statements comply with the Companies Act 1985. They are also responsible
for safeguarding the assets of the Group and hence for taking reasonable steps for the prevention and detection of fraud and other
irregularities.
37 SIBIR ENERGY PLC
STATEMENT OF DIRECTORS’RESPONSIBILITIES in respect of the Financial Statements
EXPLORATION, PRODUCTION, REFINING, MARKETING

We have audited the Group financial statements of Sibir Energy plc for the year ended 31 December 2007 which comprise the Group Income
Statement, the Group Balance Sheet, the Group Cash flow statement, the Group Statement of Changes in Equity and the related notes 1 to
40. These Group financial statements have been prepared under the accounting policies set out therein.
We have reported separately on the parent Company financial statements of Sibir Energy plc for the year ended 31 December 2007.
This report is made solely to the company’s members, as a body, in accordance with Section 235 of the Companies Act 1985. Our audit
work has been undertaken so that we might state to the company’s members those matters we are required to state to them in an auditor’s
report and for no other purpose. To the fullest extent permitted by law, we do not accept or assume responsibility to anyone other than the
company and the company’s members as a body, for our audit work, for this report, or for the opinions we have formed.
Respective responsibilities of Directors and auditors
The Directors’ responsibilities for preparing the Annual Report and the group financial statements in accordance with applicable United
Kingdom law and International Financial Reporting Standards (IFRSs) as adopted by the European Union are set out in the Statement of
Directors’ Responsibilities.
Our responsibility is to audit the group financial statements in accordance with relevant legal and regulatory requirements and International
Standards on Auditing (UK and Ireland).
We report to you our opinion as to whether the Group financial statements give a true and fair view and whether the Group financial
statements have been properly prepared in accordance with the Companies Act 1985. We also report to you whether in our opinion the
information given in the directors’ report is consistent with the financial statements.
In addition we report to you if, in our opinion, we have not received all the information and explanations we require for our audit, or if
information specified by law regarding directors’ remuneration and other transactions is not disclosed.
We read other information contained in the Annual Report and consider whether it is consistent with the audited group financial statements.
The other information comprises only the report of the Chairman and Chief Executive, the Downstream Operations review, the Upstream
Operations Review, the Financial Review, the Remuneration Report and the Directors’ Report. We consider the implications for our report if we
become aware of any apparent misstatements or material inconsistencies with the group financial statements. Our responsibilities do not
extend to any other information.
Basis of audit opinion
We conducted our audit in accordance with International Standards on Auditing (UK and Ireland) issued by the Auditing Practices Board. An
audit includes examination, on a test basis, of evidence relevant to the amounts and disclosures in the group financial statements. It also
includes an assessment of the significant estimates and judgments made by the directors in the preparation of the group financial statements,
and of whether the accounting policies are appropriate to the Group’s circumstances, consistently applied and adequately disclosed.
We planned and performed our audit so as to obtain all the information and explanations which we considered necessary in order to provide
us with sufficient evidence to give reasonable assurance that the group financial statements are free from material misstatement, whether
caused by fraud or other irregularity or error. In forming our opinion we also evaluated the overall adequacy of the presentation of information
in the group financial statements.
Opinion
In our opinion:
• the Group financial statements give a true and fair view, in accordance with IFRSs as adopted by the European Union, of the state of the
Group’s affairs as at 31 December 2007 and of its profit for the year then ended;
• the Group financial statements have been properly prepared in accordance with the Companies Act 1985; and
• the information given in the directors’ report is consistent with the Group financial statements.
Ernst & Young LLP
Registered auditor
London
30 June 2008
38 SIBIR ENERGY PLC EXPLORATION, PRODUCTION, REFINING, MARKETING
INDEPENDENT AUDITOR’S REPORT TOTHE MEMBERS OF SIBIR ENERGY PLC

For the year ended 31 December2007 2006
Note $000 $000
Revenue 5 1,766,842 1,049,895
Cost of sales (1,572,131) (941,033)
Gross profit 194,711 108,862
Administrative expenses (73,212) (29,785)
Other gains (losses) – net 9 54,488 (586)
Operating profit 6 175,987 78,491
Finance income 10 95,371 51,216
Finance costs 10 (40,348) (21,092)
Share of profit from joint ventures and associates
net of interest and tax 17, 18 112,662 3,360
Profit before taxation 343,672 111,975
Taxation 11 (61,245) (23,005)
Profit for the year 282,427 88,970
Attributable to:
Equity holders of the Company 33 277,784 85,358
Minority interest 34 4,643 3,612
282,427 88,970
Earnings per share for profit attributable to the
equity holders of the Company during the year
(expressed in cents per share)
– Basic 12 82.50 30.65
– Diluted 12 82.39 30.60
The notes 1 to 40 form an integral part of these consolidated financial statements.
39 SIBIR ENERGY PLC EXPLORATION, PRODUCTION, REFINING, MARKETING
CONSOLIDATED GROUPINCOME STATEMENT

As at 31 December2007 2006
Note $000 $000
Assets
Non-current assets
Property, plant and equipment 14 173,411 86,586
Intangible assets 16 472,587 24,753
Investments in joint ventures accounted for using the equity method 17 967,162 47,486
Investments in associates 18 199,260 180,477
Available-for-sale financial assets 20 54 24,541
Trade and other receivables 22 508,996 556,892
2,321,470 920,735
Current assets
Inventories 23 73,673 24,510
Trade and other receivables 22 432,579 172,555
Cash and cash equivalents 24 293,265 216,748
799,517 413,813
Assets classified as held for sale 15 3,313 –
Total assets 3,124,300 1,334,548
Liabilities
Current liabilities
Borrowings 27 (310,380) (134,330)
Trade and other payables 25 (167,854) (47,914)
Income tax payable (30,263) (1,042)
(508,497) (183,286)
Non-current liabilities
Borrowings 27 (303,332) (69,667)
Trade and other payables 25 (242) (13,667)
Deferred income tax liabilities 28 (109,670) (22,854)
Provisions 29 (78,706) (3,478)
(491,950) (109,666)
Net assets 2,123,853 1,041,596
Equity
Capital and reserves attributable to equity holders of the Company
Called up share capital 31 100,704 86,766
Share premium 31 1,609,179 914,371
Other reserves 32 51,952 1,867
Retained earnings 33 288,326 27,694
2,050,161 1,030,698
Minority interest in equity 34 73,692 10,898
Total minority interest and shareholders’ equity 2,123,853 1,041,596
The financial statements comprising the consolidated Group income statement, balance sheet, statement of changes in equity and cash flow
statement were approved and authorised for issue by the Board of Directors on 30 June 2008 and were signed on its behalf by:
H Cameron A Betsky
Director Director
The notes 1 to 40 form an integral part of these consolidated financial statements.
40 SIBIR ENERGY PLC EXPLORATION, PRODUCTION, REFINING, MARKETING
CONSOLIDATED GROUPBALANCE SHEET

Share Share Other Retained Minority capital premium reserves earnings Total interest Total$000 $000 $000 $000 $000 $000 $000
Note 31 31 32 33 34
At 1 January 2006 373,085 207,341 9,317 (362,350) 227,393 8,353 235,746
Gains on revaluation of available-
for-sale financial assets – – 2,585 – 2,585 – 2,585
Currency translation adjustments – – (10,035) – (10,035) – (10,035)
Total income and expense for the
year recognised directly in equity – – (7,450) – (7,450) – (7,450)
Profit for the year – – – 85,358 85,358 3,612 88,970
Total income and expense for
the year – – (7,450) 85,358 77,908 3,612 81,520
Shares issued 18,367 707,030 – – 725,397 – 725,397
Reduction of share capital (304,686) – – 304,686 – – –
Changes in minority due to
share acquisitions – – – – – (1,067) (1,067)
At 31 December 2006 86,766 914,371 1,867 27,694 1,030,698 10,898 1,041,596
Loss on revaluation of available-
for-sale financial assets – – (376) – (376) – (376)
Currency translation adjustments – – 50,513 – 50,513 2,212 52,725
Recycled foreign currency
translation losses – – 3,624 – 3,624 – 3,624
Total income and expense for the
year recognised directly in equity – – 53,761 – 53,761 2,212 55,973
Profit for the year – – – 277,784 277,784 4,643 282,427
Total income and expense for
the year – – 53,761 277,784 331,545 6,855 338,400
Acquisition of subsidiary 13,938 694,808 23,322 – 732,068 55,939 788,007
Dividends paid – – – (44,150) (44,150) – (44,150)
Reclassification of cumulative
translation differences following
change in functional currency – – (26,998) 26,998 – – –
At 31 December 2007 100,704 1,609,179 51,952 288,326 2,050,161 73,692 2,123,853
41 SIBIR ENERGY PLC EXPLORATION, PRODUCTION, REFINING, MARKETING
STATEMENT OF CHANGES INSHAREHOLDERS’ EQUITY

For the year ended 31 December
2007 2006(restated)
Note $000 $000
Cash flows from operating activities
Cash generated from operations 35 176,422 (15,097)
Interest received 14,904 3,668
Interest paid (35,806) (24,228)
Tax paid (80,700) (25,828)
Net cash flow from operating activities 74,820 (61,485)
Cash flows from investing activities
Purchase of property, plant and equipment 14 (13,528) (18,679)
Proceeds from disposal of property, plant and equipment 14 221 37
Purchase of intangible assets 16 (4,396) –
Purchase of Koltogorsky licences (50,000) -
Loans to joint ventures (31,000) –
Repayment of loans from joint ventures 76,000 (126,378)
Repayment of other loans 43,206 –
Loans to other entities – (15,919)
Purchase assets held for sale (5,117) –
Dividends received 15,138 –
Redemption of promissory notes – 14,584
Acquisition of subsidiaries 21 (293,939) –
Net cash flow from investing activities (263,415) (146,355)
Cash flows from financing activities
Proceeds from issue of shares – 561,692
Dividends paid 13 (44,150) –
Proceeds from loans 630,219 424,685
Repayment of loans (330,757) (602,650)
Finance lease payments (1,049) –
Net cash flow from financing activities 254,263 383,727
Net increase in cash and cash equivalents 65,668 175,887
Opening cash and cash equivalents 24 216,748 23,609
Effect of exchange rate changes on cash and cash equivalents 10,849 17,252
Closing cash and cash equivalents 24 293,265 216,748
The notes 1 to 40 form an integral part of these consolidated financial statements.
42 SIBIR ENERGY PLC EXPLORATION, PRODUCTION, REFINING, MARKETING
CONSOLIDATED GROUP CASH FLOW STATEMENT

1 GENERAL INFORMATION
Sibir Energy plc (‘the Company’) is a company domiciled and incorporated in the United Kingdom under the Companies Act 1985. The
address and registered office is 17c Curzon Street, London, W1J 5HU. The Company is listed on the Alternative Investment Market (AIM),
London.
Sibir Energy plc and its subsidiaries (together ‘the Group’) are involved in oil and gas exploration and production and are also engaged in the
refining of oil and the sale of oil and gas products. The Group’s areas of oil and gas exploration and production activity are in the Khanty-
Mansiysk Okrug area in Western Siberia in the Russian Federation.
These consolidated financial statements for the year ended 31 December 2007 were authorised for issue by the Board of Directors on
30 June 2008.
2 SUMMARY OF SIGNIFICANT ACCOUNTING POLICIES
Introduction
This report contains the consolidated financial statements under the basis of preparation and principal accounting policies set out below. These
policies have been consistently applied to all the years presented, unless otherwise stated.
Basis of preparation
These consolidated financial statements have been prepared on the going concern basis in accordance with International Financial Reporting
Standards (IFRS) and International Financial Reporting Interpretations Committee (IFRIC) interpretations endorsed by the European Union
(EU) and with those parts of the Companies Act 1985 applicable to companies reporting under IFRS.
The preparation of financial statements in conformity with IFRS requires the use of certain critical accounting estimates. It also requires
management to exercise its judgement in the process of applying the Group’s accounting policies. The areas involving a higher degree of
judgement or complexity, or areas where assumptions and estimates are significant to the consolidated financial statements are disclosed in
Note 4.
Changes in accounting policy
The accounting policies adopted are consistent with those of the previous financial year except as follows:
The Group has adopted the following new and amended IFRS and IFRIC interpretations during the year. Adoption of these revised standards
and interpretations did not have any effect on the financial performance or position of the Group in the current or prior periods. In certain
cases, they did however give rise to additional disclosures, including in some cases, revisions to accounting policies.
IFRS 7 Financial Instruments: Disclosures
IAS 1 Amendment – Presentation of Financial Statements
IFRIC 8 Scope of IFRS 2
IFRIC 9 Reassessment of Embedded Derivatives
IFRIC 10 Interim Financial Reporting and Impairment
The Group has also early adopted the following IFRIC interpretation. Adoption of this interpretation did not have any effect on the financial
performance or position of the Group.
IFRIC 11 IFRS 2 – Group and Treasury Share Transactions
The principal effects of these changes are as follows:
IFRS 7 Financial Instruments: Disclosures
This standard requires disclosures that enable users of the financial statements to evaluate the significance of the Group’s financial
instruments and the nature and extent of risks arising from those financial instruments. The new disclosures are included throughout the
financial statements. While there has been no effect on the financial position or results, comparative information has been revised where
necessary.
43 SIBIR ENERGY PLC EXPLORATION, PRODUCTION, REFINING, MARKETING
NOTES TO THE CONSOLIDATEDFINANCIAL STATEMENTS

IAS 1 Presentation of financial statements
This amendment requires the Group to make new disclosures to enable users of the financial statements to evaluate the Group’s objectives,
policies and processes for managing capital. These new disclosures are shown in the capital management section of the Operating and
Financial Review.
IFRIC 8 Scope of IFRS 2
This interpretation requires IFRS 2 to be applied to any arrangements in which the entity cannot identify specifically some or all of the goods
received, in particular where equity instruments are issued for consideration which appears to be less than fair value. As equity instruments are
only issued to employees in accordance with the employee share scheme, the interpretation has no impact on the financial position or
performance of the Group.
IFRIC 9 Reassessment of embedded derivatives
This interpretation states that the date to assess the existence of an embedded derivative is the date that an entity first becomes a party to
the contract, with reassessment only if there is a change to the contract that significantly modifies the cash flows. As the Group has no
embedded derivative requiring separation from the host contract, the interpretation has no impact on the financial position or performance of
the Group, but our accounting policy for such items has been amended accordingly.
IFRIC 10 Interim financial reporting and impairment
The Group adopted IFRIC 10 as of 1 January 2007, which requires that an entity must not reverse an impairment loss recognised in a
previous interim period in respect of goodwill or an investment in either an equity instruments or a financial asset carried at cost. As the Group
had no impairment losses previously reversed, the interpretation had no impact on the financial position or performance of the Group.
IFRIC 11 IFRS 2 – Group and treasury share transactions
The Group has elected to adopt IFRIC 11 as of 1 January 2007, insofar as it applies to consolidated financial statements. This interpretation
requires arrangements whereby an employee is granted rights to an entity’s instruments to be accounted for as an equity-settled scheme, even
in if the entity buys the instruments from another party, or the shareholders provide the equity instruments needed.
The following standards and interpretations to existing standards that are not yet effective havenot been early adopted by the Group:
IFRIC 7 Applying the Restatement Approach under IAS 29, Financial Reporting in Hyperinflationary Economies (effective
for annual periods beginning on or after 1 March 2006).
IFRIC 7 provides guidance on how to apply requirements of IAS 29 in a reporting period in which an entity identifies the existence of
hyperinflation in the economy of its functional currency, when the economy was not hyperinflationary in the prior period. As none of the Group
entities has a currency of a hyperinflationary economy as its functional currency, IFRIC 7 is not relevant to the Group’s operations.
IFRS 8 Operating segments
This standard requires disclosure of information about the Group’s operating segments and replaced the requirement to determine primary
(business) and secondary (geographical) reporting segments of the Group. The Group determined that the operating segments were the same
as the business segments previously identified under IAS 14 Segment Reporting.
IAS 23 Borrowing costs
The standard has been revised to require capitalisation of borrowing costs when such costs relate to a qualifying asset. A qualifying asset is an
asset that necessarily takes a substantial period of time to get ready for its intended use or sale. In accordance with the transitional
requirements in the Standard, the Group will adopt this as a prospective change, IAS 23 becomes effective for financial years beginning on or
after 1 January 2009. Accordingly, borrowing costs will be capitalised on qualifying assets with a commencement date after 1 January 2009.
No changes will be made for borrowing costs incurred to this date that have been expensed.
IFRIC 12 Service concession arrangements
IFRIC Interpretation 12 was issued in November 2006 and becomes effective for annual periods beginning on or after 1 January 2008. This
Interpretation applies to service concession operators and explains how to account for the obligations undertaken and rights received in
service concession arrangements. No member of the Group is an operator and hence this Interpretation will have no impact on the Group.
44 SIBIR ENERGY PLC EXPLORATION, PRODUCTION, REFINING, MARKETING

IFRIC 13 Customer loyalty programmes
IFRIC Interpretation 13 was issued in June 2007 and becomes effective for annual periods beginning on or after 1 July 2008. This
Interpretation requires customer loyalty award credits to be accounted for as a separate component of the sales transaction in which they are
granted and therefore part of the fair value of the consideration received is allocated to the award credits and deferred over the period that
the award credits are fulfilled. The Group expects that this interpretation will have no impact on the Group’s financial statements as no such
schemes currently exist.
IFRIC 14 IAS 19 The limit on a defined benefit asset, minimum funding requirements and their interaction
IFRIC Interpretation 14 was issued in July 2007 and becomes effective for annual periods beginning on or after 1 January 2008. This
Interpretation provides guidance on how to assess the limit on the amount of surplus in a defined benefit scheme that can be recognised as
an asset under IAS 19 Employee Benefits. The Group expects that this Interpretation will have no impact on the financial position or
performance of the Group.
Presentational currency
In the 2006 financial statements, the functional currency of Sibir Energy plc (the Company) was Pound Sterling. Although the Company is
domiciled in the UK the Group’s operations are based in the Russian Federation. The functional currency of the Group’s various entities is
either the Russian Rouble or US Dollar. This is due to the direct or indirect linkage of oil and oil product prices to the US Dollar, even when
some trades are priced and settled in Roubles. As a result the 2006 financial comparatives together with the 2007 financial statements have
been presented in US Dollars ($).
This is a change from prior years and the Group’s last published interims when the financial statements were presented in Pound Sterling.
Assets and liabilities were translated into US Dollars using the closing rate at the 2006 balance sheet date. Income, expenses and cashflows
recognised in the period were translated at an average US Dollar exchange rate for the period. Resulting exchange differences were reflected
as currency translation adjustments and included in the cumulative currency translation reserve.
Equity and share capital items were translated using the historic closing rate applicable on 1 January 2005 and were not re translated at each
subsequent balance sheet date. All share capital transactions which were effected after 1 January 2005 were recorded using an exchange
rate which prevailed at the date of those transactions.
The applicable exchange rates used for 2006 were:
Period Ended 1 January 2006 31 December 2006
Average 0.5498 0.5444
Closing Rate 0.5825 0.5109
Basis of consolidation
The consolidated financial statements incorporate the results of the Company and its subsidiary undertakings that are directly or indirectly
controlled by the Company.
Subsidiaries
Subsidiaries are entities over which the Group has the ability to control the financial and operating policies, either through a shareholding of
more than fifty percent of the voting rights, a right to exercise a controlling influence or to obtain the majority of the benefits and be exposed
to the majority of the risks. Subsidiaries are consolidated from the date on which control transfers to the Group. They are de-consolidated from
the date on which control ceases.
The acquisition method of accounting is used to account for the purchase of subsidiaries by the Group. The cost of an acquisition is measured
as the fair value of the assets acquired, any equity instruments issued and liabilities incurred or assumed at the date of acquisition, plus any
costs directly attributable to the acquisition. The identifiable assets, liabilities including any contingent liabilities assumed in a business
combination are measured initially at their fair values at the date of acquisition. Any excess of the cost of acquisition over the fair value of the
Group’s share of the identifiable net assets acquired is recorded as goodwill. If the cost of acquisition is less than the fair value of the net
assets of the subsidiary acquired, the difference is recognised directly in the income statement.
Inter-company transactions, balances and unrealised gains on transactions between Group companies are eliminated as part of the
consolidation process. Unrealised losses are also eliminated unless the transaction provides evidence of an impairment of the asset
transferred. Accounting policies of subsidiaries have been changed where necessary to ensure consistency with the policies adopted by the
Group.
45 SIBIR ENERGY PLC EXPLORATION, PRODUCTION, REFINING, MARKETING
Associates
Investments where the Company has significant influence, but not control or joint control, are accounted for as an associate. Significant
influence is the power to participate in the financial and operating policy decisions of the investee entity but not control or joint control over
those policies.
Financial statements of associates are prepared for the same reporting year as the Group. Where necessary, adjustments are made to those
financial statements to bring the accounting policies into line with those used by the Group. Unrealised gains or losses arising from
transactions between the Group and associates are eliminated to the extent of the Group’s interest in the associates’ equity.
In the consolidated financial statements, associates are consolidated using the equity method. The share of earnings recorded in the
consolidated financial statements are based on the after tax earnings of the associates. In the income statement, the share of earnings from
associates is shown after Operating profit.
The investment in associate is carried in the balance sheet at the Group’s share of the fair value of the associate’s net assets at the date of
acquisition plus post-acquisition changes in the Group’s share of net assets of the associate, less any impairment in value.
Joint ventures
An investment in a joint venture is where contractual arrangements between two or more participants gives each investee joint control over the
business.
Financial statements of jointly controlled entities are prepared for the same reporting year as the Group. Where necessary, adjustments are
made to those financial statements to bring the accounting policies into line with those used by the Group. Unrealised gains or losses arising
from transactions between the Group and the joint venture are eliminated to the extent of the Group’s interest in the joint venture’s equity.
In the consolidated financial statements, joint ventures are consolidated using the equity method. The share of earnings recorded in the
consolidated financial statements are based on the after tax earnings of the joint venture. In the income statement, the share of earnings from
joint ventures is shown after operating profit.
Segment reporting
Segment reporting follows the Group’s internal reporting structure, and accordingly its primary segment reporting is by business segment. A
business segment is engaged in providing products within a particular economic environment that is subject to risks and returns that are
different from those segments operating in other economic environments. In the opinion of the Directors’ the operations of the Group comprise
two classes of business:
• Exploration & Production
• Refining, Marketing & Distribution
Foreign currency translation
Functional currency
The functional currency of Sibir Energy plc (the Company) was changed from 1 July 2007 from Pounds Sterling to the US Dollar as a result
of a significant change in circumstances. The significant circumstances that resulted in the necessary change of the functional currency of the
Company to US Dollars were an increase in US Dollar funding for the MOGC purchase, repayment by SPD of previous US Dollar lendings
and the distributable funds used to pay a dividend originating in US Dollars. As a result the Group and Company financial statements have
been presented for the first time in US Dollars, which is the functional currency of the majority of the members of the Group. This is a change
from prior years when the financial statements were presented in pound sterling in line with the previous functional currency of the Company.
The change in the functional currency has been applied prospectively.
The Company is domiciled in the UK, which is its primary economic environment but as noted above the Company’s functional currency is US
Dollar. Whilst the Group’s operations are based in the Russian Federation, the functional currency of the Group’s various entities is either the
Russian Rouble or US Dollar. This is due to the direct or indirect linkage of Oil and Oil Product prices to the US Dollar, even when contracts
are priced and settled in Roubles.
Items included in the financial statements of each of the Group entities are measured using the functional currency of the primary economic
environment in which the entity operates. Transactions and balances are converted to the Group’s presentational currency on the basis set out
below.
46 SIBIR ENERGY PLC EXPLORATION, PRODUCTION, REFINING, MARKETING
Transactions and balances
Foreign currency transactions are translated into the functional currency using the exchange rates prevailing at the dates of the transactions.
Foreign currency gains and losses resulting from the settlement of such transactions and from the translation at year end exchange rates of
monetary assets and liabilities denominated in foreign currencies are recognised in the income statement. Foreign exchange gains or losses
arising on the translation of long term monetary assets, where there is no intention to seek repayment for the foreseeable future and the
investment is of a long term nature, form part of the Group’s investment in the net assets of a foreign operation. The foreign exchange gain or
loss arising on translation is recognised as a separate component in equity.
Translation differences on non-monetary financial assets and liabilities are reported as part of the fair value gain or loss. The exchange rate
used to translate Pound Sterling into US Dollars at 31 December 2007 was 1.9906 and the average rate was 1.9739.
Group companies
The results and financial position of all the Group entities that have a functional currency different from the presentation currency are
translated into the presentation currency as follows:
• assets and liabilities for each balance sheet presented are translated at the closing rate at the date of that balance sheet;
• income and expenses for each income statement are translated at average exchange rates; and
• all resulting exchange differences are recognised as a separate component of equity.
On consolidation, exchange differences arising from the translation of the net investment in foreign operations, and of borrowings and other
currency instruments entered into as hedges of such investments, are taken to shareholders’ equity. When a foreign operation is partially
disposed of or sold, exchange differences that were recorded in equity are recognised in the income statement as part of the gain or loss on
sale.
Goodwill and fair value adjustments arising on the acquisition of a foreign operation are treated as assets and liabilities of the foreign
operation and translated at the closing rate.
Oil and gas assets
Exploration and evaluation
(a) Pre-licence expenditure
Any expenditure incurred relating to Exploration and evaluation and similar activities prior to obtaining a field exploration or development
licence (or similar rights) are expensed as incurred.
(b) Licence costs
The cost of acquiring an exploration/development licence (or similar rights) are capitalised and classified as an intangible asset. Incidental
costs relating to the acquisition of the licence are capitalised as part of the cost of acquisition.
Licence costs will be amortised over the expected remaining life of the licence on a straight line basis from the point that production
commences. The licence asset will be subject to impairment review as required by our accounting policy for impairment.
(c) Exploration and evaluation expenditure
All post licence, pre-production expenditure is capitalised as Exploration and evaluation costs in the balance sheet either as an intangible, or
property, plant and equipment (PP&E) item, depending on the nature of the expenditure. The type of expenditure, which will be capitalised,
includes:
• topographical, geological, geochemical and geophysical studies;
• exploratory drilling;
• trenching;
• sampling; and
• activities in relation to evaluating the technical feasibility and commercial viability of extracting the Oil & Gas.
47 SIBIR ENERGY PLC EXPLORATION, PRODUCTION, REFINING, MARKETING

On completion of exploration and evaluation of a field, the associated exploration and evaluation assets in property, plant and equipment and
any exploration and evaluation intangible assets (other than those which can be separately identifiable, such as licences) are reclassified as
development and production assets within property, plant and equipment category at cost less any impairment charged. Exploration and
evaluation is deemed to be completed when proved reserves of oil and natural gas are determined to be commercially viable, technically
feasible and development is authorised by management.
(d) Amortisation and depreciation
Intangible exploration and evaluation assets are not subject to amortisation until production commences.
Property, plant and equipment that are consumed in developing an intangible exploration and evaluation asset are subject to depreciation over
their useful economic lives. The depreciation amount reflecting that consumption will be capitalised as part of the cost of developing the
intangible exploration and evaluation asset.
(e) Impairment
Exploration and evaluation expenditure is assessed for impairment purposes when facts and circumstances suggest that the carrying amount
of exploration and evaluation assets may exceed their recoverable amount on an individual cash generating unit basis in accordance with the
principles set out in IAS 36 Impairment of assets.
If the prospects of generating commercially viable reserves are subsequently determined to be unlikely on completion of evaluation, the
associated costs are expensed in the period in which that determination is made.
Development and production
All capitalised costs associated with developed fields are classified as ‘development and production’ assets (an individual category within
property, plant and equipment) or within intangibles, depending on the nature of the assets. Costs capitalised within development and
production assets include items such as the acquisition and installation of production facilities, pipelines, development drilling costs, project
related engineering and other technical and services costs.
Development assets are depreciated using either the straight line or unit of production basis:
(a) Straight line basis
Assets whose value is depleted with the passage of time are depreciated on a straight line basis over the asset’s expected useful economic
life, which can be summarised as follows:
General plant and machinery 4 to 10 years
Pipeline and related equipment 7 to 15 years
Oil and gas treatment facilities 4 to 15 years
Electricity generating assets 7 to 25 years
(b) Unit of production
Assets whose value is depleted in accordance with the volume of production are depreciated on a unit of production basis in the proportion of
actual production for the period to the total remaining commercial reserves. Depreciation commences from the commencement of production
in the fields concerned. The remaining commercial reserves are those estimated at the end of the period plus production during the period,
and are based on proved and probable reserves utilising Russian A, B and C1 reserves classifications. For depletion purposes only, an estimate
of the future cost of developing the reserves is included. This estimate is based on a current period estimate and does not allow for future
price changes. Changes in these estimates are dealt with prospectively.
Abandonment
Provision for decommissioning of oil and gas facilities is recognised in full at the commencement of field development. The amount recognised
is the present value of the estimated future expenditure determined in accordance with local conditions and requirements. A corresponding
tangible fixed asset of an amount equivalent to the provision is also created. This is subsequently depreciated based on a unit of production
basis. Any change in the present value of the estimated expenditure is reflected as an adjustment to the provision and the fixed asset.
Unwinding of the discount is treated as a finance cost.
Other property, plant and equipment
Other property, plant and equipment include Buildings, plant equipment and vehicles, and office equipment. These assets are shown at cost
less subsequent depreciation and impairment. Land is not depreciated and is stated at cost less subsequent impairment. Cost includes
48 SIBIR ENERGY PLC EXPLORATION, PRODUCTION, REFINING, MARKETING

expenditure that is directly attributable to the acquisition of the items. Subsequent costs are included in the asset’s carrying amount or
recognised as a separate asset only when it is probable that future economic benefits associated with the item will flow to the Group and the
cost of the item can be measured reliably. Repairs and maintenance are charged to the income statement during the financial period in which
they are incurred.
Depreciation on other assets is calculated using the straight-line method to allocate their cost less their residual values over their estimated
useful lives, as follows:
Plant and machinery 4 to 10 years
Office equipment 3 to 10 years
Motor vehicles 4 to 7 years
Buildings 8 to 25 years
The assets’ residual values and useful lives are reviewed, and adjusted if appropriate, at each balance sheet date. Gains and losses on
disposals are determined by comparing proceeds with carrying amount. These are included in the income statement.
Goodwill
Goodwill represents the excess of the cost of an acquisition over the fair value of the Group’s share of the net assets of the acquired
subsidiary, joint venture, or associate at the date of acquisition. Goodwill arising on acquisitions of subsidiaries is included as a separately
identified component within Intangible assets. Goodwill arising on acquisitions of joint ventures or associates is included as a component with
the category ‘investments in associates’ or ‘investments in joint ventures’.
Separately recognised goodwill is tested annually for impairment and carried at cost less accumulated impairment losses. Impairment losses on
goodwill are not reversed. Gains and losses on the disposal of an entity include the carrying amount of goodwill relating to the entity sold.
Goodwill is allocated to cash-generating units for the purpose of impairment testing. The allocation is made to those cash-generating units or
Groups of cash-generating units that are expected to benefit from the business combination in which the goodwill arose. For goodwill arising
on acquisition of joint ventures or associates, goodwill is tested for impairment as a component of the total carrying value of each investment.
Impairment losses are allocated to goodwill before the Group’s share of the underlying assets.
Other intangibles
Other intangibles include rights on land, trademarks, other licences and software. These assets are shown at cost less subsequent amortisation
and impairment. Cost includes expenditure that is directly attributable to the acquisition of the items. Subsequent costs are included in the
asset’s carrying amount or recognised as a separate asset only when it is probable that future economic benefits associated with the item will
flow to the Group and the cost of the item can be measured reliably. Amortisation on other intangibles is calculated using the straight-line
method to allocate their cost less their residual values over their estimated useful lives. The amortisation expense on intangible assets with
finite lives is recognised in profit or loss in the expense category consistent with the function of the intangible asset.
Rights on land
Rights on land are recognized as intangible assets and represent the value of premiums which would have been paid for the right to lease
land in accordance with the regulations issued by local authorities. They are either indefinite or are amortized over a period of up to 49 years,
in accordance with the term of the underlying land lease agreement. Rights on land that have an indefinite life are not subject to amortisation.
These assets are subject to an annual impairment review or whenever there is an indication that the asset may be impaired.
Borrowing costs
The Group’s policy is not to capitalise borrowing costs.
Impairment of intangible assets and property plant and equipment
At each year end, the Group reviews the carrying value of its property, plant and equipment and intangible assets to determine whether any
indicators that the assets may have suffered impairment have occurred. Such indicators for example will include significant changes in the
technological, market, economic or legal environment in which the Group operates. Where such indicators have occurred a full impairment
review is undertaken.
For impairment purposes, assets are grouped together as a cash generating unit (CGU) being the smallest identifiable group of assets that
generate cash inflows that are largely independent of other assets. For development and production assets this is typically an individual oil
field. An estimate of the CGU’s recoverable amount is determined based on the higher of its value in use and its fair value (including disposal
costs). Value in use is determined on a discounted cash flow basis.
49 SIBIR ENERGY PLC EXPLORATION, PRODUCTION, REFINING, MARKETING

Inventories
Inventories are stated at the lower of weighted average cost and net realisable value and comprise oil in tanks and pipelines, refined products
and spare parts and materials and include costs associated with bringing the inventories to their present location and condition. Net realisable
value is the estimated selling price in the ordinary course of business, less applicable variable selling expenses.
Financial instruments
Derivative financial instruments
The Group enters into contracts for the sale and purchase of oil and oil products. The majority of these contracts are entered into and
continue to be held for the purpose of receipt or delivery of the oil or oil products in accordance with the Group’s expected sale, purchase or
usage requirements. Accordingly, these contracts are not within the scope of IAS 39.
Certain transactions where the Group enters into contracts to purchase oil products from third parties and re-sell this oil to other third parties
in return for a fee are within the scope of IAS 39 because they are not for the Group’s expected sale, purchase or usage requirements. Such
contracts are accounted for as derivatives under IAS 39 and are initially recognised at trade date on the balance sheet at their fair values.
Subsequently, the contracts are revalued, with any gains or losses arising recognised in the Income Statement.
Available-for-sale financial assets
Available-for-sale financial assets are non-derivatives that are either designated in this category or not classified in any of the other categories.
They are included in non-current assets unless management intends to dispose of the investment within 12 months of the balance sheet date.
These include the Group’s listed and unlisted equity investments which are initially recognised at fair value. They are subsequently recognised
at fair value, with gains and losses arising from changes in the fair value, recognised directly in equity until the asset is disposed of. The fair
value of quoted investments is based on current bid prices. If the market for a financial asset is not active (unlisted securities) the Group
establishes fair value by using appropriate valuation techniques. The Group uses a variety of methods and makes assumptions that are based
on market conditions existing at each balance sheet date. When securities classified as available-for-sale are sold or impaired, the accumulated
fair value adjustments recognised in equity are included in the income statement as ‘gains and losses from investment securities’.
Trade and other receivables
Trade receivables, which generally have 30 day or less terms, are recognised at fair value, which is considered to be the lower of original
invoice amount and recoverable amount. A provision for impairment of trade receivables is established when there is objective evidence that
the Group will not be able to collect all amounts due according to the original terms of the receivables. Balances are written off when the
probability of recovery is assessed as being remote.
Other receivables include loans made by the Group. Loans are non-derivative financial instruments with fixed or determinable repayment dates
and are not quoted on an active market. They do not qualify as trading assets and have not been designated as fair value through the profit
and loss account or available for sale. Long term loan assets are carried at amortised cost using the effective interest method if the time value
of money is significant. Gains and losses are recognised in income where the loans are derecognised as well as through any amortisation.
Cash and cash equivalents
Cash and cash equivalents includes cash in hand, bank overdrafts and deposits with banks including short term deposits and other highly
liquid investments, which are readily convertible into cash with maturity dates of less than three months on origination. Bank overdrafts are
shown within borrowings in current liabilities on the balance sheet.
Trade and other payables
Trade payables are recognised initially at fair value and subsequently measured at amortised cost using the effective interest method. Liabilities
for other payables are accrued when the counterparty performed its obligations under the contract and are carried at amortised cost using the
effective interest method.
Loans and borrowings
Loans and borrowings are recognised initially at fair value, net of transaction costs incurred. Loans and borrowings are subsequently stated at
amortised cost; any difference between the proceeds (net of transaction costs) and the redemption value is recognised in the income
statement over the period of the borrowings.
Borrowings are classified as current liabilities unless the Group has an unconditional right to defer settlement of the liability for at least 12
months after the balance sheet date.
50 SIBIR ENERGY PLC EXPLORATION, PRODUCTION, REFINING, MARKETING

Share capital
Ordinary shares are classified as equity. Incremental costs directly attributable to the issue of new shares or options are shown in equity as a
deduction, net of tax, from the proceeds. Incremental costs directly attributable to the issue of new shares or options, for the acquisition of a
business are included in the cost of acquisition as part of the purchase consideration. Dividends on ordinary shares are not recognised as a
liability or charged to equity until they have been declared.
Current and deferred income tax
The corporate tax charge represents the sum of tax payable, based on the taxable profit for the year.
Deferred income tax is provided in full, using the liability method, on temporary differences at the balance sheet date between the tax bases of
assets and liabilities and their carrying amounts for financial reporting purposes. Deferred tax liabilities are recognised for all taxable temporary
differences.
However, if the deferred income tax arises from initial recognition of an asset or liability in a transaction other than a business combination,
that, at the time of the transaction, affects neither accounting nor taxable profit or loss, it is not accounted for. Deferred tax assets and
liabilities are measured at the tax rates that are expected to apply to the year when the asset is realised or the liability is settled, based on tax
rates (and tax laws) that have been enacted or substantively enacted at the balance sheet date.
Deferred income tax assets are recognised for all deductible temporary differences, carry-forward of unused tax assets and unused tax losses,
to the extent that it is probable that future taxable profit will be available against which the temporary differences can be utilised. Deferred
income tax is provided on temporary differences arising on investments in subsidiaries and associates, except where the timing of the reversal
of the temporary difference is controlled by the Group and it is probable that the temporary difference will not reverse in the foreseeable
future.
Customs duties and sales taxes
Revenues, expenses and assets are recognised net of the amount of customs duties or sales tax except where:
• Revenue from the export of oil and oil products are stated gross of export duties;
• Customs duty or sales tax incurred on a purchase of goods and services is not recoverable from the taxation authority, in which case the
customs duty or sales tax is recognised as part of the cost of acquisition of the asset or as part of the expense item as applicable; and
• Receivables and payables are stated with the amount of customs duty or sales tax included.
The net amount of sales tax recoverable from, or payable to, the taxation authority is included as part of receivables or payables in the balance
sheet.
Employee benefits
Pension costs
The Group pays contributions to personal pension schemes of employees, which are administered independently of the Group. The Group has
no other obligations once the contributions have been paid. The contributions are recognised as an employee benefit expense when they are
due.
Share based payments
The Group makes equity-settled, share-based payments to certain Directors and senior management. These are measured at fair value at the
date of grant and are recognised as an expense on a straight line basis over the vesting period of the option using the Group’s estimate of
the percentage of shares which will eventually vest. The proceeds received net of any directly attributable transaction costs are credited to
share capital and share premium when the options are exercised.
Provisions and contingent assets and liabilities
Provisions are recognised when the Group has a present obligation as a result of a past event, if it is probable that an outflow of resources
will be required and the amount of the obligation can be estimated reliably.
A contingent liability is disclosed where the Group has an obligation which will only be confirmed by future events or the amount of the
obligation can not be measured with reasonable reliability.
Contingent assets are not recognised, but are disclosed where it is probable that a future inflow of resources will occur.
51 SIBIR ENERGY PLC EXPLORATION, PRODUCTION, REFINING, MARKETING

Financial guarantee liabilities
Financial guarantee liabilities issued by the Group are those contracts that require a payment to be made to reimburse the holder for a loss it
incurs because the specified debtor fails to make a payment when due in accordance with the terms of a debt instrument. Financial
guarantees are recognised as contingent liabilities of the Group.
Revenue recognition
Revenue comprises the fair value for the sale of goods and services sold, net of VAT, but gross of export duties. Revenue is recognised when
it is probable that the benefits associated with the transaction will flow to the Group and the amounts can be measured reliably.
Revenue associated with the sale of oil, natural gas and refined oil products are recognised when title passes on delivery to the customer.
Sales and purchases made as part of an arrangement where physical exchange of oil or oil products occurs with the same or another,
counter-party and the substance of the transactions are effectively to swap the oil or oil products in different physical locations for the Group’s
own commercial purposes, are reported net within cost of sales.
Where the Group acts as agent for a third party to purchase or sell oil, gas or oil products, revenue is recognised in respect of the Group’s
fees and not for the full value of the sale.
Interest income is accrued on a time basis, by reference to the principal outstanding and at the effective interest rate applicable, which is the
rate that exactly discounts estimated future cash receipt through the expected life of the financial assets to that asset’s net carrying amount.
Dividend income from investments is recognised when the shareholders’ rights to receive payment have been established.
Oil and gas reserves
The Group’s commercial reserves are based on the Russian federal government reserves classification. This is defined as reserves proved and
developed, reserves proved but not yet developed and reserves tested and lie within proven and probable. The Group’s joint venture Salym
Petroleum Development N.V. (SPD) uses a reserves classification known as ‘proven and expected reserves’, which is broadly similar.
Leases
The Group leases certain property, plant and equipment. Leases of property, plant and equipment, where the Group has substantially all the
risks and rewards of ownership are classified as finance leases. Assets held on finance leases and under hire purchase agreements, are
capitalised and depreciated in accordance with the Group’s property, plant and equipment policy. Finance leases are capitalised at the lease’s
commencement at the lower of the fair value of the leased property and the present value of the minimum lease payments. Each lease
payment is allocated between the liability and finance charges so as to achieve a constant rate on the finance balance outstanding. The
corresponding rental obligations, net of finance charges, are included in other long-term payables. The interest element of the finance cost is
charged to the income statement over the lease period so as to produce a constant periodic rate of interest on the remaining balance of the
liability for each period.
Operating leases are those leases where the Group does not obtain the significant risks and rewards of ownership. Payments made under
operating leases (net of any incentives received from the lessor) are charged to the income statement on a straight-line basis over the period
of the lease.
Minority interests
Minority interests represent the proportion of the net assets or liabilities and income or loss in a subsidiary under-taking, which is not owned by
the Group. Minority interests are presented as a separately identifiable component in equity. Where the Group purchases part or all of a
minority’s interest in a subsidiary, the acquisition is accounted for at cost to the Group, cost being the minority’s share of the net assets of the
subsidiary at the date of acquisition. Any excess of the cost of acquisition over the value of the Group’s share of the identifiable net assets
acquired is recorded as goodwill. If the cost of acquisition is less than the value of the net assets of the subsidiary acquired, the difference is
recognised directly in the income statement.
52 SIBIR ENERGY PLC EXPLORATION, PRODUCTION, REFINING, MARKETING

3 FINANCIAL RISK FACTORS
The Group’s normal operating, investing and financing activities expose it to a variety of financial risks. The Group has in place risk
management policies that seek to limit the adverse effects of these risks on the financial performance of the Group.
Russian business environment
During the year ended 31 December 2007 all of the Company’s business was conducted in Russia through its investment in subsidiaries, joint
ventures, associates and trade investments operating in the oil and gas industry. These operations and those of similar companies in Russia
are subject to the economic, political and regulatory uncertainties prevailing in Russia.
The Russian economy, while deemed to be of market status beginning in 2002, continues to display certain traits consistent with that of a
market in transition. These characteristics have in the past included higher than normal historic inflation, lack of liquidity in the capital markets,
and the existence of currency controls, which cause the national currency to be illiquid outside Russia. The continued success and stability of
the Russian economy will be significantly impacted by the government’s continued actions with regard to supervisory, legal, and economic
reforms.
Market risk
Market risk is the risk of loss that results from changes in market prices (commodity prices, foreign exchange rates, interest rates and equity
prices). The level of market risk to which the Group is exposed at a point in time varies depending on market conditions, expectations of future
price or market rate movements and the composition of the Group’s physical asset and contract portfolios.
Currency risk
Currency risk is the risk that the Group suffers financial loss as a result of changes in the value of an asset or liability or in the value of future
cash flows due to movements in foreign currency exchange rates.
The Group’s objectives in managing the currency exposures arising from its net investments overseas are to match, to the extent practical,
receipts and payments in the same currency and by following a range of commercial policies to minimise exposure. The Group does not hold
or issue derivative financial instruments to manage foreign exchange risks.
Sibir continues to transfer funds to and from Russia without incident or impediment, with the exception of foreign currency reservation
requirements in respect of loans from the Group’s Russian subsidiaries to the Group’s non-Russian companies (such as the head office
companies in the UK) imposed by the Central Bank of the Russian Federation since August 2004 but cancelled in May 2006.
Credit risk
Credit risk is the risk that the financial benefits of contracts with a specific counterparty will be lost if the counterparty defaults on its
contractual obligations. Significant financial instruments that potentially subject the Group to a concentration of credit risk consist primarily of
cash and cash equivalents and accounts receivable. Cash and cash equivalents, primarily composed of deposits and investments in money
market funds, are maintained with a number of major financial institutions in each of the regions that the Group operates. The Group performs
ongoing credit evaluations of its customers and regularly monitors exposures and concentrations of credit risk.
The provision for any credit losses on balances receivable from crude oil and refined oil products customers is based on a review of balances
determined to be impaired at the balance sheet date. In determining whether amounts due are impaired, management considered quantitative
factors such as period of time past due as well as qualitative factors including changes in business environment and changes to the credit
worthiness of counterparties.
Interest rate risk
Interest rate risk is the risk that the Group suffers financial loss due to changes in the value of an asset or liability or in the value of future
cash flows due to movements in interest rates. Any financial asset or liability on which interest is paid or received will be subject to interest
rate risk. The Group does not actively manage interest rate risk. The Group does not hold or issue derivative financial instruments to manage
interest rate exchange risks.
53 SIBIR ENERGY PLC EXPLORATION, PRODUCTION, REFINING, MARKETING
Liquidity risk
Liquidity risk is the risk that the Group will not have sufficient funds to meet it obligations as they come due.
The Group actively maintains a mixture of long-term and short-term committed facilities that are designed to ensure the Group has sufficient
available funds for operations and planned expansions. Cash forecasts identifying the Group’s liquidity requirements are produced regularly and
are stress-tested for different scenarios to ensure sufficient financial headroom exists for at least a 12-month period to safeguard the Group’s
ability to continue as a going concern.
Commodity price risk
Commodity price risk is the risk that market prices for commodities will move adversely between the time that sales prices are fixed and the
time that the purchase cost or production cost is fixed, thereby potentially reducing expected margins.
Oil, gas and oil product prices for export sales from our Russian operations are subject to international supply and demand. Political
developments may also affect global supply and oil prices. Russian domestic sales are agreed at an arms’ length price with our customers.
Movements in the Russian domestic market are indirectly affected by global pricing considerations due to Russian government controls over
the amount of oil available for export.
A significant period of lower oil prices would lead to a review for impairment of the Group’s oil and gas properties. Such a review would reflect
management’s view of long term oil, gas and oil product prices and could result in a charge for impairment that could have a significant effect
on the Group’s results as well as requiring the Group to make changes to its capital expenditure plans.
Given the strong linkage in world energy markets to the US dollar, there is a significant impact on oil, gas and oil product prices. A weakening
of the US dollar against other currencies would therefore be expected to increase the US dollar price of oil, gas and oil products.
Capital risk management
The Group’s objectives when managing capital is to:
• Safeguard the Group’s ability to continue as a going concern;
• To provide a return on shareholders investment; and
• To maintain an optimal capital structure which will allow as low a cost of capital as possible.
The Group sets the amount of capital in proportion to risk. The Group manages the capital structure and makes adjustments to it in the light
of changes in economic conditions and the risk characteristics of the underlying assets. In order to maintain or adjust the capital structure, the
Group may adjust the amount of dividends paid to shareholders, return capital to shareholders, issue new shares, or sell assets to reduce debt.
Fair value estimation
The fair value of financial instruments traded in active markets (such as trading and available-for sale securities) is based on quoted market
prices at the balance sheet date. The quoted market price used for financial assets held by the Group is the current bid price.
The fair value of financial instruments that are not traded in an active market is determined by using valuation techniques. The Group uses a
variety of methods and makes assumptions that are based on market conditions existing at each balance sheet date. Quoted market prices or
dealer quotes for similar instruments are used for long-term debt. Other techniques, such as estimated discounted cash flows, are used to
determine fair value for the remaining financial instruments.
The carrying value less impairment provision of trade receivables and payables are estimated to approximate their fair values. The fair value of
financial liabilities for disclosure purposes is estimated by discounting the future contractual cash flows at the current market interest rate that
is available to the Group for similar financial instruments.
Regulatory compliance
The Group is subject to regulation and intervention by the Russian federal and state governments in such matters as:
• The award of production and development licences;
• Environmental and decommissioning obligations;
• Field development plans; and
• The ability to export oil from the Russian market.
54 SIBIR ENERGY PLC EXPLORATION, PRODUCTION, REFINING, MARKETING
4 CRITICAL ACCOUNTING ESTIMATES AND JUDGEMENTS
The Group makes estimates and assumptions concerning the future. The resulting accounting estimates will, by definition seldom equal the
related actual results. The estimates and assumptions that have a significant risk of causing a material adjustment to the carrying amounts of
assets and liabilities within the next financial year are discussed below.
Impairment
The Group tests annually whether goodwill has suffered any impairment, in accordance with the accounting policies stated in Note 2. In
addition, the Group also considers the facts and circumstances surrounding its exploration and evaluation expenditure, property, plant and
equipment and intangible assets and whether these suggest that the carrying amount may be impaired. Where necessary a full impairment
review will be performed on a cash-generating unit basis.
The recoverable amounts of cash-generating units are determined based on value in use calculations. These calculations require the use of
estimates.
Value in use is based on the cash flows expected to be generated by the projected oil or natural gas production profiles up to the earlier of
the expected dates of cessation of production or the expected licence termination date of each producing field. The date of cessation of
production depends on the interaction of a number of variables, such as the recoverable quantities of oil and gas, the production profile of the
field, the cost of the development of the infrastructure necessary to recover the oil and gas, the production costs and the selling price of the
oil and gas produced. As each producing field has specific reservoir characteristics and economic circumstances, the cash flows of the fields
are computed using appropriate individual economic models and key assumptions agreed by management. These cash flows are then
discounted to their present value using an appropriate discount rate.
Oil field and other asset retirement obligations including decommissioning costs
The Group makes full provision for the future cost of decommissioning oil and gas production facilities and related pipelines on a discounted
basis upon the installation of those facilities. Provisions for environmental remediation are made when a clean-up is required under the Group’s
licence obligations, in accordance with Russian state or federal law, or when the requirement is probable and the amount can be reasonably
determined.
The provision for the costs of decommissioning and environmental remediation of these production facilities and pipelines at the end of their
economic lives has been estimated using existing technology, at current prices increased by forecast future Russian inflation and discounted
using a real discount rate of 10% (2006: 10%). These costs are expected to be incurred over the next 20 to 30 years. While the provision is
based on the best estimate of future costs and the economic lives of the facilities and pipelines, there is uncertainty regarding both the
amount and timing of incurring these costs. In addition, there is additional uncertainty regarding the scale of any possible environmental
contamination, the timing and extent of future corrective actions and changes in Russian state or federal requirements.
Oil and gas reserve estimates
The Group uses the Russian federal government reserves classification for estimating oil and gas reserves for all accounting and reporting
purposes. The Russian classification is defined as ‘reserves proved and developed, reserves proved but not yet developed and reserves tested
and lie within proven and probable’. The Group’s joint venture Salym Petroleum Development N.V. uses a reserves classification known as
‘proven, expected and scope for recovery reserves’, which is broadly similar.
Fair value of non-traded investments
Sibir has a small holding in Fortune Oil Plc, a company listed on the London Stock Exchange. This investment is carried in the balance sheet
at its fair value.
Deferred tax assets
Management judgment is required for the calculation of current and deferred income taxes. Deferred tax assets are recognized to the extent
that their utilisation is probable. The utilisation of deferred tax assets will depend on whether it is possible to generate sufficient taxable income
in respective tax type and jurisdiction. Various factors are used to assess the probability of the future utilisation of deferred tax assets, including
past operating results, operational plan, expiration of tax losses carried forward, and tax planning strategies. If actual results differ from that
estimates or if these estimates must be adjusted in future periods, the financial position, results of operations and cash flows may be
negatively affected. In the event that an assessment of future utilisation indicates that the carrying amount of deferred tax assets must be
reduced, this reduction is recognised in profit or loss.
55 SIBIR ENERGY PLC EXPLORATION, PRODUCTION, REFINING, MARKETING
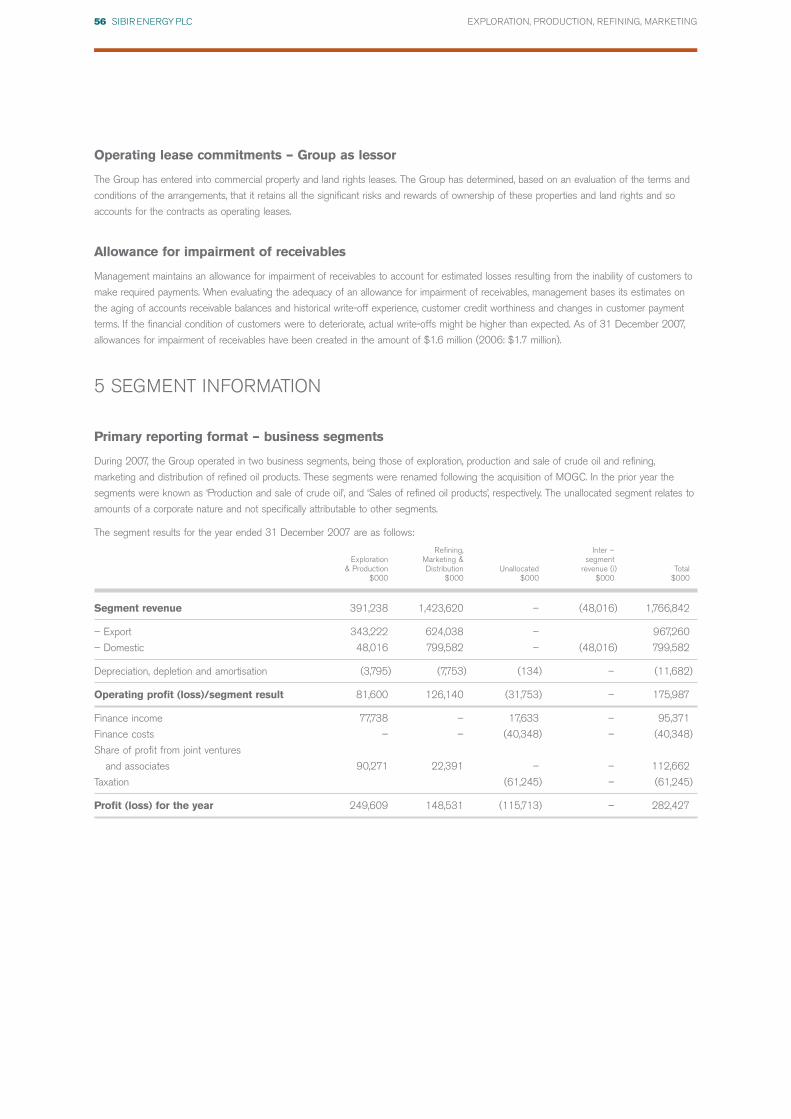
Operating lease commitments – Group as lessor
The Group has entered into commercial property and land rights leases. The Group has determined, based on an evaluation of the terms and
conditions of the arrangements, that it retains all the significant risks and rewards of ownership of these properties and land rights and so
accounts for the contracts as operating leases.
Allowance for impairment of receivables
Management maintains an allowance for impairment of receivables to account for estimated losses resulting from the inability of customers to
make required payments. When evaluating the adequacy of an allowance for impairment of receivables, management bases its estimates on
the aging of accounts receivable balances and historical write-off experience, customer credit worthiness and changes in customer payment
terms. If the financial condition of customers were to deteriorate, actual write-offs might be higher than expected. As of 31 December 2007,
allowances for impairment of receivables have been created in the amount of $1.6 million (2006: $1.7 million).
5 SEGMENT INFORMATION
Primary reporting format – business segments
During 2007, the Group operated in two business segments, being those of exploration, production and sale of crude oil and refining,
marketing and distribution of refined oil products. These segments were renamed following the acquisition of MOGC. In the prior year the
segments were known as ‘Production and sale of crude oil’, and ‘Sales of refined oil products’, respectively. The unallocated segment relates to
amounts of a corporate nature and not specifically attributable to other segments.
The segment results for the year ended 31 December 2007 are as follows:
Refining, Inter –Exploration Marketing & segment
& Production Distribution Unallocated revenue (i) Total$000 $000 $000 $000 $000
Segment revenue 391,238 1,423,620 – (48,016) 1,766,842
– Export 343,222 624,038 – 967,260
– Domestic 48,016 799,582 – (48,016) 799,582
Depreciation, depletion and amortisation (3,795) (7,753) (134) – (11,682)
Operating profit (loss)/segment result 81,600 126,140 (31,753) – 175,987
Finance income 77,738 – 17,633 – 95,371
Finance costs – – (40,348) – (40,348)
Share of profit from joint ventures
and associates 90,271 22,391 – – 112,662
Taxation (61,245) – (61,245)
Profit (loss) for the year 249,609 148,531 (115,713) – 282,427
56 SIBIR ENERGY PLC EXPLORATION, PRODUCTION, REFINING, MARKETING
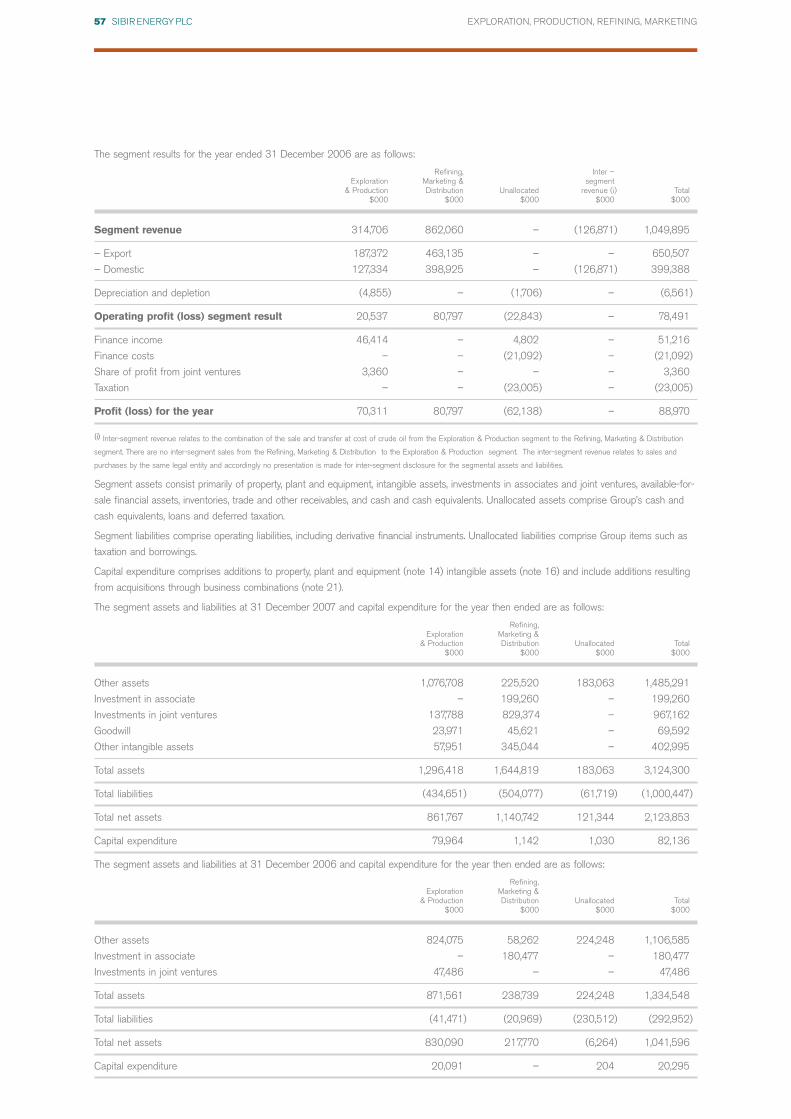
The segment results for the year ended 31 December 2006 are as follows:
Refining, Inter –Exploration Marketing & segment
& Production Distribution Unallocated revenue (i) Total$000 $000 $000 $000 $000
Segment revenue 314,706 862,060 – (126,871) 1,049,895
– Export 187,372 463,135 – – 650,507
– Domestic 127,334 398,925 – (126,871) 399,388
Depreciation and depletion (4,855) – (1,706) – (6,561)
Operating profit (loss) segment result 20,537 80,797 (22,843) – 78,491
Finance income 46,414 – 4,802 – 51,216
Finance costs – – (21,092) – (21,092)
Share of profit from joint ventures 3,360 – – – 3,360
Taxation – – (23,005) – (23,005)
Profit (loss) for the year 70,311 80,797 (62,138) – 88,970
(i) Inter-segment revenue relates to the combination of the sale and transfer at cost of crude oil from the Exploration & Production segment to the Refining, Marketing & Distribution
segment. There are no inter-segment sales from the Refining, Marketing & Distribution to the Exploration & Production segment. The inter-segment revenue relates to sales and
purchases by the same legal entity and accordingly no presentation is made for inter-segment disclosure for the segmental assets and liabilities.
Segment assets consist primarily of property, plant and equipment, intangible assets, investments in associates and joint ventures, available-for-
sale financial assets, inventories, trade and other receivables, and cash and cash equivalents. Unallocated assets comprise Group’s cash and
cash equivalents, loans and deferred taxation.
Segment liabilities comprise operating liabilities, including derivative financial instruments. Unallocated liabilities comprise Group items such as
taxation and borrowings.
Capital expenditure comprises additions to property, plant and equipment (note 14) intangible assets (note 16) and include additions resulting
from acquisitions through business combinations (note 21).
The segment assets and liabilities at 31 December 2007 and capital expenditure for the year then ended are as follows:
Refining,Exploration Marketing &
& Production Distribution Unallocated Total$000 $000 $000 $000
Other assets 1,076,708 225,520 183,063 1,485,291
Investment in associate – 199,260 – 199,260
Investments in joint ventures 137,788 829,374 – 967,162
Goodwill 23,971 45,621 – 69,592
Other intangible assets 57,951 345,044 – 402,995
Total assets 1,296,418 1,644,819 183,063 3,124,300
Total liabilities (434,651) (504,077) (61,719) (1,000,447)
Total net assets 861,767 1,140,742 121,344 2,123,853
Capital expenditure 79,964 1,142 1,030 82,136
The segment assets and liabilities at 31 December 2006 and capital expenditure for the year then ended are as follows:
Refining,Exploration Marketing &
& Production Distribution Unallocated Total$000 $000 $000 $000
Other assets 824,075 58,262 224,248 1,106,585
Investment in associate – 180,477 – 180,477
Investments in joint ventures 47,486 – – 47,486
Total assets 871,561 238,739 224,248 1,334,548
Total liabilities (41,471) (20,969) (230,512) (292,952)
Total net assets 830,090 217,770 (6,264) 1,041,596
Capital expenditure 20,091 – 204 20,295
57 SIBIR ENERGY PLC EXPLORATION, PRODUCTION, REFINING, MARKETING

Secondary reporting format – geographical segments
The Group’s revenues are mainly within Russia, and Western Europe.
Revenue is allocated based on the country in which the customer is located.
2007 2006Revenue $000 $000
Russia 880,816 399,388
Western Europe 886,026 561,119
USA – 74,619
Others – 14,769
1,766,842 1,049,895
Total assets for the Group are allocated based on where the assets are geographically located.
2007 2006Total assets $000 $000
Russia 1,913,901 1,069,271
Western Europe 43,977 37,314
1,957,878 1,106,585
Joint ventures (note 17)
Russia 967,162 47,486
Associates (note 18)
Russia 199,260 180,477
3,124,300 1,334,548
Capital expenditure is allocated based on where the assets are geographically located.
2007 2006Capital expenditure $000 $000
Russia 81,106 20,144
Western Europe 1,030 151
82,136 20,295
58 SIBIR ENERGY PLC EXPLORATION, PRODUCTION, REFINING, MARKETING

6 OPERATING PROFIT
The following items have been charged in arriving at operating profit:2007 2006$000 $000
Auditors Remuneration
Audit of the Company’s financial statements and the Group consolidation(i) 2,319 419
Other fees to auditors
– local statutory audits for subsidiaries 95 268
– taxation services 31 35
– corporate finance services 165 –
– other services(ii) 100 17
391 320
2,710 739
Depletion of oil and gas development and production assets 3,795 4,855
Depreciation of other tangible fixed assets 5,259 1,706
Amortisation of intangibles 2,628 –
Total depletion, depreciation and amortisation charge 11,682 6,561
Loss on disposal of tangible fixed assets 237 221
Others
Foreign exchange gain (loss) 2,732 (2,335)
Operating lease rental – land and buildings 1,121 503
(i) $98,695 (2006: $91,850) of this amount relates to the audit of the Company.
(ii) The amount included in other fees to auditors for the year ended 31 December 2007 relating to the Company and its UK subsidiaries was $100,000 (2006: $17,000)
7 EMPLOYMENT COSTS
The table below sets out details of the emoluments of the Group’s employment costs, including key management and Directors.2007 2006$000 $000
Wages and salaries 27,825 14,380
Social security costs 1,884 544
Pension costs – defined contribution plans 101 481
29,810 15,405
The average monthly number of employees during the year was made up as follows:2007 2006
Management and administration 375 151
Technical and operational 628 137
1,003 288
Key Management
The table below sets out details of the emoluments of the Group’s key management including Directors.2007 2006$000 $000
Wages and salaries 11,799 9,483
Social Security Costs 114 33
Other Pension Costs 101 113
12,014 9,629
59 SIBIR ENERGY PLC EXPLORATION, PRODUCTION, REFINING, MARKETING
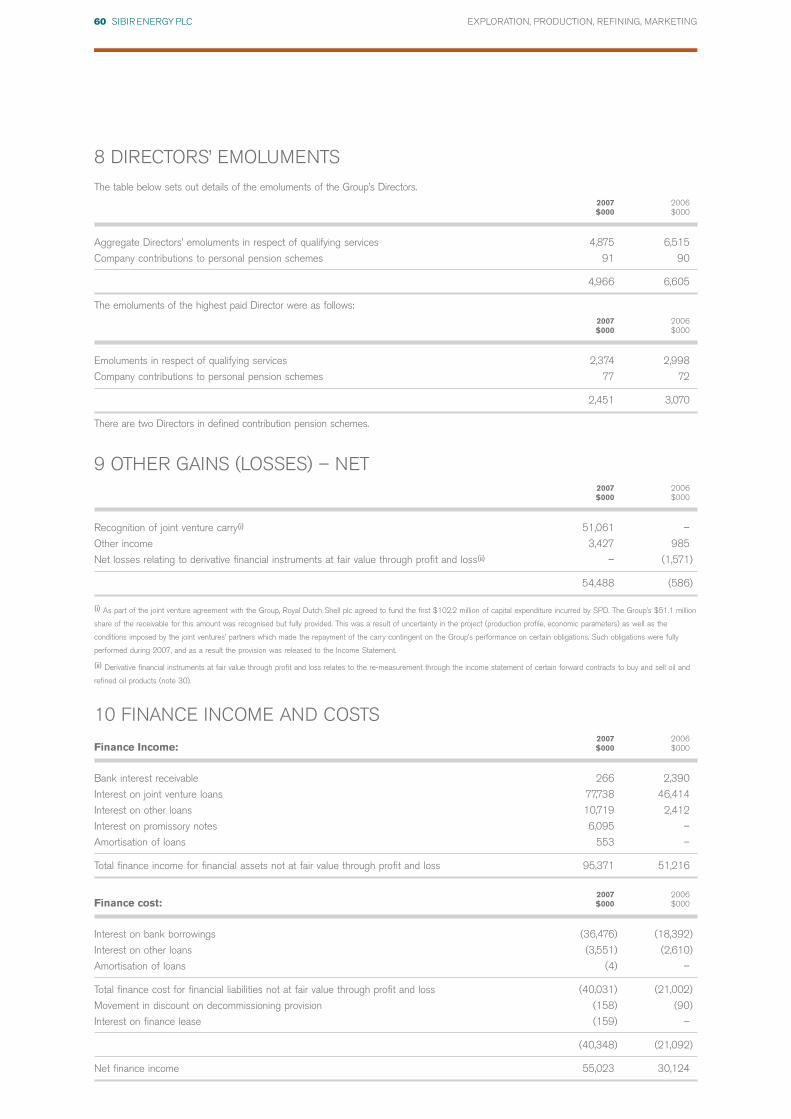
8 DIRECTORS’ EMOLUMENTS
The table below sets out details of the emoluments of the Group’s Directors.2007 2006$000 $000
Aggregate Directors’ emoluments in respect of qualifying services 4,875 6,515
Company contributions to personal pension schemes 91 90
4,966 6,605
The emoluments of the highest paid Director were as follows:2007 2006$000 $000
Emoluments in respect of qualifying services 2,374 2,998
Company contributions to personal pension schemes 77 72
2,451 3,070
There are two Directors in defined contribution pension schemes.
9 OTHER GAINS (LOSSES) – NET2007 2006$000 $000
Recognition of joint venture carry(i) 51,061 –
Other income 3,427 985
Net losses relating to derivative financial instruments at fair value through profit and loss(ii) – (1,571)
54,488 (586)
(i) As part of the joint venture agreement with the Group, Royal Dutch Shell plc agreed to fund the first $102.2 million of capital expenditure incurred by SPD. The Group’s $51.1 million
share of the receivable for this amount was recognised but fully provided. This was a result of uncertainty in the project (production profile, economic parameters) as well as the
conditions imposed by the joint ventures’ partners which made the repayment of the carry contingent on the Group’s performance on certain obligations. Such obligations were fully
performed during 2007, and as a result the provision was released to the Income Statement.
(ii) Derivative financial instruments at fair value through profit and loss relates to the re-measurement through the income statement of certain forward contracts to buy and sell oil and
refined oil products (note 30).
10 FINANCE INCOME AND COSTS2007 2006
Finance Income: $000 $000
Bank interest receivable 266 2,390
Interest on joint venture loans 77,738 46,414
Interest on other loans 10,719 2,412
Interest on promissory notes 6,095 –
Amortisation of loans 553 –
Total finance income for financial assets not at fair value through profit and loss 95,371 51,216
2007 2006Finance cost: $000 $000
Interest on bank borrowings (36,476) (18,392)
Interest on other loans (3,551) (2,610)
Amortisation of loans (4) –
Total finance cost for financial liabilities not at fair value through profit and loss (40,031) (21,002)
Movement in discount on decommissioning provision (158) (90)
Interest on finance lease (159) –
(40,348) (21,092)
Net finance income 55,023 30,124
60 SIBIR ENERGY PLC EXPLORATION, PRODUCTION, REFINING, MARKETING
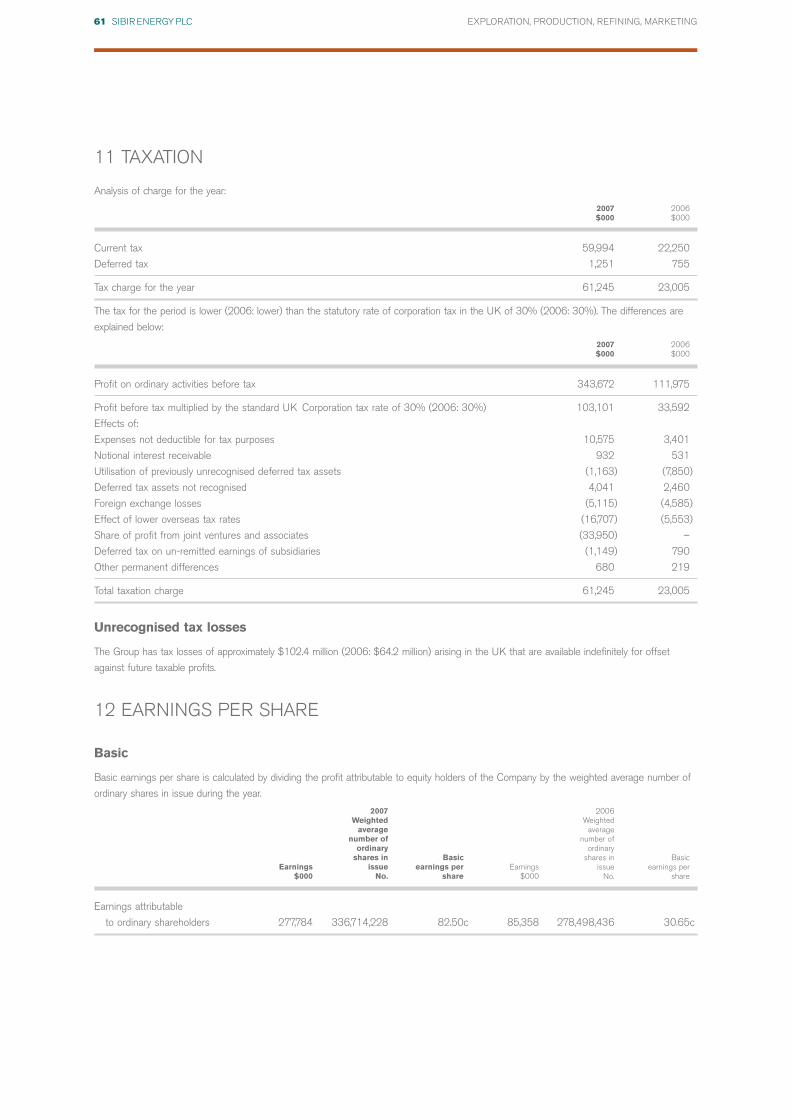
11 TAXATION
Analysis of charge for the year:
2007 2006$000 $000
Current tax 59,994 22,250
Deferred tax 1,251 755
Tax charge for the year 61,245 23,005
The tax for the period is lower (2006: lower) than the statutory rate of corporation tax in the UK of 30% (2006: 30%). The differences are
explained below:
2007 2006$000 $000
Profit on ordinary activities before tax 343,672 111,975
Profit before tax multiplied by the standard UK Corporation tax rate of 30% (2006: 30%) 103,101 33,592
Effects of:
Expenses not deductible for tax purposes 10,575 3,401
Notional interest receivable 932 531
Utilisation of previously unrecognised deferred tax assets (1,163) (7,850)
Deferred tax assets not recognised 4,041 2,460
Foreign exchange losses (5,115) (4,585)
Effect of lower overseas tax rates (16,707) (5,553)
Share of profit from joint ventures and associates (33,950) –
Deferred tax on un-remitted earnings of subsidiaries (1,149) 790
Other permanent differences 680 219
Total taxation charge 61,245 23,005
Unrecognised tax losses
The Group has tax losses of approximately $102.4 million (2006: $64.2 million) arising in the UK that are available indefinitely for offset
against future taxable profits.
12 EARNINGS PER SHARE
Basic
Basic earnings per share is calculated by dividing the profit attributable to equity holders of the Company by the weighted average number of
ordinary shares in issue during the year.
2007 2006Weighted Weighted
average averagenumber of number of
ordinary ordinaryshares in Basic shares in Basic
Earnings issue earnings per Earnings issue earnings per$000 No. share $000 No. share
Earnings attributable
to ordinary shareholders 277,784 336,714,228 82.50c 85,358 278,498,436 30.65c
61 SIBIR ENERGY PLC EXPLORATION, PRODUCTION, REFINING, MARKETING

Diluted
The diluted earnings per share includes the potential ordinary shares resulting from the exercise of the share options.
2007 2006Weighted Weighted
average averagenumber of number of
ordinary ordinaryshares in shares in
Earnings issue Earnings per Earnings issue Earnings per$000 No. share $000 No. share
Basic EPS
Earnings attributable
to ordinary shareholders 277,784 336,714,228 82.50c 85,358 278,498,436 30.65c
Diluted EPS
Effect of dilutive share
options issued(i) 434,741 – 419,185 –
Diluted earnings attributable
to ordinary shareholders 277,784 337,148,969 82.39c 85,358 278,917,621 30.60c
(i) Diluted earnings per share is calculated by adjusting the weighted average number of ordinary shares outstanding to assume the conversion of the share options to ordinary shares.
The Company has a share option scheme under which options to subscribe for the Company’s shares have been granted to certain
Executives and employees. At 31 December 2007 share options under the scheme were outstanding. A total of 575,000 ordinary shares are
exercisable, with 475,000 exercisable at £1.00 ($1.99) and 100,000 exercisable at £1.95 ($3.88). The market price of the Company’s share
was £5.75 ($11.45) as at 31 December 2007 (31 December 2006: £4.30 ($8.42)).
The Company as part of the acquisition of MOGC, granted CFC share options for 15,492,056 new ordinary shares at an exercise price of
$10.35. These ordinary shares options are exercisable at any time up to 24 February 2009.
13 DIVIDENDS PAIDDeclared and paid during the year: 2007 2006Equity dividend on ordinary shares: $000 $000
Final dividend for 2006: 7.00p (2005: 0.00p) 44,150
–
Dividends paid 44,150
14 PROPERTY, PLANT AND EQUIPMENTDevelopment Plant,
and equipment, Office Assets underproduction Buildings & vehicles equipment construction Abandonment Total
$000 $000 $000 $000 $000 $000 $000
Cost
At 1 January 2007 102,710 3,460 7,154 1,282 5,621 1,544 121,771
Currency translation
differences (103) 1,558 347 82 168 – 2,052
Acquisition of
subsidiary – 52,903 8,249 2,834 5,245 – 69,231
Additions 5,349 397 4,486 188 4,480 939 15,839
Transferred from
intangible assets 5,691 412 2,244 70 2,383 – 10,800
Disposals (413) (339) (652) (70) – – (1,474)
At 31 December
2007 113,234 58,391 21,828 4,386 17,897 2,483 218,219
62 SIBIR ENERGY PLC EXPLORATION, PRODUCTION, REFINING, MARKETING

Development Plant,and equipment, Office Assets under
production Buildings & vehicles equipment construction Abandonment Total$000 $000 $000 $000 $000 $000 $000
Accumulated
depletion and
depreciation
At 1 January 2007 (29,601) (1,515) (2,901) (996) – (172) (35,185)
Currency translation
differences (1,554) (27) (3) (1) – – (1,585)
Charge for the year (2,901) (4,660) (1,044) (368) – (81) (9,054)
Disposals 323 209 441 43 – – 1,016
At 31 December
2007 (33,733) (5,993) (3,507) (1,322) – (253) (44,808)
Net book value
At 1 January 2007 73,109 1,945 4,253 286 5,621 1,372 86,586
At 31 December
2007 79,501 52,398 18,321 3,064 17,897 2,230 173,411
Development Plant,and equipment, Office Assets under
production Buildings & vehicles equipment construction Abandonment Total$000 $000 $000 $000 $000 $000 $000
Cost
At 1 January 2006 83,622 2,622 3,008 1,137 13,085 287 103,761
Currency translation
differences (32) – (67) 26 – 21 (52)
Additions 15,640 – 242 191 1,370 1,236 18,679
Reclass/Transfers 3,935 858 4,041 – (8,834) – –
Disposals (455) (20) (70) (72) – – (617)
At 31 December
2006 102,710 3,460 7,154 1,282 5,621 1,544 121,771
Accumulated
depletion and
depreciation
At 1 January 2006 (25,012) (1,343) (1,650) (836) – (110) (28,951)
Currency translation
differences 11 – (17) (17) – (9) (32)
Charge for the year (4,802) (187) (1,304) (215) – (53) (6,561)
Disposals 202 15 70 72 – – 359
At 31 December
2006 (29,601) (1,515) (2,901) (996) – (172) (35,185)
Net book value
At 1 January 2006 58,610 1,279 1,358 301 13,085 177 74,810
At 31 December
2006 73,109 1,945 4,253 286 5,621 1,372 86,586
There were no impairments arising in 2007 (2006: none).
The carrying amount of the Group’s property, plant and equipment as at 31 December 2007 includes an amount of $2,464,000 (2006: none)
in respect of assets held under finance leases.
63 SIBIR ENERGY PLC EXPLORATION, PRODUCTION, REFINING, MARKETING

15 ASSETS CLASSIFIED AS HELD FOR SALE
On 28 February 2007 the Company purchased a freehold property in Aberdeen which it had previously occupied as a lessor. The Company
paid $5.1 million to purchase the freehold and to exit the lease agreement. An existing vacant property provision of $1.8 million was utilised as
part of the acquisition. In May 2007 the Board confirmed its decision to sell and is currently actively marketing the property.
The purchase price of the property reflected the value of the freehold combined with the Company’s long lease commitments as tenant.
Consequently when the Company acquired the freehold interest the fair value of the property was $3.3 million. The remainder of the purchase
consideration reflects the value of the lease agreement and was offset against the existing vacant property provision.
2007 2006Property, plant and equipment: $000 $000
Buildings at fair value 3,313 –
Assets classified as held for sale 3,313 –
16 INTANGIBLE ASSETSOil field Rights on land
Exploration and and otherGoodwill Evaluation cost intangibles Total
$000 $000 $000 $000
Cost
At 1 January 2006 23,971 414 – 24,385
Additions – 368 – 368
Net book amount
At 31 December 2006 23,971 782 – 24,753
Cost
At 1 January 2007 23,971 782 – 24,753
Additions (i) 66,297 66,297
Acquisition of subsidiary (ii) 44,398 – 337,036 381,434
Transferred to tangible assets – (10,800) – (10,800)
Amortisation charge for the period – – (2,628) (2,628)
Currency translation differences 1,223 1,672 10,636 13,531
Net book amount at 31 December 2007 69,592 57,951 345,044 472,587
(i) Additions to oil field exploration and evaluation costs include an amount of $50 million. This amount represents the cost of acquiring the exploration licence for the area known as the
Koltogorsky Blocks on 15 May 2007.
(ii) Additions to goodwill and rights on land in 2007 arose from the fair value uplift of assets in connection with the acquisition of Moscow Oil & Gas Company (note 21).
Impairment testing of goodwill
Goodwill is allocated to the Group’s cash generating units (CGU’s) identified according to business segments. A summary of the goodwill
allocation is presented in note 5.
The recoverable amount of a CGU is determined based on value in use calculations. These calculations use pre-tax cash flow projections
based on financial budgets approved by management covering a 5 year period. Cash flows beyond the 5 year period are extrapolated using
the estimated growth rate set below. The growth rate does not exceed the long term average growth rates for the business in which the CGU
operates.
The key assumptions used in the value in use calculations are as follows:
E&P/Retail Refinery
Gross Margin(i) 31% 65%
Growth Rate(ii) 2% 3%
Discount Rate(iii) 10% 13.7%
(i) Budgeted gross margin.
(ii) Growth rate used to extrapolate cash flows beyond the budget period.
(iii) Pre-tax discount rate applied to the cash flow projections.
64 SIBIR ENERGY PLC EXPLORATION, PRODUCTION, REFINING, MARKETING
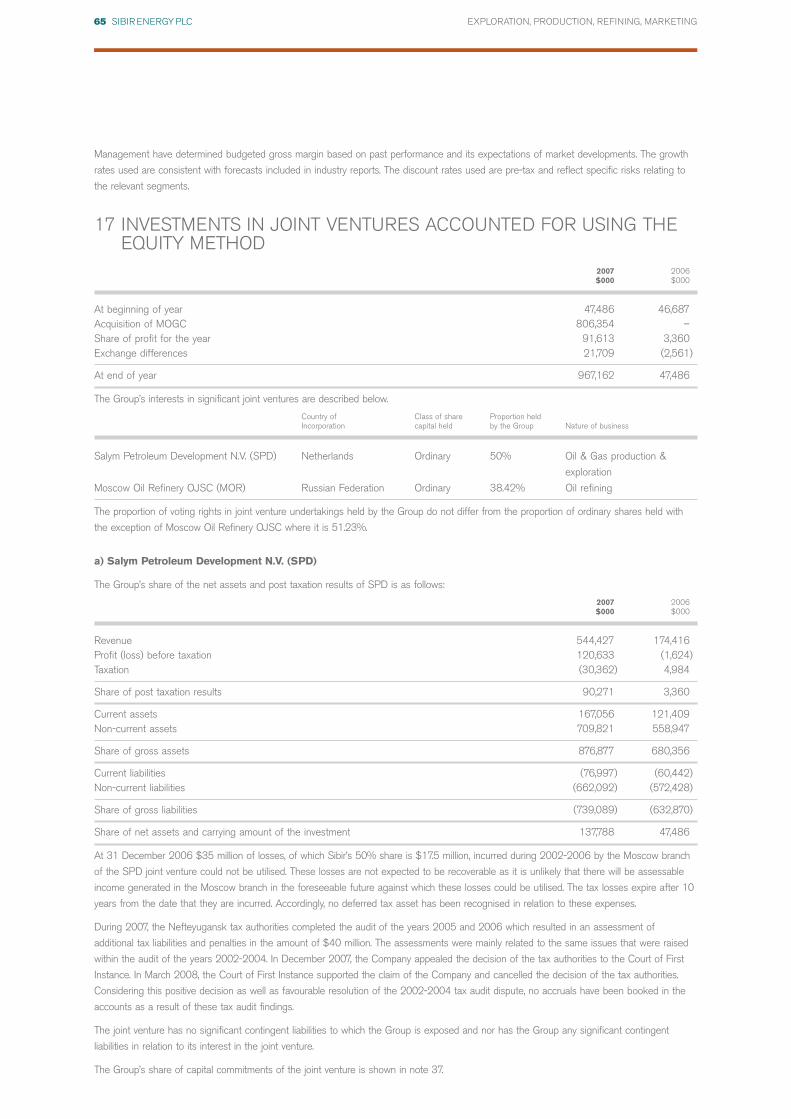
Management have determined budgeted gross margin based on past performance and its expectations of market developments. The growth
rates used are consistent with forecasts included in industry reports. The discount rates used are pre-tax and reflect specific risks relating to
the relevant segments.
17 INVESTMENTS IN JOINT VENTURES ACCOUNTED FOR USING THEEQUITY METHOD
2007 2006$000 $000
At beginning of year 47,486 46,687Acquisition of MOGC 806,354 –Share of profit for the year 91,613 3,360Exchange differences 21,709 (2,561)
At end of year 967,162 47,486
The Group’s interests in significant joint ventures are described below.
Country of Class of share Proportion heldIncorporation capital held by the Group Nature of business
Salym Petroleum Development N.V. (SPD) Netherlands Ordinary 50% Oil & Gas production &
exploration
Moscow Oil Refinery OJSC (MOR) Russian Federation Ordinary 38.42% Oil refining
The proportion of voting rights in joint venture undertakings held by the Group do not differ from the proportion of ordinary shares held with
the exception of Moscow Oil Refinery OJSC where it is 51.23%.
a) Salym Petroleum Development N.V. (SPD)
The Group’s share of the net assets and post taxation results of SPD is as follows:
2007 2006$000 $000
Revenue 544,427 174,416Profit (loss) before taxation 120,633 (1,624)Taxation (30,362) 4,984
Share of post taxation results 90,271 3,360
Current assets 167,056 121,409Non-current assets 709,821 558,947
Share of gross assets 876,877 680,356
Current liabilities (76,997) (60,442)Non-current liabilities (662,092) (572,428)
Share of gross liabilities (739,089) (632,870)
Share of net assets and carrying amount of the investment 137,788 47,486
At 31 December 2006 $35 million of losses, of which Sibir’s 50% share is $17.5 million, incurred during 2002-2006 by the Moscow branch
of the SPD joint venture could not be utilised. These losses are not expected to be recoverable as it is unlikely that there will be assessable
income generated in the Moscow branch in the foreseeable future against which these losses could be utilised. The tax losses expire after 10
years from the date that they are incurred. Accordingly, no deferred tax asset has been recognised in relation to these expenses.
During 2007, the Nefteyugansk tax authorities completed the audit of the years 2005 and 2006 which resulted in an assessment of
additional tax liabilities and penalties in the amount of $40 million. The assessments were mainly related to the same issues that were raised
within the audit of the years 2002-2004. In December 2007, the Company appealed the decision of the tax authorities to the Court of First
Instance. In March 2008, the Court of First Instance supported the claim of the Company and cancelled the decision of the tax authorities.
Considering this positive decision as well as favourable resolution of the 2002-2004 tax audit dispute, no accruals have been booked in the
accounts as a result of these tax audit findings.
The joint venture has no significant contingent liabilities to which the Group is exposed and nor has the Group any significant contingent
liabilities in relation to its interest in the joint venture.
The Group’s share of capital commitments of the joint venture is shown in note 37.
65 SIBIR ENERGY PLC EXPLORATION, PRODUCTION, REFINING, MARKETING

b) Moscow Oil Refinery OJSC (MOR)
The Group’s share of the net assets and post taxation results of MOR is as follows:
2007 2006$000 $000
Revenue 45,802 –
Loss before taxation (3,747) –
Taxation 5,089 –
Share of post taxation results 1,342 –
Current assets 67,382 –
Non-current assets 499,528 –
Share of gross assets 566,910 –
Current liabilities (133,521) –
Non-current liabilities (125,844) –
Share of gross liabilities (259,365) –
Share of net assets 307,545 –
Goodwill 521,829 –
Carrying amount of the investment 829,374 –
The joint venture has significant contingent liabilities in relation to taxation and guarantees that were issued, to which the Group is exposed as
explained in note 38.
The Group’s share of capital commitments of the joint venture is shown in note 37.
18 INVESTMENTS IN ASSOCIATESThe Group’s interests in associates are described below:
Country of Class of share Proportion heldIncorporation capital held by the Group Nature of business
STBP Holdings Limited Cyprus Ordinary 25% + 1 share Fuel retail and distribution
The acquisition by the Group was completed on 12 December 2006 of a 25% plus one share of STBP Holdings Limited, from Bennfield
Limited. The consideration for the acquisition was settled by the issue of 21,955,520 new ordinary shares of 10p (20c) each and the total of
$180,477,000 (£92,212,000) represents the fair value of this acquisition, based on the fair value of Sibir Energy Plc shares at the date of
acquisition.
The Group’s share of the net assets and post taxation results of STBP Holdings Limited is as follows:
2007 2006$000 $000
Revenue 190,656 –
Profit before taxation 28,635 –
Taxation (7,586) –
Share of post taxation results 21,049 –
Current assets 24,861 15,887
Non-current assets 112,248 104,210
Share of gross assets 137,109 120,097
Current liabilities (9,760) (5,963)
Non-current liabilities (4,909) (5,493)
Share of gross liabilities (14,669) (11,456)
Share of net assets 122,440 108,641
Goodwill 76,820 71,836
Carrying amount of the investment 199,260 180,477
66 SIBIR ENERGY PLC EXPLORATION, PRODUCTION, REFINING, MARKETING

The Group’s share of STBP’s results for the period between the 12 December 2006 and the 31 December 2006 year end were considered
to be immaterial. Accordingly, no amount was recognised in the income statement at the 2006 year end.
The Group has finalised the provisional fair value of STBP recorded at 31 December 2006. As a result of this finalisation, the Group has
recognised $71,836,000 of goodwill.
At 31 December 2007 there were no significant contingent liabilities or capital commitments in the financial statements of STBP Holdings
Limited (2006: none).
19 SUBSIDIARY UNDERTAKINGS
The Group’s significant subsidiary undertakings at 31 December 2007 are listed below:
Held IndirectlyCountry of Class of share Proportion heldincorporation capital held by Group Nature of business
Caraline Trading Limited Cyprus Ordinary 100% Oil trading company
Sibenergy (Cyprus) Limited Cyprus Ordinary 100% Intermediate holding
Kangol Enterprises Limited Cyprus Ordinary 100% Intermediate holding
Glafeta Holdings Limited Cyprus Ordinary 100% Intermediate holding
Expid Holdings Limited Cyprus Ordinary 100% Investment holding
Yaklort Holdings Limited Cyprus Ordinary 100% Investment holding
Visini Holdings Limited Cyprus Ordinary 100% Investment holding
Labico Holdings Limited Cyprus Ordinary 100% Investment holding
Hitchens Global S A British Virgin Islands Ordinary 100% Intermediate holding
Moscow Oil & Gas Company OJSC Russian Federation Ordinary 68.5% Oil refining and
distribution
Held IndirectlyCountry of Class of share Proportion heldincorporation capital held by Group Nature of business
Langue Limited Isle of Man Ordinary 100% Investment holding
Fabula Limited Isle of Man Ordinary 100% Investment holding
EuroSov Petroleum Limited Guernsey Ordinary 100% Intermediate holding
Siberian Geological Company CJSC Russian Federation Ordinary 100% Oil exploration
Sibresource North LLC Russian Federation Ordinary 100% Oil exploration
Sibresource South LLC Russian Federation Ordinary 100% Oil exploration
Evikhon OJSC Russian Federation Ordinary 100% Intermediate holding
Magma OJSC Russian Federation Ordinary 95% Oil production and
exploration
Moscow Oil & Gas Company OJSC Russian Federation Ordinary 31.5% Oil refining and
distribution
Moscow Fuel Company OJSC Russian Federation Ordinary 100% Oil distribution
Universalneft CJSC Russian Federation Ordinary 100% Oil production
Mosnefteproduct OJSC Russian Federation Ordinary 50.5% Oil retail distribution
LLC – Limited Liability Company
CJSC – Closed Joint Stock Company
OJSC – Open Joint Stock Company
All subsidiary undertakings have been consolidated in the Group financial statements. The proportion of voting rights in the subsidiary
undertakings held directly by the Group do not differ from the proportion of ordinary shares held with the exception of Mosnefteproduct OJSC
where it is 50.6%.
67 SIBIR ENERGY PLC EXPLORATION, PRODUCTION, REFINING, MARKETING

20 AVAILABLE-FOR-SALE FINANCIAL ASSETS2007 2006$000 $000
At beginning of year 24,541 19,113
Exchange difference – 2,843
Transfer to subsidiary undertaking (24,500) –
Change in fair value 13 2,585
At end of year 54 24,541
The Group’s Available-for-sale financial assets in 2006 comprised a 12.5% equity investment in Mostnefteprodukt, and a minor holding in
Fortune Oil plc a Company listed on the London Stock Exchange. Mostnefteprodukt is an unquoted downstream fuels retailing and distribution
network in the Moscow region. In September 2007 the Group acquired MOGC and as a result increased its interest in Mostnefteprodukt by a
further 38% stake (note 21). This investment is now treated as a subsidiary.
As at 31 December 2007 the Group’s only remaining available-for-sale financial asset is its minor holding in Fortune Oil plc.
The fair value of the Group’s financial assets together with the carrying amounts included in the balance sheet are analysed below and in note
22 (Trade and other receivables) and note 24 (Cash and cash equivalents). Due to the nature and/or short maturity of these financial
instruments, carrying value approximates to fair value.
Carrying value Fair value Carrying value Fair value2007 2007 2006 2006$000 $000 $000 $000
Other investments – unlisted – – 24,500 24,500
Other investments – listed 54 54 41 41
54 54 24,541 24,541
The total gains recognised through reserves from fair value adjustments of other investments was $13,000 (2006: $2,585,000).
21 BUSINESS COMBINATIONS
At an Extraordinary General Meeting of the Company held on 18 September 2007 shareholders approved all the resolutions necessary for
the Directors to complete the acquisition of 100% of the Moscow Oil and Gas Company (MOGC). Prior to the acquisition, the Sibir Group
held 31.5% and the Central Fuel Company (CFC) held 68.5% of MOGC. Following the acquisition, the Sibir Group now owns 100% of
MOGC, and CFC owns shares in Sibir Group representing 18.03% of Sibir’s issued share capital.
The key business operations of MOGC are as follows:
a) Under a joint venture agreement, MOGC controls 38.4% of the ownership rights and has 51.2% of the voting rights to the Moscow Oil
Refinery OJSC (MOR). The refinery, which is located within the boundary of the City of Moscow, has a capacity of 240,000 barrels per
day. Under a separate agreement, Sibir has the right to utilise 50% of the refinery capacity;
b) 100% share of the ownership and voting rights of Moscow Fuel company OJSC (MTK) and Universalneft CJSC; and
c) 38% ownership rights and a 50.6% share of the voting rights of Mosnefteproduct OJSC (MNP). Sibir already held 12.5% ownership
rights in MNP, bringing Sibir’s total ownership rights to 50.5%.
MTK and MNP operate over 139 petrol service stations operating under the MTK and Nefto brands in Moscow and the Moscow Oblast
region.
The assets and liabilities of MOGC and its subsidiaries and joint venture interests (the “MOGC group”) as of 18 September 2007 arising from
the acquisition is set out below. Investments in MTK and Universalneft have been accounted for as subsidiaries, reflecting MOGC’s 100%
ownership interests. MOR is reflected as a joint venture, accounted for under the equity method. MNP has been treated as a subsidiary on the
basis that Sibir has a controlling stake in the entity post acquisition. A minority interest of 49.5% has been deducted from the net assets.
68 SIBIR ENERGY PLC EXPLORATION, PRODUCTION, REFINING, MARKETING

ProvisionalFair Value Book value
$000 $000
Cash and cash equivalents 37,507 37,507
Intangible assets 337,036 8
Property, plant and equipment (Note 14) 69,231 67,192
Investments in joint ventures accounted for using the equity method 298,357 73,132
Inventories 5,642 5,642
Loans 131,409 131,409
Trade and other receivables 21,190 21,190
Trade and other payables (76,811) (76,811)
Borrowings (81,978) (81,978)
Deferred tax liabilities (82,813) (3,751)
Provisions (67,921) –
Net assets 590,849 173,540
Less Minority interests (70,382) (11,279)
Net assets acquired 520,467 162,261
Purchase consideration:
– Cash paid 200,000
– Direct costs relating to the acquisition 28,947
– Fair value of shares issued 708,746
– Fair value of shares options issued 26,646
– Capital contribution 102,499
Total purchase consideration 1,066,838
Goodwill arising on acquisition(i) 546,371
(i) Goodwill has been allocated between the MOR joint venture ($508.0 million) as shown in note 17 and MTK ($38.4 million) as shown in note 16.
Purchase consideration
The company issued 69,714,254 shares and 15,492,056 share options in part consideration for the acquisition. The shares were valued at the
market price ruling on the date of issue. The share options have been fair valued using the Black-Scholes model (note 31).
Prior to the acquisition the Group made a financial assistance payment. This has been treated for the purposes of the acquisition consideration
as a capital contribution of $102.5 million to MOGC.
The net outflow of cash and cash equivalents at the date of acquisition and subsequently were as follows:
$000
Cash consideration 228,947
Capital contribution 102,499
Less:
Cash and cash equivalents acquired (37,507)
Total outflow of cash and cash equivalents 293,939
Fair value of separable net assets
The intangible asset recognised on acquisition primarily relate to the indefinite right to use significant plots of land located in Moscow
municipality. Other intangible assets recognised include the value of the MTK and Nefto brands. Brands have been valued using the cost
approach because it is not deemed possible to separate the additional income generated by these assets. Property, plant & equipment assets
have been fair valued as their depreciated replacement cost. The fair value adjustments identified in respect of tangible and intangible assets
were determined based on an independent valuation.
The adjustments to the carrying value of other assets and liabilities relate to valuation adjustments and relating to the effect of applying Sibir’s
accounting policies.
69 SIBIR ENERGY PLC EXPLORATION, PRODUCTION, REFINING, MARKETING

Sibir also undertook a fair value exercise relating to the value of MOGC’s share of the net assets of its joint venture, Moscow Oil Refinery,
using the same principles outlined above.
The goodwill is attributed to the strategic importance of the acquired business in guaranteeing refining capacity and the further expansion of
the Group’s vertically integrated oil and gas business.
All fair value adjustments are provisional, based on management’s best estimates. The fair value adjustments relating to the MOGC acquisition
will be finalised in the 2008 financial statements.
The acquired business contributed revenues of $132.0 million and net loss after taxation of $9.8 million to the group for the period from
18 September 2007 to 31 December 2007.
If the acquisition had occurred on 1 January 2007 MOGC would have contributed $382.0 million to Group revenue and loss before taxation
of $16.6 million. These amounts have been calculated using the Group’s accounting policies and by adjusting the results of the subsidiary to
reflect additional depreciation and amortisation that would have been charged, assuming the fair value adjustments to property, plant and
equipment and intangible assets, had applied from 1 January 2007, together with the consequential tax effects.
Step-up acquisition of MNP
The acquisition of MOGC’s 38% interest in MNP when combined with the Group’s existing 12.5% interest has resulted in the Group
obtaining control over MNP. As a result of this step-up acquisition the goodwill arising on the initial 12.5% interest in September 2005 has
been required to be separately calculated. This has resulted in additional goodwill of $6.0 million being recognised. In addition, the minority
interest acquired has been reduced from $70.4 million to $55.9 million.
There were no subsidiary acquisitions in the year ended 31 December 2006.
22 TRADE AND OTHER RECEIVABLES
Current2007 2006
Notes $000 $000
Trade receivables 115,496 57,368
Less: provision for impairment of trade receivables (1,610) (1,746)
Trade receivables – net 113,886 55,622
Other receivables 3,763 698
Prepayments and accrued income 82,590 13,154
VAT receivable 64,968 47,949
Other loans receivable (i) 32,829 55,132
Loans receivable from joint venture (SPD) (ii) 115,830 –
Loans receivable from joint venture (MOR) (iii) 18,713 –
432,579 172,555
Non current2007 2006$000 $000
Loans receivable from joint venture (SPD) (ii) 506,987 603,921
Less: provision for impairment of loans receivable (note 9(i)) – (51,061)
506,987 552,860
Prepayments and accrued income 2,009 4,032
508,996 556,892
All non-current receivables are due within five years from the balance sheet date.
70 SIBIR ENERGY PLC EXPLORATION, PRODUCTION, REFINING, MARKETING

Trade receivables by class: 2007 2006
Current Current
Exploration and production 69,624 39,581
Refining, marketing and distribution 45,872 17,787
Less: provision for impairment of trade receivables (1,610) (1,746)
Total trade receivables 113,886 55,622
Receivables from ‘Exploration and production’ and ‘Refining, marketing and distribution’ customers are generally considered to be fully
performing until such time as the recoverability of the payment due is considered remote. Shown below is an analysis of the age of trade and
other receivables that are past due at the reporting date but have not been deemed by management to be impaired:
2007 2006Exploration & Refining, marketing Exploration & Refining, marketing
production & distribution production & distributionDays past due: $000 $000 $000 $000
Less than 30 41 455 200 –
30-90 567 33 339 –
Greater than 90 15,856 3 13,486 –
Total 16,464 491 14,025 –
The provision for credit losses of balances receivable from Exploration and production and Refining, marketing and distribution customers is
based on a review of balances determined to be impaired at the balance sheet date. In determining whether amounts due are impaired,
management considered quantitative factors such as period of time past due as well as qualitative factors including changes in business
environment and changes to the credit worthiness of counterparties.
As of 31 December 2007 a provision of $1.6 million (2006: $1.7 million) was raised against receivables deemed to be individually impaired.
Movements in the provision for credit losses by class are as follows:
2007 2006Exploration & Refining, marketing Exploration & Refining, marketing
production & distribution production & distributionDays past due: $000 $000 $000 $000
Provision for credit losses 1 January (1,746) – (1,917) –
Impairment of trade receivables (1,169) – (1,219) –
Receivables written off 1,174 – 1,390 –
Recoveries 131 – – –
Exchange adjustments –
Provision for credit losses 31 December (1,610) – (1,746) –
There is no formal rating for many of Sibir’s customers in Russia. Management considers these receivables to be fully performing based on an
assessment of both market conditions and historic payment information. The Group only trades with reputable and recognised third parties.
Management performs various evaluations of its customers before transacting and regularly monitors exposures and concentrations of credit
risk in order to manage the credit risk. The Group does not hold collateral as security in respect of any trade receivables.
The fair value of the Group’s financial assets together with the carrying amounts included in the balance sheet are analysed below and in note
20 (Available-for-sale financial assets) and note 24 (Cash and cash equivalents). Balances excluded from the scope of IAS 32 within trade
and other receivables comprise VAT receivable, prepayments and accrued income, with a carrying value of $149.6 million (2006:
$65.1 million). Due to the nature and/or short maturity of these financial instruments, carrying value approximates to fair value.
For all current and non-current financial instruments above, carrying value approximates fair value.
Carrying value Fair value Carrying value Fair value2007 2007 2006 2006$000 $000 $000 $000
Trade and other receivables 117,649 117,649 56,320 56,320
Current loans receivable 167,372 167,372 55,132 55,132
Non current loans receivable 506,987 506,987 552,860 552,860
71 SIBIR ENERGY PLC EXPLORATION, PRODUCTION, REFINING, MARKETING
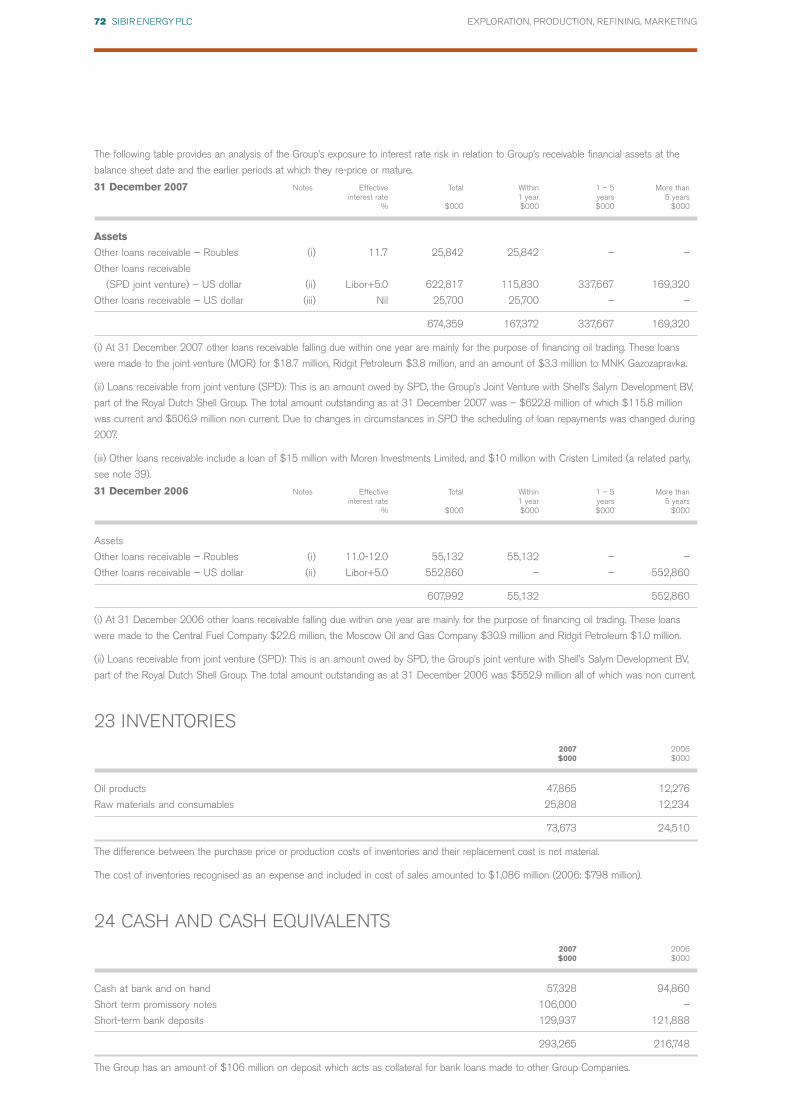
The following table provides an analysis of the Group’s exposure to interest rate risk in relation to Group’s receivable financial assets at the
balance sheet date and the earlier periods at which they re-price or mature.
31 December 2007 Notes Effective Total Within 1 – 5 More thaninterest rate 1 year years 5 years
% $000 $000 $000 $000
Assets
Other loans receivable – Roubles (i) 11.7 25,842 25,842 – –
Other loans receivable
(SPD joint venture) – US dollar (ii) Libor+5.0 622,817 115,830 337,667 169,320
Other loans receivable – US dollar (iii) Nil 25,700 25,700 – –
674,359 167,372 337,667 169,320
(i) At 31 December 2007 other loans receivable falling due within one year are mainly for the purpose of financing oil trading. These loans
were made to the joint venture (MOR) for $18.7 million, Ridgit Petroleum $3.8 million, and an amount of $3.3 million to MNK Gazozapravka.
(ii) Loans receivable from joint venture (SPD): This is an amount owed by SPD, the Group’s Joint Venture with Shell’s Salym Development BV,
part of the Royal Dutch Shell Group. The total amount outstanding as at 31 December 2007 was – $622.8 million of which $115.8 million
was current and $506.9 million non current. Due to changes in circumstances in SPD the scheduling of loan repayments was changed during
2007.
(iii) Other loans receivable include a loan of $15 million with Moren Investments Limited, and $10 million with Cristen Limited (a related party,
see note 39).
31 December 2006 Notes Effective Total Within 1 – 5 More thaninterest rate 1 year years 5 years
% $000 $000 $000 $000
Assets
Other loans receivable – Roubles (i) 11.0-12.0 55,132 55,132 – –
Other loans receivable – US dollar (ii) Libor+5.0 552,860 – – 552,860
607,992 55,132 552,860
(i) At 31 December 2006 other loans receivable falling due within one year are mainly for the purpose of financing oil trading. These loans
were made to the Central Fuel Company $22.6 million, the Moscow Oil and Gas Company $30.9 million and Ridgit Petroleum $1.0 million.
(ii) Loans receivable from joint venture (SPD): This is an amount owed by SPD, the Group’s joint venture with Shell’s Salym Development BV,
part of the Royal Dutch Shell Group. The total amount outstanding as at 31 December 2006 was $552.9 million all of which was non current.
23 INVENTORIES2007 2006$000 $000
Oil products 47,865 12,276
Raw materials and consumables 25,808 12,234
73,673 24,510
The difference between the purchase price or production costs of inventories and their replacement cost is not material.
The cost of inventories recognised as an expense and included in cost of sales amounted to $1,086 million (2006: $798 million).
24 CASH AND CASH EQUIVALENTS2007 2006$000 $000
Cash at bank and on hand 57,328 94,860
Short term promissory notes 106,000 –
Short-term bank deposits 129,937 121,888
293,265 216,748
The Group has an amount of $106 million on deposit which acts as collateral for bank loans made to other Group Companies.
72 SIBIR ENERGY PLC EXPLORATION, PRODUCTION, REFINING, MARKETING

The fair value of the Group’s financial assets together with the carrying amounts included in the balance sheet are analysed below and in note
20 (Available-for-sale financial assets) and note 22 (Trade and other receivables). Due to the nature and/or short maturity of these financial
instruments, carrying value approximates to fair value.
Carrying value Fair value Carrying value Fair value2007 2007 2006 2006$000 $000 $000 $000
Cash at bank and on hand 57,328 57,328 94,860 94,860
Short term promissory notes 106,000 106,000 – –
Short-term bank deposits 129,937 129,937 121,888 121,888
293,265 293,265 216,748 216,748
The following table provides the interest rate profile of the Group’s financial assets:
31 December 2007Notes Effective interest rate Total
% $000
Assets
Cash and cash equivalents – US Dollar promissory notes (i) 4.95 106,000
Cash and cash equivalents – US Dollar (non interest bearing) – 70,535
Cash and cash equivalents – US Dollar 4.30 6,600
Cash and cash equivalents – Russian Rouble (non interest bearing) – 33,752
Cash and cash equivalents – Russian Rouble 2.24 76,103
Cash and cash equivalents – Sterling (non interest bearing) – 275
293,265
(i) US Dollar promissory notes comprise cash deposits of the Company placed with Evrazbank.
31 December 2006Notes Effective interest rate Total
% $000
Assets
Cash and cash equivalents – US Dollar (non interest bearing) – 11,379
Cash and cash equivalents – US Dollar (i) Floating 121,888
Cash and cash equivalents – Russian Rouble (non interest bearing) – 83,357
Cash and cash equivalents – Sterling (non interest bearing) – 124
216,748
(i) The cash at bank comprises floating rate deposits placed on money markets at call.
25 TRADE AND OTHER PAYABLES
Current2007 2006$000 $000
Trade payables 115,805 19,116
Advances received 5,990 5,210
Accruals and deferred income 40,137 23,588
Other payables 3,607 –
Social security and other taxes 1,290 –
Finance leases (note 26) 1,025 –
167,854 47,914
73 SIBIR ENERGY PLC EXPLORATION, PRODUCTION, REFINING, MARKETING
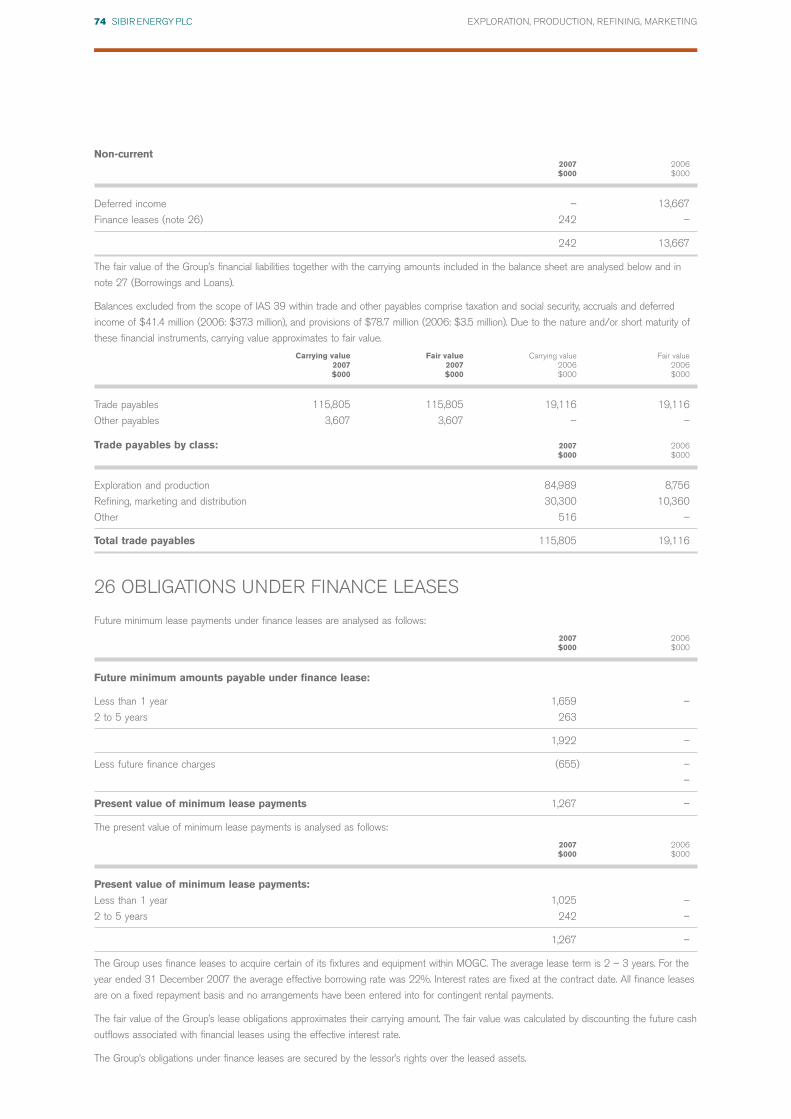
Non-current2007 2006$000 $000
Deferred income – 13,667
Finance leases (note 26) 242 –
242 13,667
The fair value of the Group’s financial liabilities together with the carrying amounts included in the balance sheet are analysed below and in
note 27 (Borrowings and Loans).
Balances excluded from the scope of IAS 39 within trade and other payables comprise taxation and social security, accruals and deferred
income of $41.4 million (2006: $37.3 million), and provisions of $78.7 million (2006: $3.5 million). Due to the nature and/or short maturity of
these financial instruments, carrying value approximates to fair value.
Carrying value Fair value Carrying value Fair value2007 2007 2006 2006$000 $000 $000 $000
Trade payables 115,805 115,805 19,116 19,116
Other payables 3,607 3,607 – –
Trade payables by class: 2007 2006$000 $000
Exploration and production 84,989 8,756
Refining, marketing and distribution 30,300 10,360
Other 516 –
Total trade payables 115,805 19,116
26 OBLIGATIONS UNDER FINANCE LEASES
Future minimum lease payments under finance leases are analysed as follows:
2007 2006$000 $000
Future minimum amounts payable under finance lease:
Less than 1 year 1,659 –
2 to 5 years 263
1,922 –
Less future finance charges (655) –
–
Present value of minimum lease payments 1,267 –
The present value of minimum lease payments is analysed as follows:
2007 2006$000 $000
Present value of minimum lease payments:
Less than 1 year 1,025 –
2 to 5 years 242 –
1,267 –
The Group uses finance leases to acquire certain of its fixtures and equipment within MOGC. The average lease term is 2 – 3 years. For the
year ended 31 December 2007 the average effective borrowing rate was 22%. Interest rates are fixed at the contract date. All finance leases
are on a fixed repayment basis and no arrangements have been entered into for contingent rental payments.
The fair value of the Group’s lease obligations approximates their carrying amount. The fair value was calculated by discounting the future cash
outflows associated with financial leases using the effective interest rate.
The Group’s obligations under finance leases are secured by the lessor’s rights over the leased assets.
74 SIBIR ENERGY PLC EXPLORATION, PRODUCTION, REFINING, MARKETING

27 BORROWINGS AND LOANS2007 2006$000 $000
Current amounts falling due within one year:
Bank borrowings 293,435 134,330
Debentures and other loans 16,945 –
310,380 134,330
Non-current amounts falling due after one year:
Bank borrowings 303,332 69,667
303,332 69,667
The fair value of the Group’s financial liabilities together with the carrying amounts included in the balance sheet are analysed below and in
note 25 (Trade and other payables). Due to the nature and/or short maturity of these financial instruments, carrying value approximates to fair
value.
Carrying value Fair value Carrying value Fair value2007 2007 2006 2006$000 $000 $000 $000
Short term borrowings 310,380 310,380 134,330 134,330
Long term borrowings 303,332 303,332 69,667 69,667
The following table provides an analysis of the Group’s exposure to interest rate risk in relation to Group’s financial liabilities at the balance
sheet date and the earlier periods at which they re-price or mature.
31 December 2007Notes Effective Total Within 1-2 years More than
interest rate 1 year 5 years% $000 $000 $000 $000
Liabilities
Bank borrowings – US Dollar loan (i) 6 106,000 106,000 – –
Bank borrowings – US Dollar loan (ii) (iii) 8.9 –12.5 94,000 35,000 – 59,000
Bank borrowings – US Dollar loan (iv) Libor+1.75 368,360 128,102 240,258 –
Bank borrowings – Sterling loan (v) Base+1.25 2,986 2,986 – –
Bank borrowings – Rouble loan (vi) (vii) 12.0 – 14.6 42,366 38,292 4,074 –
613,712 310,380 244,332 59,000
31 December 2006Notes Effective Total Within 1-2 years More than
interest rate 1 year 5 years% $000 $000 $000 $000
Liabilities
Bank borrowings – US Dollar loan (i) (ii) 8.0 187,666 117,999 69,667 –
Bank borrowings – Rouble loan 10.0 16,331 16,331 – –
203,997 134,330 69,667 –
The calculation of the effective interest rate takes into account any amortisation of loans that may have been effected.
Borrowing facilities
(i) At 31 December 2007, the Company’s subsidiary Evikhon had a $118 million facility with Evrazbank of which $106 million was drawn
down (2006: $118 million fully drawn down).
(ii) At 31 December 2007, the Company’s subsidiary Magma had non-trade finance facility from Sberbank totalling $75 million (secured by the
Group’s shareholding in Magma) of which $59 million was drawn down (2006: $75 million of which $69.7 million was drawn down).
(iii) At 31 December 2007, the Company’s subsidiary Magma had a trade finance facility from Rosselhozbank totalling $35 million of which
$35 million was drawn down (2006: none).
75 SIBIR ENERGY PLC EXPLORATION, PRODUCTION, REFINING, MARKETING

(iv) On 24 August 2007 the Company signed a term facility agreement with ING Bank N.V. and J.P. Morgan Plc for a value of $400 million in
order to fund the cash element of the MOGC acquisition and to refinance certain other indebtedness and provide a trading and refining facility.
At 31 December 2007 a total of $368 million of the facility was drawn down.
The facility is secured against the loans made by the Group to the SPD joint venture and all amounts repaid under these loans are utilised
directly to reduce the facility.
(v) On 28 February 2007 the Company entered into a Term Loan facility for $4.0 million with the Bank of Scotland to acquire a freehold
property. As at 31 December 2007 $3.0 million had been drawn down.
(vi) At 31 December 2007, the Company’s subsidiary Magma had a trade finance facility from Zenit Bank totalling $30 million of which
$21.4 million was drawn down (2006: none)
(vii) At 31 December 2007 the Company’s subsidiary MOGC had unsecured borrowings with Talibond Management $9.1 million, and
Kromerton Holdings $7.8 million.
At 31 December 2007 the Company’s subsidiary MOGC had borrowings with Bank of Moscow $4.1 million against which 100% of
Universalneft shares are held as collateral
At 31 December 2007 the Company’s subsidiary Magma had an undrawn facility of $40 million with the International Bank of Moscow.
(2006: $40 million dollars undrawn facility).
At 31 December 2007 the Company’s subsidiary Magma had an undrawn facility of $42.3 million with the Nomos Bank. (2006: none).
28 DEFERRED INCOME TAX LIABILITY (ASSET)
The movement in deferred tax assets and liabilities during the year, without taking into consideration the offsetting of balances within the
same tax jurisdiction, is as follows:Property, plant Unremitted
& equipment earnings Intangibles Other TotalDeferred income tax liabilities $000 $000 $000 $000 $000
At 1 January 2006 10,154 12,274 – 246 22,674
Charged (credited) to the income statement 211 790 – (246) 755
Currency translation (575) – – – (575)
At 31 December 2006 9,790 13,064 - - 22,854
Fair value adjustments on acquisition – – 80,878 – 80,878
Acquired during year 8,530 – – – 8,530
Charged (credited) to the income statement 3,329 (1,147) (617) 289 1,854
Currency translation – 211 2,540 – 2,751
At 31 December 2007 21,649 12,128 82,801 289 116,867
Tax losses Other TotalDeferred income tax assets $000 $000 $000
At 1 January 2006 – – –
Charged to the income statement – – –
Currency translation – – –
At 31 December 2006 – – –
Acquired during year 1,002 5,592 6,594
Charged to the income statement 450 153 603
Currency translation – – –
At 31 December 2007 1,452 5,745 7,197
The Group has tax losses of approximately $102,410,958 (2006: $64,245,000) arising in the UK that should be available indefinitely for
offset against future taxable profits. The tax returns for the years ended 31 December 2000 to 2006 for Sibir Energy plc have yet to be
agreed by HM Revenue & Customs and the tax losses could be reduced when the returns are agreed. Deferred tax assets have not been
recognised in respect of these losses because the Company is not expected to realise taxable profits against which these losses can be
offset in the foreseeable future.
At 31 December 2007, a deferred tax liability of $12,128,000 (2006: $13,064,000) was recognised for withholding taxes that would be
payable on the unremitted earnings of the Group’s subsidiaries on distribution to the parent company.
76 SIBIR ENERGY PLC EXPLORATION, PRODUCTION, REFINING, MARKETING

29 PROVISIONSDecommissioning Tax claims Vacant property Total
$000 $000 $000 $000
At 1 January 2007 1,717 – 1,761 3,478
Acquisition of MOGC – 67,921 – 67,921
Exchange difference (2) 3,568 – 3,566
Provided during the year 939 4,405 – 5,344
Unwinding of discount 158 – – 158
Utilisation of provision – – (1,761) (1,761)
At 31 December 2007 2,812 75,894 – 78,706
All provisions are considered to be non-current.
The decommissioning provision relates to the estimated net present cost of decommissioning the Group’s oil and gas assets at the end of
their useful lives. The estimate has been provided by the field operators and is based on oil reserves, price levels and technology at the
balance sheet date. The timing of the decommissioning payments is expected to be incurred over the next 20 to 30 years.
30 FINANCIAL INSTRUMENTS
A financial instrument is defined as any contract that gives rise to a financial asset of one entity and a financial liability or equity instrument of
another entity. The Group’s financial instruments comprise cash, investments in quoted and unquoted companies, loans receivable, accounts
receivable and accounts payable, borrowings and derivative financial instruments.
The main purpose of the financial instruments is to finance the Group’s operations.
Financial risk management
The Group’s normal operating, investing and financing activities expose it to a variety of financial risks: market risk (including currency risk,
interest rate risk and commodity price risk), credit risk and liquidity risk. The Group has in place risk management policies that seek to limit the
adverse effects of currency risk, commodity price risk, credit risk and liquidity risk on the financial performance of the Group.
Sensitivity analysis
The sensitivity analysis included in these notes has been prepared based on the year end balances.
It indicates how the profit or loss and equity at the reporting date would be affected by reasonably possible changes in market variables
(foreign currency rates, interest rates, commodity prices, and equity prices). It assumes these changes in the relevant risk variable had occurred
at the year end and been applied to the risk exposures in existence at that date. The reasonably possible changes in market variables used in
the sensitivity analysis were determined based on implied volatilities derived from a mixture of historical data and management’s estimate of
possible future changes in prices.
The sensitivity analysis provided is hypothetical and the impacts shown in this note are not necessarily indicative of the actual impacts that
would be experienced because the Group’s actual exposure to market rates is constantly changing as the Group’s portfolio of financial
instruments changes. The effect of a change in a particular market variable on fair values or cash flows is calculated without considering
interrelationships between the various market rates or mitigating actions that would be taken by the Group.
Excluded from this analysis are all non-financial assets and liabilities, including any oil, gas and oil product contracts which are for the Group’s
own purchase, sale or usage requirements which are outside the scope of IAS39.
Risks
Exposure to currency risk, interest rate risk, commodity price risk, equity price risk, credit risk and liquidity risk arises in the normal course of
the Group’s business.
For the purposes of these sensitivity analysis disclosures a tax rate of 24% has been applied (2006: 24%) as this is the prevailing tax rate in
Russia.
77 SIBIR ENERGY PLC EXPLORATION, PRODUCTION, REFINING, MARKETING
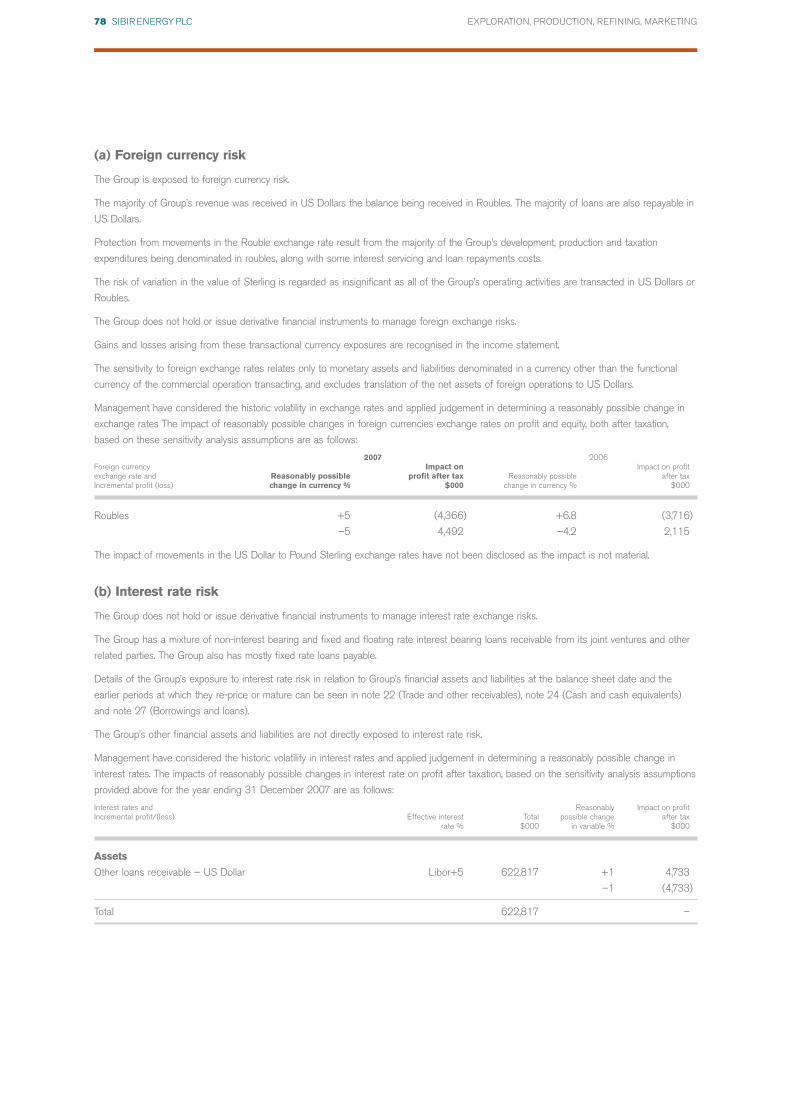
(a) Foreign currency risk
The Group is exposed to foreign currency risk.
The majority of Group’s revenue was received in US Dollars the balance being received in Roubles. The majority of loans are also repayable in
US Dollars.
Protection from movements in the Rouble exchange rate result from the majority of the Group’s development, production and taxation
expenditures being denominated in roubles, along with some interest servicing and loan repayments costs.
The risk of variation in the value of Sterling is regarded as insignificant as all of the Group’s operating activities are transacted in US Dollars or
Roubles.
The Group does not hold or issue derivative financial instruments to manage foreign exchange risks.
Gains and losses arising from these transactional currency exposures are recognised in the income statement.
The sensitivity to foreign exchange rates relates only to monetary assets and liabilities denominated in a currency other than the functional
currency of the commercial operation transacting, and excludes translation of the net assets of foreign operations to US Dollars.
Management have considered the historic volatility in exchange rates and applied judgement in determining a reasonably possible change in
exchange rates The impact of reasonably possible changes in foreign currencies exchange rates on profit and equity, both after taxation,
based on these sensitivity analysis assumptions are as follows:
2007 2006Foreign currency Impact on Impact on profitexchange rate and Reasonably possible profit after tax Reasonably possible after taxIncremental profit (loss) change in currency % $000 change in currency % $000
Roubles +5 (4,366) +6.8 (3,716)
–5 4,492 –4.2 2,115
The impact of movements in the US Dollar to Pound Sterling exchange rates have not been disclosed as the impact is not material.
(b) Interest rate risk
The Group does not hold or issue derivative financial instruments to manage interest rate exchange risks.
The Group has a mixture of non-interest bearing and fixed and floating rate interest bearing loans receivable from its joint ventures and other
related parties. The Group also has mostly fixed rate loans payable.
Details of the Group’s exposure to interest rate risk in relation to Group’s financial assets and liabilities at the balance sheet date and the
earlier periods at which they re-price or mature can be seen in note 22 (Trade and other receivables), note 24 (Cash and cash equivalents)
and note 27 (Borrowings and loans).
The Group’s other financial assets and liabilities are not directly exposed to interest rate risk.
Management have considered the historic volatility in interest rates and applied judgement in determining a reasonably possible change in
interest rates. The impacts of reasonably possible changes in interest rate on profit after taxation, based on the sensitivity analysis assumptions
provided above for the year ending 31 December 2007 are as follows:
Interest rates and Reasonably Impact on profitIncremental profit/(loss) Effective interest Total possible change after tax
rate % $000 in variable % $000
Assets
Other loans receivable – US Dollar Libor+5 622,817 +1 4,733
–1 (4,733)
Total 622,817 –
78 SIBIR ENERGY PLC EXPLORATION, PRODUCTION, REFINING, MARKETING

Interest rates and Reasonably Impact on profitIncremental profit/(loss) Effective interest Total possible change after tax
rate % $000 in variable % $000
Liabilities
Bank borrowings – US dollar loan Libor+1.75 368,360 +1 (2,936)
–1 2,936
Bank borrowings – Sterling loan Base rate+1.25 2,986 +1 (23)
–1 23
Total 371,346 –
The impacts of reasonably possible changes in interest rate on profit and equity, both after taxation, based on the sensitivity analysis
assumptions provided above for the year ending 31 December 2006 are as follows:
Interest rates and Effective interest Reasonably Impact on profitIncremental profit/(loss) rate % Total possible change after tax
$000 in variable % $000
Assets
Cash – US Dollar 4.5 121,888 +1 926
–1 (926)
Other loans receivable – US Dollar Libor +5 552,860 +1 4,202
–1 (4,202)
Total 674,748 –
Liabilities – – –
Total – – –
(c) Commodity price risk
The Group enters into oil and oil product purchase and sales contracts. As at 31 December 2007 all contracts were held for the purpose of
receipt or delivery of commodities in accordance with the Group’s own purchase, sale or usage requirements and are therefore out of the
scope of IAS 39, Financial Instruments: Recognition and Measurement (31 December 2006: nil). Accordingly these contracts are also out of
scope for disclosure in accordance with IFRS 7.
(d) Equity price risk
The Group’s Available-for-sale financial assets in 2006 comprised a 12.5% equity investment in Mostnefteprodukt, and a minor holding in
Fortune Oil plc.
As at 31 December 2007 the Group’s only remaining Available-for-sale financial asset is its minor holding in Fortune Oil plc, a Company listed
on the London Stock Exchange.
The impacts of reasonably possible changes in equity prices on profit and equity, both after taxation, based on the sensitivity analysis
assumptions provided above are as follows:2007 2006
Impact ImpactEquity prices and Reasonably on profit Impact on Reasonably on profit Impact onincremental profit/(loss) possible change after tax equity after tax possible change after tax equity after tax
in variable % $ $ in variable % $ $
FTSE All share (i) +10 – 4,146 +10 – 3,168
–10 – (4,146) –10 – (3,168)
Mosnefteprodukt (ii) – – – +15 – 2,793,000
– – – –15 – (2,793,000)
(i) The FTSE All Share index has been used as a basis for ascertaining a reasonably possible change in equity prices for the Group’s
investment in Fortune Oil plc (a quoted oil Company listed on the London Stock Exchange).
(ii) Management has used historic data and internally generated estimates of reasonably possible changes in market conditions to ascertain a
reasonably possible change in equity.
In September 2007 the Group acquired MOGC and as a result a further 38% stake in Mostnefteprodukt (note 21).
79 SIBIR ENERGY PLC EXPLORATION, PRODUCTION, REFINING, MARKETING
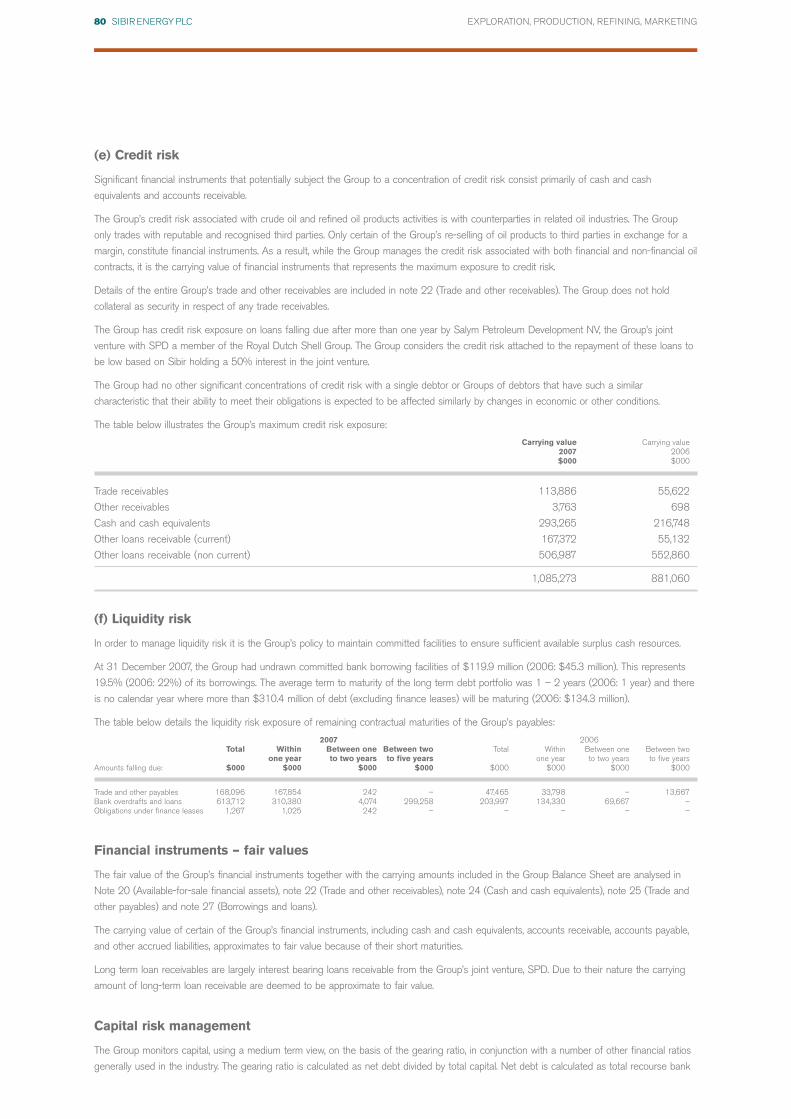
(e) Credit risk
Significant financial instruments that potentially subject the Group to a concentration of credit risk consist primarily of cash and cash
equivalents and accounts receivable.
The Group’s credit risk associated with crude oil and refined oil products activities is with counterparties in related oil industries. The Group
only trades with reputable and recognised third parties. Only certain of the Group’s re-selling of oil products to third parties in exchange for a
margin, constitute financial instruments. As a result, while the Group manages the credit risk associated with both financial and non-financial oil
contracts, it is the carrying value of financial instruments that represents the maximum exposure to credit risk.
Details of the entire Group’s trade and other receivables are included in note 22 (Trade and other receivables). The Group does not hold
collateral as security in respect of any trade receivables.
The Group has credit risk exposure on loans falling due after more than one year by Salym Petroleum Development NV, the Group’s joint
venture with SPD a member of the Royal Dutch Shell Group. The Group considers the credit risk attached to the repayment of these loans to
be low based on Sibir holding a 50% interest in the joint venture.
The Group had no other significant concentrations of credit risk with a single debtor or Groups of debtors that have such a similar
characteristic that their ability to meet their obligations is expected to be affected similarly by changes in economic or other conditions.
The table below illustrates the Group’s maximum credit risk exposure:
Carrying value Carrying value2007 2006$000 $000
Trade receivables 113,886 55,622
Other receivables 3,763 698
Cash and cash equivalents 293,265 216,748
Other loans receivable (current) 167,372 55,132
Other loans receivable (non current) 506,987 552,860
1,085,273 881,060
(f) Liquidity risk
In order to manage liquidity risk it is the Group’s policy to maintain committed facilities to ensure sufficient available surplus cash resources.
At 31 December 2007, the Group had undrawn committed bank borrowing facilities of $119.9 million (2006: $45.3 million). This represents
19.5% (2006: 22%) of its borrowings. The average term to maturity of the long term debt portfolio was 1 – 2 years (2006: 1 year) and there
is no calendar year where more than $310.4 million of debt (excluding finance leases) will be maturing (2006: $134.3 million).
The table below details the liquidity risk exposure of remaining contractual maturities of the Group’s payables:
2007 2006Total Within Between one Between two Total Within Between one Between two
one year to two years to five years one year to two years to five yearsAmounts falling due: $000 $000 $000 $000 $000 $000 $000 $000
Trade and other payables 168,096 167,854 242 – 47,465 33,798 – 13,667Bank overdrafts and loans 613,712 310,380 4,074 299,258 203,997 134,330 69,667 –Obligations under finance leases 1,267 1,025 242 – – – – –
Financial instruments – fair values
The fair value of the Group’s financial instruments together with the carrying amounts included in the Group Balance Sheet are analysed in
Note 20 (Available-for-sale financial assets), note 22 (Trade and other receivables), note 24 (Cash and cash equivalents), note 25 (Trade and
other payables) and note 27 (Borrowings and loans).
The carrying value of certain of the Group’s financial instruments, including cash and cash equivalents, accounts receivable, accounts payable,
and other accrued liabilities, approximates to fair value because of their short maturities.
Long term loan receivables are largely interest bearing loans receivable from the Group’s joint venture, SPD. Due to their nature the carrying
amount of long-term loan receivable are deemed to be approximate to fair value.
Capital risk management
The Group monitors capital, using a medium term view, on the basis of the gearing ratio, in conjunction with a number of other financial ratios
generally used in the industry. The gearing ratio is calculated as net debt divided by total capital. Net debt is calculated as total recourse bank
80 SIBIR ENERGY PLC EXPLORATION, PRODUCTION, REFINING, MARKETING
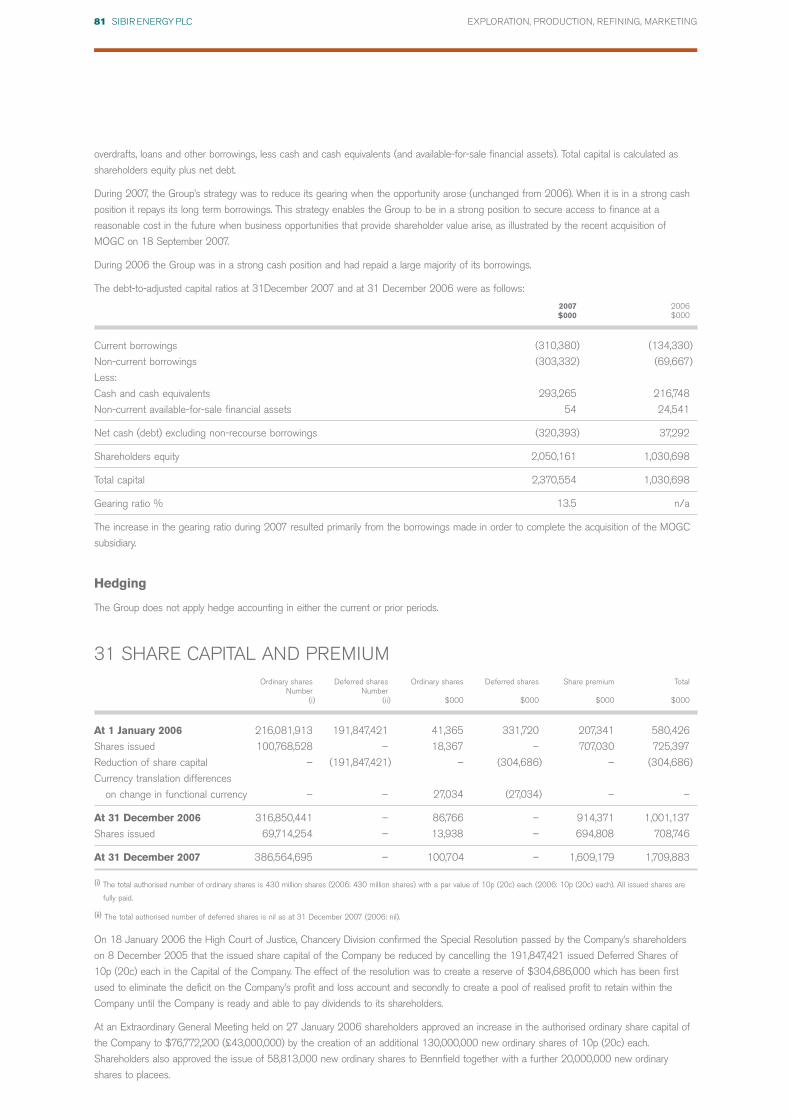
overdrafts, loans and other borrowings, less cash and cash equivalents (and available-for-sale financial assets). Total capital is calculated as
shareholders equity plus net debt.
During 2007, the Group’s strategy was to reduce its gearing when the opportunity arose (unchanged from 2006). When it is in a strong cash
position it repays its long term borrowings. This strategy enables the Group to be in a strong position to secure access to finance at a
reasonable cost in the future when business opportunities that provide shareholder value arise, as illustrated by the recent acquisition of
MOGC on 18 September 2007.
During 2006 the Group was in a strong cash position and had repaid a large majority of its borrowings.
The debt-to-adjusted capital ratios at 31December 2007 and at 31 December 2006 were as follows:
2007 2006$000 $000
Current borrowings (310,380) (134,330)
Non-current borrowings (303,332) (69,667)
Less:
Cash and cash equivalents 293,265 216,748
Non-current available-for-sale financial assets 54 24,541
Net cash (debt) excluding non-recourse borrowings (320,393) 37,292
Shareholders equity 2,050,161 1,030,698
Total capital 2,370,554 1,030,698
Gearing ratio % 13.5 n/a
The increase in the gearing ratio during 2007 resulted primarily from the borrowings made in order to complete the acquisition of the MOGC
subsidiary.
Hedging
The Group does not apply hedge accounting in either the current or prior periods.
31 SHARE CAPITAL AND PREMIUMOrdinary shares Deferred shares Ordinary shares Deferred shares Share premium Total
Number Number(i) (ii) $000 $000 $000 $000
At 1 January 2006 216,081,913 191,847,421 41,365 331,720 207,341 580,426
Shares issued 100,768,528 – 18,367 – 707,030 725,397
Reduction of share capital – (191,847,421) – (304,686) – (304,686)
Currency translation differences
on change in functional currency – – 27,034 (27,034) – –
At 31 December 2006 316,850,441 – 86,766 – 914,371 1,001,137
Shares issued 69,714,254 – 13,938 – 694,808 708,746
At 31 December 2007 386,564,695 – 100,704 – 1,609,179 1,709,883
(i) The total authorised number of ordinary shares is 430 million shares (2006: 430 million shares) with a par value of 10p (20c) each (2006: 10p (20c) each). All issued shares are
fully paid.
(ii) The total authorised number of deferred shares is nil as at 31 December 2007 (2006: nil).
On 18 January 2006 the High Court of Justice, Chancery Division confirmed the Special Resolution passed by the Company’s shareholders
on 8 December 2005 that the issued share capital of the Company be reduced by cancelling the 191,847,421 issued Deferred Shares of
10p (20c) each in the Capital of the Company. The effect of the resolution was to create a reserve of $304,686,000 which has been first
used to eliminate the deficit on the Company’s profit and loss account and secondly to create a pool of realised profit to retain within the
Company until the Company is ready and able to pay dividends to its shareholders.
At an Extraordinary General Meeting held on 27 January 2006 shareholders approved an increase in the authorised ordinary share capital of
the Company to $76,772,200 (£43,000,000) by the creation of an additional 130,000,000 new ordinary shares of 10p (20c) each.
Shareholders also approved the issue of 58,813,000 new ordinary shares to Bennfield together with a further 20,000,000 new ordinary
shares to placees.
81 SIBIR ENERGY PLC EXPLORATION, PRODUCTION, REFINING, MARKETING

On 12 December 2006 the Company completed the acquisition of a 25% + 1 share investment in STBP Holdings Limited, a network of 47
BP branded retail fuels stations in the City of Moscow and Moscow region. The consideration for the acquisition was settled by the issue of
21,955,520 ordinary shares of 10p (20c) each.
At an Extraordinary General Meeting of the Company held on 18 September 2007 shareholders approved all the resolutions necessary for
the Directors to complete the acquisition of MOGC.
As a result CFC, a Company owned by the Moscow City Government, has subscribed for 69,714,254 new ordinary shares in the Company in
exchange for the transfer of 35,010 common shares in MOGC to the Company. The new ordinary shares were admitted to trading on AIM at
8.00 am on 19 September 2007. At the same time, Sibir completed the acquisition of the 7,780 preferred shares in MOGC from CFC in
exchange for $200 million.
As a result, Sibir now owns 100% of MOGC, and CFC owns shares in Sibir representing 18.03% of Sibir’s issued share capital.
Share options
The Company has a share option scheme under which options to subscribe for the Company’s shares have been granted to certain
Executives and employees. At 31 December 2007 options under the scheme were outstanding. A total of 575,000 ordinary shares are
exercisable, with 475,000 exercisable at £1.00p ($1.99c) and 100,000 exercisable at £1.95p ($3.88c) (2006: 575,000 ordinary shares
exercisable, with 475,000 exercisable at £1.00p ($1.95c) and 100,000 exercisable at £1.95p ($3.81c)). The 475,000 ordinary share options
are exercisable at any time up to 9 June 2010 and the 100,000 ordinary shares options at any time up to 22 December 2014. No options
under the share option scheme were granted during 2007.
The Company on the 19 September 2007, as part of the acquisition of MOGC, granted CFC share options for 15,492,056 new ordinary
shares at an exercise price of $10.35. These ordinary shares options are exercisable at any time up to 24 February 2009.
The fair value of equity settled share options granted during 2007 is estimated at the date of grant using a Black-Scholes model taking into
account the terms and conditions upon which the options were granted. The following table lists the inputs to the model as estimated at the
grant date.
2007
Dividend yield (%) 1.4
Expected share price volatility (%) 32.6
Risk free interest rate (%) 5.8
Weighted average share price ($) 11.31
The amount taken to equity in respect to options granted on 19 September 2007 is $26,646,000.
32 OTHER RESERVESCapital Fair value Currency
redemption adjustment Shareholder Re-translation of translation Total otherreserve (i) reserve (ii) options (iii) quasi-equity (iv) reserve (v) reserves
$000 $000 $000 $000 $000 $000
At 1 January 2007 27,658 2,614 – (29,762) 1,357 1,867
Gains on fair value adjustment for
available-for-sale financial assets – (376) – – – (376)
Acquisition of subsidiary – (2,195) 26,646 – (1,129) 23,322
Currency translation differences on
translation of net investments in
joint ventures – – – (11,693) – (11,693)
Currency translation on translation
of share of Associates reserves – – – – 7,903 7,903
Currency translation differences on
translation of subsidiaries – – – – 54,303 54,303
Recycling to the income statement on
repayment of joint venture loans – – – 3,624 – 3,624
Reclassification to retained earnings
due to change in functional currency – – – – (26,998) ( 26,998)
At 31 December 2007 27,658 43 26,646 (37,831) 35,436 51,952
82 SIBIR ENERGY PLC EXPLORATION, PRODUCTION, REFINING, MARKETING

Capital Fair value Otherredemption adjustment Re-translation of translation Total
reserve(i) reserve(ii) quasi-equity (iv) reserve(v) other reserves$000 $000 $000 $000 $000
At 1 January 2006 27,658 29 20,293 (38,663) 9,317
Gains on fair value adjustment for available-for-sale
financial assets – 2,585 – – 2,585
Currency translation differences on translation of
subsidiaries – – – 40,020 40,020
Currency translation differences on translation of
net investments in joint ventures – – (50,055) – (50,055)
At 31 December 2006 27,658 2,614 (29,762) 1,357 1,867
(i) The capital redemption reserve arose in 2000 when the High Court approved a capital redemption and reduction scheme under which the Company acquired a number of its own
shares from a subsidiary undertaking. These shares were subsequently cancelled.
(ii) Certain investment assets under IFRS are treated as available-for-sale financial assets. These assets are recognised at their fair value and any gain or loss arising on revaluation at
the reporting date is recognised in this reserve.
(iii) This reserve relates to the Shareholder option granted as part of the MOGC acquisition. For further details see note 21.
(iv) This reserve contains foreign exchange differences arising on the re-translation of long term loans issued to the SPD joint venture which are recorded directly in equity.
(v) The currency translation reserve is used to record the current year and cumulative amount of foreign currency translation gains and losses recognised in equity arising on
retranslation of subsidiaries and associates.
33 RETAINED EARNINGS2007 2006$000 $000
1 January 2007 27,694 (362,350)
Total recognised income for the year 277,784 85,358
Dividends paid (44,150) –
Transfer from foreign currency translation reserve 26,998 –
Other translation adjustments – –
Reduction in share capital – 304,686
31 December 2007 288,326 27,694
34 MINORITY INTERESTS2007 2006$000 $000
1 January 2007 10,898 8,353
Profit attributable to minority interest 4,643 3,612
Changes in minority due to acquisition of subsidiaries 55,939 (1,067)
Foreign currency translation adjustments 2,212 –
31 December 2007 73,692 10,898
Minority interests at 31 December 2007 related to a 5% (2006: 5%) interest in Magma Oil Company and a 49.5% (2006: nil) interest in
Mosnefteproduct held by third parties.
83 SIBIR ENERGY PLC EXPLORATION, PRODUCTION, REFINING, MARKETING
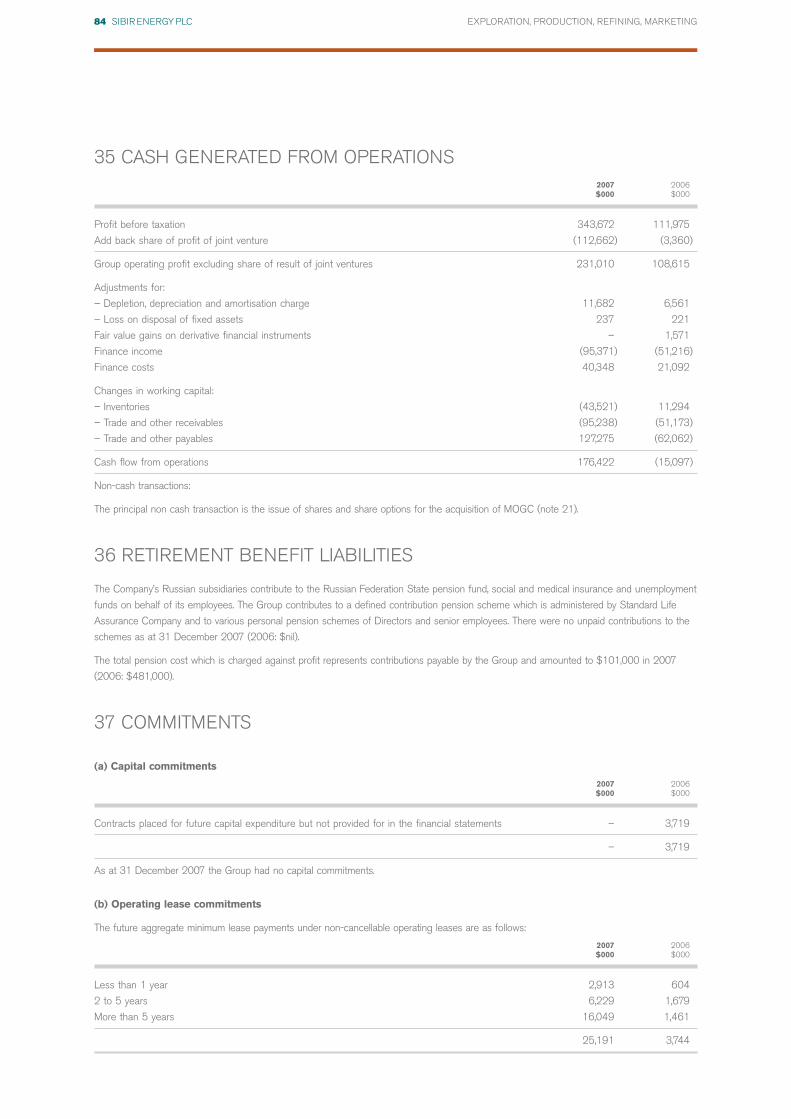
35 CASH GENERATED FROM OPERATIONS2007 2006$000 $000
Profit before taxation 343,672 111,975
Add back share of profit of joint venture (112,662) (3,360)
Group operating profit excluding share of result of joint ventures 231,010 108,615
Adjustments for:
– Depletion, depreciation and amortisation charge 11,682 6,561
– Loss on disposal of fixed assets 237 221
Fair value gains on derivative financial instruments – 1,571
Finance income (95,371) (51,216)
Finance costs 40,348 21,092
Changes in working capital:
– Inventories (43,521) 11,294
– Trade and other receivables (95,238) (51,173)
– Trade and other payables 127,275 (62,062)
Cash flow from operations 176,422 (15,097)
Non-cash transactions:
The principal non cash transaction is the issue of shares and share options for the acquisition of MOGC (note 21).
36 RETIREMENT BENEFIT LIABILITIES
The Company’s Russian subsidiaries contribute to the Russian Federation State pension fund, social and medical insurance and unemployment
funds on behalf of its employees. The Group contributes to a defined contribution pension scheme which is administered by Standard Life
Assurance Company and to various personal pension schemes of Directors and senior employees. There were no unpaid contributions to the
schemes as at 31 December 2007 (2006: $nil).
The total pension cost which is charged against profit represents contributions payable by the Group and amounted to $101,000 in 2007
(2006: $481,000).
37 COMMITMENTS
(a) Capital commitments
2007 2006$000 $000
Contracts placed for future capital expenditure but not provided for in the financial statements – 3,719
– 3,719
As at 31 December 2007 the Group had no capital commitments.
(b) Operating lease commitments
The future aggregate minimum lease payments under non-cancellable operating leases are as follows:
2007 2006$000 $000
Less than 1 year 2,913 604
2 to 5 years 6,229 1,679
More than 5 years 16,049 1,461
25,191 3,744
84 SIBIR ENERGY PLC EXPLORATION, PRODUCTION, REFINING, MARKETING

The Group has entered into short term commercial property and land rights leases. These leases have an average life of between 3 and 5
years with no renewal options included in the contracts. There are no formal restrictions placed upon the Group by entering into these leases.
38 CONTINGENT LIABILITIES AND ASSETS
Ongoing litigation or claims
On 9 June 1997 the Company’s subsidiary EuroSov Petroleum Limited as a condition of an assignment of contract debt agreed to arrange
delivery of certain Russian equipment valued at $500,000 to Henuset Pipeline Construction Limited (“Henuset”). Henuset had been
responsible for the construction of a pipeline at the Group’s subsidiary Magma. The equipment was handed over in 1998, however, in June
2000 a statement of claim for $750,000 was issued by Henuset which stated that they had not received all of the Russian equipment.
EuroSov Petroleum Limited is currently defending the claim.
In April 2007 the Company filed a Notice of Motion in the Alberta Court in Canada to have the action dismissed and on the 30 April 2007
the case was discontinued without costs to any party.
During the year, the Company was involved in a number of court proceedings (both as a plaintiff and a defendant) arising in the ordinary
course of business. In the opinion of management, there are no current legal proceedings or other claims outstanding which could have a
material effect on the result of operations or financial position of the Company and which have not been accrued or disclosed in these
consolidated financial statements.
Russian business operating environment
During the year ended 31 December 2007 all of the Group’s business was conducted in Russia through its investment in subsidiaries, joint
ventures, associates and trade investments operating in the oil and gas industry. These operations and those of similar companies in Russia
are subject to the economic, political and regulatory uncertainties prevailing in Russia.
The Russian economy, while deemed to be of market status beginning in 2002, continues to display certain traits consistent with that of a
market in transition. These characteristics have in the past included higher than normal historic inflation, lack of liquidity in the capital markets,
and the existence of currency controls, which cause the national currency to be illiquid outside Russia. Whilst there have been improvements in
the Russian economic situation, such as an increase in gross domestic product, Russia continues to develop economic reforms and improve its
legal, tax and regulatory frameworks to bring it more in line with a stable market economy. The future stability of the Russian economy is
largely dependent upon these reforms and developments and the effectiveness of economic, financial and monetary measures undertaken by
the government.
Guarantees issued
As at 31 December 2007 the Company’s subsidiary Magma has guaranteed the external bank loans of the Moscow Oil Refinery joint venture
for the value of $43.2 million.
Taxation
Russian tax, currency and customs legislation is subject to varying interpretations, and changes, which can occur frequently. Management’s
interpretation of such legislation as applied to the transactions and activity of the Group may be challenged by the relevant regional and
federal authorities. Recent events within the Russian Federation suggest that the tax authorities are taking a more assertive position in its
interpretation of the legislation and assessments and as a result, it is possible that transactions and activities that have not been challenged in
the past may be challenged. As such, significant additional taxes, penalties and interest may be assessed. It is not practical to determine the
amount of unasserted claims that may manifest, if any, or the likelihood of any unfavorable outcome. Fiscal periods remain open to review by
the authorities in respect of taxes for three calendar years preceding the year of review. Under certain circumstances reviews may cover
longer periods.
Management believes that the Group has complied with all regulations, and paid and accrued all taxes that are applicable. However, it is
possible that the relevant local or national governmental authorities may attempt to revise their previous approach to such transactions and
assess additional income and other taxes and duties against the Group. Having considered all the relevant factors, including the fact that in
practice the risk of retroactive tax assessment and penalty charges decreases significantly after three years, management believes that the
Group’s exposure to possible tax contingencies over and above taxes paid or accrued as at 31 December 2007 approximates $1.48m.
Should the Russian tax authorities question these initiatives and prove successful in their claim, they would be entitled to recover these
amounts, together with penalties amounting to 20% of such amounts and interest at the rate of 1/300th of the Central Bank of Russia rate,
equating to 10% as at 31 December 2007, for each day of delay for late payment of such amounts.
85 SIBIR ENERGY PLC EXPLORATION, PRODUCTION, REFINING, MARKETING

39 RELATED PARTY TRANSACTIONS
The following transactions were carried out with related parties:
Controlling shareholders agreement
A shareholders agreement between the Companies major investors was signed in September 2005. This agreement which came into force
upon completion of the Bennfield Subscription, stipulates that Bennfield Limited, Orton Oil Company Limited, Gradison Consultant Inc, Chalva
Tchigirinski and Igor Kesaev (the “Controlling Parties”) will agree that, for so long as they control the voting of 30% or more of the issued
Ordinary Shares in the capital of the Company (or until that share capital ceases to be admitted to trading on AIM or admitted to the Official
List of Financial Services Authority and to trading on the listed securities market of the London Stock Exchange plc) they will (except with the
consent of a majority of the Directors who are independent of the Controlling Parties (the “Independent Directors)):
• not use their voting power in relation to the Company to appoint or dismiss any Director nor appoint a majority of the board;
• not be interested in any company or business which carries on the same or a similar or related business to that of the Company (except
through being the holder for investment purposes of only 3% or less of the issued share capital of any publicly quoted company);
• not accept any offer for all or any of the shares which they own in the capital of the Company unless the offeror makes at the same time
as such an offer is made, an offer or offers for the share capital of the Company which the offeror would be required to make if the City
Code on Takeovers and Mergers applied to the Company;
• not vote in respect of any contract or arrangement with the Company in which they have an interest, except with the consent of the
Independent Directors;
• no behave in any way which is detrimental to the interest of the Shareholders as a whole or which precludes the company from carrying
on its business independently;
• conduct all transactions and relationships with the Company on an arm’s length basis on normal commercial terms; and
• ensure that the Board has at all times no fewer than two independent Directors.
During the continuance of these obligations, Sibir will not appoint a Chief Executive without the consent of Bennfield Limited, such consent
not to be unreasonably withheld.
STBP Holdings Limited (STBP)
On 12 December 2006 the Group completed the acquisition of a 25% plus one share interest in STBP Holdings Limited, a downstream fuels
retailing and distribution network of 47 BP branded retail fuels stations in the City of Moscow and Moscow region from Bennfield Limited. The
interest has been accounted for as an investment in an associate undertaking (note 18).
The consideration for the acquisition was settled by the issue of 21,955,520 new ordinary shares of 10p each and the total of $180,477,000
represents the fair value of this acquisition.
A dividend payment was made during 2007 of $15,138,000. There were no further related party transactions with STBP prior to the 2007
year end (2006: none).
Mall Gallery 1, 2 and 3
This Company is beneficially owned by Chalva Tchigirinski.
The company’s subsidiary Magma subleases office space to Mall Gallery 1, 2 and 3. The amount Invoiced to Magma in 2007 was $50,000
(2006: $133,156). During 2007 Magma ceased to sublease office space.
Gradison Consultant Inc (Gradison)
This Company is beneficially owned by Chalva Tchigirinski.
The Company’s subsidiary Sibenergy (Cyprus) Ltd borrowed $60.0 million for a period of 3 months during 2007 to assist in the purchase of
MOGC. Interest was charged at a rate of 10% per annum. The loan was fully repaid as at 31 December 2007.
86 SIBIR ENERGY PLC EXPLORATION, PRODUCTION, REFINING, MARKETING

Cristen Limited
This Company is beneficially owned by Chalva Tchigirinski.
As part of a review of logistics and their effect on the Company’s key human resources the Company concluded given the huge distances
over which the Company’s activities span and are likely to span that its efficiency would be improved and the wear and tear on key personnel
would be decreased by the purchase of a second hand Gulfstream jet which was available at a favourable price to market. The Company’s
decision was conditional on finding a partner which would share the cost of acquisition and operational expenses. In October 2007 the
Company entered into a conditional agreement with Cristen Limited for the acquisition of a Gulfstream jet. The partner withdrew from the
arrangement very recently and the Company feels the purchase is no longer justified and has since withdrawn from the transaction. The
termination has been accepted by the seller and the deposit paid of $10 million is due to be returned soon.
Central Fuel Company (CFC)
At an Extraordinary General Meeting of the Company held on 18 September 2007 shareholders approved all the resolutions necessary for
the Directors to complete the acquisition of Moscow Oil and Gas Company (MOGC). As a result, the Sibir Group now owns 100% of MOGC,
and CFC owns shares in Sibir Energy plc representing 18.03% of its issued share capital (note 21).
CFC is owned by the City of Moscow.
During 2006 Magma provided four Rouble-denominated loans to CFC. Interest was charged at rates of between 11% and 12.5%. The
amount oustanding at 31 December 2006 was 109,464,699 RUR ($22.6 million). These loans were provided to CFC in order to assist them
with the repayment of interest due on a $116 million loan that CFC had with the Bank of Moscow.
During 2007 these loans were fully repaid. Sales to and amounts owed by CFC relate to transactions entered into with Magma and related to
the sale of oil products.
A summary of these transactions are shown in the table below:
Period ended:Sales Purchases Amounts Amount
to CFC from CFC owed by CFC owed to CFC$000 $000 $000 $000
31 December 2007 166,099 – 5,489 –
Salym Petroleum Development NV (SPD)
This is a joint venture (note 17) of the Sibir Group. The table below details transactions between the Group companies and SPD:
Transaction Type & Detail:2007 2006$000 $000
Loans receivable (short term) 115,829 –
Loans receivable (long term) 506,988 552,860
Purchases of crude oil for production 185,610 126,870
Purchases of crude oil for resale 262,373 135,539
The Loans are provided by the Company and Evikhon with interest being charged at the US Dollar six month Libor rate plus 5%.
Moscow Oil Refinery (MOR)
This is a joint venture of the Sibir Group that was acquired as part of MOGC (note 17 and 21). The table below details transactions between
the Group companies and Moscow Oil Refinery:
Period ended:Sales Purchases Amounts Amount
to MOR from MOR owed by MOR owed to MOR$000 $000 $000 $000
31 December 2007 16,538 232,420 24,564 36,724
87 SIBIR ENERGY PLC EXPLORATION, PRODUCTION, REFINING, MARKETING
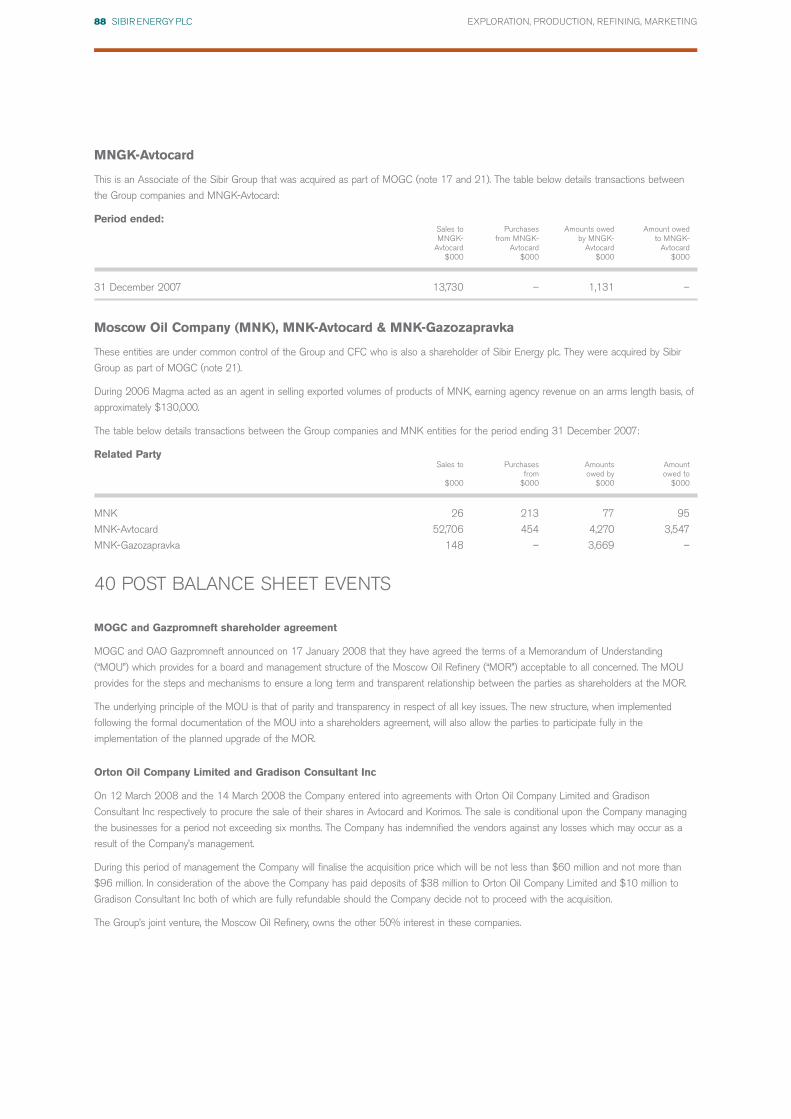
MNGK-Avtocard
This is an Associate of the Sibir Group that was acquired as part of MOGC (note 17 and 21). The table below details transactions between
the Group companies and MNGK-Avtocard:
Period ended:Sales to Purchases Amounts owed Amount owedMNGK- from MNGK- by MNGK- to MNGK-
Avtocard Avtocard Avtocard Avtocard$000 $000 $000 $000
31 December 2007 13,730 – 1,131 –
Moscow Oil Company (MNK), MNK-Avtocard & MNK-Gazozapravka
These entities are under common control of the Group and CFC who is also a shareholder of Sibir Energy plc. They were acquired by Sibir
Group as part of MOGC (note 21).
During 2006 Magma acted as an agent in selling exported volumes of products of MNK, earning agency revenue on an arms length basis, of
approximately $130,000.
The table below details transactions between the Group companies and MNK entities for the period ending 31 December 2007:
Related PartySales to Purchases Amounts Amount
from owed by owed to$000 $000 $000 $000
MNK 26 213 77 95
MNK-Avtocard 52,706 454 4,270 3,547
MNK-Gazozapravka 148 – 3,669 –
40 POST BALANCE SHEET EVENTS
MOGC and Gazpromneft shareholder agreement
MOGC and OAO Gazpromneft announced on 17 January 2008 that they have agreed the terms of a Memorandum of Understanding
(“MOU”) which provides for a board and management structure of the Moscow Oil Refinery (“MOR”) acceptable to all concerned. The MOU
provides for the steps and mechanisms to ensure a long term and transparent relationship between the parties as shareholders at the MOR.
The underlying principle of the MOU is that of parity and transparency in respect of all key issues. The new structure, when implemented
following the formal documentation of the MOU into a shareholders agreement, will also allow the parties to participate fully in the
implementation of the planned upgrade of the MOR.
Orton Oil Company Limited and Gradison Consultant Inc
On 12 March 2008 and the 14 March 2008 the Company entered into agreements with Orton Oil Company Limited and Gradison
Consultant Inc respectively to procure the sale of their shares in Avtocard and Korimos. The sale is conditional upon the Company managing
the businesses for a period not exceeding six months. The Company has indemnified the vendors against any losses which may occur as a
result of the Company’s management.
During this period of management the Company will finalise the acquisition price which will be not less than $60 million and not more than
$96 million. In consideration of the above the Company has paid deposits of $38 million to Orton Oil Company Limited and $10 million to
Gradison Consultant Inc both of which are fully refundable should the Company decide not to proceed with the acquisition.
The Group’s joint venture, the Moscow Oil Refinery, owns the other 50% interest in these companies.
88 SIBIR ENERGY PLC EXPLORATION, PRODUCTION, REFINING, MARKETING

The Directors are responsible for preparing the Annual Report and the financial statements in accordance with applicable law and regulations.
Company law requires the Directors to prepare financial statements for each financial year. Under that law the directors have elected to
prepare the financial statements in accordance with United Kingdom Generally Accepted Accounting Practice (United Kingdom Accounting
Standards and applicable law). The financial statements are required by law to give a true and fair view of the state of affairs of the Company
and of the profit or loss of the Company for that period. In preparing those financial statements, the Directors are required to:
• select suitable accounting policies and then apply them consistently;
• make judgements and estimates that are reasonable and prudent; and
• state whether applicable UK Accounting Standards have been followed, subject to any material departures disclosed and explained in
the financial statements.
The Directors are responsible for keeping proper accounting records that disclose with reasonable accuracy at any time the financial position
of the Company and enable them to ensure that the financial statements comply with the Companies Act 1985. They are also responsible for
safeguarding the assets of the Company and hence for taking reasonable steps for the prevention and detection of fraud and other
irregularities.
89 SIBIR ENERGY PLC EXPLORATION, PRODUCTION, REFINING, MARKETING
STATEMENT OF DIRECTORS’ RESPONSIBILITIESin relation to the parent company financial statements

We have audited the parent company financial statements of Sibir Energy plc for the year ended 31 December 2007 which comprise the
Balance Sheet and the related notes 1 to 18. These parent company financial statements have been prepared under the accounting policies
set out therein.
We have reported separately on the group financial statements of Sibir Energy plc for the year ended 31 December 2007.
This report is made solely to the company’s members, as a body, in accordance with Section 235 of the Companies Act 1985. Our audit work
has been undertaken so that we might state to the company’s members those matters we are required to state to them in an auditor’s report
and for no other purpose. To the fullest extent permitted by law, we do not accept or assume responsibility to anyone other than the company
and the company’s members as a body, for our audit work, for this report, or for the opinions we have formed.
Respective responsibilities of Directors and auditors
The directors’ responsibilities for preparing the Annual Report and the parent company financial statements in accordance with applicable
United Kingdom law and Accounting Standards (United Kingdom Generally Accepted Accounting Practice) are set out in the Statement of
Directors’ Responsibilities.
Our responsibility is to audit the parent Company financial statements in accordance with relevant legal and regulatory requirements and
International Standards on Auditing (UK and Ireland).
We report to you our opinion as to whether the parent company financial statements give a true and fair view and whether the parent
Company financial statements have been properly prepared in accordance with the Companies Act 1985. We also report to you whether in
our opinion the information given in the parent company directors’ report is consistent with the financial statements.
In addition we report to you if, in our opinion, the company has not kept proper accounting records, if we have not received all the information
and explanations we require for our audit, or if information specified by law regarding directors’ remuneration and other transactions is not
disclosed.
We read other information contained in the Annual Report and consider whether it is consistent with the audited parent company financial
statements. The other information comprises only the report of the Chairman and Chief Executive, the Downstream Operations review, the
Upstream Operations Review, the Financial Review, the Remuneration Report and the Directors’ Report. We consider the implications for our
report if we become aware of any apparent misstatements or material inconsistencies with the parent company financial statements. Our
responsibilities do not extend to any other information.
Basis of audit opinion
We conducted our audit in accordance with International Standards on Auditing (UK and Ireland) issued by the Auditing Practices Board. An
audit includes examination, on a test basis, of evidence relevant to the amounts and disclosures in the parent company financial statements. It
also includes an assessment of the significant estimates and judgments made by the directors in the preparation of the parent company
financial statements, and of whether the accounting policies are appropriate to the company’s circumstances, consistently applied and
adequately disclosed.
We planned and performed our audit so as to obtain all the information and explanations which we considered necessary in order to provide
us with sufficient evidence to give reasonable assurance that the parent company financial statements are free from material misstatement,
whether caused by fraud or other irregularity or error. In forming our opinion we also evaluated the overall adequacy of the presentation of
information in the parent company financial statements.
Opinion
In our opinion:
• the parent Company financial statements give a true and fair view, in accordance with United Kingdom Generally Accepted Accounting
Practice, of the state of the company’s affairs as at 31 December 2007;
• the parent company financial statements have been properly prepared in accordance with the Companies Act 1985; and
• the information given in the directors’ report is consistent with the parent Company financial statements.
Ernst & Young LLP
Registered auditor
London
30 June 2008
90 SIBIR ENERGY PLC EXPLORATION, PRODUCTION, REFINING, MARKETING
INDEPENDENT AUDITOR’S REPORT TOTHE MEMBERS OF SIBIR ENERGY PLC

At 31 December
2007 2006$000 $000
Notes
Fixed Assets
Tangible assets 3 4,417 204
Investments
Investment in associate 4 169,879 180,477
Other investments 5 1,327,203 353,964
1,501,499 534,645
Current Assets
Debtors
amounts falling due within one year 7 362,916 51,091
amounts falling due after more than one year 7 408,030 431,195
770,946 482,286
Cash at bank and in hand 131,575 119,098
902,521 601,384
Creditors: amounts falling due within one year 8 (333,322) (20,731)
Net Current Assets 569,199 580,653
Total Assets Less Current Liabilities 2,070,698 1,115,298
Creditors: amounts falling due after more than one year 8 (240,258) –
Provisions for liabilities 11 – (1,762)
1,830,440 1,113,536
Capital and Reserves
Called up share capital 12 100,704 86,766
Share premium account 14 1,609,179 914,371
Capital redemption reserve 14 27,658 27,658
Other reserves 14 26,646 –
Profit and loss account 14 66,253 84,741
Equity Shareholders Funds 1,830,440 1,113,536
Approved by the Board and authorised for issue on 30 June 2008
H O Cameron A Betsky
Chief Executive Officer Finance Director
30 June 2008 30 June 2008
91 SIBIR ENERGY PLC EXPLORATION, PRODUCTION, REFINING, MARKETING
COMPANY BALANCE SHEET

1 SIGNIFICANT ACCOUNTING POLICIES
Basis of preparation
The Parent Company financial statements of Sibir Energy plc (the “Company”) are presented as required by the Companies Act 1985 and
were approved for issue on 30 June 2008.
The financial statements are prepared under the historical cost convention in accordance with applicable UK Generally Accepted Accounting
Principles (UK GAAP).
No profit and loss account is presented for the Company as permitted by Section 230 of the Companies Act 1985.
The Company has taken advantage of the exemption in paragraph 2D of FRS 29 Financial instruments: Disclosures and has not disclosed
information required by that standard, as the Group’s consolidated financial statements, in which the Company is included, provide equivalent
disclosures for the Group under IFRS 7 Financial Instruments: Disclosures.
The principal accounting policies adopted by the Company are set out below together with an explanation of where changes have been made
to previous policies on the adoption of new accounting standards in the year.
Tangible fixed assets
Tangible fixed assets are stated at cost less accumulated depreciation and accumulated impairment losses. Depreciation is provided on all
tangible fixed assets on a straight-line basis so as to write off the cost less any estimated residual value of each asset evenly over its
estimated useful economic life as follows:
• Office equipment 3 to 10 years
• Motor vehicles 4 years
The carrying values of fixed assets are reviewed for impairment in the periods when events or changes in circumstances indicate that the
carrying value may not be recoverable. An impairment loss is provided for in the current period profit and loss account when the carrying value
of the assets exceeds their estimated recoverable amount. The estimated recoverable amount is defined as the higher of the net realisable
value and the value in use. The value in use is determined by reference to estimated future discounted cash flows.
Investments
Fixed asset investments in subsidiaries, are included in the Company financial statements at cost less provisions for impairment. All other fixed
asset investments are stated in the Company financial statements at cost less provisions for permanent diminution in value. All current asset
investments are stated at the lower of cost and net realisable value.
Cash flow statements
In accordance with the exemptions available under FRS 1 ‘Cash Flow Statements’ the Company has not presented a cash flow statement as
the Company cash flow is included in the Sibir Energy plc Group cash flow statement presented on page 42.
Related party transactions
The company has taken advantage of the exemption available under FRS 8 – ‘Related Party Disclosures’ with regard to the non-disclosure of
transactions between group companies. Related Party Disclosures is included in the notes to the Group Consolidated financial statements in
accordance with IAS 24 – ‘Related Party Disclosures’.
Trade and other receivables
Trade receivables, which generally have 30-90 day terms, are recognised and carried at the, lower of their original invoiced value and
recoverable amount. When the time value of money is material, receivables are carried at amortised cost. Provision is made when there is
objective evidence that the Company will not be able to recover balances in full. Balances are written off when the probability of recovery is
assessed as being remote.
92 SIBIR ENERGY PLC EXPLORATION, PRODUCTION, REFINING, MARKETING
NOTES TO THE COMPANY FINANCIAL STATEMENTS at 31 December 2007

Lease commitments
Operating lease rentals are charged to the profit and loss account as incurred.
Trade payables
Trade payables are recognised initially at fair value and subsequently measured at amortised cost using the effective interest method.
Pension costs
The Company contributes to a defined contribution scheme and to personal pension schemes. Contributions are charged to the profit and loss
account as they become payable.
Loans and borrowings
All loans and borrowings are recognised initially at fair value less directly attributable transaction costs incurred. After initial recognition interest-
bearing loans and borrowings are subsequently measured at amortised cost using the effective interest method.
Provisions for liabilities
A provision is recognised when the Company has a legal or constructive obligation as a result of a past event and it is probable that an
outflow of economic benefits will be required to settle the obligation.
Where the effect of the time value of money is material provisions are discounted.
Foreign currencies
Local currency
Sibir Energy plc is domiciled in the UK, although the Group’s operations are based in the Russian Federation. The local currency of the
Company was changed on 1 July 2007 from Pound Sterling to US Dollar as a result of significant changes in circumstances.
The significant circumstances that resulted in the necessary change of the local currency of the company to US dollars were an increase in
US Dollar funding for the MOGC purchase, repayment by SPD of previous US Dollar lendings and the distributable funds used to pay a
dividend originating in US Dollars.
On 1 July 2007 all assets and liabilities items were translated at exchange rate ruling for that day ($/£ 2.0064), and the profit and loss
account was translated at an average rate ($/£ 1.9703) for the first six months of 2007. The Equity items were recalculated from 1 January
2005 at the rate ruling at that date (see table below), with any subsequent movements being translated at an appropriate rate for the period.
All the currency translation changes are made in accordance with the UK GAAP accounting standard SSAP 20 ‘Foreign currency translation’.
Presentational currency
Given that the functional currency of the Company is now US Dollars, management have elected to present for the first time Company
financial statements in US Dollars.
This is a change from prior years when the financial statements were presented in pound sterling in line with the previous functional currency
of the Company.
Change in presentational currency
For the 2006 comparative period, assets and liabilities were translated into US Dollars using the closing rate ruling at the 2006 balance sheet
date ($/£ 1.9572).
Equity and Share capital items were translated using the historic closing rate applicable on 1 January 2005 and were not re translated at
each subsequent balance sheet date. All share capital transactions which were effected after 1 January 2005 were recorded using an
exchange rate which prevailed at the date of those transactions.
Resulting exchange differences were reflected as currency translation adjustments and included in the cumulative currency translation reserve.
93 SIBIR ENERGY PLC EXPLORATION, PRODUCTION, REFINING, MARKETING
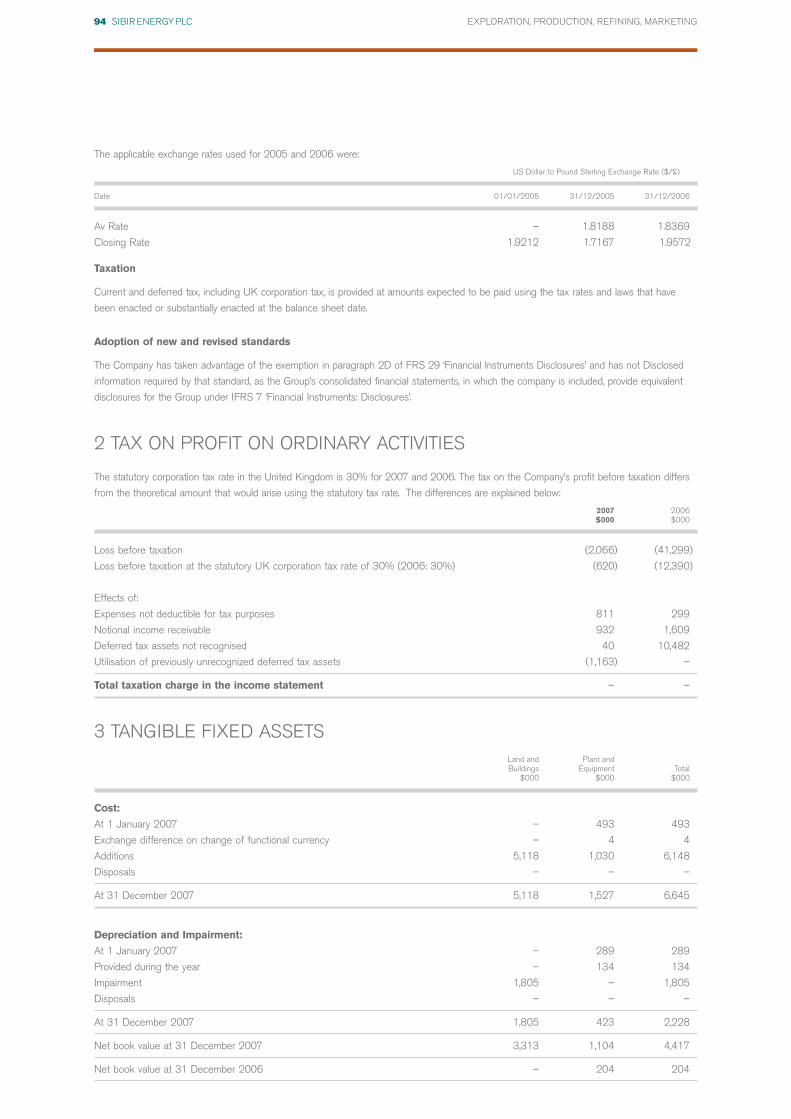
The applicable exchange rates used for 2005 and 2006 were:
US Dollar to Pound Sterling Exchange Rate ($/£)
Date 01/01/2005 31/12/2005 31/12/2006
Av Rate – 1.8188 1.8369
Closing Rate 1.9212 1.7167 1.9572
Taxation
Current and deferred tax, including UK corporation tax, is provided at amounts expected to be paid using the tax rates and laws that have
been enacted or substantially enacted at the balance sheet date.
Adoption of new and revised standards
The Company has taken advantage of the exemption in paragraph 2D of FRS 29 ‘Financial Instruments Disclosures’ and has not Disclosed
information required by that standard, as the Group’s consolidated financial statements, in which the company is included, provide equivalent
disclosures for the Group under IFRS 7 ‘Financial Instruments: Disclosures’.
2 TAX ON PROFIT ON ORDINARY ACTIVITIES
The statutory corporation tax rate in the United Kingdom is 30% for 2007 and 2006. The tax on the Company’s profit before taxation differs
from the theoretical amount that would arise using the statutory tax rate. The differences are explained below:
2007 2006$000 $000
Loss before taxation (2,066) (41,299)
Loss before taxation at the statutory UK corporation tax rate of 30% (2006: 30%) (620) (12,390)
Effects of:
Expenses not deductible for tax purposes 811 299
Notional income receivable 932 1,609
Deferred tax assets not recognised 40 10,482
Utilisation of previously unrecognized deferred tax assets (1,163) –
Total taxation charge in the income statement – –
3 TANGIBLE FIXED ASSETSLand and Plant andBuildings Equipment Total
$000 $000 $000
Cost:
At 1 January 2007 – 493 493
Exchange difference on change of functional currency – 4 4
Additions 5,118 1,030 6,148
Disposals – – –
At 31 December 2007 5,118 1,527 6,645
Depreciation and Impairment:
At 1 January 2007 – 289 289
Provided during the year – 134 134
Impairment 1,805 – 1,805
Disposals – – –
At 31 December 2007 1,805 423 2,228
Net book value at 31 December 2007 3,313 1,104 4,417
Net book value at 31 December 2006 – 204 204
94 SIBIR ENERGY PLC EXPLORATION, PRODUCTION, REFINING, MARKETING

In accordance with FRS 11 ‘Impairment of Fixed Assets and Goodwill’ he carrying value of the freehold property purchased in Aberdeen in
2007 has been compared to its recoverable amount, represented by its open market value, which has given rise to a impairment charge for
the year. The property was previously a leasehold property of the Company.
4 INVESTMENT IN ASSOCIATES
Group and Company
Share of nettangible assets Total
$000 $000
Cost:
At 1 January 2007 180,477 180,477
Exchange difference on change of functional currency 4,540 4,540
Less: Dividend payment (15,138) (15,138)
At 31 December 2007 169,879 169,879
On 12 December 2006 the Group completed the acquisition of a 25% plus one share interest in STBP Holdings Limited, a downstream fuels
retailing and distribution network of 47 BP branded retail fuels stations in the City of Moscow and Moscow region from Bennfield Limited. The
interest has been accounted for as an investment in an associate undertaking.
The consideration for the acquisition was settled by the issue of 21,955,520 new ordinary shares of 10p (20c) each and the total of
$180,477,326 (£92,212,000) represents the fair value of this acquisition.
The Group’s Associate undertaking at 31 December 2007 is as listed below.
Country of Class of share Proportion held Nature of Incorporation capital held by the Group business
STBP Holdings Limited Cyprus Ordinary 25% + 1 share Investment holding
5 OTHER INVESTMENTS
The market value of the investment in Fortune Oil plc, a company listed on the London Stock Exchange, was $54,119 at 31 December 2007
(2006 – $41,688).
CompanyShares in subsidiary Capital Contributions
undertakings to subsidiary Other fixed asset(b) & (c) undertaking investments (a) Total
Cost: $000 $000 $000 $000
At 1 January 2007 369,220 52,048 12 421,280
Additions 964,341 – – 964,341
Exchange difference on change of functional currency 9,281 1,309 – 10,590
At 31 December 2007 1,342,842 53,357 12 1,396,211
Amounts provided:
At 1 January 2007 58,728 8,588 – 67,316
Charges – – – –
Exchange difference on change of functional currency 1,475 217 – 1,692
At 31 December 2007 60,203 8,805 – 69,008
Net book value:
At 31 December 2007 1,282,639 44,552 12 1,327,203
At 31 December 2006 310,492 43,460 12 353,964
95 SIBIR ENERGY PLC EXPLORATION, PRODUCTION, REFINING, MARKETING
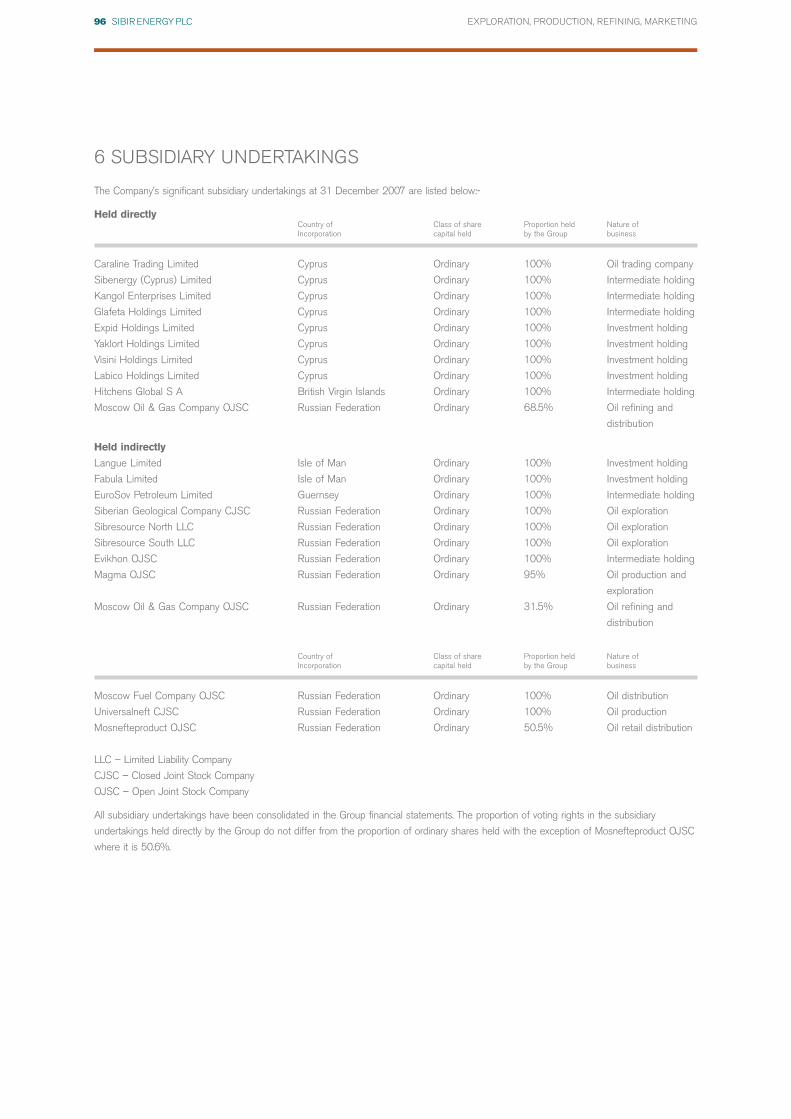
6 SUBSIDIARY UNDERTAKINGS
The Company’s significant subsidiary undertakings at 31 December 2007 are listed below:-
Held directlyCountry of Class of share Proportion held Nature of Incorporation capital held by the Group business
Caraline Trading Limited Cyprus Ordinary 100% Oil trading company
Sibenergy (Cyprus) Limited Cyprus Ordinary 100% Intermediate holding
Kangol Enterprises Limited Cyprus Ordinary 100% Intermediate holding
Glafeta Holdings Limited Cyprus Ordinary 100% Intermediate holding
Expid Holdings Limited Cyprus Ordinary 100% Investment holding
Yaklort Holdings Limited Cyprus Ordinary 100% Investment holding
Visini Holdings Limited Cyprus Ordinary 100% Investment holding
Labico Holdings Limited Cyprus Ordinary 100% Investment holding
Hitchens Global S A British Virgin Islands Ordinary 100% Intermediate holding
Moscow Oil & Gas Company OJSC Russian Federation Ordinary 68.5% Oil refining and
distribution
Held indirectly
Langue Limited Isle of Man Ordinary 100% Investment holding
Fabula Limited Isle of Man Ordinary 100% Investment holding
EuroSov Petroleum Limited Guernsey Ordinary 100% Intermediate holding
Siberian Geological Company CJSC Russian Federation Ordinary 100% Oil exploration
Sibresource North LLC Russian Federation Ordinary 100% Oil exploration
Sibresource South LLC Russian Federation Ordinary 100% Oil exploration
Evikhon OJSC Russian Federation Ordinary 100% Intermediate holding
Magma OJSC Russian Federation Ordinary 95% Oil production and
exploration
Moscow Oil & Gas Company OJSC Russian Federation Ordinary 31.5% Oil refining and
distribution
Country of Class of share Proportion held Nature of Incorporation capital held by the Group business
Moscow Fuel Company OJSC Russian Federation Ordinary 100% Oil distribution
Universalneft CJSC Russian Federation Ordinary 100% Oil production
Mosnefteproduct OJSC Russian Federation Ordinary 50.5% Oil retail distribution
LLC – Limited Liability Company
CJSC – Closed Joint Stock Company
OJSC – Open Joint Stock Company
All subsidiary undertakings have been consolidated in the Group financial statements. The proportion of voting rights in the subsidiary
undertakings held directly by the Group do not differ from the proportion of ordinary shares held with the exception of Mosnefteproduct OJSC
where it is 50.6%.
96 SIBIR ENERGY PLC EXPLORATION, PRODUCTION, REFINING, MARKETING
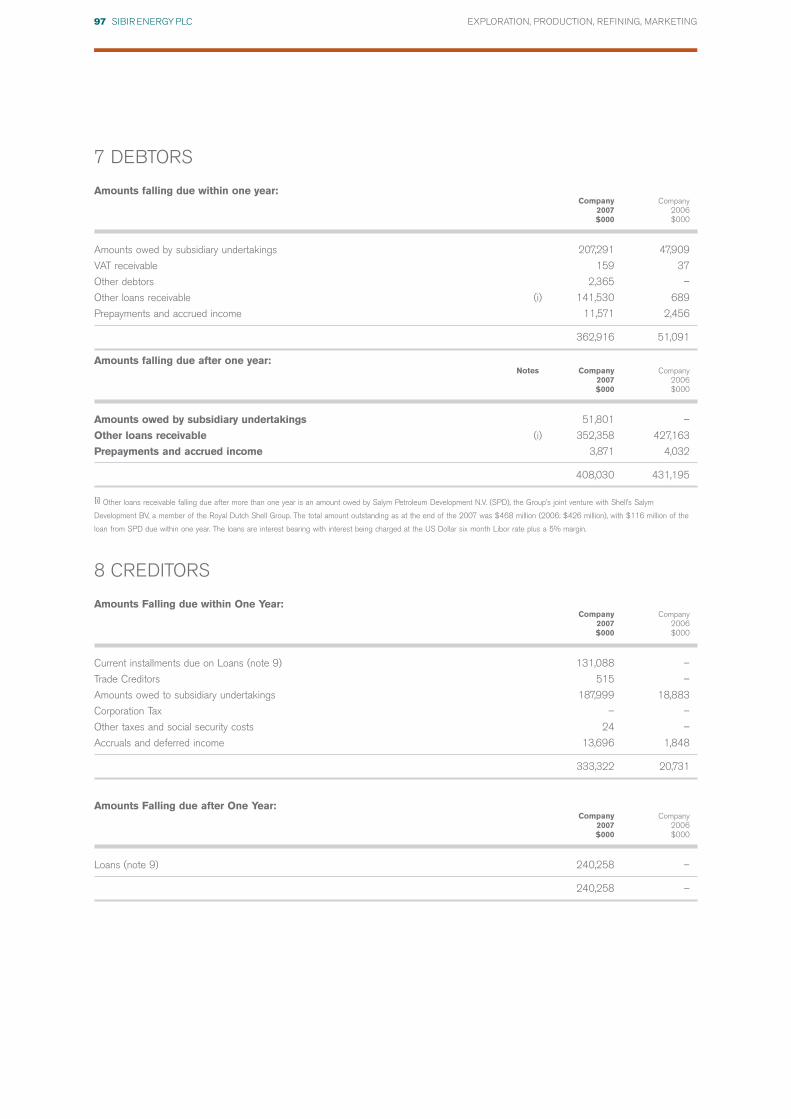
7 DEBTORS
Amounts falling due within one year:Company Company
2007 2006$000 $000
Amounts owed by subsidiary undertakings 207,291 47,909
VAT receivable 159 37
Other debtors 2,365 –
Other loans receivable (i) 141,530 689
Prepayments and accrued income 11,571 2,456
362,916 51,091
Amounts falling due after one year:Notes Company Company
2007 2006$000 $000
Amounts owed by subsidiary undertakings 51,801 –
Other loans receivable (i) 352,358 427,163
Prepayments and accrued income 3,871 4,032
408,030 431,195
[i] Other loans receivable falling due after more than one year is an amount owed by Salym Petroleum Development N.V. (SPD), the Group’s joint venture with Shell’s Salym
Development BV, a member of the Royal Dutch Shell Group. The total amount outstanding as at the end of the 2007 was $468 million (2006: $426 million), with $116 million of the
loan from SPD due within one year. The loans are interest bearing with interest being charged at the US Dollar six month Libor rate plus a 5% margin.
8 CREDITORS
Amounts Falling due within One Year:Company Company
2007 2006$000 $000
Current installments due on Loans (note 9) 131,088 –
Trade Creditors 515 –
Amounts owed to subsidiary undertakings 187,999 18,883
Corporation Tax – –
Other taxes and social security costs 24 –
Accruals and deferred income 13,696 1,848
333,322 20,731
Amounts Falling due after One Year:Company Company
2007 2006$000 $000
Loans (note 9) 240,258 –
240,258 –
97 SIBIR ENERGY PLC EXPLORATION, PRODUCTION, REFINING, MARKETING

9 LOANS
Loans repayable, included within creditors are analysed as follows:
2007 2006$000 $000
Wholly repayable within five years 371,346 –Not wholly repayable within five years – –
371,346 –
On 24 August 2007 the Company signed a term facility agreement with ING Bank N.V. and J.P. Morgan plc for a value of $400 million in
order to fund the cash element of the MOGC acquisition and to refinance certain other indebtedness and provide a trading and refining facility.
At 31 December 2007 a total of $368 million of the facility was drawn down.
The facility is secured against the loans made by the Group to SPD and all amounts repaid under these loans are utilised directly to reduce
the facility.
As at 31 December 2007 the amount of the loans and accrued interest due from SPD to the Group totalled $622.8 million of which $468.2
million was due to the Company.
Interest is charged at 3 months USD LIBOR +1.75% increasing to +2.75% from the 24 February 2008.
On the 28 February 2007 the Company entered into a term loan for $4.0 million (£2.0 million) with the Bank of Scotland to acquire a
freehold property. As at 31 December 2007 $3.0 million (£1.5 million) had been drawn down.
Interest is charged at the Bank of Scotland Base Rate +1.25%.
10 OBLIGATIONS UNDER OPERATING LEASES
Annual commitments under non-cancellable operating leases are as follows:
Land Land& buildings & buildings
2007 2006$000 $000
Operating leases which expire:Within one year 341 604In two to five years 365 1,679Over five years – 1,462
706 3,745
11 PROVISIONS FOR LIABILITIESBuildings Total
$000 $000
At 1 January 2007 1,762 1,762Additions – –Provision released on purchase of leasehold property (1,762) (1,762)
At 31 December 2007 – –
The provision is related to a lease agreement on the Company’s leasehold property in Aberdeen which is partially re-let. The provision of
$1.8 million (£0.9 million) was calculated to cover the anticipated future losses on sub-letting and would have been released over the
remaining life of the lease.
On 28 February 2007 the Company acquired the freehold of the property for $5.1 million (£2.5 million) and so the provision is no longer
required and has been fully released.
The purchase price of the property incorporated the value of the Company as tenant and consequently when the Company acquired the
freehold interest an impairment of $1.8 million (£0.9 million) was realised as a result of the future rental stream no longer being payable by
the Company. This reduced the property’s carrying value to $3.3 million, reflecting the current open market value of the property.
As a result of the purchase of the freehold on the property the net effect to the Company’s income statement for the year is $nil.
98 SIBIR ENERGY PLC EXPLORATION, PRODUCTION, REFINING, MARKETING

12 SHARE CAPITALAuthorised
31 December 31 December 31 December 31 December2007 2006 2007 2006
No No £ £
Ordinary shares of 10p each 430,000,000 430,000,000 43,000,000 43,000,000
43,000,000 43,000,000
Allotted, called up and fully paidOrdinary Deferred
shares shares Ordinary Deferred Share TotalNumber Number shares shares Premium
(i) (ii) $000 $000 $000 $000
At 1 January 2006 216,081,913 191,847,421 68,399 304,686 207,341 580,426
Shares issued 100,768,528 – 18,367 – 707,030 725,397
Reduction of share capital – (191,847,421) – (304,686) – (304,686)
At 31 December 2006 316,850,441 – 86,766 – 914,371 1,001,137
Shares issued 69,714,254 – 13,938 – 694,808 708,746
Reduction of share capital – – – – – –
386,564,695 – 100,704 – 1,609,179 1,709,883
(i) The total authorised number of ordinary shares is 430 million shares (2006: 430 million shares) with a par value of 10p (20c) each (2006: 10p (20c) each). All issued shares are
fully paid.
(ii) The total authorised number of deferred shares is nil as at 31 December 2007 (2006: nil).
On 18 January 2006 the High Court of Justice, Chancery Division confirmed the Special Resolution passed by the Company’s shareholders
on 8 December 2005 that the issued share capital of the Company be reduced by cancelling the 191,847,421 issued Deferred Shares of
10p (20c) each in the Capital of the Company. The effect of the resolution was to create a reserve of $304,686,000 which has been first
used to eliminate the deficit on the Company’s profit and loss account and secondly to create a pool of realised profit to retain within the
Company until the Company is ready and able to pay dividends to its shareholders.
At an Extraordinary General Meeting held on 27 January 2006 shareholders approved an increase in the authorised ordinary share capital of
the Company to $76,772,200 (£43,000,000) by the creation of an additional 130,000,000 new ordinary shares of 10p (20c) each.
Shareholders also approved the issue of 58,813,000 new ordinary shares to Bennfield together with a further 20,000,000 new ordinary
shares to places.
On 12 December 2006 the Company completed the acquisition of a 25% + 1 share investment in STBP Holdings Limited, a network of 47
BP branded retail fuels stations in the City of Moscow and Moscow region. The consideration for the acquisition was settled by the issue of
21,955,520 ordinary shares of 10p (20c) each.
At an Extraordinary General Meeting of the Company held on 18 September 2007 shareholders approved all the resolutions necessary for
the Directors to complete the acquisition of MOGC.
As a result CFC, a company owned by the Moscow City Government, has subscribed for 69,714,254 new ordinary shares in the Company in
exchange for the transfer of 35,010 common shares in MOGC to the Company. The new ordinary shares were admitted to trading on AIM at
8.00 am on 19 September 2007. At the same time, Sibir completed the acquisition of the 7,780 preferred shares in MOGC from CFC in
exchange for $200 million.
As a result, Sibir now owns 100% of MOGC, and CFC owns shares in Sibir representing 18.03% of Sibir’s issued share capital.
Share options
The company has a share option scheme under which options to subscribe for the company’s shares have been granted to certain Executives
and employees. At 31 December 2007 options under the scheme were outstanding. A total of 575,000 ordinary shares are exercisable, with
475,000 exercisable at 100p and 100,000 exercisable at 195p (2006: 575,000 ordinary shares exercisable, with 475,000 exercisable at
100p and 100,000 exercisable at 195p). The 475,000 ordinary share options are exercisable at any time up to 9 June 2010 and the
100,000 ordinary shares options at any time up to 22 December 2014. No options were granted during 2007.
The company on the 19 September 2007, as part of the acquisition of MOGC, granted CFC share options for 15,492,056 new ordinary
shares at an exercise price of $10.35. These ordinary shares options are exercisable at any time up to 24 February 2009.
99 SIBIR ENERGY PLC EXPLORATION, PRODUCTION, REFINING, MARKETING

The fair value of equity settled share options granted during 2007 is estimated at the date of grant using a Black-Scholes model taking into
account the terms and conditions upon which the options were granted. The following table lists the inputs to the model as estimated at the
grant date:
2007
Dividend yield (%) 1.40
Expected share price volatility (%) 32.24
Risk free interest rate (%) 5.53
Weighted average share price ($) 11.31
The amount taken to equity in respect to options granted on 19 September 2007 is $26,646,000.
13 LOSS FOR THE YEAR
As permitted by section 230 of the Companies Act 1985, the Company has elected not to present its own profit and loss account for the
year. The Company reported a loss for the financial year ended 31 December 2007 of $2,065,946 (2006: loss $41,299,434).
14 RESERVES
CompanyCapital Share Profit
Redemption premium Other and lossreserve account reserves account
£000 £000 £000 £000
At 1 January 2007 27,658 914,371 – 23,076
Profit for the year – – – (2,066)
Dividend declared and paid – – – (44,149)
Premium on shares issued – 694,808 – –
Foreign currency translation reserve arising on change in functional currency – – – 89,392
Cost of share options (note 12) – – 26,646 –
At 31 December 2007 27,658 1,609,179 26,646 66,253
The Company paid a dividend in 2007 of 7.0 pence per ordinary share (2006: none) amounting to $44,149,347 (£22,179,531). The dividend
was paid on the 16 August 2007 to shareholders on the register at the close of business on 2 August 2007, paid out of 2006 Group profits.
15 CONTINGENT LIABILITIES
At 31 December 2007, the Company had no outstanding guarantees in respect of the performance of obligations of third parties to help
finance the Group’s trading operations.
There were no post balance sheet guarantees issued after 31 December 2007.
100 SIBIR ENERGY PLC EXPLORATION, PRODUCTION, REFINING, MARKETING

16 PENSION COMMITMENTS
The Company contributes to a defined contribution pension scheme which is administered by Standard Life Assurance Company and to
various personal pension schemes of Directors and senior employees. There were no unpaid contributions to the schemes as at 31 December
2007 (2006: $nil).
17 AUDITORS REMUNERATION
The Company paid $98,695 (2006: $91,850) to its Auditors in respect of the audit of the financial statements of the Company for 2007.
Fees paid to Ernst & Young LLP and its associates for non-audit services to the Company itself are not disclosed in the individual accounts of
Sibir Energy plc because group financial statements are prepared which are required to disclose such fees on a consolidated basis.
18 EVENTS SINCE THE BALANCE SHEET DATE
MOGC and Gazpromneft shareholder agreement
MOGC and OAO Gazpromneft announced on 17 January 2008 that they have agreed the terms of a Memorandum of Understanding
("MOU") which provides for a board and management structure of the Moscow Oil Refinery ("MOR") acceptable to all concerned. The MOU
provides for the steps and mechanisms to ensure a long term and transparent relationship between the parties as shareholders at the MOR.
The underlying principle of the MOU is that of parity and transparency in respect of all key issues. The new structure, when implemented
following the formal documentation of the MOU into a shareholders' agreement, will also allow the parties to participate fully in the
implementation of the planned upgrade of the MOR.
Orton Oil Company Limited and Gradison Consultant Inc
On 12 March 2008 and the 14 March 2008 the Company entered into agreements with Orton Oil Company Limited and Gradison
Consultant Inc respectively to procure the sale of their shares in Avtocard and Korimos. The sale is conditional upon the Company managing
the businesses for a period not exceeding six months. The Company has indemnified the vendors against any losses which may occur as a
result of the Company’s management.
During this period of management the Company will finalise the acquisition price which will be not less than $60 million and not more than
$96 million. In consideration of the above the Company has paid deposits of $38 million to Orton Oil Company Limited and $10 million too
Gradison Consultant Inc both of which are fully refundable should The Company decide not to proceed with the acquisition.
The Group’s joint venture, the Moscow Oil Refinery, owns the other 50% interest in these companies.
101 SIBIR ENERGY PLC EXPLORATION, PRODUCTION, REFINING, MARKETING

CORPORATE DIRECTORY
Nominated Advisor
Strand Partners
26 Mount Row
London W1K 3SQ
Auditors
Ernst & Young LLP
1 More London Place
London
SE1 2AF
Registrars
Capita IRG Plc
The Registry
34 Beckenham Road
Beckenham
Kent BR3 4TU
Bankers
Bank of Scotland
54 John Street
Aberdeen
AB25 1LL
Registered Office
17c Curzon Street
London W1J 5HU
Tel: + 44 20 7495 7878
Fax: + 44 20 7495 8090
E-mail: [email protected]
Website: www.sibirenergy.com
Moscow Office
31 Novinskiy Boulevard
Moscow 123242
Tel: + 7 495 790 7840
Fax: + 7 495 790 7831
Registered
In England and Wales
Registered No. 3204093
Directors
William L S Guinness, Non-Executive Chairman
Henry O Cameron, Chief Executive
Alexander Betsky, Finance Director
Stuard Detmer, Downstream Operations Director
Urs Haener, Executive Director
Chalva Tchigirinski, Non-Executive Director
Secretary
Andrew Harrison
Solicitors
Jones Day
21 Tudor Street
London EC4Y 0DJ
Brokers
JPMorgan Cazenove Limited
20 Moorgate
London
EC2R 6DA
Communications Advisor
M Communications
Citypoint
1 Ropemaker Street
London EC2Y 9HT
102 SIBIR ENERGY PLC EXPLORATION, PRODUCTION, REFINING, MARKETING


sterling greenaways 104946
Design: www.energydesignstudio.com

SIBIR ENERGY PLC EXPLORATION, PRODUCTION, REFINING, MARKETING
DRILLING RIGS AT THE SALYM OIL FIELDS IN WESTERN SIBERIA
RUSSIAN AND INTERNATIONAL
104946 Sibir07_covers_AW 27/6/08 10:34 am Page 2

SIBIR ENERGY PLCANNUAL REPORT & ACCOUNTSFOR THE YEAR ENDED 31DECEMBER 2007
EXPLORATIONPRODUCTION REFINING MARKETING
SIBIR ENERGY PLC
104946 Sibir07_covers_AW 27/6/08 10:33 am Page 1