exploration of the clinical utility of high risk
TRANSCRIPT
Exploration of the Clinical Utility of High Risk Medication Regimens
A Dissertation SUBMITTED TO THE FACULTY OF
UNIVERSITY OF MINNESOTA BY
Catherine H Olson
IN PARTIAL FULFILLMENT OF THE REQUIREMENTS
FOR THE DEGREE OF DOCTOR OF PHILOSOPHY
Bonnie L Westra, PhD., RN, FAAN, FACMI
November 2014

© Catherine Olson 2014
i
Acknowledgements
The completion of my PhD was made possible by the mentorship of Dr. Bonnie
Westra. Her patience and guidance kept me sane as I juggled writing one paper while
revising another while researching another. Her willingness to meet with me at odd hours
and on weekends made the challenge achievable. Thanks also go to the authors who
contributed to the three papers within this dissertation – Sanjoy Dey, Vipin Kumar, Karen
Monsen, Terrence Adam and particularly Mary Dierich. I am grateful for Mary’s
willingness to go back to a subject that was the product of her own dissertation and
provide me the knowledge, expertise and data that allowed me to proceed. Additional
thanks to Drs. Kumar, Monsen and Adam for serving as my dissertation committee and
challenging me with questions and insights that raised the quality of this work.

ii
Dedication
This dissertation is dedicated to my family – particularly my husband and
children; to women and girls aspiring toward education and careers in STEM; and to
Bonnie Westra and the team of mentors and researchers at the University of Minnesota
who supported me to the finish line.
iii
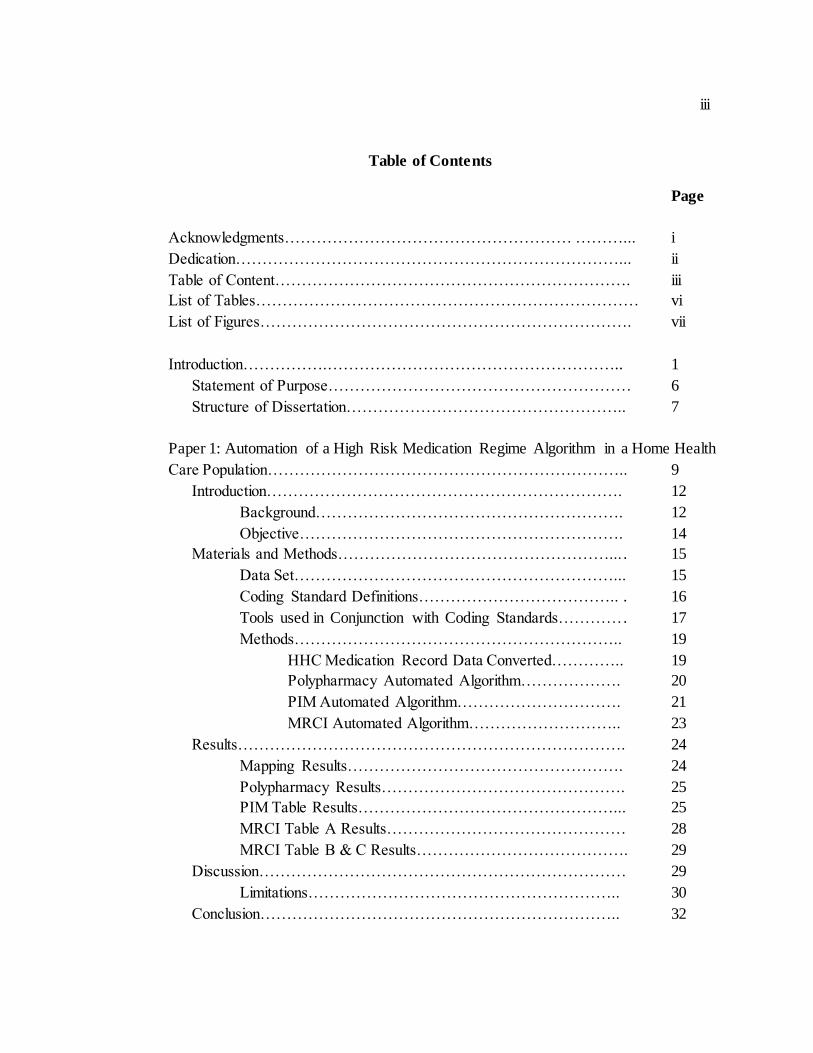
Table of Contents
Page
Acknowledgments……………………………………………… ………... i
Dedication………………………………………………………………... ii
Table of Content…………………………………………………………. iii
List of Tables……………………………………………………………… vi
List of Figures……………………………………………………………. vii
Introduction…………….……………………………………………….. 1
Statement of Purpose………………………………………………… 6
Structure of Dissertation…………………………………………….. 7
Paper 1: Automation of a High Risk Medication Regime Algorithm in a Home Health
Care Population………………………………………………………….. 9
Introduction…………………………………………………………. 12
Background…………………………………………………. 12
Objective……………………………………………………. 14
Materials and Methods……………………………………………... . 15
Data Set……………………………………………………... 15
Coding Standard Definitions……………………………….. . 16
Tools used in Conjunction with Coding Standards………… . 17
Methods…………………………………………………….. 19
HHC Medication Record Data Converted………….. 19
Polypharmacy Automated Algorithm………………. 20
PIM Automated Algorithm…………………………. 21
MRCI Automated Algorithm……………………….. 23
Results………………………………………………………………. 24
Mapping Results……………………………………………. 24
Polypharmacy Results………………………………………. 25
PIM Table Results…………………………………………... 25
MRCI Table A Results……………………………………… 28
MRCI Table B & C Results…………………………………. 29
Discussion…………………………………………………………… 29
Limitations………………………………………………….. 30
Conclusion………………………………………………………….. 32
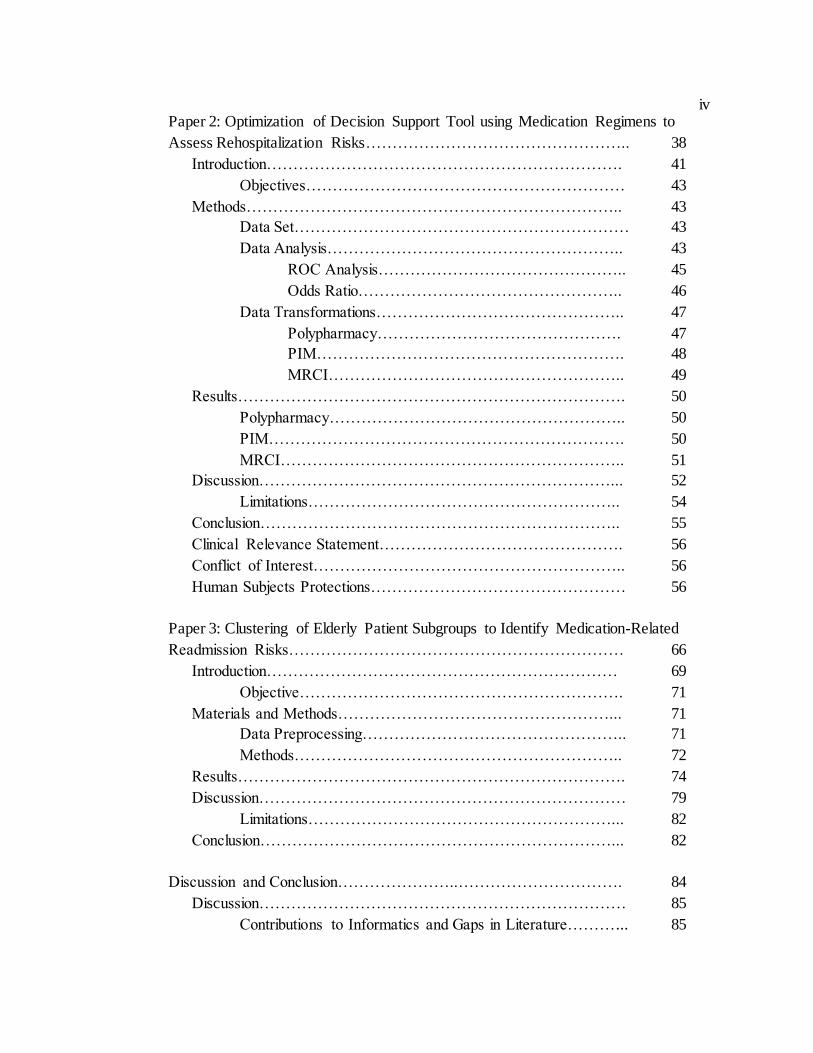
iv
Paper 2: Optimization of Decision Support Tool using Medication Regimens to
Assess Rehospitalization Risks………………………………………….. 38
Introduction…………………………………………………………. 41
Objectives…………………………………………………… 43 Methods…………………………………………………………….. 43
Data Set……………………………………………………… 43
Data Analysis……………………………………………….. 43
ROC Analysis……………………………………….. 45
Odds Ratio………………………………………….. 46
Data Transformations……………………………………….. 47
Polypharmacy………………………………………. 47
PIM…………………………………………………. 48
MRCI……………………………………………….. 49
Results………………………………………………………………. 50
Polypharmacy……………………………………………….. 50
PIM…………………………………………………………. 50
MRCI……………………………………………………….. 51
Discussion…………………………………………………………... 52
Limitations………………………………………………….. 54
Conclusion………………………………………………………….. 55
Clinical Relevance Statement………………………………………. 56
Conflict of Interest………………………………………………….. 56
Human Subjects Protections………………………………………… 56
Paper 3: Clustering of Elderly Patient Subgroups to Identify Medication-Related
Readmission Risks……………………………………………………… 66
Introduction………………………………………………………… 69
Objective……………………………………………………. 71
Materials and Methods……………………………………………... 71
Data Preprocessing………………………………………….. 71
Methods…………………………………………………….. 72
Results………………………………………………………………. 74
Discussion…………………………………………………………… 79
Limitations…………………………………………………... 82
Conclusion…………………………………………………………... 82
Discussion and Conclusion…………………..…………………………. 84
Discussion…………………………………………………………… 85
Contributions to Informatics and Gaps in Literature………... 85
v
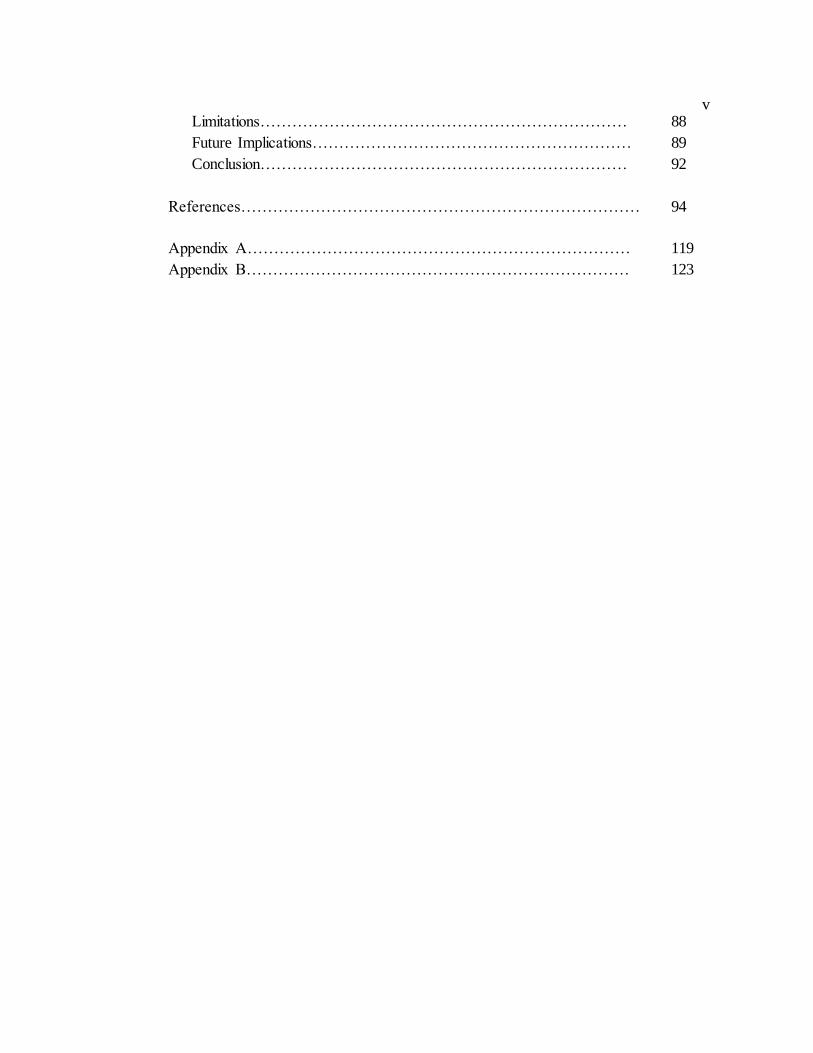
Limitations…………………………………………………………… 88
Future Implications…………………………………………………… 89
Conclusion…………………………………………………………… 92
References………………………………………………………………… 94
Appendix A……………………………………………………………… 119
Appendix B……………………………………………………………… 123
vi
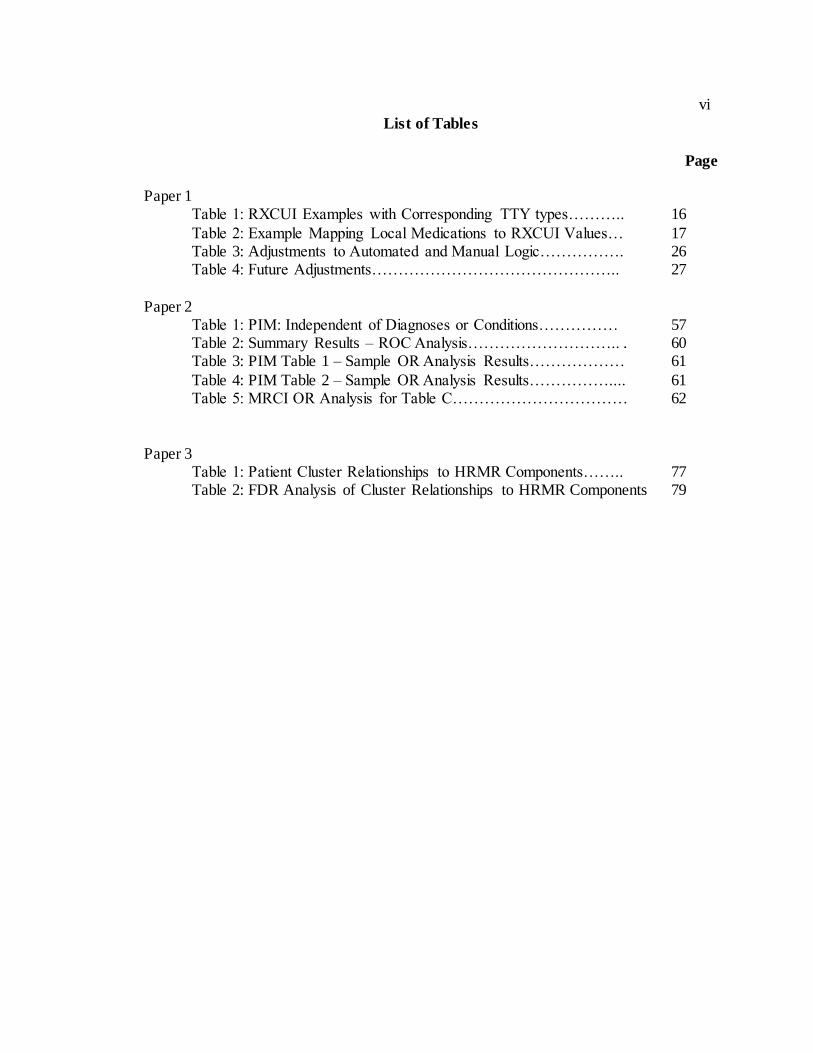
List of Tables
Page
Paper 1 Table 1: RXCUI Examples with Corresponding TTY types……….. 16
Table 2: Example Mapping Local Medications to RXCUI Values… 17 Table 3: Adjustments to Automated and Manual Logic……………. 26 Table 4: Future Adjustments……………………………………….. 27
Paper 2 Table 1: PIM: Independent of Diagnoses or Conditions…………… 57 Table 2: Summary Results – ROC Analysis……………………….. . 60 Table 3: PIM Table 1 – Sample OR Analysis Results……………… 61
Table 4: PIM Table 2 – Sample OR Analysis Results…………….... 61 Table 5: MRCI OR Analysis for Table C…………………………… 62
Paper 3 Table 1: Patient Cluster Relationships to HRMR Components…….. 77 Table 2: FDR Analysis of Cluster Relationships to HRMR Components 79
vii
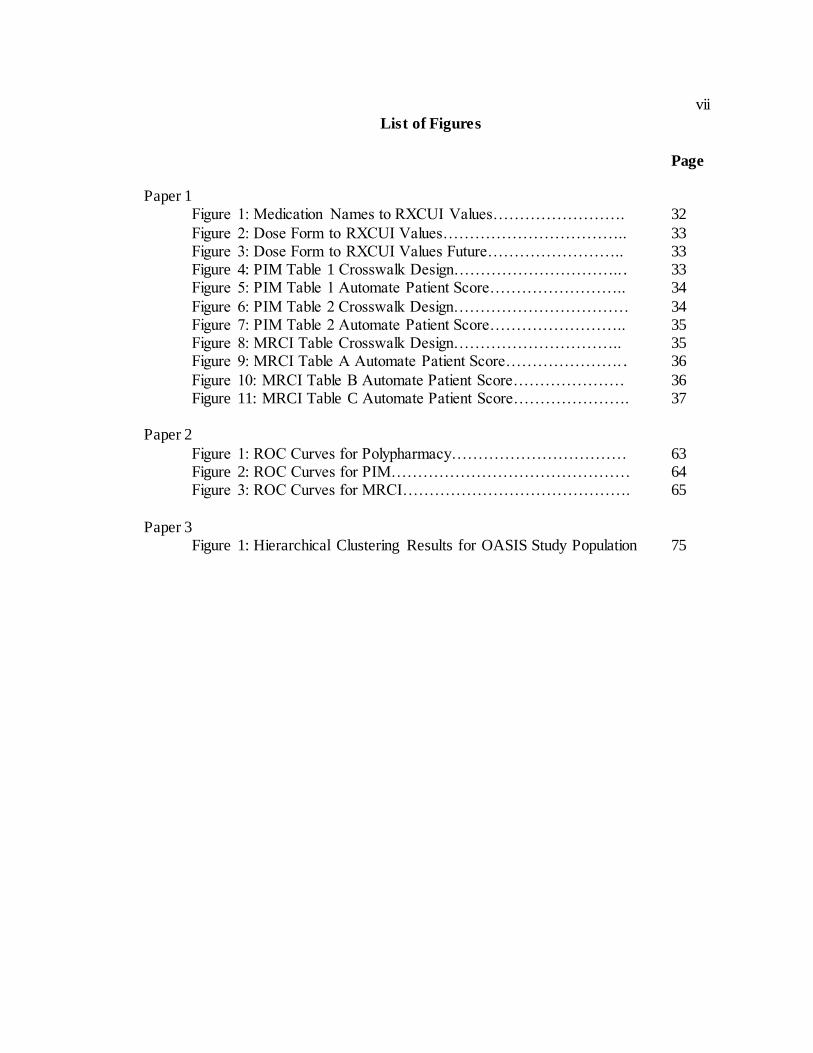
List of Figures
Page
Paper 1 Figure 1: Medication Names to RXCUI Values……………………. 32
Figure 2: Dose Form to RXCUI Values…………………………….. 33 Figure 3: Dose Form to RXCUI Values Future…………………….. 33 Figure 4: PIM Table 1 Crosswalk Design………………………….. . 33 Figure 5: PIM Table 1 Automate Patient Score…………………….. 34
Figure 6: PIM Table 2 Crosswalk Design…………………………… 34 Figure 7: PIM Table 2 Automate Patient Score…………………….. 35 Figure 8: MRCI Table Crosswalk Design………………………….. 35 Figure 9: MRCI Table A Automate Patient Score…………………. . 36
Figure 10: MRCI Table B Automate Patient Score………………… 36 Figure 11: MRCI Table C Automate Patient Score…………………. 37 Paper 2
Figure 1: ROC Curves for Polypharmacy…………………………… 63 Figure 2: ROC Curves for PIM……………………………………… 64 Figure 3: ROC Curves for MRCI……………………………………. 65
Paper 3 Figure 1: Hierarchical Clustering Results for OASIS Study Population 75

1
Introduction
2
1. Background
Avoidable hospital readmissions have become a common and much-publicized
issue in American health care, with research estimating that they waste billions of dollars
every year.(National Quality Forum, 2010a) A 2009 study by Jencks et al. focused
attention to the problem when it found that one-fifth of hospitalized Medicare patients
were readmitted within 30 days, and that 90 percent of those readmissions were
unplanned.(Jencks, Williams, & Coleman, 2009) Hospital groups have subsequently
made them a top priority in their quality improvement efforts (HealthEast Care System,
2010; Rennke et al., 2013; Schwartz, 2013) and the federal Medicare program has sought
to reduce hospitalizations by issuing penalties to hospitals with unacceptable 30-day
readmission rates.(Abelson, 2013; Rau, 2013) Medication problems have emerged in
research as a driver of readmissions and a target for hospitals seeking to improve the
quality of their care.(Bonnet-Zamponi et al., 2013; Kansagara et al., 2011; Morrissey,
Morrissey, McElnay, Scott, & McConnell, 2003) Four of five elderly patients leaving
Yale-New Haven Hospital experienced medication problems, according to a survey of
377 patients, because they didn’t understand their revised prescription regimens, or
because doctors prescribed the wrong drugs or doses or took their patients off drugs that
were still needed.(Ziaeian, Araujo, Van Ness, & Horwitz, 2012) Patients’ struggles with
managing their new prescription regimens have been associated with readmissions along
with confusion among doctors in reconciling their patients’ new prescription regimens
with the drugs they took before they were hospitalized.(Agency for Healthcare Research
and Quality, 2012; National Quality Forum, 2010b) A lack of access to affordable
3
medication has similarly been cited as a cause of adverse-drug events in patients that
pushes them back into hospital care.(Silow-Carroll, Edwards, & Lashbrook, 2011)
Estimates vary in terms of how many readmissions are due to medication issues, but one
study found nearly one in five readmissions of elderly patients was due to adverse drug
reactions, which are defined as “noxious and unintended” consequences of normal
medication usage.(Teymoorian, Dutcher, & Woods, 2011) Another study found nearly
one in four of these adverse reactions prompted hospital readmissions when only looking
at seniors 80 and older.(M. Zhang et al., 2009) Examining the broader concept of
“medication-related problems,” which includes not only adverse reactions but other
issues such as drug overuse, another study associated these problems with nearly 4 in 10
rehospitalizations in a sample population of elderly patients.(Bonnet-Zamponi et al.,
2013)
Hospitals over the past decade have been encouraged by groups such as the Joint
Commission to create medication reconciliation processes to make sure that changes in
prescriptions during admissions don’t leave patients with harmful, inadequate or
confusing drug regimens when they are discharged home or to another care
setting.(Agency for Healthcare Research and Quality, 2012) Pharmacists have been
engaged at more hospitals in discharge planning as well – often with the primary goal of
reducing avoidable readmissions.(Anderegg, Wilkinson, Couldry, Grauer, & Howser,
2014; Fera, Anderson, Kanel, & Ramusivich, 2014; Kirkham, Clark, Paynter, Lewis, &
Duncan, 2014; Pal, Babbott, & Wilkinson, 2013) Patient interviews have made it
apparent that a pamphlet or 15 minutes of instructions when they are about to be
4
discharged from hospital care aren’t enough.(Robert Wood Johnson Foundation, 2013)
While home visits by nurses(HealthEast Care System, 2010) and even
firefighters(Smetanka, 2014) might be effective alternatives, these can be expensive and
resource-intensive solutions. A challenge, as a result, is identifying which patients are at
greatest risk of readmissions and would benefit most from these sorts of prevention
strategies.(Kansagara et al., 2011; Morrissey et al., 2003; Walsh & Hripcsak, 2014)
Therefore, there is a need to identify medication-related predictors of hospital
readmissions.
Several medication measures have been studied in conjunction with hospital
readmissions. One potential predictor of hospital readmission is polypharmacy, a simple
count of the prescriptions in patients’ regimens, and whether the number of drugs
elevates readmission risk. Results of studies differ on whether polypharmacy is a risk
factor, and studies that have found a problem have varied in terms of the number of drugs
that separates patients into high- and low-risk groups.(Morandi et al., 2013; Sganga et al.,
2014) Other studies have looked at the role of Potentially Inappropriate Medications
(PIM) to determine if drugs with known risks in the elderly are driving readmissions.
Findings so far have varied from finding an association,(Price, Holman, Sanfilippo, &
Emery, 2014a) or no association,(Borenstein et al., 2013) or an association only in the
context with polypharmacy.(Sehgal et al., 2013) A third target for research on
medication-related readmission risks is the Medication Regimen Complexity Index
(MRCI),(George, Phun, Bailey, Kong, & Stewart, 2004) a measure of patients’ regimens
based on the complexity of the drugs by their instructions, dosing or routes. At least one
5
study attempted an automated approach to scoring this measurement,(McDonald et al.,
2013) while another found a relationship between MRCI and readmissions.(Willson,
Greer, & Weeks, 2014)
Dierich hypothesized that a combination of all three measures (polypharmacy,
PIM, and MRCI) could produce a more reliable indicator of readmission risk.(Dierich,
2010) Using factor analysis, she constructed a composite measure called High Risk
Medication Regimen (HRMR) that utilized all three medication indicators, and tested its
predictive power against the actual readmission histories of 911 adults from 15 Medicare-
certified home health care agencies. A structural equation model using HRMR as a
mediating variable was more predictive of readmissions than using comorbidity or any of
the three components on their own as mediating variables. HRMR accounted for a unique
variance of 10% in patients’ readmission risks as well as 20% of the comorbidity effect
of readmission.(Dierich, 2010)
A barrier to clinical utility of this discovery is the cumbersome, manual process
used in the initial research to produce patient HRMR scores. The medications for the 911
patients were described in generic text descriptions, and not standardized in a way that
could be used for data analysis and clinical decision support. Health care is gradually
moving toward standardized electronic health records (EHRs), though, with $30 billion in
federal funds helping hospitals and health systems achieve a basic level of competency
known as “meaningful use.”(Adler-Milstein et al., 2014) As of 2013, 59 percent of U.S.
hospitals had achieved Stage 1 certification with their EHR systems, which requires them
6
to track patient medication lists and allow electronic prescription ordering.(Adler-
Milstein et al., 2014)
2. Statement of Purpose
The overall purpose of this study was to transform the concept of HRMR into an
automated tool that could potentially be used in clinical care to assess patients’
medication-related rehospitalization risks. This was achieved by creating automated
processes that convert non-standardized medication information into formatted data for
analysis, and that calculate HRMR scores based on patients’ standardized drug data. The
rapidly expanding use of EHRs will greatly increase the potential for the automated
calculation of HRMRs and its possible use as a clinical decision support tool.
3. Structure of Dissertation
Three publishable papers for this dissertation describe the steps in the process for
transforming the concept of HRMR from a manual process to an automated process. The
papers: (1) create an automated approach to deriving HRMR scores and testing its
accuracy with the same home health care population Dierich used, (2) optimize the
calculation of HRMR scores to maximize the algorithm’s sensitivity to readmissions and
ready it for clinical utility, and (3) identify clusters of patients to determine if HRMR-
related readmission risks are more prevalent in certain demographic groups.
All three studies used Outcome and Assessment Information Set (OASIS) and
medication records for 911 adults from 15 Medicare-certified home health care agencies
7
that were used in the original Dierich study. OASIS data were obtained from electronic
health records for the patients, all of whom were at least 65 and were admitted from the
hospital to home health care in 2004. The data included demographic, environmental,
support system, health and functional status, and health service utilization
information.(Centers for Medicare and Medicaid Services (CMS), 2012b) Medication
data included the medication names, doses, dose forms, frequencies and special
instructions.(Dierich, 2010)
The first study automated the algorithm by automatically mapping the medication
data to RxNorm, a nomenclature created by the U.S. Library of Medicine (NLM) to
match standardized drug terms with other commonly used names for drugs in medical
records.(National Library of Medicine, 2013) HRMR scores were then calculated based
on the standardized medication data. The automated algorithm was designed using
RxNorm and NLM application programming interfaces, or APIs, for easy replication and
application across different health care systems and databases. Results have been
accepted for publication in the Journal of Biomedical Informatics and are available
online.(Olson, Dierich, & Westra, 2014)
The second study used odds ratio analyses, literature reviews and clinical
judgments to adjust the scoring of patients’ HRMRs. Receiver Operating Characteristic
(ROC) analysis evaluated whether these adjustments improved the predictive strength of
the algorithm. The paper has been accepted and published in the Journal of Applied
Clinical Informatics.(Olson, Dierich, Adam, & Westra, 2014)
8
The third study used unsupervised clustering to identify patient population
subgroups. HRMR scores were then applied to these subgroups, and ROC and False
Discovery Rate (FDR) analysis evaluated whether the predictive strength of the algorithm
increased for a specific patient population subgroup. The paper has been formatted and
submitted for publication in a peer-reviewed informatics journal.
All three manuscripts are included in the subsequent chapters for this dissertation,
and the formats are consistent with the instructions of the respective journals to which
they have been submitted. Chapter five includes a summary of major findings from this
project along with a unified reference list for the introduction, the three papers and the
conclusion.
9
Paper 1:
Automation of a High Risk Medication
Regime Algorithm in a Home Health Care
Population
10
Automation of a High Risk Medication Regime Algorithm in a Home Health
Care Population
Primary Investigator Catherine H Olson
PhD Candidate, Biomedical Health Informatics University of Minnesota
330 Diehl Hall 505 Essex Street SE
Minneapolis, MN 55455 612-626-3348
Other Investigators Mary Dierich, PhD, RN, C-GNP
Clinical Associate Professor, School of Nursing University of Minnesota
Minneapolis, Minnesota [email protected]
Bonnie L Westra, PhD, RN, FAAN, FACMI
Associate Professor, School of Nursing University of Minnesota Minneapolis, Minnesota
11
Objective: Create an automated algorithm for predicting elderly patients’
medication-related risks for readmission and validate it by comparing results with a
manual analysis of the same patient population.
Materials and Methods: Outcome and Assessment Information Set (OASIS) and
medication data were reused from a previous, manual study of 911 patients from 15
Medicare-certified home health care agencies. The medication data was converted into
standardized drug codes using APIs managed by the National Library of Medicine
(NLM), and then integrated in an automated algorithm that calculates patients’ high risk
medication regime scores (HRMRs). A comparison of the results between algorithm and
manual process was conducted to determine how frequently the HRMR scores were
derived which are predictive of readmission.
Results: HRMR scores are composed of polypharmacy (number of drugs),
Potentially Inappropriate Medications (PIM) (drugs risky to the elderly), and Medication
Regimen Complexity Index (MRCI) (complex dose forms, instructions or
administration). The algorithm produced polypharmacy, PIM, and MRCI scores that
matched with 99, 87 and 99 percent of the scores, respectively, from the manual analysis.
Discussion: Imperfect match rates resulted from discrepancies in how drugs were
classified and coded by the manual analysis vs. the automated algorithm. HRMR rules
lack clarity, resulting in clinical judgments for manual coding that were difficult to
replicate in the automated analysis.
12
Conclusion: The high comparison rates for the three measures suggest that an
automated clinical tool could use patients’ medication records to predict their risks of
avoidable readmissions.
Keywords: Rehospitalization, Avoidable Readmission, High Risk Medication
Regimen, Home Health Care, Algorithm, RXNorm
1. Introduction
1.1. Background
Avoidable hospital readmissions are indicators of “wasteful” health care
spending(National Quality Forum, 2010a) and of poor quality care and discharge
planning for patients. A 2003-2004 claims analysis found that a fifth of Medicare patients
were rehospitalized within 30 days of initial discharges, and that 90% of those
readmissions were unplanned.(Jencks et al., 2009) The cost to Medicare in 2004 alone
was $17.4 billion, the analysis found, and the readmissions were associated with longer
follow-up hospital stays. Estimates vary widely in terms of how many unplanned
readmissions are avoidable,(van Walraven, Bennett, Jennings, Austin, & Forster, 2011)
but all hospital stays expose patients to risks of delirium, infections and iatrogenic
consequences of tests and procedures.(Allegranzi, 2011; Inouye, Schlesinger, & Lydon,
1999) Identifying patients at greatest risk and offering them support to prevent
readmissions has consequently become a top priority for hospitals – especially now that
13
the federal Medicare program financially penalizes hospitals with 30-day readmission
rates deemed unacceptably high.(Abelson, 2013)
Some health systems and hospitals have reported early success in identifying
patients at risk for potentially avoidable readmissions(Donze, Aujesky, Williams, &
Schnipper, 2013) and providing these at-risk patients with post-discharge home visits and
other preventive care services.(Bonnet-Zamponi et al., 2013; HealthEast Care System,
2010; Schwartz, 2013) However, one study concluded the evidence in favor of such post-
discharge programs remains weak(Rennke et al., 2013) and another concluded that
systems to identify patients at greatest risk for readmissions have “performed
poorly.”(Kansagara et al., 2011) Meanwhile, two-thirds of U.S. hospitals are paying
federal penalties for having more readmissions than would be expected given their patient
populations.(Rau, 2013)
In the search for a better way to reduce readmissions, focusing on medications
would seem to offer a promising target. A survey of 377 elderly patients discharged from
Yale-New Haven Hospital found 81.4% of elderly patients experienced medication
problems after hospital discharges because they didn’t understand changes to their drug
regimens or because doctors erred in making prescriptions, setting doses, or telling
patients to stop taking drugs they needed.(Ziaeian et al., 2012) Just the prescribing of
medications with known risks that outweigh benefits for the elderly added an estimated
$7 billion to U.S. healthcare expenditures in 2001.(Fu et al., 2007) Recent research has
evaluated whether readmissions are associated with polypharmacy (patients who take
multiple medications)(Morandi et al., 2013; Sehgal et al., 2013; Sganga et al., 2014);
14
Potentially Inappropriate Medication (PIM, drugs known to be risky to the
elderly)(Sehgal et al., 2013); or medication regimen complexity (drugs with complex
dose forms, instructions and administration)(Schoonover, 2011; Willson et al., 2014).
While research has demonstrated an association between polypharmacy and avoidable
readmissions, at least one study failed to find a relationship.(Mansur, Weiss, &
Beloosesky, 2008) PIM alone has not emerged as a meaningful indicator.(Sehgal et al.,
2013)
Dierich hypothesized that these variables did not consistently predict readmission
on their own, and used factor analysis to construct a measure called high risk medication
regimens (HRMRs) that combined all three.(Dierich, 2010) A structural equation model
using HRMR as a mediating variable was more predictive of readmissions than using
comorbidity or any of the three components on their own as mediating variables. HRMRs
accounted for a unique variance of 10% in patients’ readmission risks as well as 20% of
the comorbidity effect of readmission.(Dierich, 2010)
However, the manual process of deriving HRMR scores for this study was tedious
and limited the utility of this discovery. Automation of this process is necessary for
follow-up research to verify the predictive power of HRMRs, and for the potential
development of a clinical tool that uses prescription data from electronic health records to
assess patients' readmission risks.
1.2. Objective
This study seeks to advance Dierich’s discovery by developing an automated
algorithm for determining HRMR scores – thereby determining which patients are at
15
greater risk for medication-related hospital readmissions and would benefit the most from
medication management services. The specific aims are to: (1) map medication data
automatically to RxNorm coding standards (2) create an automated algorithm that uses
the coded medication data to calculate patient HRMR scores for easy replication and
application across different health care systems and databases, and (3) test the
algorithm’s accuracy by seeing if it derived the same HRMR scores that Dierich
calculated through her manual analysis.
2. Materials and Methods
2.1. Data Set
The data set developed in Dierich's study was utilized for this study. It contains
Outcome and Assessment Information Set (OASIS) and medication data from 911 older
adults from 15 Medicare-certified home health care agencies. Patients were 65 and older
whose first episodes of home care took place after initial hospitalizations in 2004. Home
care clinicians reviewed the medication records and validated their accuracy by observing
the medications in patients’ homes. Only patients with complete OASIS and medication
records were included in the data set. OASIS is a comprehensive assessment tool
completed by home care clinicians to track conditions of patients at admission, various
points during their episodes of care, and discharge.(Dierich, 2010) It is used to calculate
outcome and risk factors of patients in Medicare-certified home care agencies, and
includes demographic, environmental, support system, health and functional status, and
health service utilization information.(Centers for Medicare and Medicaid Services
16
(CMS), 2012a) The medication data includes all prescribed and over-the-counter
medications and contained the medication name, dose, frequency, dose forms,
frequencies and special instructions.
2.2. Coding Standard Definitions
RxNorm: A standardized nomenclature for clinical drugs that is produced by the
National Library of Medicine (NLM).(National Library of Medicine, 2013) RxNorm’s
standardized naming conventions allow health systems, which might catalog drugs in
different ways in their computer systems, to communicate efficiently and
accurately.(Nelson, Zeng, Kilbourne, Powell, & Moore, 2011)
RXCUI: A unique numerical identifier for clinical drugs and their concepts.
Medications with the same RXCUIs are considered the same drugs with the same
ingredients, strengths and dose forms.
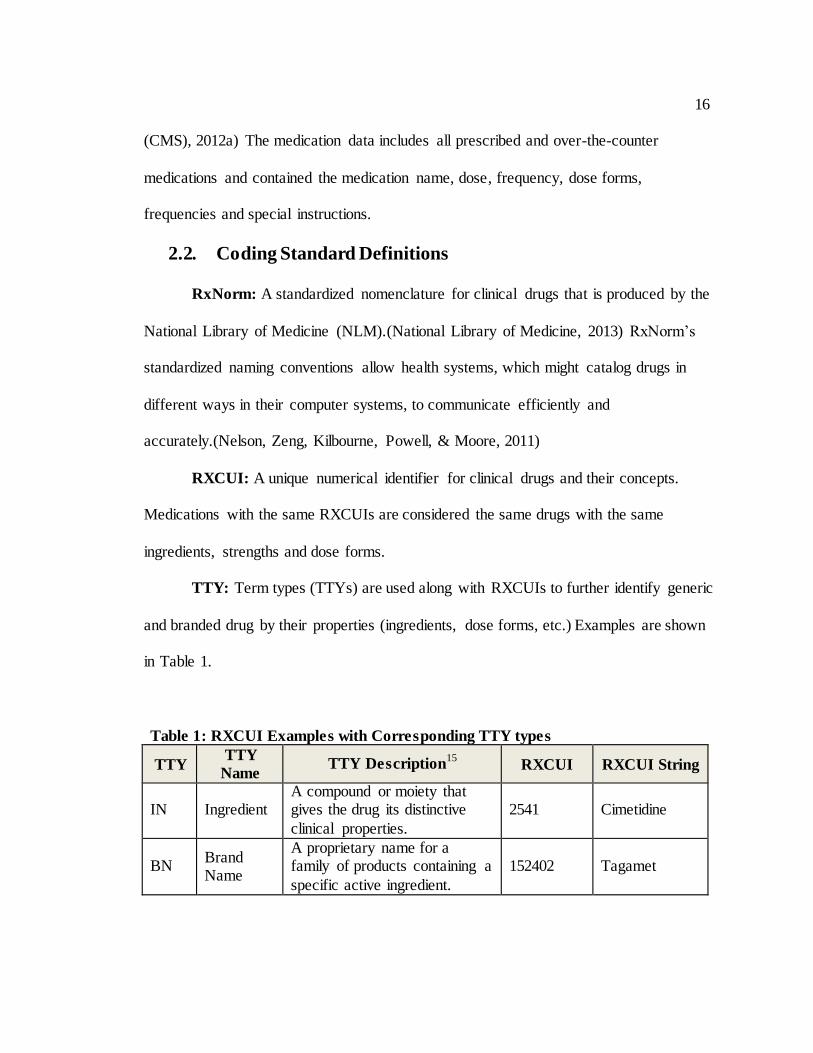
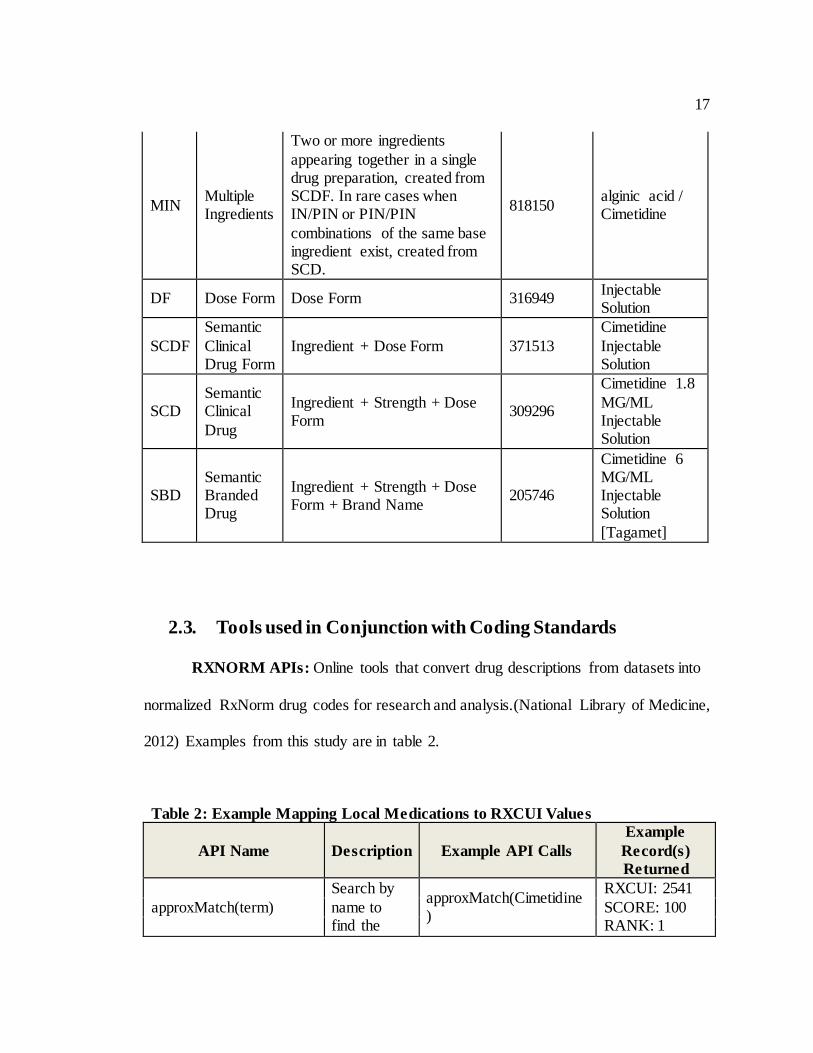
TTY: Term types (TTYs) are used along with RXCUIs to further identify generic
and branded drug by their properties (ingredients, dose forms, etc.) Examples are shown
in Table 1.
Table 1: RXCUI Examples with Corresponding TTY types
TTY TTY
Name TTY Description
15 RXCUI RXCUI String
IN Ingredient A compound or moiety that gives the drug its distinctive
clinical properties.
2541 Cimetidine
BN Brand Name
A proprietary name for a family of products containing a
specific active ingredient.
152402 Tagamet
17
MIN Multiple Ingredients
Two or more ingredients
appearing together in a single drug preparation, created from SCDF. In rare cases when IN/PIN or PIN/PIN
combinations of the same base ingredient exist, created from SCD.
818150 alginic acid / Cimetidine
DF Dose Form Dose Form 316949 Injectable Solution
SCDF
Semantic
Clinical Drug Form
Ingredient + Dose Form 371513
Cimetidine
Injectable Solution
SCD Semantic Clinical
Drug
Ingredient + Strength + Dose Form
309296
Cimetidine 1.8
MG/ML Injectable Solution
SBD Semantic Branded Drug
Ingredient + Strength + Dose Form + Brand Name
205746
Cimetidine 6 MG/ML Injectable Solution
[Tagamet]
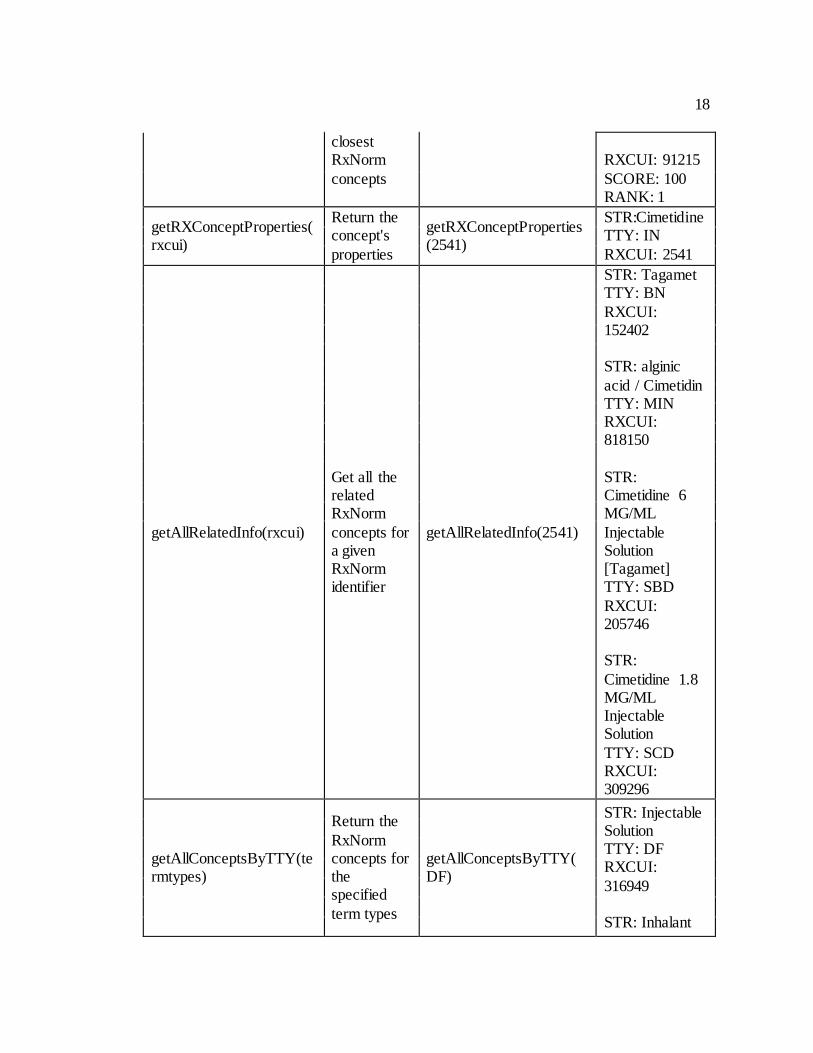
2.3. Tools used in Conjunction with Coding Standards
RXNORM APIs: Online tools that convert drug descriptions from datasets into
normalized RxNorm drug codes for research and analysis.(National Library of Medicine,
2012) Examples from this study are in table 2.
Table 2: Example Mapping Local Medications to RXCUI Values
API Name Description Example API Calls
Example
Record(s)
Returned
approxMatch(term)
Search by
name to find the
approxMatch(Cimetidine)
RXCUI: 2541
SCORE: 100 RANK: 1
18
closest RxNorm
concepts
RXCUI: 91215
SCORE: 100 RANK: 1
getRXConceptProperties(rxcui)
Return the concept's
properties
getRXConceptProperties(2541)
STR:Cimetidine TTY: IN
RXCUI: 2541
getAllRelatedInfo(rxcui)
Get all the related RxNorm
concepts for a given RxNorm identifier
getAllRelatedInfo(2541)
STR: Tagamet TTY: BN
RXCUI: 152402 STR: alginic
acid / Cimetidin TTY: MIN RXCUI: 818150
STR: Cimetidine 6 MG/ML
Injectable Solution [Tagamet] TTY: SBD
RXCUI: 205746 STR:
Cimetidine 1.8 MG/ML Injectable Solution
TTY: SCD RXCUI: 309296
getAllConceptsByTTY(termtypes)
Return the
RxNorm concepts for the specified
term types
getAllConceptsByTTY(DF)
STR: Injectable Solution TTY: DF RXCUI:
316949 STR: Inhalant
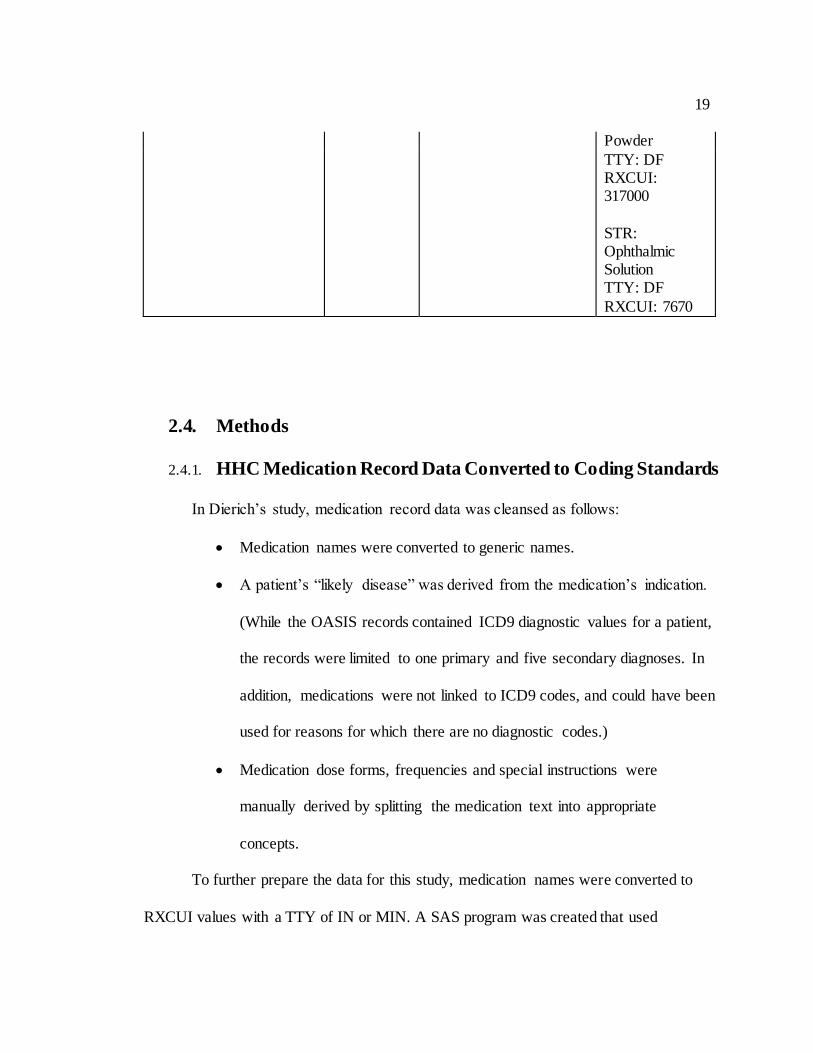
19
Powder
TTY: DF RXCUI: 317000
STR: Ophthalmic Solution TTY: DF
RXCUI: 7670
2.4. Methods
2.4.1. HHC Medication Record Data Converted to Coding Standards
In Dierich’s study, medication record data was cleansed as follows:
Medication names were converted to generic names.
A patient’s “likely disease” was derived from the medication’s indication.
(While the OASIS records contained ICD9 diagnostic values for a patient,
the records were limited to one primary and five secondary diagnoses. In
addition, medications were not linked to ICD9 codes, and could have been
used for reasons for which there are no diagnostic codes.)
Medication dose forms, frequencies and special instructions were
manually derived by splitting the medication text into appropriate
concepts.
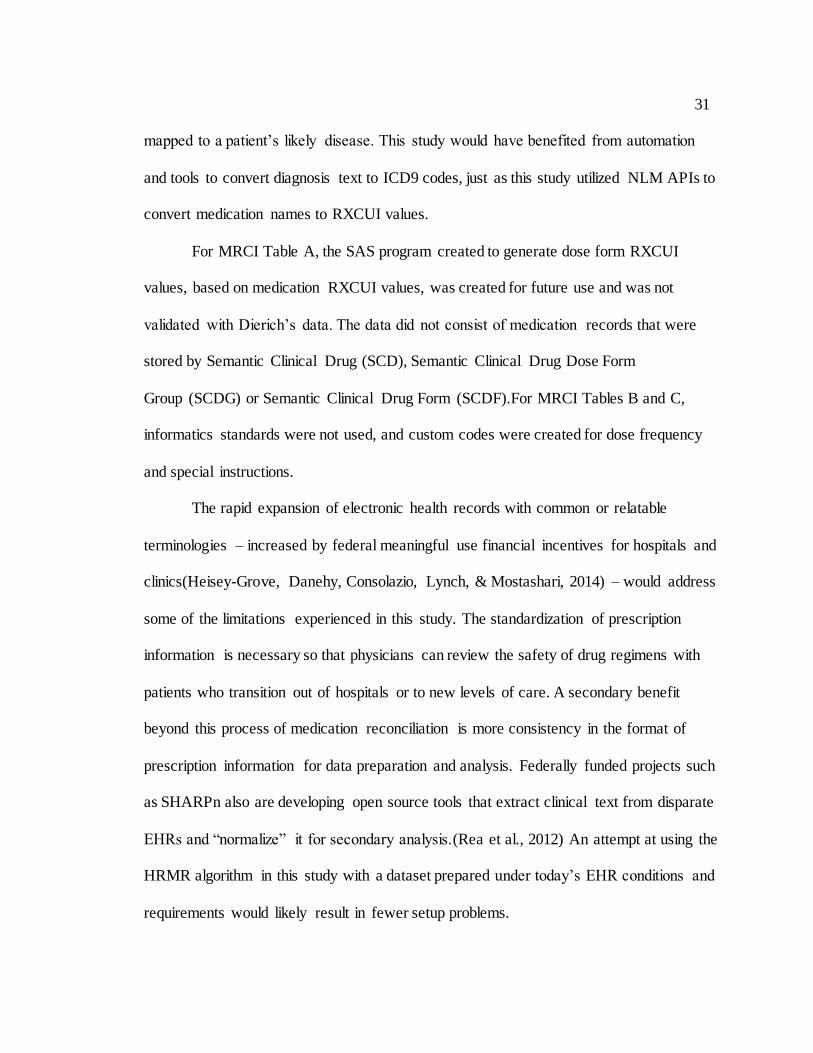
To further prepare the data for this study, medication names were converted to
RXCUI values with a TTY of IN or MIN. A SAS program was created that used
20
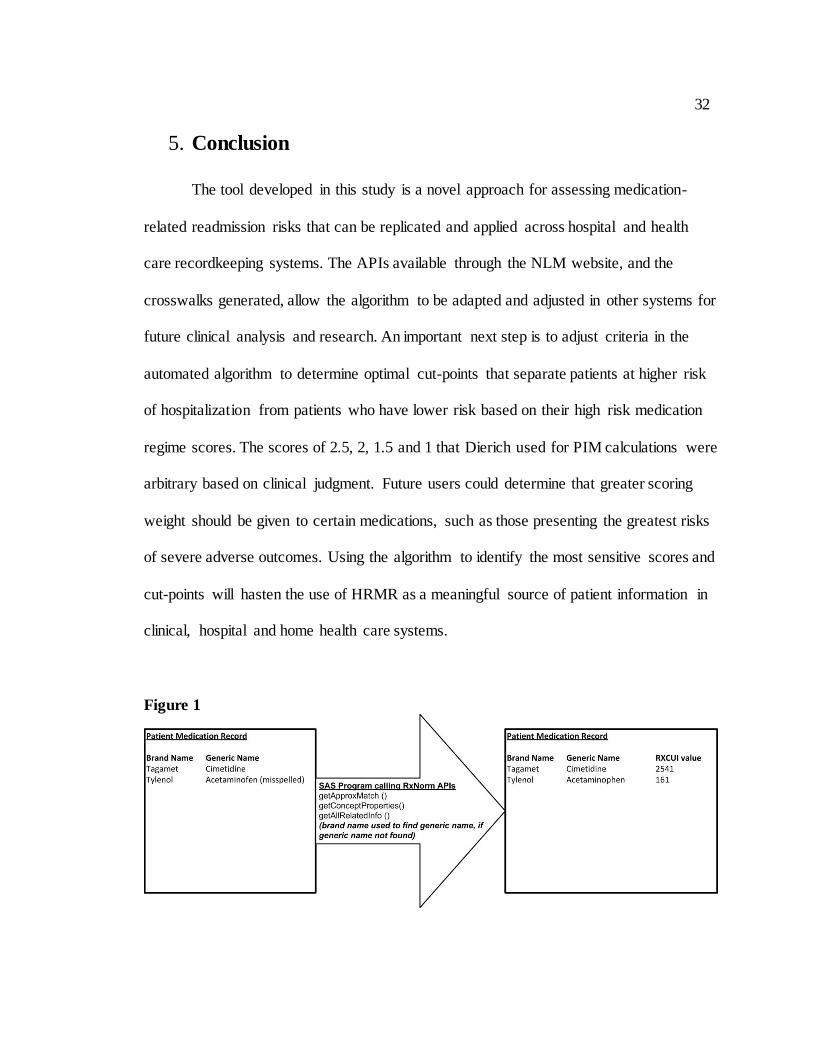
RXNORM APIs for this conversion (Figure 1). Dierich’s medication dose forms were
converted to RXCUI values with a TTY of DF using a RXNORM API. Dose forms that
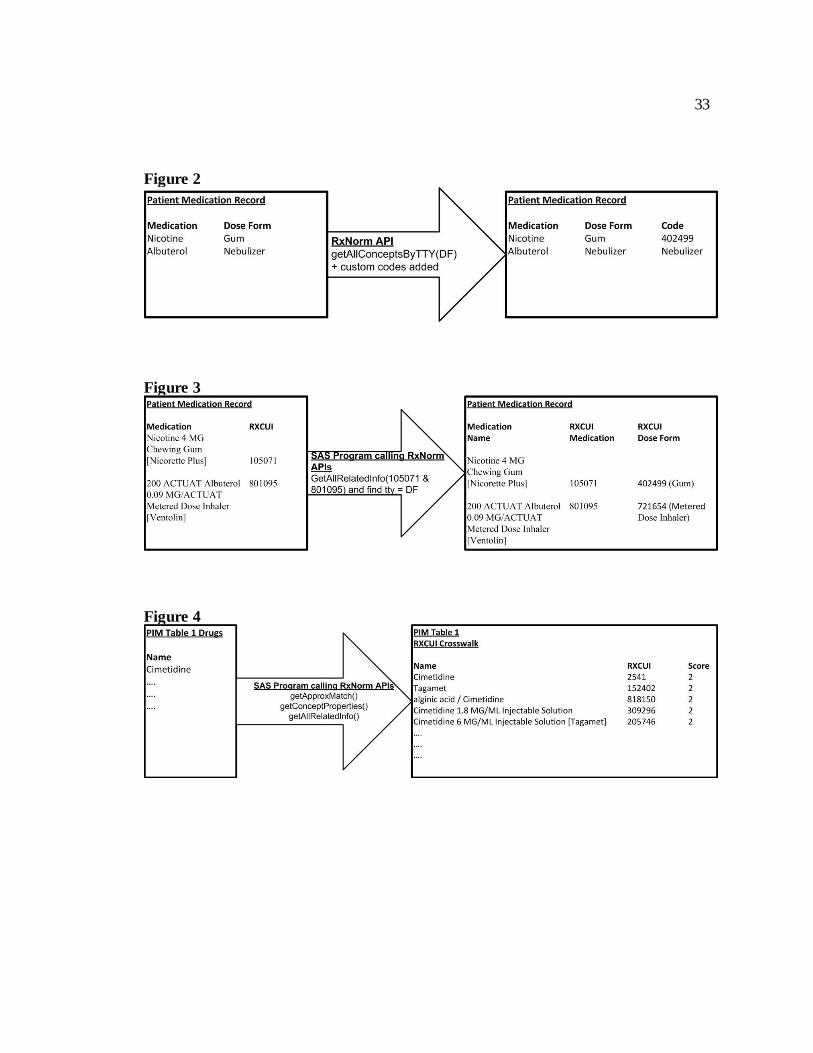
were not found by the API were converted to custom codes (Figure 2). In addition, a
separate SAS program was created for future use to convert Medication RXCUI values
with a TTY of SCD, SCDF, or SBD to Dose Form RXCUI values with a TTY of DF
(Figure 3).
“Likely diseases” were manually converted to ICD9 values for each patient based
on the expertise of the authors – a doctorally prepared informatician (Olson), a geriatric
nurse practitioner (Dierich), and a nurse researcher with expertise in geriatrics and home
health care data (Westra), and validated against the Charlson comorbidity index.(M. E.
Charlson, Pompei, Ales, & MacKenzie, 1987) A separate record was created for each
patient consisting solely of “likely diseases” and corresponding ICD9 values.
Lastly, medication frequencies and special directions were converted to custom
codes from Dierich’s manually derived values from her previous study. No standard was
found for these values in the literature.
2.4.2. Polypharmacy Automated Algorithm
Dierich defined polypharmacy as a continuous count of all regularly taken
medications (prescribed or over the counter) via any route listed in the first episode of
care.(Dierich, 2010) Polypharmacy was also used as a categorical variable for descriptive
analysis; patients with less than 9 medications were assigned a “0” and patients with 9 or
more medications were assigned a “1”. PRN medications (those used as needed), over-
the-counter medications and medications with limited dosing time such as antibiotics
21
were included in the count. The count excluded certain items documented in the patients’
medication records such as oxygen or saline used to dilute IV medications. Combination
and variable dosed drugs were counted as one drug, rather than counting each active
ingredient as a separate drug.
An automated algorithm was created to count medication records containing RXCUI
values, and also count each medication record whether or not an RXCUI value was
assigned using the same logic and cleansed data as Dierich used in her study.
2.4.3. Potentially Inappropriate Medications Automated Algorithm
The 2003 version of the Beers’ criteria, a list of 48 drugs and 20 drug classes that
the elderly should avoid, was used in Dierich’s study to create PIM scores.(Fick et al.,
2003) There is a newer version of the Beers criteria, but it was not available at the time of
Dierich’s study, hence the same version was used in this study for comparison of the
manual process and algorithm. In the Beers’ criteria, Fick et al. identified two categories
of inappropriate drugs: PIM Table 1 includes those inappropriate for older adults no
matter their diagnosis and PIM Table 2 includes medications that could be inappropriate
depending on the diagnosis. The criteria also differentiated drugs by whether or not they
posed risks of severe adverse outcomes (Appendix A).
Fick et al did not assign scores to medications; hence, based on clinical judgment,
Dierich operationalized the PIM criteria by assigning a score of 2.5 to each medication
that was considered always inappropriate, and a score of 2 for each medication with a
lower severity ranking. For medications with risks related to specific diseases, the
assigned scores were 1.5 for medications with the highest risks and 1.0 for medications
22
with lower risks. A drug may have more than one score, and the highest score was kept
for each drug. The medication scores were then summed to provide a total risk level score
for each patient.
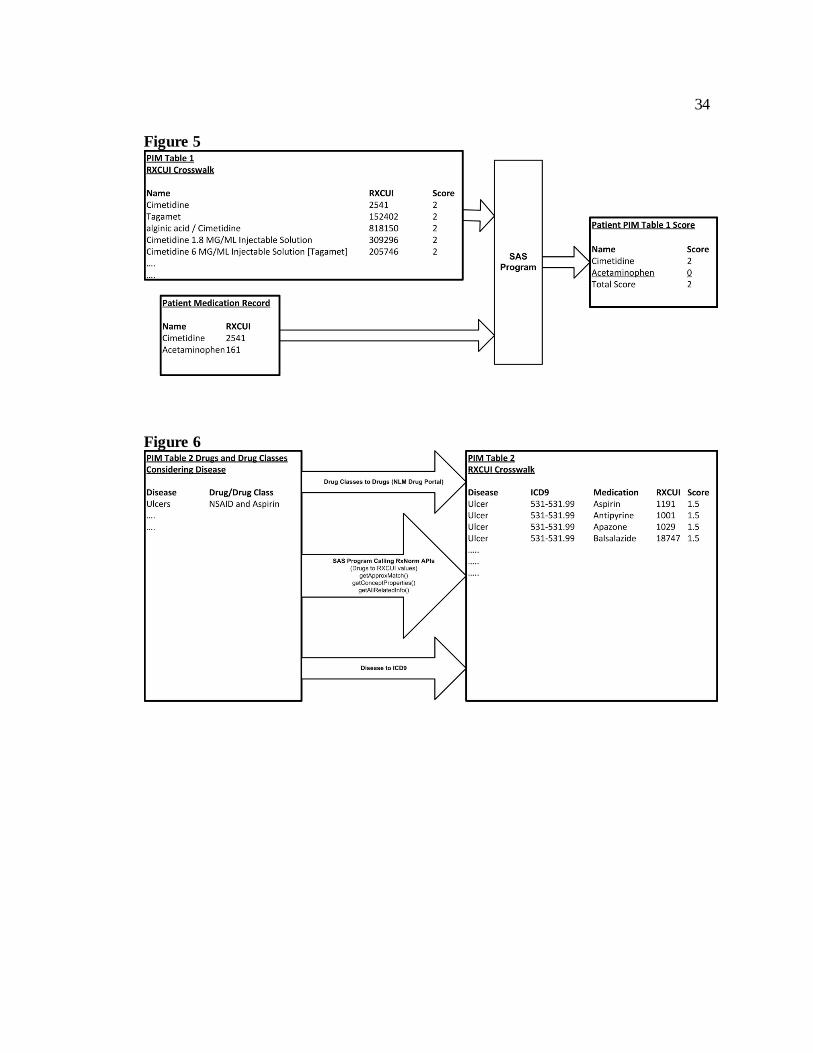
2.4.3.1. PIM Table 1 Automated Algorithm
A SAS program was created to generate a crosswalk that maps drug names from
PIM Table 1 to RXCUI values with TTY types of IN, MIN, BN, SCD, SCDF and SBD.
The program used RXNORM APIs to generate the RXCUI values. It also assigned
Dierich’s score to each medication record (Figure 4). Another SAS program matched
RXCUI crosswalk information and patient medication records to produce PIM Table 1
scores (Figure 5).
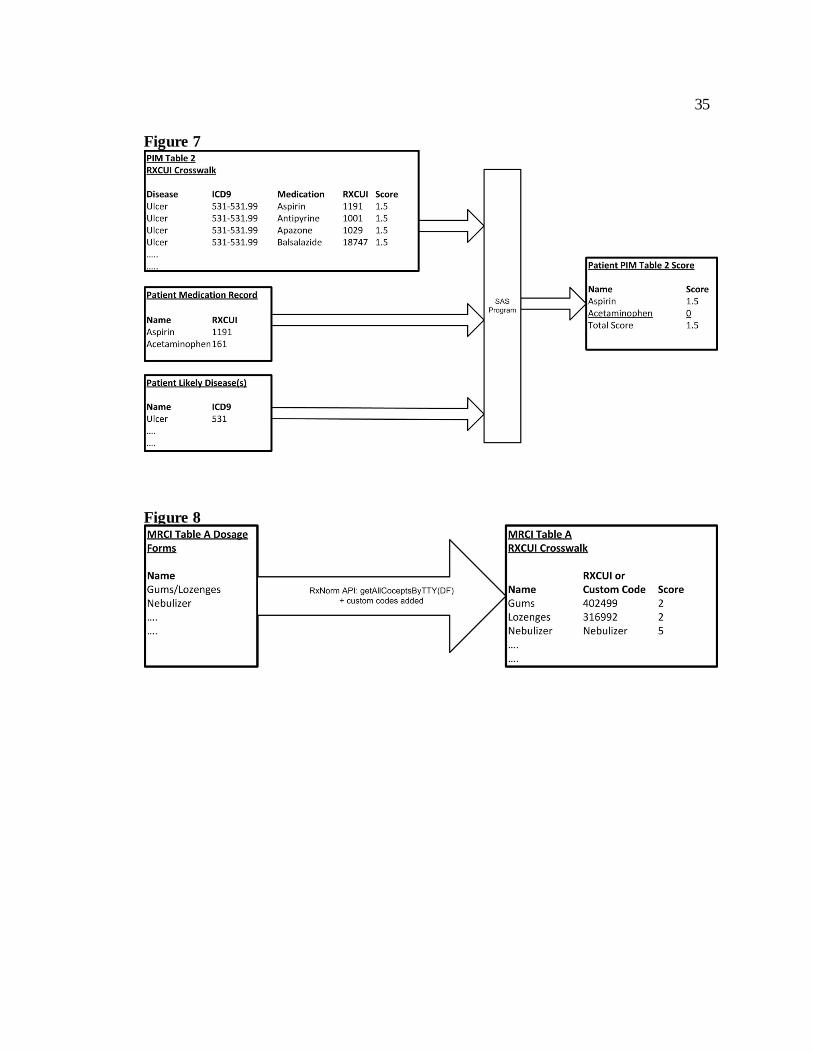
2.4.3.2. PIM Table 2 Automated Algorithm
A SAS program was created to generate a crosswalk that maps medication names
to RXCUI values, and medication classes to medication names to RXCUI values. The
NLM Drug portal was used to map medication classes to medication names. A standard
was not used for the drug class, and the medication class from PIM Table 2 was manually
typed into the web portal which then displayed all medications for that drug class. A SAS
program then converted the medication names to RXCUI values using RXNORM APIs.
Clinical judgment was used to manually map diagnoses to ICD9 values. The ICD9 values
were then assigned to each entry of the crosswalk along with Dierich’s score (Figure 6).
Another SAS program combined medication records, patients’ likely diseases, and PIM
Table 2 crosswalk data to produce patients’ PIM Table 2 scores (Figure 7).
23
2.4.4. Medication Regimen Complexity Automated Algorithm
Dierich used a modified version of the Medication Regimen Complexity Index
(MRCI) developed by George et al, because at the time it was “the only validated and
reliable non-disease specific measure addressing medication complexity in the published
literature.”(George et al., 2004) The index utilizes weighted scores in three subscales – by
the complexity of their route (MRCI Table A), their dosing frequency (MRCI Table B),
and their directions or preparation (MRCI Table C) – and then combines the subscale
scores into a summary score (Appendix B). George et al. did not provide a cut point for
highly complex regimens. Dierich used a continuous score in her structural equation
modeling, and a cut point of 20 or above in her categorical data analysis as an indication
of high medication regimen complexity.
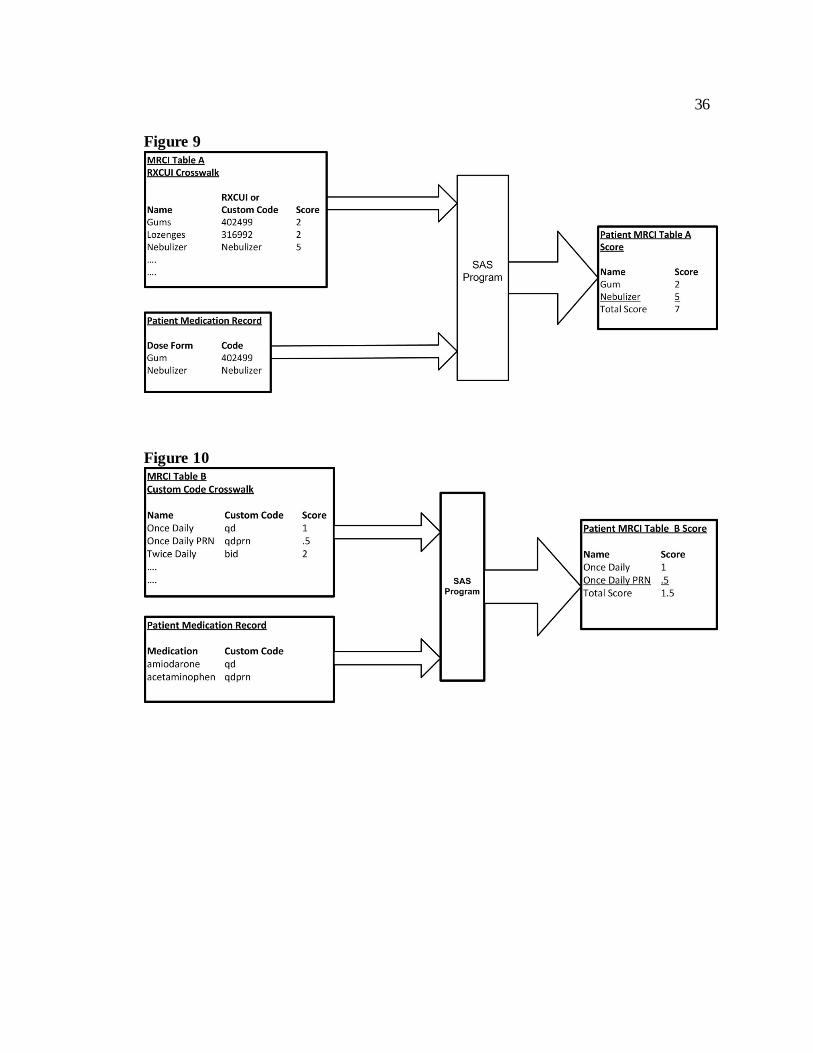
2.4.4.1. MRCI Table “A” Automated Algorithm
A SAS program was created to generate a crosswalk that maps the dose forms
from MRCI Table A to RXCUI values with a TTY type of DF using a RXNORM API.
Dose forms that were not found with the API were converted to custom codes (Figure 8).
Similar to its use in PIM scoring, a SAS program generated patients’ MRCI Table A
scores through the input of medication records and MRCI Table A crosswalk data (Figure
9).
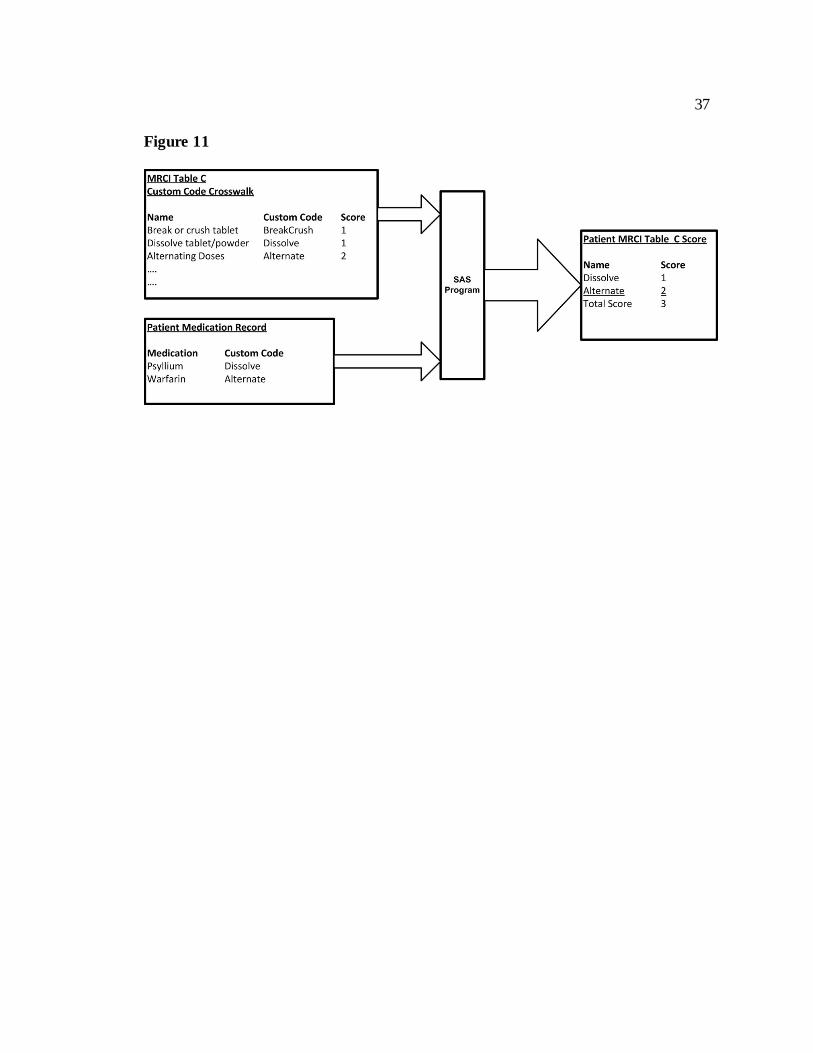
2.4.4.2. MRCI Table “B” and “C” Automated Algorithm
24
SAS programs were created to generate a crosswalk that maps custom codes for
dosing frequency and special directions to MRCI Table B and C. Two other SAS
programs were created to then generate patients’ MRCI Table B and C scores. The
programs entered the medication records, and then MRCI Table B and Table C
crosswalks, and produced the patients’ MRCI Table B (Figure 10) and C scores (Figure
11).
3. Results
Results in this study include the percent of medications from Dierich’s study that
were automatically mapped to RXCUI values for both dose forms and medication names,
as well as the polypharmacy, PIM and MRCI patient scores that were produced through
this conversion of drug names.
3.1. Mapping Results
Overall, 99% of drugs in the medication data set were converted to RXCUI
values. Initially, without any manipulation of Dierich’s data, 82% of the drug names were
converted to RXCUI values. The 82% consisted of exact generic drug names that were
recognized by the API. After adjusting the data to redefine combination drugs with
multiple ingredients into the naming formats that the NLM API expected, the match rate
increased to 90%. (Dierich used “And” instead of “/” in the names for multi-ingredient
drugs. So “aspirin and dipyridamole” was reformatted to “aspirin / dipyridamole”.)
Another 9% of the drug records were then converted, either by using the brand names in
Dierich’s data to find the active ingredient(s) RXCUI types of “IN” or “MIN,” or by
25
correcting misspellings in generic drug names. In the end, 1% of drug records could not
be converted; they lacked specific generic or brand names. Rather, the medication terms
represented broad medication categories such as “Laxative” or “Sports Cream”.
Lastly, 80% of the dose forms in Dierich’s study were converted to RXCUI
values. Custom codes were created for irrigant, g-tube, intravesicle, dressing, nebulizer
and peg tube values. After adding custom codes, 100% mapping of dose forms was
achieved.
3.2. Polypharmacy Results
Polypharmacy was calculated two ways: by counting medication records
containing RXCUI values, and by counting each medication record whether or not an
RXCUI value was assigned. The count of all medication records for patients produced a
100% match to Dierich’s data. The count of records with RXCUI values per patient
produced a 99% match to Dierich’s data.
3.3. PIM Table Results
The match between the automation of patients’ PIM scores and Dierich’s manual
PIM counts was 87%. PIM Table 1 consists of potentially inappropriate medications
independent of patients’ diagnoses. PIM Table 2 consists of potentially inappropriate
medications that were linked to diagnoses. Medications could have more than one score
between PIM Table 1 and PIM Table 2; the highest score was assigned to the medication.
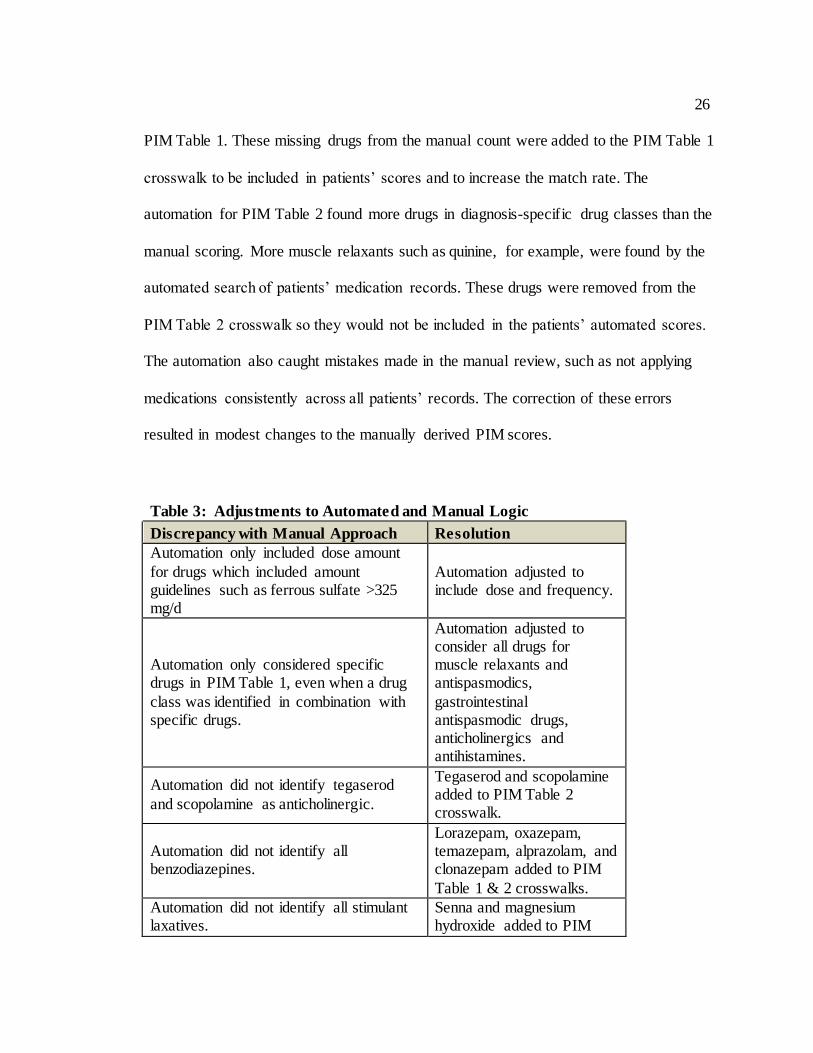
In order to reach 87%, the manual calculations and logic in the automated design
were adjusted (Table 3). The manual count, for example, included all long acting
NSAIDs, such as diclofenac, whereas the automated count only included specific drugs in
26
PIM Table 1. These missing drugs from the manual count were added to the PIM Table 1
crosswalk to be included in patients’ scores and to increase the match rate. The
automation for PIM Table 2 found more drugs in diagnosis-specific drug classes than the
manual scoring. More muscle relaxants such as quinine, for example, were found by the
automated search of patients’ medication records. These drugs were removed from the
PIM Table 2 crosswalk so they would not be included in the patients’ automated scores.
The automation also caught mistakes made in the manual review, such as not applying
medications consistently across all patients’ records. The correction of these errors
resulted in modest changes to the manually derived PIM scores.
Table 3: Adjustments to Automated and Manual Logic
Discrepancy with Manual Approach Resolution
Automation only included dose amount
for drugs which included amount guidelines such as ferrous sulfate >325 mg/d
Automation adjusted to include dose and frequency.
Automation only considered specific drugs in PIM Table 1, even when a drug
class was identified in combination with specific drugs.
Automation adjusted to consider all drugs for muscle relaxants and antispasmodics,
gastrointestinal antispasmodic drugs, anticholinergics and antihistamines.
Automation did not identify tegaserod
and scopolamine as anticholinergic.
Tegaserod and scopolamine added to PIM Table 2 crosswalk.
Automation did not identify all benzodiazepines.
Lorazepam, oxazepam, temazepam, alprazolam, and clonazepam added to PIM
Table 1 & 2 crosswalks.
Automation did not identify all stimulant laxatives.
Senna and magnesium hydroxide added to PIM
27
Table 1 crosswalk.
Automation did not exclude coxibs from
NSAID drug Class.
Rofecoxib and celecoxib removed from PIM Table 2 crosswalk.
Automated approach included quinine as a muscle relaxant.
Quinine removed from PIM Table 2 crosswalk.
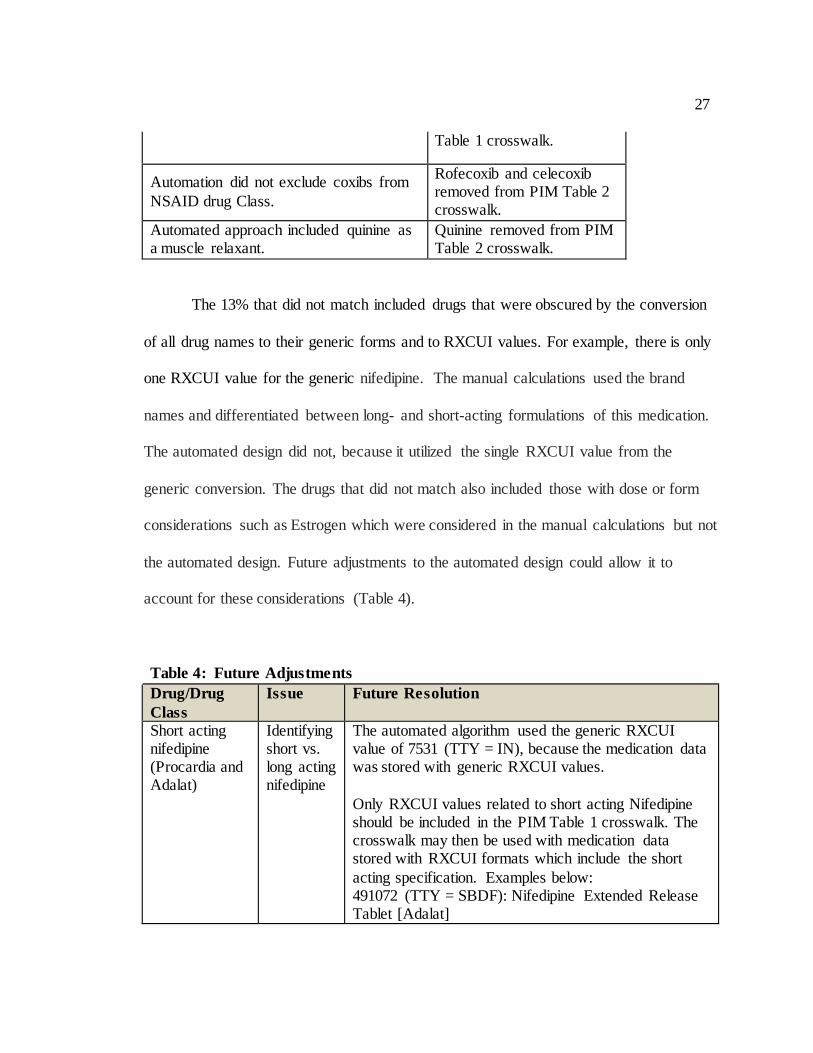
The 13% that did not match included drugs that were obscured by the conversion
of all drug names to their generic forms and to RXCUI values. For example, there is only
one RXCUI value for the generic nifedipine. The manual calculations used the brand
names and differentiated between long- and short-acting formulations of this medication.
The automated design did not, because it utilized the single RXCUI value from the
generic conversion. The drugs that did not match also included those with dose or form
considerations such as Estrogen which were considered in the manual calculations but not
the automated design. Future adjustments to the automated design could allow it to
account for these considerations (Table 4).
Table 4: Future Adjustments
Drug/Drug
Class
Issue Future Resolution
Short acting nifedipine (Procardia and Adalat)
Identifying short vs. long acting nifedipine
The automated algorithm used the generic RXCUI value of 7531 (TTY = IN), because the medication data was stored with generic RXCUI values.
Only RXCUI values related to short acting Nifedipine should be included in the PIM Table 1 crosswalk. The crosswalk may then be used with medication data stored with RXCUI formats which include the short
acting specification. Examples below: 491072 (TTY = SBDF): Nifedipine Extended Release Tablet [Adalat]
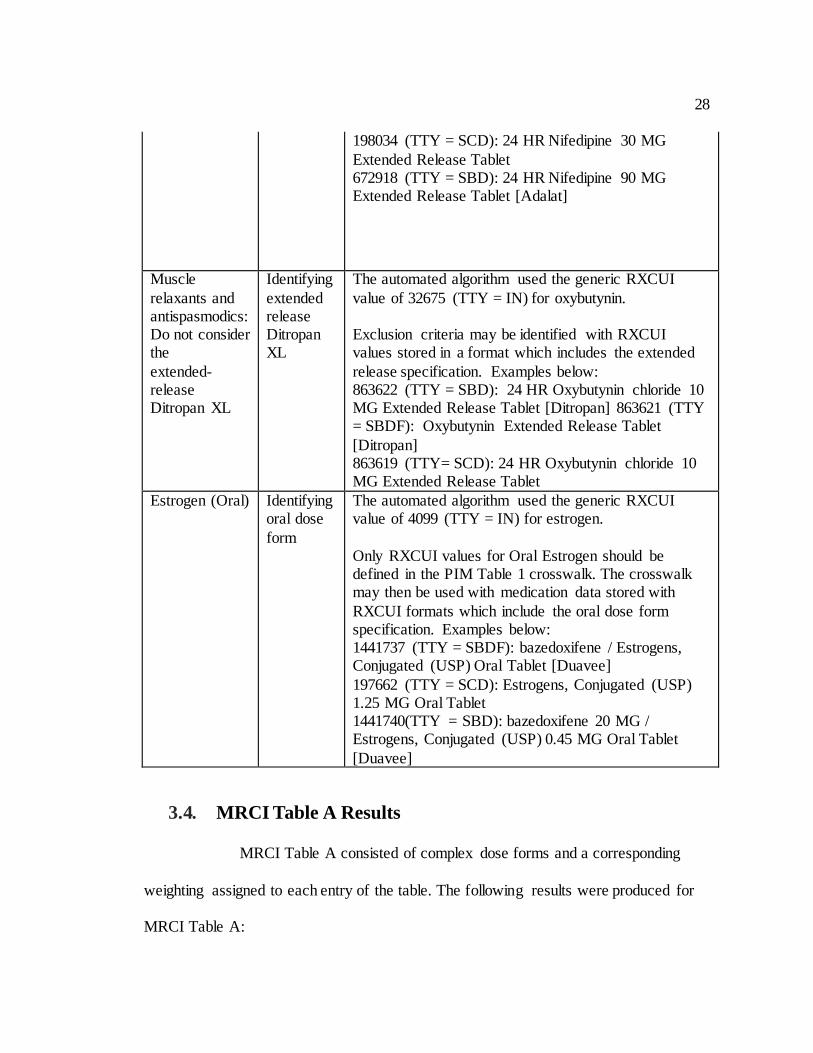
28
198034 (TTY = SCD): 24 HR Nifedipine 30 MG
Extended Release Tablet 672918 (TTY = SBD): 24 HR Nifedipine 90 MG Extended Release Tablet [Adalat]
Muscle
relaxants and antispasmodics: Do not consider the
extended-release Ditropan XL
Identifying
extended release Ditropan XL
The automated algorithm used the generic RXCUI
value of 32675 (TTY = IN) for oxybutynin. Exclusion criteria may be identified with RXCUI values stored in a format which includes the extended
release specification. Examples below: 863622 (TTY = SBD): 24 HR Oxybutynin chloride 10 MG Extended Release Tablet [Ditropan] 863621 (TTY = SBDF): Oxybutynin Extended Release Tablet
[Ditropan] 863619 (TTY= SCD): 24 HR Oxybutynin chloride 10 MG Extended Release Tablet
Estrogen (Oral) Identifying oral dose
form
The automated algorithm used the generic RXCUI value of 4099 (TTY = IN) for estrogen.
Only RXCUI values for Oral Estrogen should be defined in the PIM Table 1 crosswalk. The crosswalk may then be used with medication data stored with
RXCUI formats which include the oral dose form specification. Examples below: 1441737 (TTY = SBDF): bazedoxifene / Estrogens, Conjugated (USP) Oral Tablet [Duavee]
197662 (TTY = SCD): Estrogens, Conjugated (USP) 1.25 MG Oral Tablet 1441740(TTY = SBD): bazedoxifene 20 MG / Estrogens, Conjugated (USP) 0.45 MG Oral Tablet
[Duavee]
3.4. MRCI Table A Results
MRCI Table A consisted of complex dose forms and a corresponding
weighting assigned to each entry of the table. The following results were produced for
MRCI Table A:
29
When the automation ran against a crosswalk that converted MRCI
Table A dose forms to RXCUI dose form values, the match was 80% to Dierich’s
manual calculations.
When the automation ran against a crosswalk that converted MRCI
Table A dose forms to RXCUI dose form values, and included custom values for
irrigant, g-tube, intravesicle, dressing, nebulizer and peg tube, the match was 99%
to Dierich’s manual calculations.
3.5. MRCI Table B & MRCI Table C Results
MRCI Table B consisted of complex dose frequencies and a corresponding
weighting assigned to each entry of the table. MRCI Table C consisted of complex
special instructions and a corresponding weighting assigned to each entry of the table.
The automation of patients’ MRCI Table B and MRCI Table C scores produced a 99%
match.
4. Discussion
Automated analysis of clinical data is rapidly emerging as a way for health care
providers to predict patient needs and risks for a variety of disorders and adverse
events.(Deleger et al., 2013; Overby et al., 2013) McDonald et al in 2012 created a
successful approach to determining MCRI scores of patients in post-acute home care
settings through an algorithm using medication data from their electronic health
records.(McDonald et al., 2013) Medication data presents unique challenges in this
30
pursuit, though, because of the heterogeneous nature of prescription recordkeeping by
different health care providers and the lack of standards for drug data coding and
entry.(Richesson, 2014) RxNorm is viewed as an “ideal standard” for standardizing
prescription data,(Richesson, Smith, Malloy, & Krischer, 2010) and making it available
across health care systems for secondary analysis.(Rea et al., 2012) This study provides
further validation of the utility of RxNorm and of automated algorithms for secondary
analysis, and takes an important next step in applying this approach to the scoring of
HRMRs, which Dierich showed have unique potential to assess medication-related risks
for hospital readmissions. Automating HRMR calculations was a step that Dierich found
necessary for further study in this area in order to “greatly improve the quality of
research, the accuracy of findings, and the speed of release of findings.”(Dierich, 2010)
4.1. Limitations
The absence of coding standards from the data used in the original Dierich study
created several limitations in terms of the ability to truly automate the process of
assembling HRMR scores and analyzing patient readmission risks. If a medication record
had a misspelling for a dose or medication name, an RXCUI value was not automatically
found for that record, and manual editing was needed to clean up the database.
For PIM Table 2, the NLM drug portal was used to find all the medication names
associated with a medication class. This was not a truly automated process, and drug
class coding standards were not used. Medication classes were typed into the portal to
find associated medication names, and a SAS program was created to map the medication
names to RXCUI values using RxNorm APIs. In addition, ICD9 values were manually
31
mapped to a patient’s likely disease. This study would have benefited from automation
and tools to convert diagnosis text to ICD9 codes, just as this study utilized NLM APIs to
convert medication names to RXCUI values.
For MRCI Table A, the SAS program created to generate dose form RXCUI
values, based on medication RXCUI values, was created for future use and was not
validated with Dierich’s data. The data did not consist of medication records that were
stored by Semantic Clinical Drug (SCD), Semantic Clinical Drug Dose Form
Group (SCDG) or Semantic Clinical Drug Form (SCDF).For MRCI Tables B and C,
informatics standards were not used, and custom codes were created for dose frequency
and special instructions.
The rapid expansion of electronic health records with common or relatable
terminologies – increased by federal meaningful use financial incentives for hospitals and
clinics(Heisey-Grove, Danehy, Consolazio, Lynch, & Mostashari, 2014) – would address
some of the limitations experienced in this study. The standardization of prescription
information is necessary so that physicians can review the safety of drug regimens with
patients who transition out of hospitals or to new levels of care. A secondary benefit
beyond this process of medication reconciliation is more consistency in the format of
prescription information for data preparation and analysis. Federally funded projects such
as SHARPn also are developing open source tools that extract clinical text from disparate
EHRs and “normalize” it for secondary analysis.(Rea et al., 2012) An attempt at using the
HRMR algorithm in this study with a dataset prepared under today’s EHR conditions and
requirements would likely result in fewer setup problems.
32
5. Conclusion
The tool developed in this study is a novel approach for assessing medication-
related readmission risks that can be replicated and applied across hospital and health
care recordkeeping systems. The APIs available through the NLM website, and the
crosswalks generated, allow the algorithm to be adapted and adjusted in other systems for
future clinical analysis and research. An important next step is to adjust criteria in the
automated algorithm to determine optimal cut-points that separate patients at higher risk
of hospitalization from patients who have lower risk based on their high risk medication
regime scores. The scores of 2.5, 2, 1.5 and 1 that Dierich used for PIM calculations were
arbitrary based on clinical judgment. Future users could determine that greater scoring
weight should be given to certain medications, such as those presenting the greatest risks
of severe adverse outcomes. Using the algorithm to identify the most sensitive scores and
cut-points will hasten the use of HRMR as a meaningful source of patient information in
clinical, hospital and home health care systems.
Figure 1
33
Figure 2
Figure 3
Figure 4
34
Figure 5
Figure 6
35
Figure 7
Figure 8
36
Figure 9
Figure 10
37
Figure 11
38
Paper 2:
Optimization of Decision Support Tool
using Medication Regimens to Assess
Rehospitalization Risks
39
Optimization of Decision Support Tool using Medication Regimens to Assess
Rehospitalization Risks
Primary Investigator
Catherine H Olson PhD Candidate, Biomedical Health Informatics
University of Minnesota 330 Diehl Hall
505 Essex Street SE Minneapolis, MN 55455
612-626-3348 [email protected]
Other Investigators Mary Dierich, PhD, RN, C-GNP
Clinical Associate Professor, School of Nursing
University of Minnesota Minneapolis, Minnesota
Terrence Adam, Ph.D., M.D. Associate Professor
Pharmaceutical Care & Health Systems University of Minnesota
Minneapolis, MN [email protected]
Bonnie L Westra, PhD, RN, FAAN, FACMI
Associate Professor, School of Nursing University of Minnesota Minneapolis, Minnesota
40
Background: Unnecessary hospital readmissions are costly for the U.S. health
care system. An automated algorithm was developed to target this problem and proven to
predict elderly patients at greater risk of rehospitalization based on their medication
regimens.
Objective: Improve the algorithm for predicting elderly patients’ risks for
readmission by optimizing the sensitivity of its medication criteria.
Methods: Outcome and Assessment Information Set (OASIS) and medication
data were reused from a study that defined and tested an algorithm for assessing
rehospitalization risks of 911 patients from 15 Medicare-certified home health care
agencies. Odds Ratio analyses, literature reviews and clinical judgments were used to
adjust the scoring of patients’ High Risk Medication Regimens (HRMRs). Receiver
Operating Characteristic (ROC) analysis evaluated whether these adjustments improved
the predictive strength of the algorithm’s components.
Results: HRMR scores are composed of polypharmacy (number of drugs),
potentially inappropriate medications (PIM) (drugs risky to the elderly), and Medication
Regimen Complexity Index (MRCI) (complex dose forms, dose frequency, instructions
or administration). Strongest ROC results for the HRMR components were Areas Under
the Curve (AUC) of .68 for polypharmacy when excluding supplements; and .60 for PIM
and .69 for MRCI using the original HRMR criteria. The “cut point” identifying MRCI
scores as indicative of medication-related readmission risk was increased from 20 to 33.
41
Conclusion: The automated algorithm can predict elderly patients at risk of
hospital readmissions and its underlying criteria is improved by a modification to its
polypharmacy definition and MRCI cut point.
Keywords: Patient readmission, Polypharmacy, Medication Adherence, Home
Care Agencies, ROC Curve.
1. Introduction
Medications can both enhance health and cause adverse events, particularly for
older adults, whose prescription regimens increase with age and chronic health
problems.(Hung, Ross, Boockvar, & Siu, 2011) Nine in ten older adults take at least one
prescription medication and most take more than five.(Qato et al., 2008) The combination
of health conditions and chemical ingredients in medications can increase older adults’
risk of adverse events and need for emergency medical care.(Centers for Disease Control
and Prevention (CDC), 2012) Avoidable readmissions to hospitals have been linked to
problems with medication usage,(Freund et al., 2013; Kripalani, Theobald, Anctil, &
Vasilevskis, 2013) but efforts to identify and predict which patients suffer this adverse
event have been mixed. Studies have explored a connection between readmissions and
the numbers of drugs patients take (polypharmacy)(Morandi et al., 2013; Sganga et al.,
2014), their use of potentially inappropriate medications (PIM)(Price et al., 2014a; Price,
Holman, Sanfilippo, & Emery, 2014b; Sehgal et al., 2013), and the complexities of the
doses or forms of their medications (Medication Complexity Index (MRCI))(Willson et
42
al., 2014; Wimmer et al., 2014). Mary Dierich theorized that limitations of these
individual medication measurements might be addressed by constructing them into a
combined measurement, the High Risk Medication Regimen (HRMR). In an initial study
of 911 elderly home health care patients, HRMRs accounted for 10 percent of the
variance in hospital readmissions, making them more predictive than comorbidity.
(Dierich, 2010)
The potential utility of HRMR as a clinical decision support tool to prevent
avoidable readmissions – which can now result in federal Medicare penalties if hospitals
report too many of them(Abelson, 2013) – was tempered by the labor-intensive process in
the original study for calculating the scores. Further research subsequently developed an
automated tool that maps medication data to RxNorm coding standards and created an
algorithm with the coded medication data to calculate patients’ HRMR scores.(Olson et
al., 2014) The standardized format of the coded data addressed some of the practical
challenges of using HRMR for clinical decision support, and also made the algorithm
potentially useable across different electronic health record (EHR) systems and health
care organizations. Automating the calculation also allowed for more rapid testing of the
criteria underlying this new combined measurement and the “cut points,” which were
manually selected based on the researchers’ clinical expertise and literature review, that
distinguish patients at high and low risk of rehospitalization. This study sought to take
advantage of that advancement by testing adjustments to the HRMR criteria and to the
cut points to determine the optimal calculation for predicting medication-related
rehospitalizations of elderly home health care patients.
43
1.1 Objectives
The objective of this study was to improve the automated algorithm for predicting
hospital readmissions by optimizing the underlying criteria within the algorithm and
determining the optimal cut points for HRMR scores. Optimizing the algorithm’s criteria
is a key next step in advancing the HRMR concept toward clinical utility.
2. Methods
2.1. Data Set
This study used Outcome and Assessment Information Set (OASIS) and
medication records for 911 adults from 15 Medicare-certified home health care agencies
that were used in previous studies.(Dierich, 2010; Olson et al., 2014) The medication
records included both prescription and over-the-counter medications taken by patients in
their homes and recorded by home care clinicians in their EHRs. Medication data
included the medication names, doses, dose forms, frequencies and special instructions.
OASIS data for the patients, all of whom were at least 65 and were admitted from the
hospital to the home health care agencies in 2004, included demographic, environmental,
support system, health and functional status, and health service utilization
information.(Centers for Medicare and Medicaid Services (CMS), 2012a)
2.2. Data Analysis
Dierich operationalized the medication data by first calculating polypharmacy,
PIM and MRCI scores based on patients’ drug regimens, and then using summative
44
factor analysis to construct those weighted scores into a combined HRMR
measurement.(Dierich, 2010) The original HRMR research defined polypharmacy as nine
or more medications. Scores of “0” were assigned for patients with fewer than 9
medications, and “1” for patients with 9 or more medications.
Scores for PIM were based on the 2003 version of the Beers’ criteria, a list of 48
drugs and 20 drug classes that the elderly should avoid. In defining the Beers’ criteria,
Fick et al. (Fick et al., 2003) differentiated drugs by whether or not they posed risks of
severe adverse outcomes, and whether they were inappropriate for older adults regardless
of diagnosis (PIM schedule 1) or inappropriate depending on the diagnosis (PIM schedule
2). The initial HRMR research assigned weighted scores of 2.5 to medications that were
always inappropriate and carried the greatest risks, 2 for medications with lower risks of
severe outcomes, 1.5 for medications with the highest risks for certain diagnoses, and 1.0
for medications with lower risks for certain diagnoses. (Drugs that met multiple criteria
received the higher score.) The medication scores were then summed to provide a total
PIM risk level score for each patient.
The original HRMR research used a modified version of the Medication Regimen
Complexity Index developed by George et al. (George et al., 2004) that weighted drugs
by three subscales – by the complexity of their route (MRCI Schedule A), their dosing
frequency (MRCI Schedule B), and the complexity of their directions or preparation
(MRCI Schedule C) – and then combined the subscale scores into a summary score
(Figure IV). A summary score cut point of 20 or above was set in the original HRMR
45
research as an indication of high medication regimen complexity, though it was an
“arbitrary” distinction due to the lack of prior research.(Dierich, 2010)
This method of assigning weighted scores to predictive variables is similar to
what was used in the development of the Charlson index of comorbidity for predicting
mortality risks,(M. Charlson, Szatrowski, Peterson, & Gold, 1994) and another recent
analysis that identified factors for predicting early and preventable rehospitalizations after
kidney transplants.(Harhay et al., 2013)
2.2.1. ROC Analysis. Receiver Operating Characteristic (ROC) curves were used
in this study to evaluate optimization of the algorithm and determine optimal cut points
for the HRMR components (Polypharmacy, PIM, and MRCI) associated with
rehospitalization. The ability to identify cut points is considered an advantage of ROC
analysis.(Hajian-Tilaki, 2013) The area under the ROC curves (AUC) can be interpreted
in this study as the probability of correctly predicting rehospitalization, based on
sensitivity and specificity. The closer the AUC is to 1, the better the measure. An AUC
resultabove .7 is considered meaningful by one generic value scale(Tape, ), but studies
have characterized results between .6 and .7 as “moderate” or “good.”(Akyuz, Alpsoy,
Akkoyun, Degirmenci, & Guler, 2014; Cheung, 2014; Heng et al., 2014; Hiersch et al.,
2014; Malik, Banning, & Gershlick, 2014) ROC curves are frequently used to assess the
value of predictive measures, and have been used to optimize the analysis of patients who
had poor outcomes after hospitalization for inflammatory pelvic disease,(Terao et al.,
2013) and to create a prognostic index of patient mortality after intensive care.(Cardoso
& Chiavone, 2013)
46
In using the ROC results to select cut points for the HRMR components, the
authors reviewed common mathematical approaches such as the Youden index(Greiner,
Pfeiffer, & Smith, 2000) but opted on a customized approach in an attempt to account for
the prevalence of hospital readmissions and also the expense of testing overall and of
false positive results. The authors had to fundamentally decide whether to err in the
selection of cut points on the side of sensitivity (the ability of a test to correctly identify
people with a medical condition) or on specificity (the ability to rule out people who
don’t have a particular disease or medical problem). The dilemma has been described,
respectively, as whether a test should “rule in” patients for further consideration of a
medical issue, or “rule out” their risks.(Florkowski, 2008) A “rule in” approach was
adopted here, with the presumption that clinicians would use an HRMR screening to
evaluate patients at risk and then conduct further clinical assessments of their needs. This
favored cut points weighing more heavily on sensitivity, at the expense of specificity and
a higher rate of false positive results. An initial target of .75 for sensitivity and .50 for
specificity was chosen for the revision of cut points for the HRMR components.
2.2.2. Odds Ratio. Odds ratio (OR) computations were used to test the strength of
the relationship between HRMR and rehospitalization risks and compare the original
scoring criteria with newly derived HRMR scoring criteria using ORs. Odds ratios
indicated whether the relative odds of the occurrence of rehospitalization were different
for each of the independent variables that make up PIM (disease and medication class,
and medications) and MRCI (dose form, instructions, and frequency). The intent was for
the relative odds of the independent variables to be applied to the HRMR algorithm to see
47
if they generated better AUC curve results and more optimal cut points for predicting
rehospitalization rather than the original scoring criteria.
2.3. Data Transformations
Adjustments to the original HRMR scoring criteria were made based on clinical
observations and expertise of the authors – a doctorally prepared informatician, a
geriatric nurse practitioner, a nurse researcher with expertise in geriatrics and home
health care data, and a physician who is also a clinical pharmacist. These transformations
were attempted to optimize the criteria of the algorithm and the HRMR cut points, and
the methodologies behind them are described below:
2.3.1. Polypharmacy
PRN medications (taken as needed), over-the-counter medications, and
medications with limited dosing time such as antibiotics were included in the original
HRMR research, while other more benign items such as oxygen or saline to dilute IV
medications were excluded. Combination and variable dosed drugs were counted as one
drug.
Based on clinical judgment and polypharmacy criteria in other recent
publications,(Abdulraheem, 2013; Beloosesky, Nenaydenko, Gross Nevo, Adunsky, &
Weiss, 2013) this study modified the polypharmacy scoring for HRMR calculations by
excluding acetaminophen, vitamins, supplements, and PRN medications from the
medication count. ROC curves were used to compare the predictive strength of the
original HRMR scoring with these modified scores.
48
2.3.2. Potentially Inappropriate Medications
This analysis modified the PIM scoring criteria, based on clinical observation and
a review of recent publications regarding adverse drug events related to certain drug
classes.Two additional higher-risk categories were created for selected drugs in PIM
schedule 1 (those always inappropriate regardless of diagnosis) and assigning them
greater scoring weights (Table 1).
Highest (assigned weight of 10) included antispasmodics and long-acting
benzodiazepines due to adverse central nervous system effects and dementia and
increased sensitivity with age. Antispasmodics also have uncertain effectiveness
and are highly anticholinergic while the benzodiazepines present an elevated risk
of falls.(American Geriatrics Society 2012 Beers Criteria Update Expert Panel,
2012)
Medium (assigned weight of 5) included digoxin due to potential toxic effects and
nitrofurantoin and thioridazine due to known risks and the availability of safer
alternatives for the treatments, respectively of infections and psychosis.
Remaining PIM schedule 1 drugs retained their assigned weights (2.5 and 2) from
the original analysis as did schedule 2 drugs (1.5 and 1).
Odds ratio analysis also was applied to PIM schedules 1 and 2 using the
independent variables of high-risk medications and medications with disease-specific
risks in the elderly. The intent of this analysis was to apply the relative odds of
49
rehospitalization for each of the independent variables to the algorithm to determine if
they were stronger than the weighted scores in the original HRMR research.
ROC analysis then was used to see if either of the modified PIM scoring criteria –
one derived from clinical judgment and literature review, the other from the OR analysis
– were better at identifying patients needing rehospitalization than the original scoring
criteria.
2.3.3 Medication Regimen Complexity Index (MRCI).
ROC analysis then compared the predictive strength of MRCI in identifying
patients who will be rehospitalized against modified criteria, including MRCI schedules
A, B and C individually; and schedules A and C together only. The latter was done to
address a theory that schedule B (dosing frequency) might be redundant with
polypharmacy.
In addition, odds ratio analyses were applied to schedules A, B, and C using
independent variables of dose form, frequency and special dosing instructions to
understand the relative odds of rehospitalization. The intent of this analysis was to apply
the relative odds of rehospitalization for each of the independent variables to the
algorithm instead of George’s original weighted scores. ROC analysis was again used to
test the independent variables and whether they optimized the algorithm.
50
3. Results
Table 2 summarizes results of the ROC analyses.
3.1 Polypharmacy
Removing vitamins and supplements from the medication counts improved the
AUC slightly (.66 vs. .68) (Figure I). Removing PRN medications did not improve the
AUC (.66) and removing acetaminophen caused the AUC to decrease (.64). Using the
criteria that produced an AUC of .68 (the analysis in which vitamins and supplements
were removed), the optimal cut point remained 9. This was based on a true positive rate
of .77 and a false positive rate of .53.
3.2 Potentially Inappropriate medications (PIM)
The original automated PIM algorithm produced an AUC curve of .6 (Figure II).
When weights based on clinical observation were applied to the algorithm, there was no
improvement to the original HRMR weights, producing a curve of .59.
When the odds ratio analysis was applied to each independent variable (risky
medications) in PIM schedule 1 (Table III) and each independent variable (risky
medications considering diagnosis) in PIM schedule 2 (Table IV), the resulting models
produced confidence intervals which contained one for each independent variable,
meaning the model was not valid.
Therefore, there was no support of an independent PIM effect on the odds of the
outcome (rehospitalization)). As a result, adjusted weights based on odds ratio analysis
were not applied to the algorithm to improve the AUC curve of .60.
51
3.3. Medication Complexity Index (MRCI)
MRCI schedules A, B, and C, when calculated separately, showed similar results
(.68, .68, .69) as when all MRCI schedules were calculated together (.69). (Figure III) A
cut point of 33, higher than the original 20, produced a true positive rate of .76 and a false
positive rate of .49 – meeting the goal in the study for establishing HRMR as a rule-in
test for readmission risks. When the odds ratio analysis was run on each component of
schedule A, B, and C, the only schedule which produced a statistically valid model was
C. Schedules A and B produced models in which each of the independent variables had
confidence intervals which contained 1. Therefore, dose form and frequency were not
supported to have an independent effect on the relative odds of the outcome
(rehospitalization). Schedule C’s model produced valid confidence intervals for 7 of 10
independent variables. (Table V) The other three variables were removed from the model
as their confidence intervals also were weak.
Rounding to the nearest whole number, each point estimate is identical to
George’s original weights for the MRCI variables. (Figure IV) The only exception is the
variable for “multiple units at one time”; the odds ratio analysis gave that a greater
rounded weight (2 points) than George’s original analysis (1 point). After rerunning the
ROC curve for MRCI with these modified weights, the AUC remained unchanged at .69.
Using the actual results from the Odds Ratio analysis, instead of rounding to match
George’s methodology, produced a slightly stronger .7 AUC result for schedule C’s
influence on rehospitalization risks.
52
4. Discussion
This study determined optimal criteria for an algorithm using HRMR scores to
predict elderly patients at risk for rehospitalization, and contributed to an acceleration of
research in the area of medications and hospital readmissions. Two other studies both
attributed hospital readmissions in the elderly to polypharmacy(Morandi et al., 2013;
Sganga et al., 2014) – though they used different criteria – while a third concluded that
both polypharmacy and PIM are “under recognized causes of readmissions to the
hospital.”(Sehgal et al., 2013) But while the components of HRMR draw increasing
research interest, there has been little follow-up to the initial discovery that HRMR is
uniquely associated with hospital readmission risks.(Dierich, 2010) This could owe to the
fact that HRMR and the MRCI component itself are relatively new to medical research.
PubMed shows only 33 studies referring to MRCI, with one associating it with hospital
readmissions in the elderly.(Willson et al., 2014)
The ROC analysis supported that polypharmacy is a strong component of the
HRMR model, and was slightly more predictive of rehospitalizations when vitamins and
supplements were removed from patients’ drug counts. This exclusion mimics
approaches used in other studies(Beloosesky et al., 2013) and argues in favor of
removing vitamins and supplements from future studies linking polypharmacy to
rehospitalization and related outcomes. Supplements are not risk-free for seniors,(Mursu,
Robien, Harnack, Park, & Jacobs, 2011) but they are widely taken for general
health.(Kaufman, Kelly, Rosenberg, Anderson, & Mitchell, 2002) Removing them might
have sharpened the algorithm’s ability to identify rehospitalizations by focusing on sicker
53
patients whose high polypharmacy counts consisted of more prescription medications.
The results were weakened by the removal of acetaminophen, which also is taken broadly
by seniors for general pain relief,(Kaufman et al., 2002) but has documented risks such as
drug-induced liver injury(Leise, Poterucha, & Talwalkar, 2014; Yuan & Kaplowitz,
2013) that could make it more relevant to this HRMR analysis.
An ancillary benefit of the study is its contribution to the global definition of
polypharmacy. The original HRMR cut point for polypharmacy was 9 or more drugs, one
that is commonly but not exclusively used in research, and further analysis showed a
polypharmacy cut point of 9 optimized the algorithm and the prediction of patients at risk
for rehospitalization. This could serve as a guide for future research.
Results for PIM schedules showed they were weaker components of the HRMR
calculation in estimating patient rehospitalization risks. PIM in other studies has had a
dependent relationship with polypharmacy, in that the more drugs elderly patients have,
the more likely they are to have inappropriate prescriptions in their regimens.(Vieira de
Lima, Garbin, Garbin, Sumida, & Saliba, 2013; Weng et al., 2013). Attempts to
strengthen PIM by revising cut points were unsuccessful in this study as the AUC curves
produced were only slightly better than chance. While at least one study has associated
PIM with readmissions,(Price et al., 2014a) our findings agree with other studies that
have found PIM alone to be predictive of other problems, such as inpatient falls, but not
rehospitalization.(Borenstein et al., 2013) Despite its weak relationship to
rehospitalizations on its own, PIM nonetheless appears an important component of the
HRMR construct. Dierich’s original study found HRMR to be “more than the sum of its
54
parts” and that PIM played a role in its predictive strength.The original MRCI scoring
weights from George’s research also proved optimal, though adjustments based on an
odds ratio analysis did modestly improve the predictive strength of schedule C (drugs
with special instructions). ROC results for both HRMR components approached .7, which
is a statistical threshold. This analysis also adjusted the cut point that distinguishes
patients at greater risk of rehospitalization to 33 for MRCI (the original cut point in the
HRMR calculation was 20). This is one of the first attempts in research literature at
establishing such a cut point for the use of MRCI in predictive tests.
This study suggests a need for more targeted research on HRMR scores and
whether they can predict adverse outcomes among the elderly in ways that other
measures of medications and medication regimens cannot.
4.1 Limitations
Odds ratio and ROC analysis are common validation tools in medical research for
the development of predictive tools and indexes, but they are ultimately dependent upon
the criteria and information selected for analysis. Medical researchers have not arrived on
a common definition for polypharmacy, with cut points often ranging from 2 to 9,(Hajjar,
Cafiero, & Hanlon, 2007) and have varied in their inclusion of over-the-counter
medications. This study used a PubMed literature search and clinical judgments of its
authors to decide which medications and medication classes to exclude from the weighted
scoring of both polypharmacy and PIM in the calculations of HRMR scores. Due to the
broad number of drug inclusion and exclusion combinations, it is possible that relevant
adjustments to the weighted scores were not tested and identified in this research. For
55
continuity with Dierich’s original HRMR research, it was necessary to use the original
2003 Beers criteria, though a significant update was produced in 2012.(American
Geriatrics Society 2012 Beers Criteria Update Expert Panel, 2012) Although the two lists
have “substantial agreement,”(Baldoni et al., 2013) nineteen classes of drugs were
removed in the latest update – in some cases because the drugs were removed from the
U.S. market – while other common medications such as atypical antipsychotics were
added. Further research using the updated criteria and its inclusion of antipsychotics and
other medications could alter how PIM counts contribute to research involving HRMRs
and to the strength of HRMRs in predicting readmission risks.
5. Conclusion
HRMR calculations are optimized by adjusting the underlying criteria of
polypharmacy to exclude supplements and vitamins from the count of medications, and
by increasing the MRCI cut point that distinguishes patients by their medication-related
risks for hospital readmissions. While modest, the changes strengthen the case for an
HRMR algorithm that clinicians can use to assess elderly patients’ risks for avoidable
readmissions.Next steps include testing the automated HRMR algorithm with the
prescription and OASIS data of different populations to see if can be optimized further.
56
Clinical Relevance Statement
This report is the next step in operationalizing for clinicians and researchers an
automated algorithm which has proven to predict elderly home care patients at risk for
unnecessary hospital readmissions.
Conflict of Interest
The authors report no conflicts of interest in the production of this paper.
Human Subjects Protections
This study was reviewed by a university Institutional Review Board and meets the
human protections criteria set forth by the World Medical Association Declaration of
Helsinki on Ethical Principles for Medical Research Involving Human Subjects.
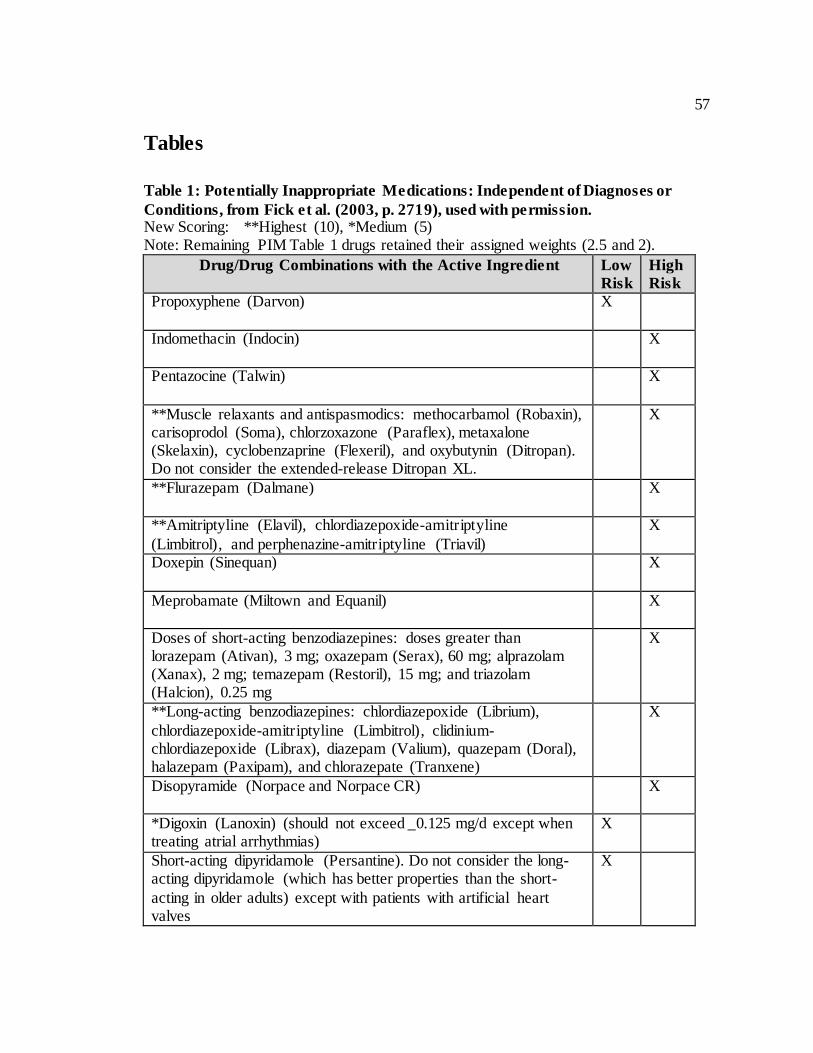
57
Tables
Table 1: Potentially Inappropriate Medications: Independent of Diagnoses or
Conditions, from Fick et al. (2003, p. 2719), used with permission. New Scoring: **Highest (10), *Medium (5) Note: Remaining PIM Table 1 drugs retained their assigned weights (2.5 and 2).
Drug/Drug Combinations with the Active Ingredient Low
Risk
High
Risk
Propoxyphene (Darvon) X
Indomethacin (Indocin) X
Pentazocine (Talwin) X
**Muscle relaxants and antispasmodics: methocarbamol (Robaxin), carisoprodol (Soma), chlorzoxazone (Paraflex), metaxalone (Skelaxin), cyclobenzaprine (Flexeril), and oxybutynin (Ditropan). Do not consider the extended-release Ditropan XL.
X
**Flurazepam (Dalmane) X
**Amitriptyline (Elavil), chlordiazepoxide-amitriptyline
(Limbitrol), and perphenazine-amitriptyline (Triavil)
X
Doxepin (Sinequan) X
Meprobamate (Miltown and Equanil) X
Doses of short-acting benzodiazepines: doses greater than lorazepam (Ativan), 3 mg; oxazepam (Serax), 60 mg; alprazolam (Xanax), 2 mg; temazepam (Restoril), 15 mg; and triazolam (Halcion), 0.25 mg
X
**Long-acting benzodiazepines: chlordiazepoxide (Librium),
chlordiazepoxide-amitriptyline (Limbitrol), clidinium-chlordiazepoxide (Librax), diazepam (Valium), quazepam (Doral), halazepam (Paxipam), and chlorazepate (Tranxene)
X
Disopyramide (Norpace and Norpace CR) X
*Digoxin (Lanoxin) (should not exceed _0.125 mg/d except when treating atrial arrhythmias)
X
Short-acting dipyridamole (Persantine). Do not consider the long-acting dipyridamole (which has better properties than the short-
acting in older adults) except with patients with artificial heart valves
X
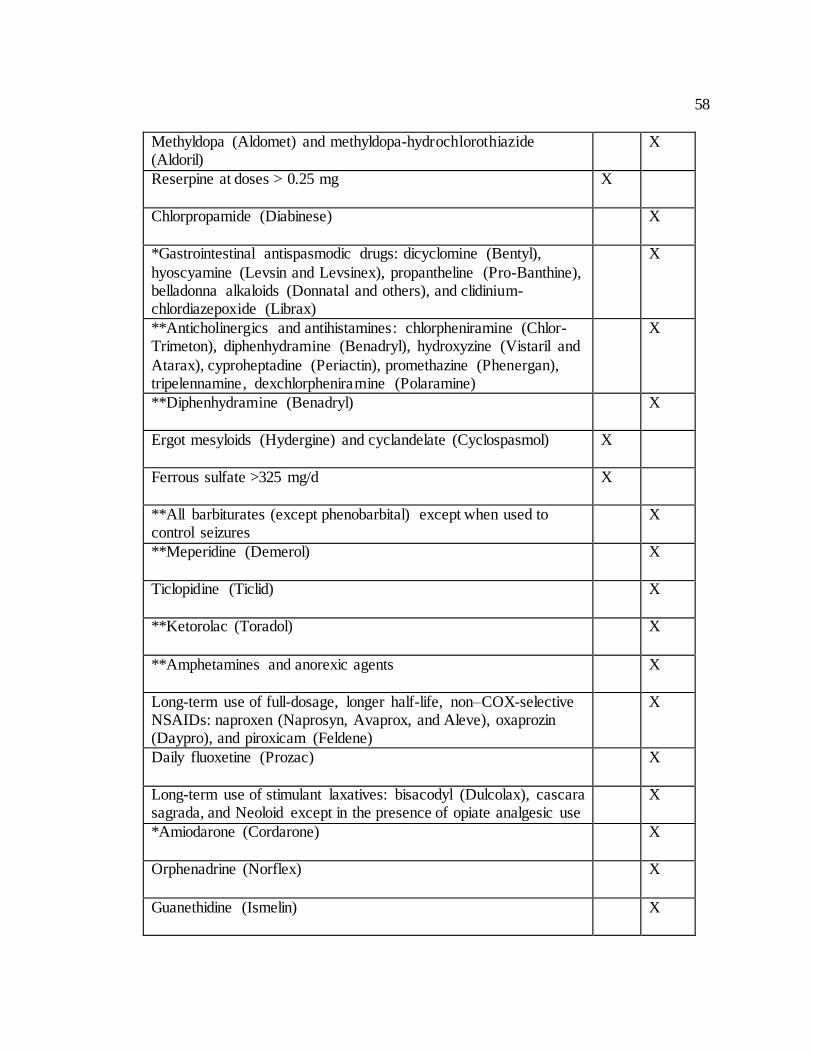
58
Methyldopa (Aldomet) and methyldopa-hydrochlorothiazide (Aldoril)
X
Reserpine at doses > 0.25 mg X
Chlorpropamide (Diabinese) X
*Gastrointestinal antispasmodic drugs: dicyclomine (Bentyl),
hyoscyamine (Levsin and Levsinex), propantheline (Pro-Banthine), belladonna alkaloids (Donnatal and others), and clidinium-chlordiazepoxide (Librax)
X
**Anticholinergics and antihistamines: chlorpheniramine (Chlor-Trimeton), diphenhydramine (Benadryl), hydroxyzine (Vistaril and
Atarax), cyproheptadine (Periactin), promethazine (Phenergan), tripelennamine, dexchlorpheniramine (Polaramine)
X
**Diphenhydramine (Benadryl) X
Ergot mesyloids (Hydergine) and cyclandelate (Cyclospasmol) X
Ferrous sulfate >325 mg/d X
**All barbiturates (except phenobarbital) except when used to control seizures
X
**Meperidine (Demerol) X
Ticlopidine (Ticlid) X
**Ketorolac (Toradol) X
**Amphetamines and anorexic agents X
Long-term use of full-dosage, longer half-life, non–COX-selective NSAIDs: naproxen (Naprosyn, Avaprox, and Aleve), oxaprozin (Daypro), and piroxicam (Feldene)
X
Daily fluoxetine (Prozac) X
Long-term use of stimulant laxatives: bisacodyl (Dulcolax), cascara sagrada, and Neoloid except in the presence of opiate analgesic use
X
*Amiodarone (Cordarone) X
Orphenadrine (Norflex) X
Guanethidine (Ismelin) X
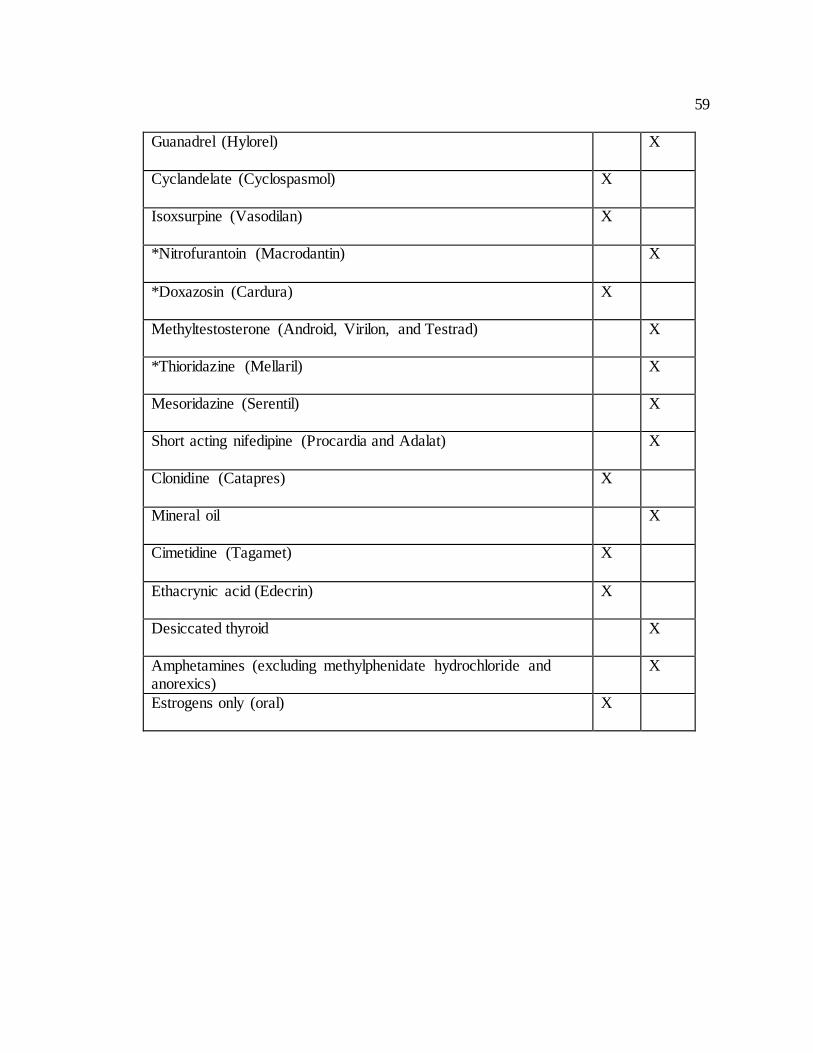
59
Guanadrel (Hylorel) X
Cyclandelate (Cyclospasmol) X
Isoxsurpine (Vasodilan) X
*Nitrofurantoin (Macrodantin) X
*Doxazosin (Cardura) X
Methyltestosterone (Android, Virilon, and Testrad) X
*Thioridazine (Mellaril) X
Mesoridazine (Serentil) X
Short acting nifedipine (Procardia and Adalat) X
Clonidine (Catapres) X
Mineral oil X
Cimetidine (Tagamet) X
Ethacrynic acid (Edecrin) X
Desiccated thyroid X
Amphetamines (excluding methylphenidate hydrochloride and anorexics)
X
Estrogens only (oral) X
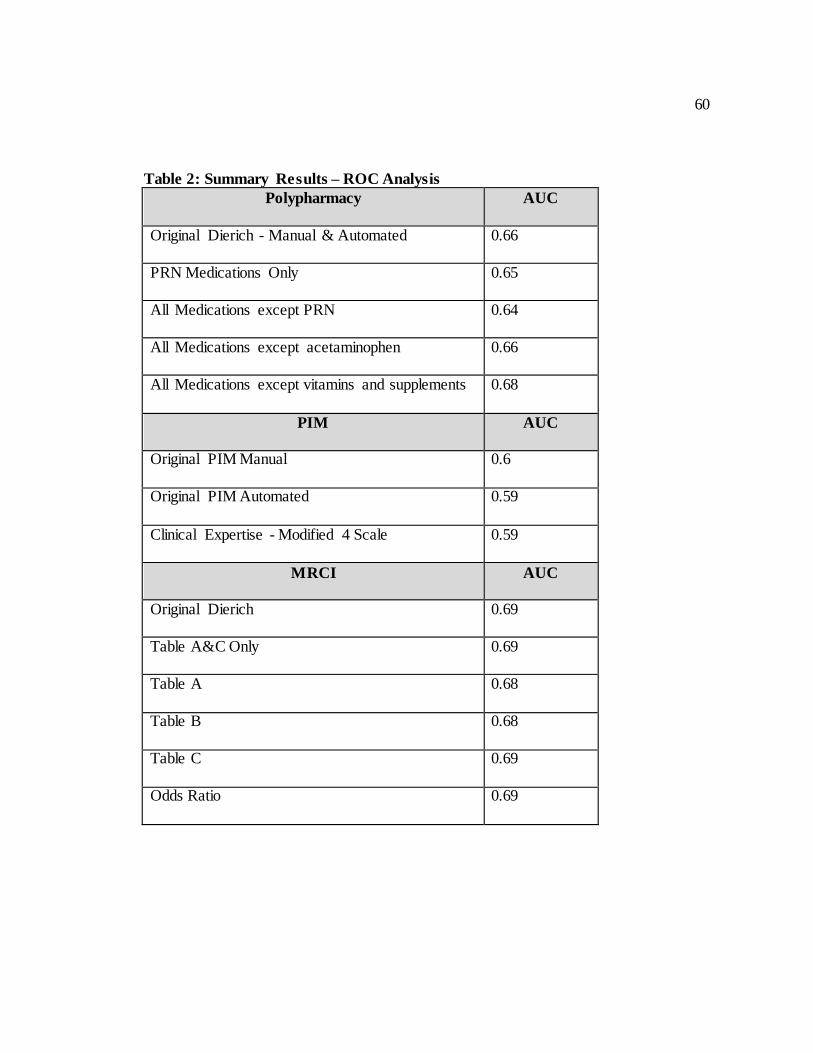
60
Table 2: Summary Results – ROC Analysis
Polypharmacy
AUC
Original Dierich - Manual & Automated 0.66
PRN Medications Only 0.65
All Medications except PRN 0.64
All Medications except acetaminophen 0.66
All Medications except vitamins and supplements 0.68
PIM
AUC
Original PIM Manual 0.6
Original PIM Automated 0.59
Clinical Expertise - Modified 4 Scale 0.59
MRCI
AUC
Original Dierich 0.69
Table A&C Only 0.69
Table A 0.68
Table B 0.68
Table C 0.69
Odds Ratio 0.69
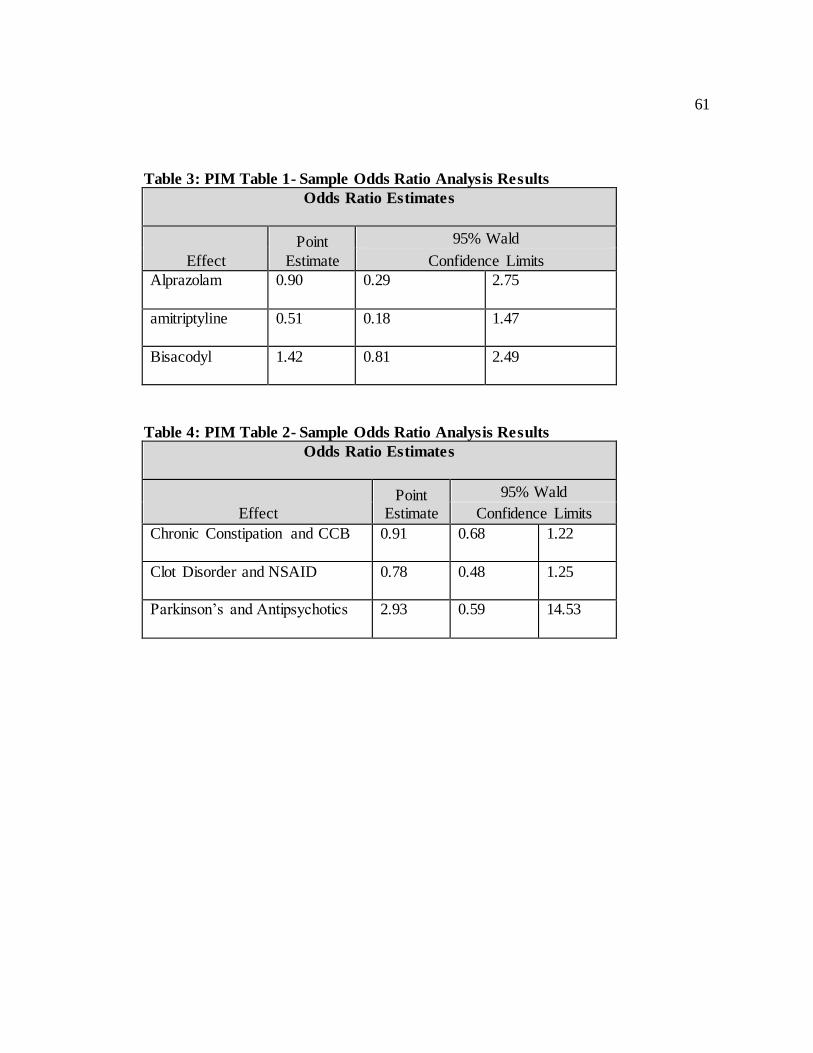
61
Table 3: PIM Table 1- Sample Odds Ratio Analysis Results
Odds Ratio Estimates
Effect
Point
Estimate
95% Wald
Confidence Limits
Alprazolam 0.90 0.29 2.75
amitriptyline 0.51 0.18 1.47
Bisacodyl 1.42 0.81 2.49
Table 4: PIM Table 2- Sample Odds Ratio Analysis Results
Odds Ratio Estimates
Effect Point
Estimate
95% Wald
Confidence Limits
Chronic Constipation and CCB 0.91 0.68 1.22
Clot Disorder and NSAID 0.78 0.48 1.25
Parkinson’s and Antipsychotics 2.93 0.59 14.53
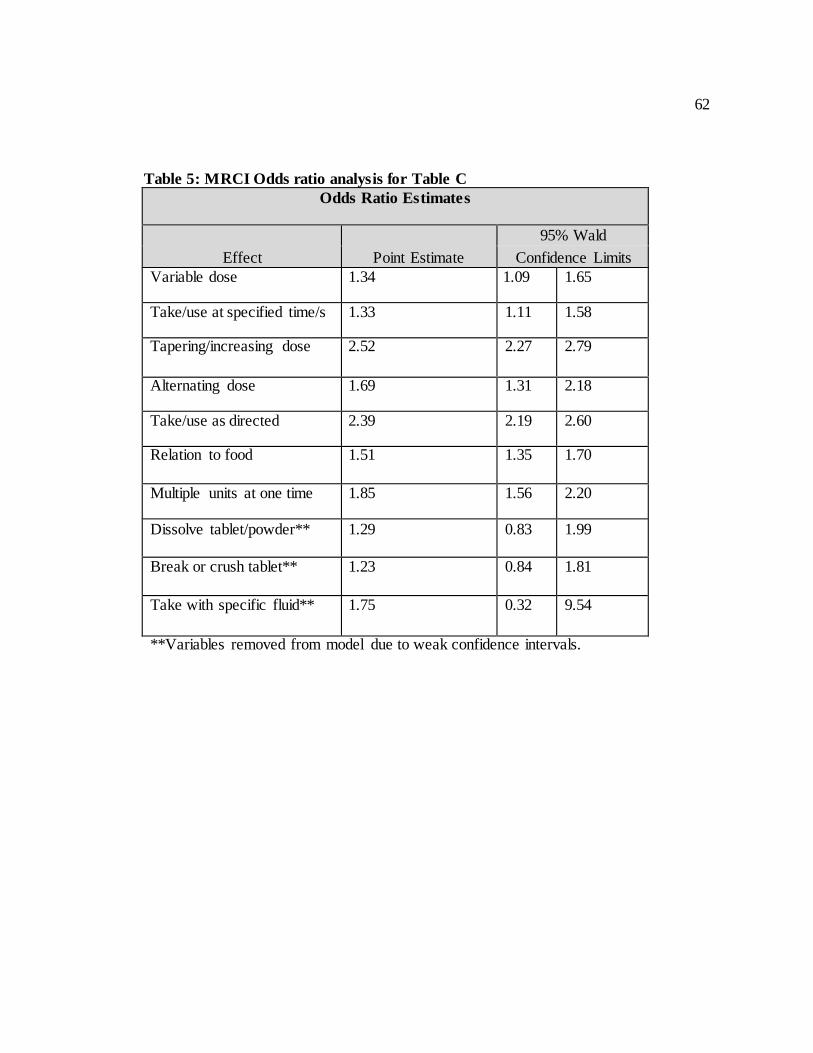
62
Table 5: MRCI Odds ratio analysis for Table C
Odds Ratio Estimates
Effect Point Estimate
95% Wald
Confidence Limits Variable dose 1.34 1.09 1.65
Take/use at specified time/s 1.33 1.11 1.58
Tapering/increasing dose 2.52 2.27 2.79
Alternating dose 1.69 1.31 2.18
Take/use as directed 2.39 2.19 2.60
Relation to food 1.51 1.35 1.70
Multiple units at one time 1.85 1.56 2.20
Dissolve tablet/powder** 1.29 0.83 1.99
Break or crush tablet** 1.23 0.84 1.81
Take with specific fluid**
1.75 0.32 9.54
**Variables removed from model due to weak confidence intervals.
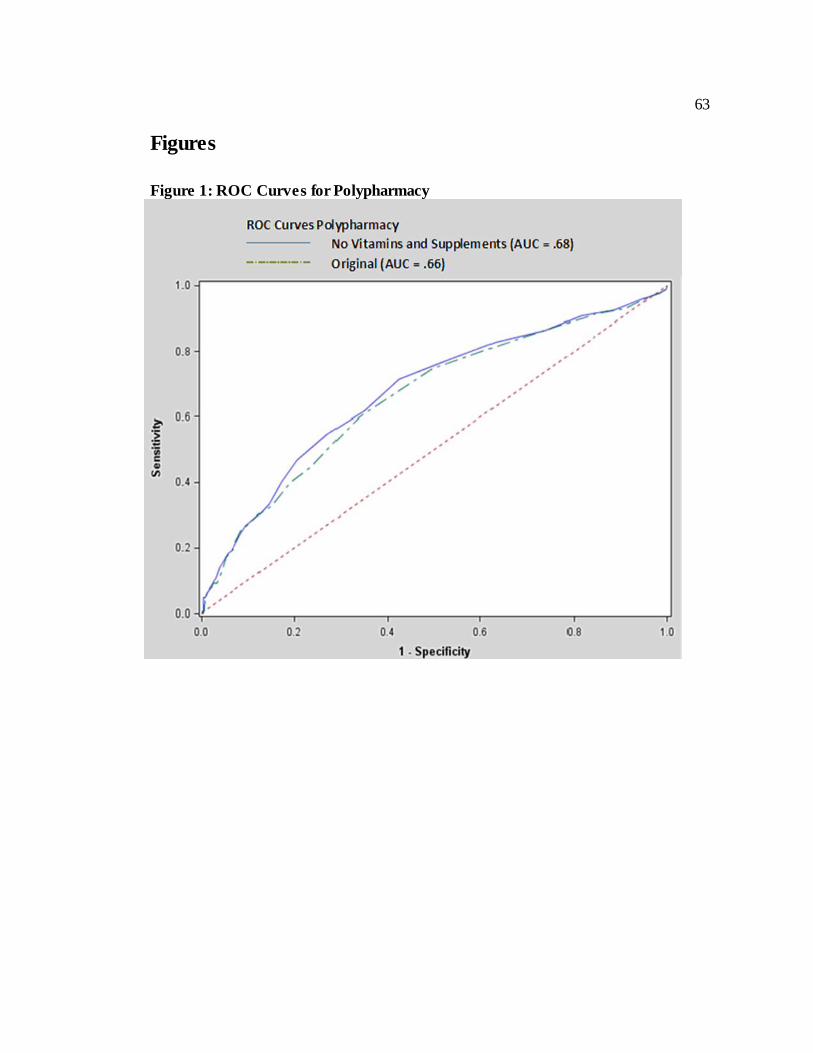
63
Figures
Figure 1: ROC Curves for Polypharmacy
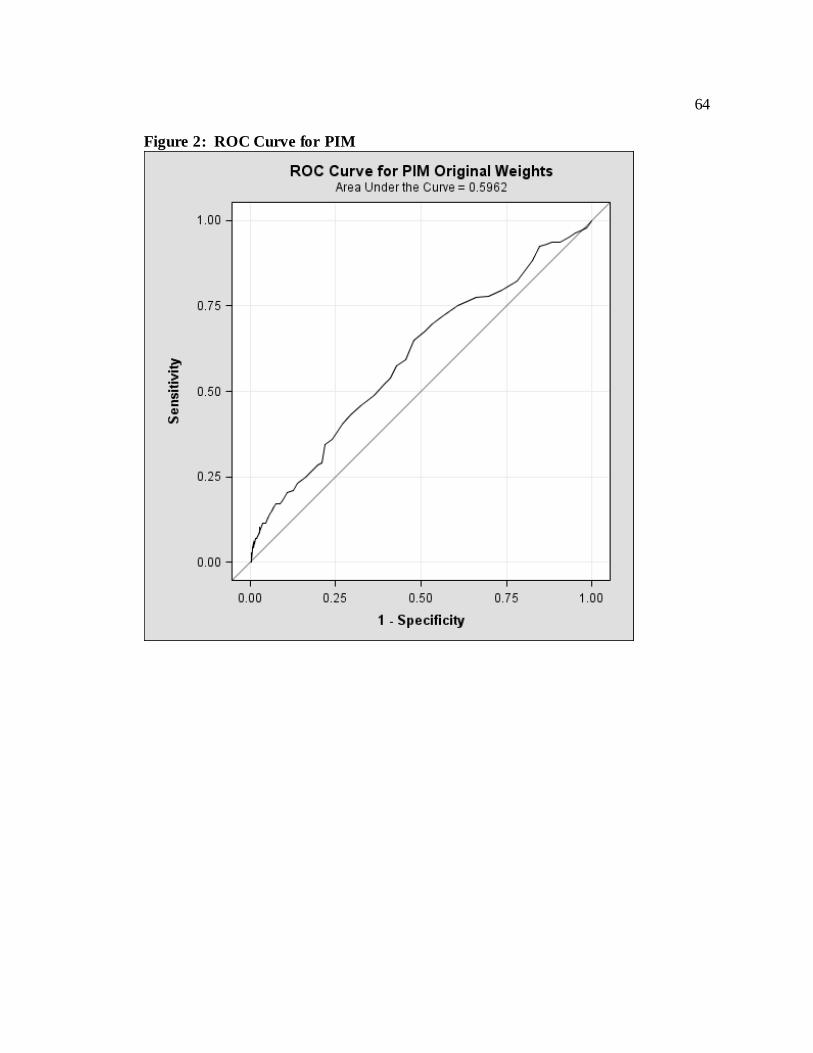
64
Figure 2: ROC Curve for PIM
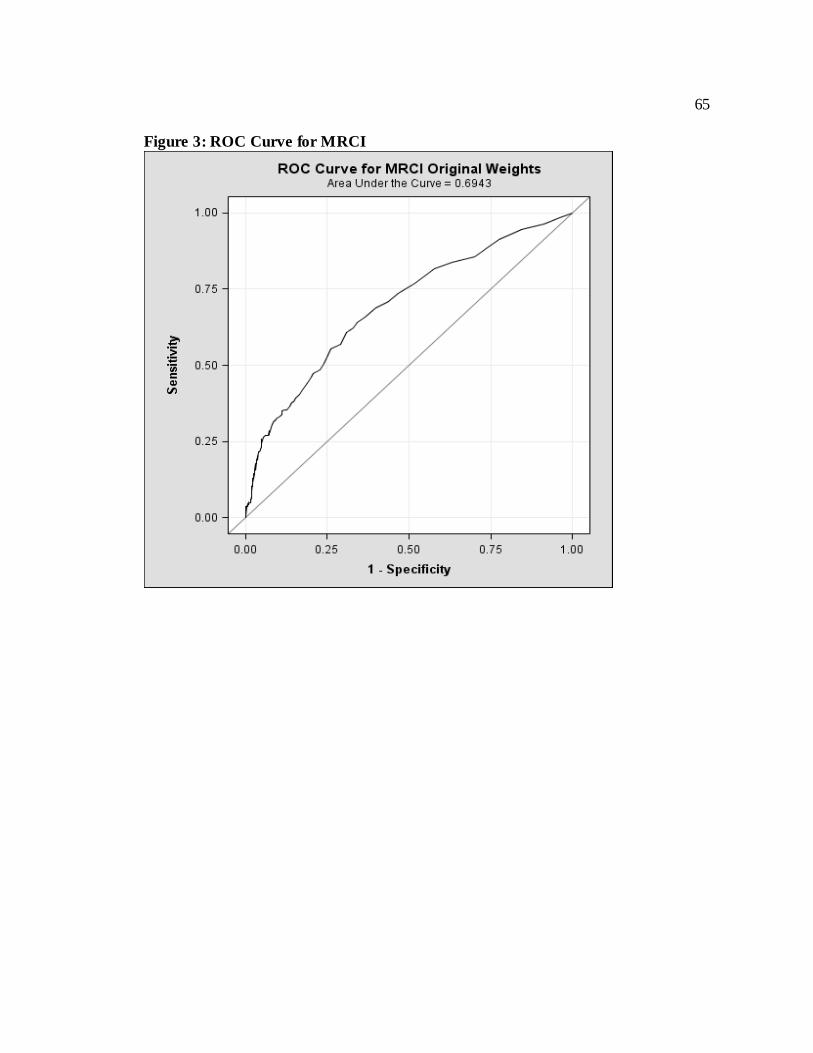
65
Figure 3: ROC Curve for MRCI
66
Paper 3:
Clustering of Elderly Patient Subgroups to
Identify Medication-Related Readmission
Risks
67
Clustering of Elderly Patient Subgroups to Identify Medication-Related
Readmission Risks
Primary Investigator Catherine H Olson
PhD Candidate, Biomedical Health Informatics
University of Minnesota 330 Diehl Hall
505 Essex Street SE Minneapolis, MN 55455
612-626-3348 [email protected]
Other Investigators
Sanjoy Dey, PhD. Research Assistant, Computer Science and Engineering
University of Minnesota Minneapolis, Minnesota
Vipin Kumar, PhD. Department Head, Computer Science and Engineering
University of Minnesota Minneapolis, MN
Karen A. Monsen, PhD., R.N, FAAN Associate Professor, School of Nursing
University of Minnesota Minneapolis, MN
Bonnie L Westra, PhD., RN, FAAN, FACMI Associate Professor, School of Nursing
University of Minnesota Minneapolis, Minnesota
68
Introduction: High Risk Medication Regimen (HRMR) scores are weakly
predictive of hospital readmissions for elderly home health care patients. One possibility
is that HRMR scores are more predictive for demographic subgroups of elderly patients.
HRMR is composed of three elements related to drug risks: polypharmacy (number of
medications); Potentially Inappropriate Medications (PIM) known to be harmful to the
elderly; and the Medication Regimen Complexity Index (MRCI) that weighs drugs by the
complexity of their dosing and instructions. This study used Outcome and Assessment
Information Set (OASIS) variables to identify subgroups of patients for whom the HRMR
measures appeared more predictive for hospital readmissions.
Methods: OASIS and medication data were reused from a study of 911 patients
from 15 Medicare-certified home health care agencies that established the relationship
between HRMR and hospital readmissions. Hierarchical agglomerative clustering using
the Jaccard distance measure and average-link method identified patient subgroups based
on the OASIS data. Receiver operating curve (ROC) analyses evaluated the predictive
strength of the HRMR variables for each subgroup. Additional False Discovery Rate
(FDR) analyses assessed whether the clustered relationships were chance.
Results: Clustering of OASIS data for 911 patients identified six subgroups
(patients with good functional status, females with moderate to severe pain, patients with
poor prognosis needing functional status assistance, patients with poor functional status,
males with adult children as caregiver, adults living alone with spouses as primary
caregiver.) ROC results relating these subgroups to HRMR risks were strongest for males
with adult children as caregivers (AUC: polypharmacy, .73; PIM, .64; MRCI, .77). The
69
findings for this subgroup also met the FDR analysis threshold (<=.20).
Conclusions: A risk of medication-related readmissions in elderly men with adult
children as caregivers is consistent with research showing problems in medication
adherence when seniors are supported by informal caregivers. The results from clustering
analysis present a hypothesis for research on HRMR and on the relationship between
adult caregivers and their fathers.
Keywords: Patient Readmission, Caregiver, Cluster Analysis, home healthcare,
High Risk Medication Regimen
1. Introduction
Reducing hospital readmissions has become a focus for U.S. hospitals and health
care systems following research showing that a substantial number of them are
unplanned(Jencks et al., 2009) and preventable(Kripalani et al., 2013), and that they
result in as much as $25 billion each year in “wasteful” health care spending.(National
Quality Forum, 2010a) Beyond the costs, preventing readmissions is a patient safety issue
because hospital care in general exposes patients to risks, including adverse drug events,
infections, delirium and cognitive decline.(Donze, Lipsitz, Bates, & Schnipper, 2013)
While transitional and home health care strategies have been developed to prevent
patients from needing readmissions,(Berry et al., 2011; Hunter, Nelson, & Birmingham,
2013; Markley, Sabharwal, Wang, Bigbee, & Whitmire, 2012) they are costly
interventions if provided universally to patients upon their discharges.(Donze et al., 2013)
70
Identifying patients at greatest risk for hospital readmission has consequently become a
priority. Medication usage by elderly homecare patients has emerged as an important
indicator of hospital readmission risk (Morrissey et al., 2003; National Quality Forum,
2010a) with one study finding a composite measure of High Risk Medication Regimens
(HRMR) more strongly associated with hospital readmissions than the presence of
comorbid conditions.(Dierich, 2010) This was a substantial finding given the number of
studies linking comorbidity to avoidable readmissions.(Donze et al., 2013; Librero, Peiro,
& Ordinana, 1999; Zekry et al., 2012) Further analysis found these HRMR calculations
could be automated and potentially integrated into clinical information systems to
identify at-risk patients for hospital readmission and provide them with supportive and
preventive services.(Olson et al., 2014) Opportunities to further identify the patients at
greatest risk of HRMR-related hospital readmissions are possible due to home healthcare
providers implementing electronic health record (EHR) systems and the development of
data mining tools that can be used to find patterns within the EHR data. Data mining
techniques have already been used to identify home healthcare patients that are more
adaptive to assistive technology(S. Zhang et al., 2014) and those able to show greater
improvement from incontinence(Westra et al., 2011). The purpose of this study was to
apply data mining techniques to determine if certain clusters of patients were more likely
to have high-risk drug regimens and consequently be at greater risk of hospital
readmissions. The results could prove instructive to the hospitals and health systems
trying to reduce their readmission rates – both to improve patient care and avoid new
Medicare penalties for having more readmissions than expected of patients treated for
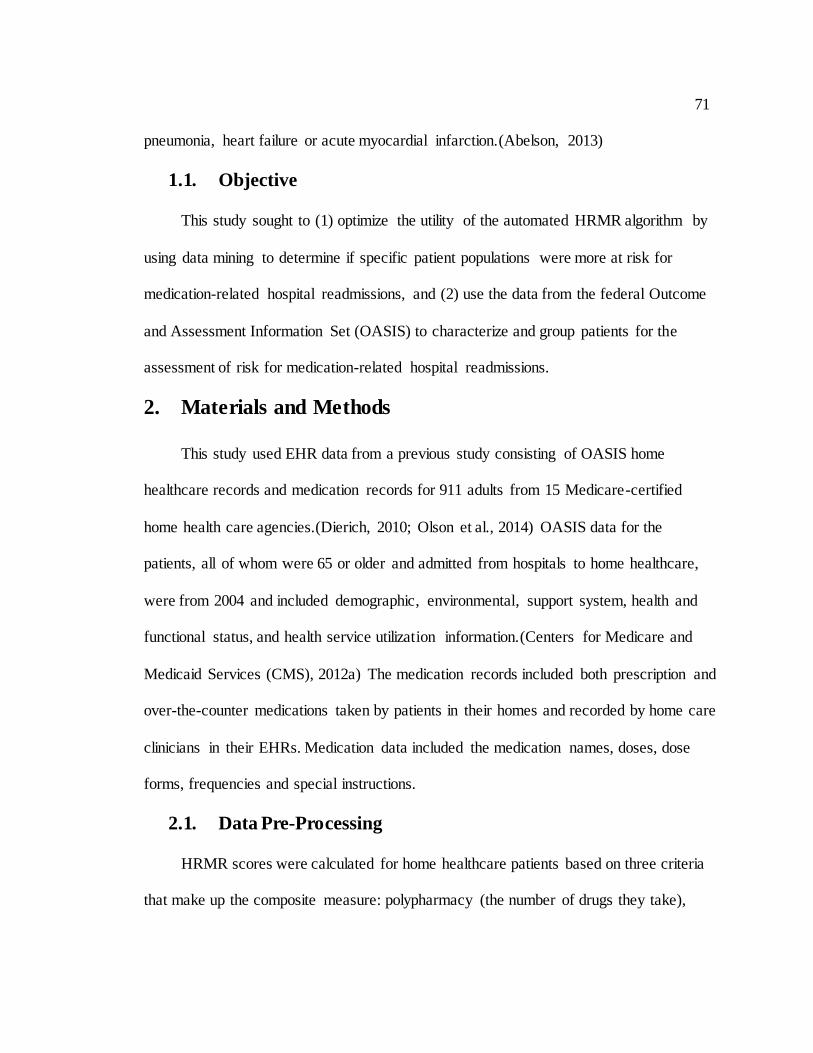
71
pneumonia, heart failure or acute myocardial infarction.(Abelson, 2013)
1.1. Objective
This study sought to (1) optimize the utility of the automated HRMR algorithm by
using data mining to determine if specific patient populations were more at risk for
medication-related hospital readmissions, and (2) use the data from the federal Outcome
and Assessment Information Set (OASIS) to characterize and group patients for the
assessment of risk for medication-related hospital readmissions.
2. Materials and Methods
This study used EHR data from a previous study consisting of OASIS home
healthcare records and medication records for 911 adults from 15 Medicare-certified
home health care agencies.(Dierich, 2010; Olson et al., 2014) OASIS data for the
patients, all of whom were 65 or older and admitted from hospitals to home healthcare,
were from 2004 and included demographic, environmental, support system, health and
functional status, and health service utilization information.(Centers for Medicare and
Medicaid Services (CMS), 2012a) The medication records included both prescription and
over-the-counter medications taken by patients in their homes and recorded by home care
clinicians in their EHRs. Medication data included the medication names, doses, dose
forms, frequencies and special instructions.
2.1. Data Pre-Processing
HRMR scores were calculated for home healthcare patients based on three criteria
that make up the composite measure: polypharmacy (the number of drugs they take),
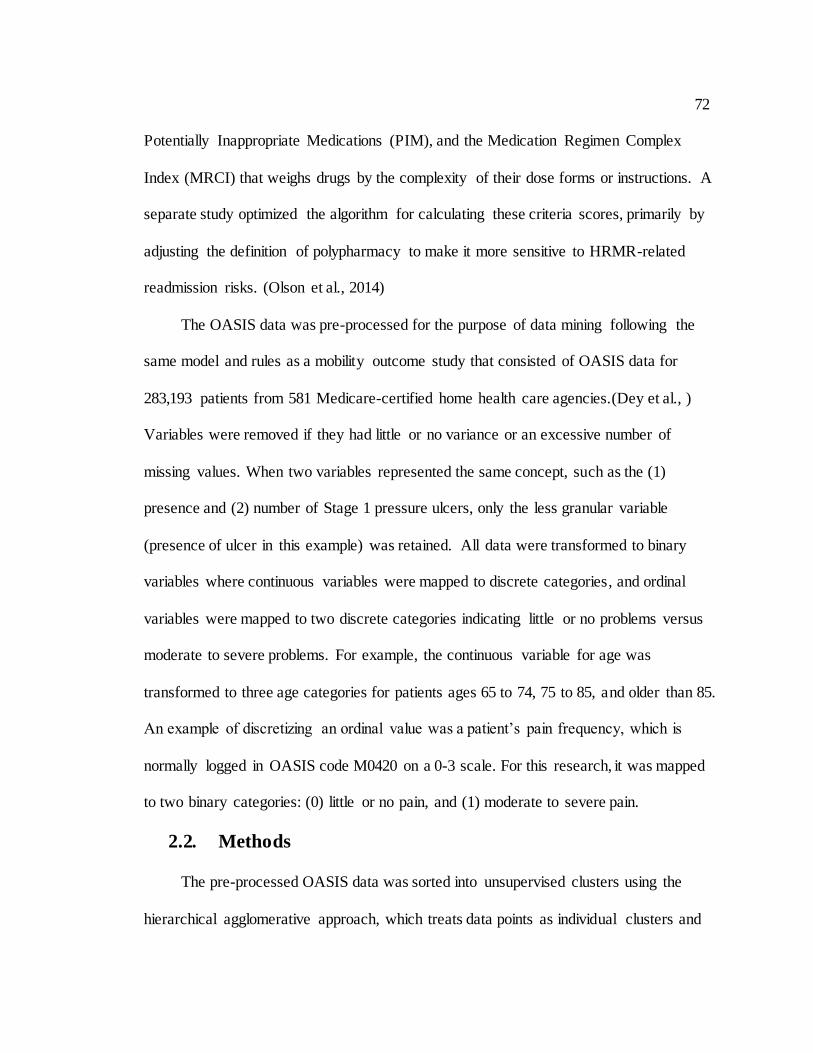
72
Potentially Inappropriate Medications (PIM), and the Medication Regimen Complex
Index (MRCI) that weighs drugs by the complexity of their dose forms or instructions. A
separate study optimized the algorithm for calculating these criteria scores, primarily by
adjusting the definition of polypharmacy to make it more sensitive to HRMR-related
readmission risks. (Olson et al., 2014)
The OASIS data was pre-processed for the purpose of data mining following the
same model and rules as a mobility outcome study that consisted of OASIS data for
283,193 patients from 581 Medicare-certified home health care agencies.(Dey et al., )
Variables were removed if they had little or no variance or an excessive number of
missing values. When two variables represented the same concept, such as the (1)
presence and (2) number of Stage 1 pressure ulcers, only the less granular variable
(presence of ulcer in this example) was retained. All data were transformed to binary
variables where continuous variables were mapped to discrete categories, and ordinal
variables were mapped to two discrete categories indicating little or no problems versus
moderate to severe problems. For example, the continuous variable for age was
transformed to three age categories for patients ages 65 to 74, 75 to 85, and older than 85.
An example of discretizing an ordinal value was a patient’s pain frequency, which is
normally logged in OASIS code M0420 on a 0-3 scale. For this research, it was mapped
to two binary categories: (0) little or no pain, and (1) moderate to severe pain.
2.2. Methods
The pre-processed OASIS data was sorted into unsupervised clusters using the
hierarchical agglomerative approach, which treats data points as individual clusters and
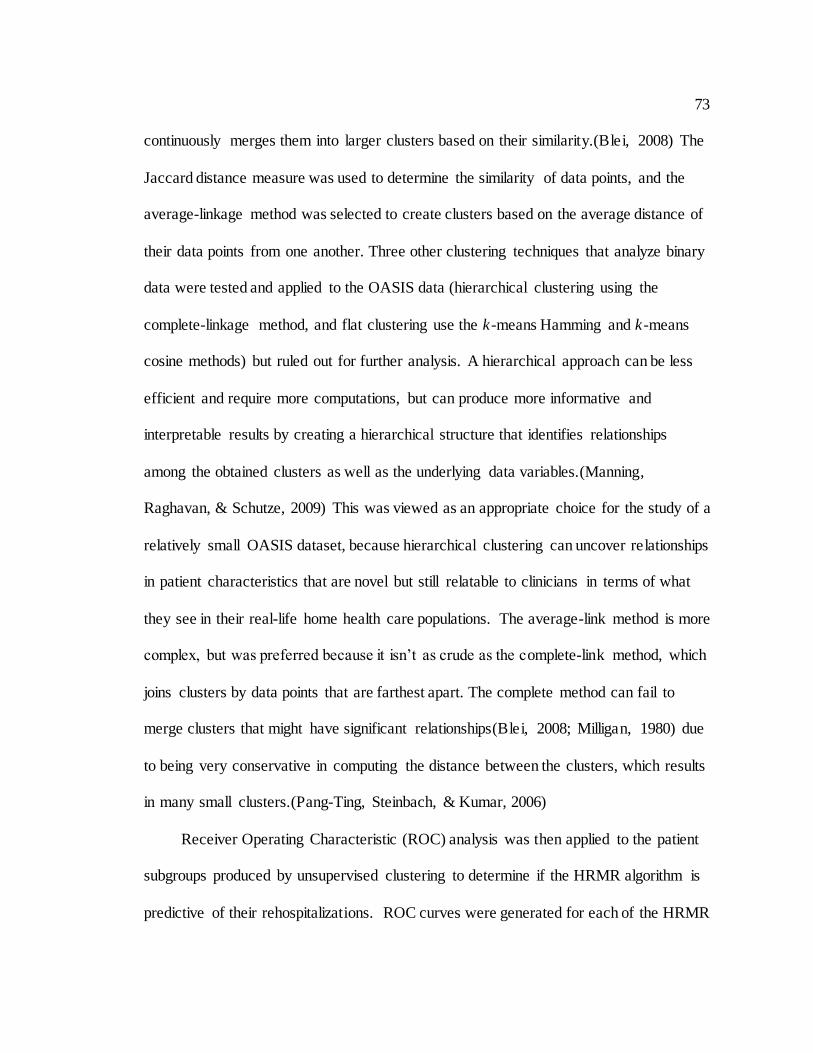
73
continuously merges them into larger clusters based on their similarity.(Blei, 2008) The
Jaccard distance measure was used to determine the similarity of data points, and the
average-linkage method was selected to create clusters based on the average distance of
their data points from one another. Three other clustering techniques that analyze binary
data were tested and applied to the OASIS data (hierarchical clustering using the
complete-linkage method, and flat clustering use the k-means Hamming and k-means
cosine methods) but ruled out for further analysis. A hierarchical approach can be less
efficient and require more computations, but can produce more informative and
interpretable results by creating a hierarchical structure that identifies relationships
among the obtained clusters as well as the underlying data variables.(Manning,
Raghavan, & Schutze, 2009) This was viewed as an appropriate choice for the study of a
relatively small OASIS dataset, because hierarchical clustering can uncover relationships
in patient characteristics that are novel but still relatable to clinicians in terms of what
they see in their real-life home health care populations. The average-link method is more
complex, but was preferred because it isn’t as crude as the complete-link method, which
joins clusters by data points that are farthest apart. The complete method can fail to
merge clusters that might have significant relationships(Blei, 2008; Milligan, 1980) due
to being very conservative in computing the distance between the clusters, which results
in many small clusters.(Pang-Ting, Steinbach, & Kumar, 2006)
Receiver Operating Characteristic (ROC) analysis was then applied to the patient
subgroups produced by unsupervised clustering to determine if the HRMR algorithm is
predictive of their rehospitalizations. ROC curves were generated for each of the HRMR
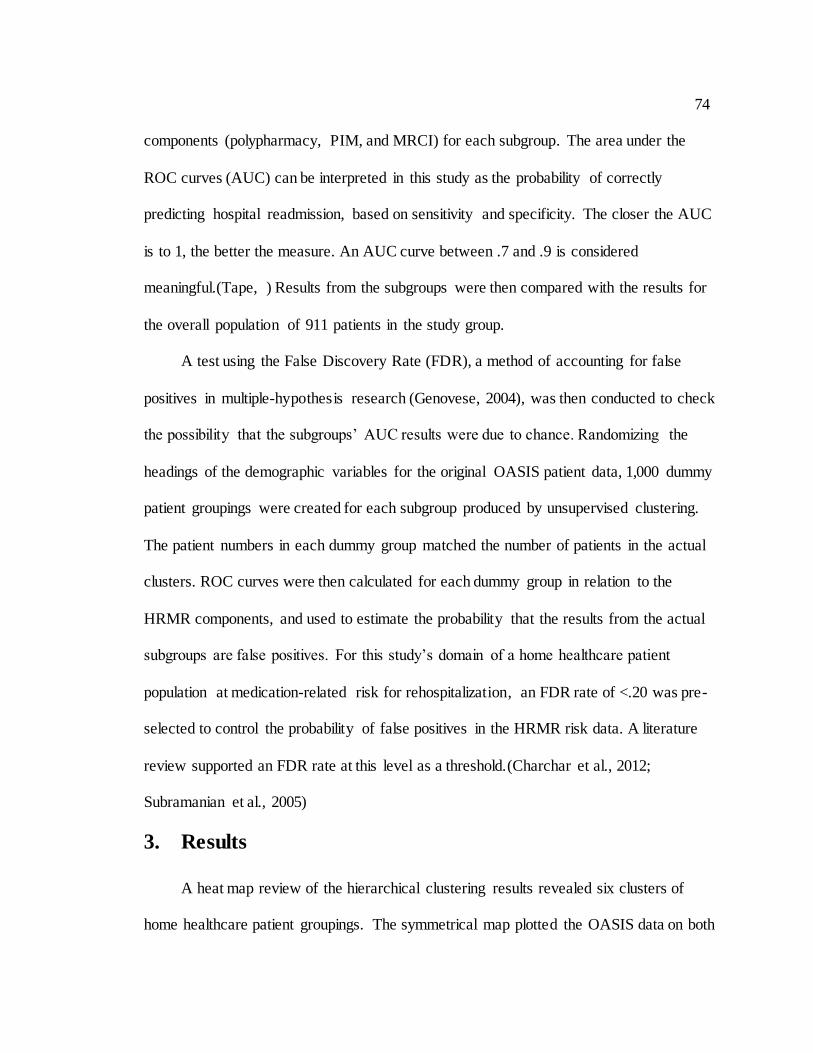
74
components (polypharmacy, PIM, and MRCI) for each subgroup. The area under the
ROC curves (AUC) can be interpreted in this study as the probability of correctly
predicting hospital readmission, based on sensitivity and specificity. The closer the AUC
is to 1, the better the measure. An AUC curve between .7 and .9 is considered
meaningful.(Tape, ) Results from the subgroups were then compared with the results for
the overall population of 911 patients in the study group.
A test using the False Discovery Rate (FDR), a method of accounting for false
positives in multiple-hypothesis research (Genovese, 2004), was then conducted to check
the possibility that the subgroups’ AUC results were due to chance. Randomizing the
headings of the demographic variables for the original OASIS patient data, 1,000 dummy
patient groupings were created for each subgroup produced by unsupervised clustering.
The patient numbers in each dummy group matched the number of patients in the actual
clusters. ROC curves were then calculated for each dummy group in relation to the
HRMR components, and used to estimate the probability that the results from the actual
subgroups are false positives. For this study’s domain of a home healthcare patient
population at medication-related risk for rehospitalization, an FDR rate of <.20 was pre-
selected to control the probability of false positives in the HRMR risk data. A literature
review supported an FDR rate at this level as a threshold.(Charchar et al., 2012;
Subramanian et al., 2005)
3. Results
A heat map review of the hierarchical clustering results revealed six clusters of
home healthcare patient groupings. The symmetrical map plotted the OASIS data on both
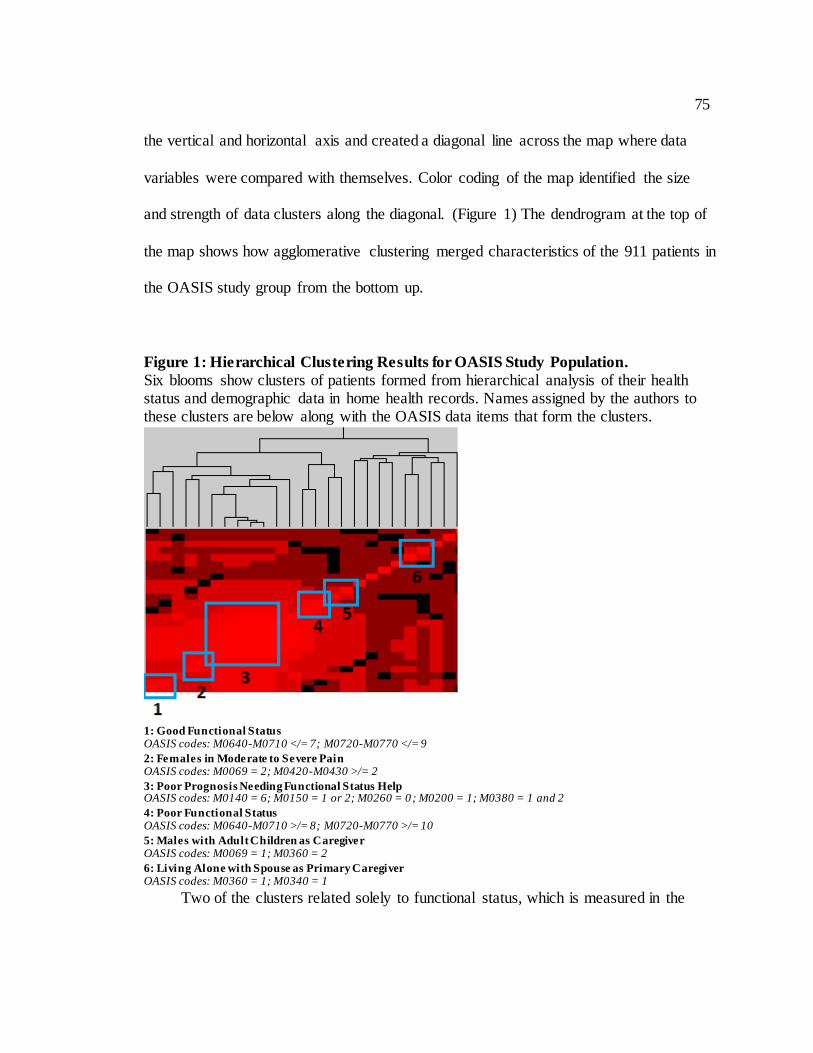
75
the vertical and horizontal axis and created a diagonal line across the map where data
variables were compared with themselves. Color coding of the map identified the size
and strength of data clusters along the diagonal. (Figure 1) The dendrogram at the top of
the map shows how agglomerative clustering merged characteristics of the 911 patients in
the OASIS study group from the bottom up.
Figure 1: Hierarchical Clustering Results for OASIS Study Population.
Six blooms show clusters of patients formed from hierarchical analysis of their health status and demographic data in home health records. Names assigned by the authors to these clusters are below along with the OASIS data items that form the clusters.
1: Good Functional Status OASIS codes: M0640-M0710 </= 7; M0720-M0770 </= 9
2: Females in Moderate to Severe Pain OASIS codes: M0069 = 2; M0420-M0430 >/= 2
3: Poor Prognosis Needing Functional Status Help OASIS codes: M0140 = 6; M0150 = 1 or 2; M0260 = 0; M0200 = 1; M0380 = 1 and 2
4: Poor Functional Status OASIS codes: M0640-M0710 >/= 8; M0720-M0770 >/= 10
5: Males with Adult Children as Caregiver OASIS codes: M0069 = 1; M0360 = 2
6: Living Alone with Spouse as Primary Caregiver OASIS codes: M0360 = 1; M0340 = 1
Two of the clusters related solely to functional status, which is measured in the
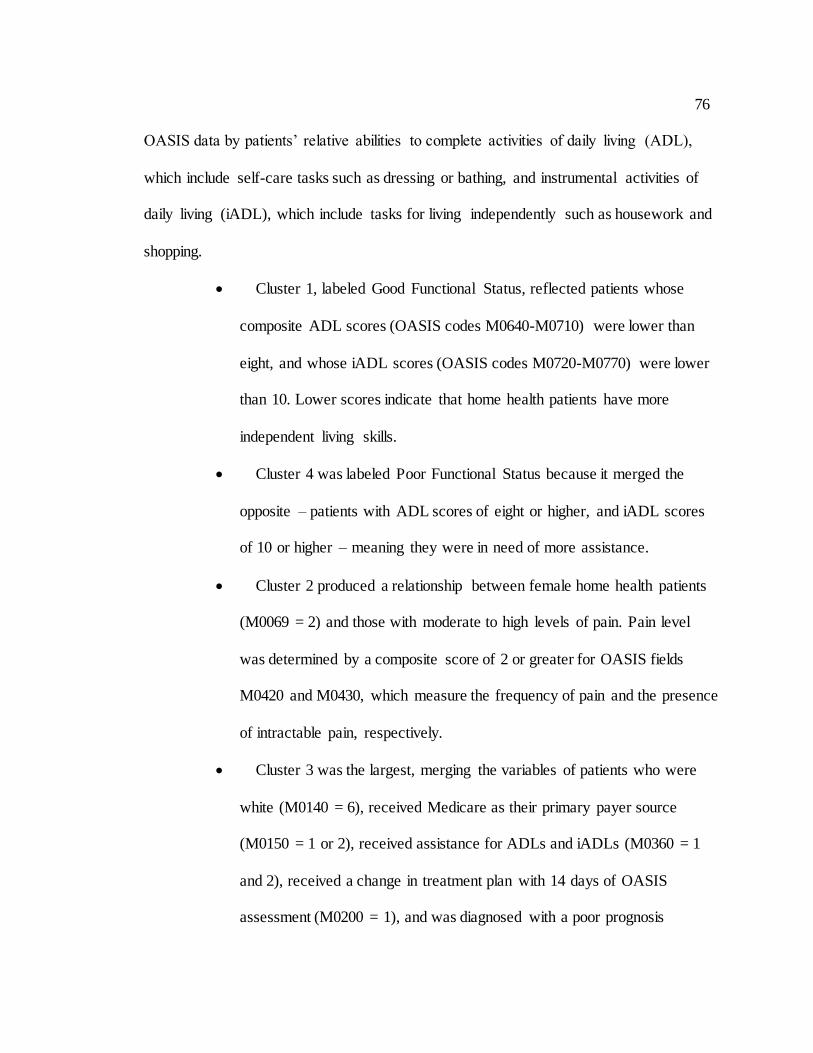
76
OASIS data by patients’ relative abilities to complete activities of daily living (ADL),
which include self-care tasks such as dressing or bathing, and instrumental activities of
daily living (iADL), which include tasks for living independently such as housework and
shopping.
Cluster 1, labeled Good Functional Status, reflected patients whose
composite ADL scores (OASIS codes M0640-M0710) were lower than
eight, and whose iADL scores (OASIS codes M0720-M0770) were lower
than 10. Lower scores indicate that home health patients have more
independent living skills.
Cluster 4 was labeled Poor Functional Status because it merged the
opposite – patients with ADL scores of eight or higher, and iADL scores
of 10 or higher – meaning they were in need of more assistance.
Cluster 2 produced a relationship between female home health patients
(M0069 = 2) and those with moderate to high levels of pain. Pain level
was determined by a composite score of 2 or greater for OASIS fields
M0420 and M0430, which measure the frequency of pain and the presence
of intractable pain, respectively.
Cluster 3 was the largest, merging the variables of patients who were
white (M0140 = 6), received Medicare as their primary payer source
(M0150 = 1 or 2), received assistance for ADLs and iADLs (M0360 = 1
and 2), received a change in treatment plan with 14 days of OASIS
assessment (M0200 = 1), and was diagnosed with a poor prognosis
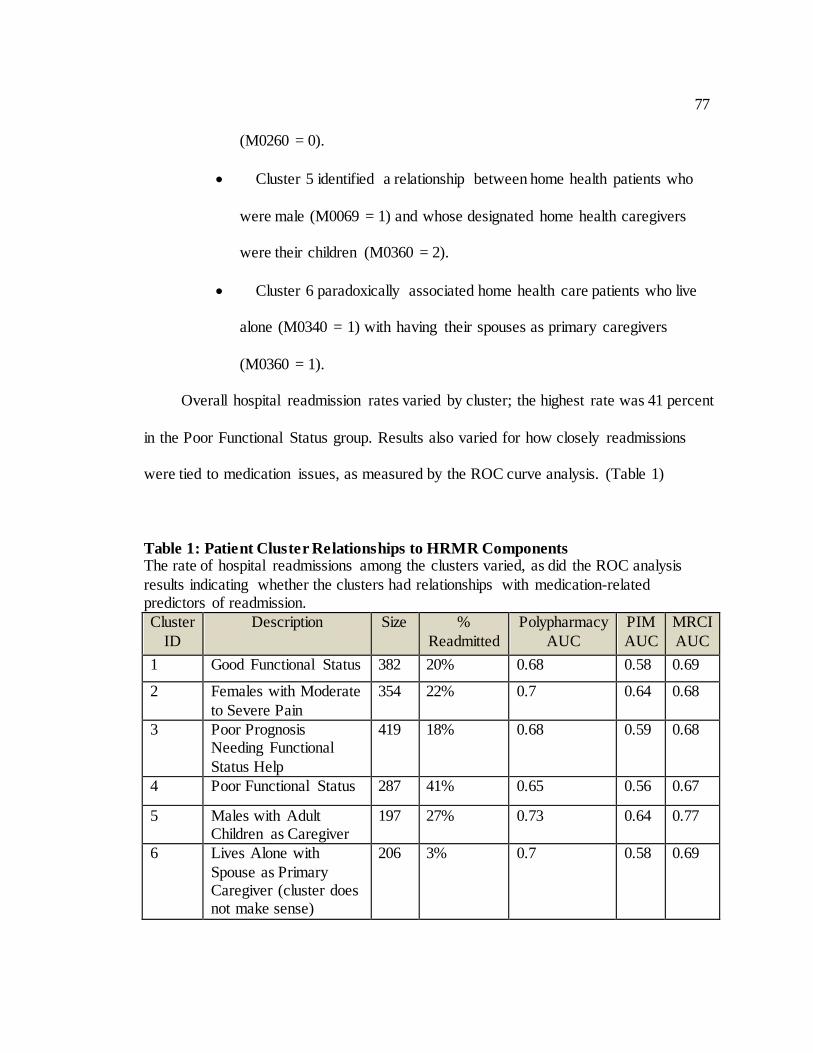
77
(M0260 = 0).
Cluster 5 identified a relationship between home health patients who
were male (M0069 = 1) and whose designated home health caregivers
were their children (M0360 = 2).
Cluster 6 paradoxically associated home health care patients who live
alone (M0340 = 1) with having their spouses as primary caregivers
(M0360 = 1).
Overall hospital readmission rates varied by cluster; the highest rate was 41 percent
in the Poor Functional Status group. Results also varied for how closely readmissions
were tied to medication issues, as measured by the ROC curve analysis. (Table 1)
Table 1: Patient Cluster Relationships to HRMR Components The rate of hospital readmissions among the clusters varied, as did the ROC analysis
results indicating whether the clusters had relationships with medication-related predictors of readmission.
Cluster
ID
Description Size %
Readmitted
Polypharmacy
AUC
PIM
AUC
MRCI
AUC
1 Good Functional Status 382 20% 0.68 0.58 0.69
2 Females with Moderate
to Severe Pain
354 22% 0.7 0.64 0.68
3 Poor Prognosis Needing Functional
Status Help
419 18% 0.68 0.59 0.68
4 Poor Functional Status 287 41% 0.65 0.56 0.67
5 Males with Adult Children as Caregiver
197 27% 0.73 0.64 0.77
6 Lives Alone with
Spouse as Primary Caregiver (cluster does not make sense)
206 3% 0.7 0.58 0.69
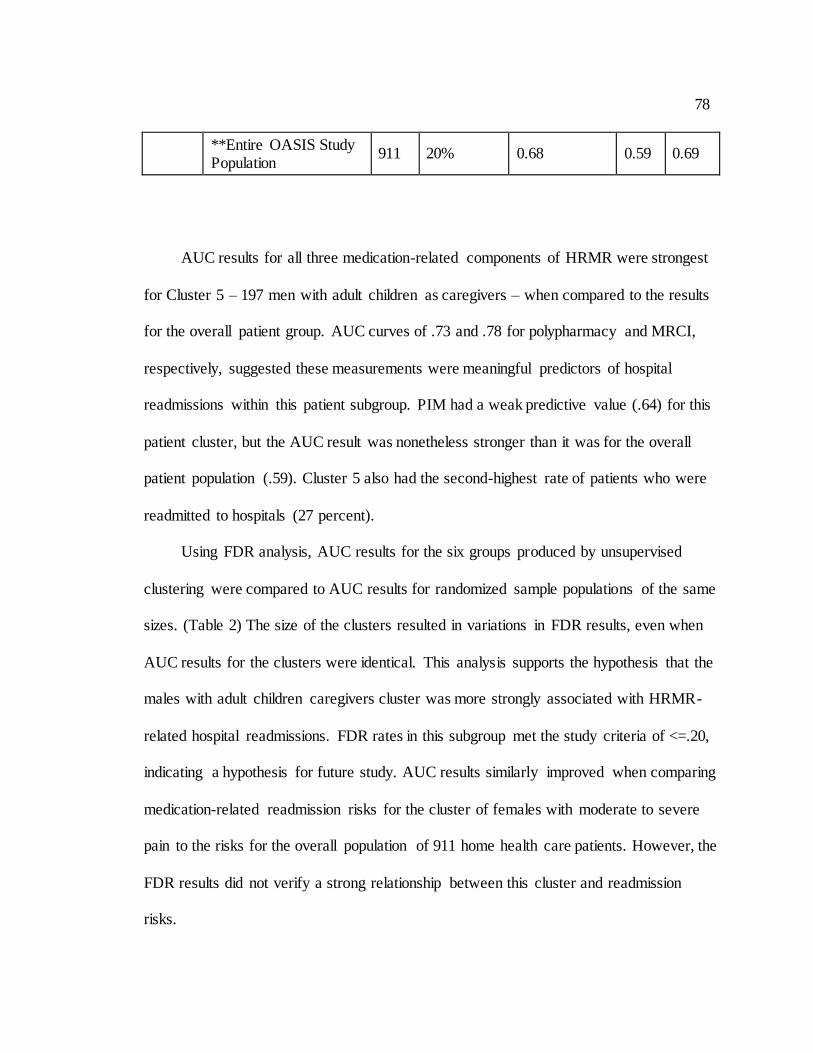
78
**Entire OASIS Study Population
911 20% 0.68 0.59 0.69
AUC results for all three medication-related components of HRMR were strongest
for Cluster 5 – 197 men with adult children as caregivers – when compared to the results
for the overall patient group. AUC curves of .73 and .78 for polypharmacy and MRCI,
respectively, suggested these measurements were meaningful predictors of hospital
readmissions within this patient subgroup. PIM had a weak predictive value (.64) for this
patient cluster, but the AUC result was nonetheless stronger than it was for the overall
patient population (.59). Cluster 5 also had the second-highest rate of patients who were
readmitted to hospitals (27 percent).
Using FDR analysis, AUC results for the six groups produced by unsupervised
clustering were compared to AUC results for randomized sample populations of the same
sizes. (Table 2) The size of the clusters resulted in variations in FDR results, even when
AUC results for the clusters were identical. This analysis supports the hypothesis that the
males with adult children caregivers cluster was more strongly associated with HRMR-
related hospital readmissions. FDR rates in this subgroup met the study criteria of <=.20,
indicating a hypothesis for future study. AUC results similarly improved when comparing
medication-related readmission risks for the cluster of females with moderate to severe
pain to the risks for the overall population of 911 home health care patients. However, the
FDR results did not verify a strong relationship between this cluster and readmission
risks.
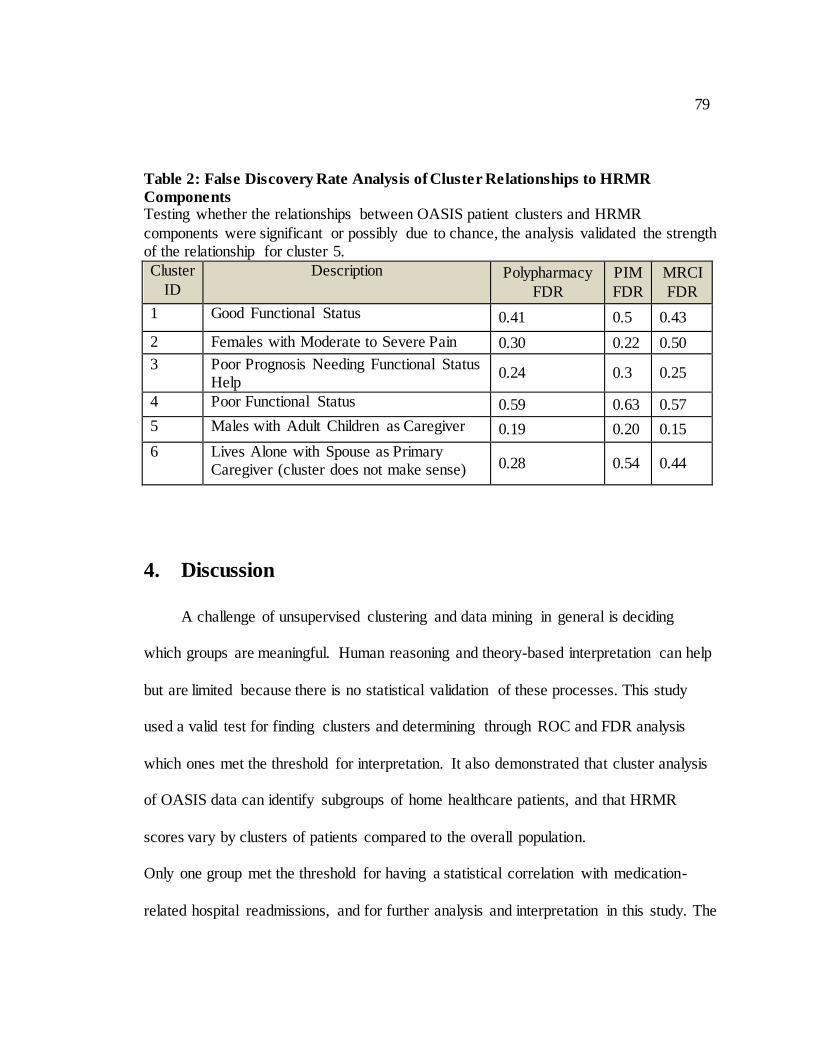
79
Table 2: False Discovery Rate Analysis of Cluster Relationships to HRMR
Components Testing whether the relationships between OASIS patient clusters and HRMR
components were significant or possibly due to chance, the analysis validated the strength of the relationship for cluster 5.
Cluster
ID
Description
Polypharmacy
FDR
PIM
FDR
MRCI
FDR
1 Good Functional Status 0.41 0.5 0.43
2 Females with Moderate to Severe Pain 0.30 0.22 0.50
3 Poor Prognosis Needing Functional Status Help
0.24 0.3 0.25
4 Poor Functional Status 0.59 0.63 0.57
5 Males with Adult Children as Caregiver 0.19 0.20 0.15
6 Lives Alone with Spouse as Primary Caregiver (cluster does not make sense) 0.28 0.54 0.44
4. Discussion
A challenge of unsupervised clustering and data mining in general is deciding
which groups are meaningful. Human reasoning and theory-based interpretation can help
but are limited because there is no statistical validation of these processes. This study
used a valid test for finding clusters and determining through ROC and FDR analysis
which ones met the threshold for interpretation. It also demonstrated that cluster analysis
of OASIS data can identify subgroups of home healthcare patients, and that HRMR
scores vary by clusters of patients compared to the overall population.
Only one group met the threshold for having a statistical correlation with medication-
related hospital readmissions, and for further analysis and interpretation in this study. The
80
finding that a medication-related hospital readmission risk might be greater among
elderly men with adult children as caregivers is novel, though other studies have found
broader relationships between informal caregivers and medication-related problems. For
example, changes or inconsistencies in the levels of care provided by informal caregivers,
including adult children caring for their parents, can lead to difficulties in complying with
prescription regimens and following complex dosing schedules and
instructions.(Gillespie, Mullan, & Harrison, 2013) Further, struggles with medication
compliance are linked with a high-percentage of medication-related visits to emergency
departments,(Orwig, Brandt, & Gruber-Baldini, 2006) and hospitalizations among elderly
adults whose assistance at home is insufficient.(Kuzuya et al., 2008)
There are several potential explanations for the relationship between HRMR scores
and rehospitalizations for elderly men receiving assistance from their children. Adult
children might find it difficult to manage medications for parents who want to maintain
their autonomy, or create confusion as part-time caregivers if they oversee parents’
medications on some days, but not others. The latter would seem especially relevant in an
era in which adult Baby Boomers do not view caring for their aging parents as a “natural”
responsibility or one they can easily manage amid their own parenting and
careers.(Guberman, Lavoie, Blein, & Olazabal, 2012) Caregiving situations in which
siblings are caring for parents could also confuse the roles and responsibilities of
medication management.
It is unclear whether informal caregiving itself is a cause of medication problems.
One study found overdoses or missed doses were more common among elderly people
81
receiving informal medication support at home, but didn’t determine whether this support
increased the risk of medication non-adherence or was merely associated with
it.(Thiruchselvam et al., 2012) Another study found informal caregiving to have a
positive relationship with adherence, as spouses or adult children helped people with
chronic obstructive pulmonary disease stick to medication regimens and potentially avoid
hospital readmissions.(Trivedi, Bryson, Udris, & Au, 2012)
Unsupervised clustering to identify patient groups by symptom combinations is
emerging in literature. (Lee et al., 2010; Lewandowski, Sperry, Cohen, & Ongur, 2014;
Moser et al., 2014; Wardenaar et al., 2014) Applying this approach specifically to OASIS
data to identify patient subgroups by their demographic and health status information was
novel, though not unprecedented.(Westra et al., 2011) The results suggested problems
among specific subgroups of patients and informal caregivers that either aren’t well-
studied in research literature or have been studied inconclusively. The role of gender in
medication issues such as non-adherence, for example, has been evaluated with varying
results.(Granger et al., 2009; Holt et al., 2013; Pasina et al., 2014)
Our results suggested promising targets for future research: (1) identifying
characteristics of adult children who are less reliable in helping their parents with
medication management, and (2) uncovering risk factors that make elderly fathers more
likely to experience medication-related hospital readmissions than mothers. More
targeted research could also address whether a cause-and-effect relationship exists
between family caregiving and an increased risk of medication-related hospital
readmissions. With at least 75 percent of long-term care provided by family caregivers –
82
at an estimated value of $375 billion in unpaid labor(Gibson & Houser, 2007) – there is a
great need to address their strengths and weaknesses and the dynamics of family
caregiving that could lead to medication problems and hospital readmissions.
4.1. Limitations
There are several limitations that should be considered in interpretation of this
study. FDR’s broad handling of false positives and error rates allow for the discovery of
associations that otherwise might go unseen. The FDR threshold in this study of .20 was
supported by literature, but nonetheless was a judgment made by the researchers.
Interpretations about medication management from a patient group in 2004 also need to
be considered in light of health care reforms in the subsequent decade, including federal
medication reconciliation requirements for hospitals to have electronic processes for
verifying the safety and accuracy of patients’ prescription regimens. OASIS data
interpretation could also affect the results of this study, as evidenced by the cluster of
people paradoxically listed in the data as living alone at home but receiving care from
spouses. More research using other methodologies is needed to verify the strength of the
results.
5. Conclusion
The unsupervised clustering combined with comparable literature results present an
intriguing hypothesis that elderly men receiving care at home from their adult children
are at elevated risk of medication-related hospital readmissions. The results also further
research into HRMRs and their potential use in clinical systems to identify patients at risk
83
for avoidable readmissions. Future research opportunities presented by this study include
exploration of the role of informal caregivers in managing or contributing to medication
adherence issues, and further evaluation of HRMR in a different patient population to
demonstrate its potential use as a clinical tool. More broadly, the success in one of the
first attempts to apply clustering to OASIS data suggests other researchers could use this
rich dataset to identify patterns in elderly patient care and health.

84
Discussion and Conclusion
85
1. Discussion
The three studies in this dissertation demonstrated that HRMR can be automated
and potentially developed into a clinical support tool to predict hospital readmissions and
identify patients who would benefit from support services that prevent readmissions. The
algorithm for calculating HRMR scores from patients’ medication data was
automated(Olson et al., 2014) and then optimized to improve its predictive accuracy and
enhance its clinical utility.(Olson et al., 2014) Clustering analysis then identified a patient
subgroup that had a greater HRMR-related risk for hospital readmission, presenting a
hypothesis for future study and contributing to the emerging field of data mining using
patient demographic and health care utilization databases.
1.1 Contributions to Informatics & Gaps in Literature
While increasing studies have individually investigated the concepts of
polypharmacy,(Abdulraheem, 2013; Arnet, Abraham, Messerli, & Hersberger, 2013;
Beloosesky et al., 2013; Hajjar et al., 2007; Morandi et al., 2013; Pasina et al., 2014;
Sehgal et al., 2013; Sganga et al., 2014) PIM, (Baldoni et al., 2013; Bao, Shao, Bishop,
Schackman, & Bruce, 2012; Fu et al., 2007; Price et al., 2014a; Price et al., 2014b;
Sehgal et al., 2013; Vieira de Lima et al., 2013; Weng et al., 2013; Zhan et al., 2001) and
MRCI(George et al., 2004; McDonald et al., 2013; Schoonover, 2011; Willson et al.,
2014; Wimmer et al., 2014), there has been no focus in published literature on the
combination of these three drug-related indicators since an original HRMR study showed
that these concepts together identify home health care patients who are at elevated risk of
86
hospital readmissions.(Dierich, 2010) All three studies produced as part of this
dissertation are novel and address gaps in the health care literature in that they focus on
this untested concept of the HRMR. The first study demonstrated that the manual concept
of calculating HRMR could be automated, the second fine-tuned the underlying criteria
for HRMR to optimize its predictive relationship with hospital readmissions, and the
third used clustering techniques to examine subgroups in the sample population most
susceptible to medication-related readmission risks. Beyond the results, the methods used
to achieve them also contributed to the field of informatics by demonstrating their
effectiveness as research tools.
The first study converted medication data into common RxNorm terminology,
using crosswalks generated by APIs available on the National Library of Medicine web
site, and was a key step in the proof of concept for HRMRs. The heterogeneous nature of
medication records and prescription systems is a barrier to research and clinical analysis
across health care systems.(Richesson, 2014) The standardization with RxNorm, which is
considered “ideal” for such purposes,(Richesson et al., 2010) expedited the conversion of
drug data into HRMR scores. This conversion made it possible for this novel approach of
assessing readmission risks to be replicated by other clinicians or researchers. The APIs
and crosswalks also allow researchers and clinicians to adapt and adjust the HRMR
algorithm for future analysis and research.
However, while the conversion was ultimately successful, only 82 percent of the
drug names were converted to RXCUI values without any manipulation of the data set
that was used.(Olson et al., 2014) Conversion of 99 percent of the drug names required
87
some manual manipulation of the drug data due to misspellings or confusion over multi-
ingredient drugs. Analysis of drug data will be greatly enhanced and expedited by the
continued adaptation of medication standards in EHR by hospitals and health systems.
The second study optimized the automated algorithm by using ROC curve analysis
to test modified HRMR criteria against the original criteria used by Dierich.(Dierich,
2010) The original manual HRMR study was based on clinical judgments, so the
automation of the data presented an opportunity to test those judgments and determine if
adjustments to HRMR scoring could improve the prediction of readmission risks. This
further enhanced the clinical utility of the algorithm by improving its sensitivity to
hospital readmission risks. The primary change from the optimization was the exclusion
of vitamins and supplements for polypharmacy counts.(Olson et al., 2014) Other tests,
such as removing acetaminophen from the algorithm, did not improve the ROC results.
Widespread variations exist in the polypharmacy cut point used in previous
studies(Hajjar et al., 2007) to distinguish patients with a low number of drugs versus
those with a high number of drugs that puts them at risk for problems such as
readmissions. This current study verified a cut point of 9 drugs as most effective in
distinguishing patients’ hospital readmission risks. It also supported previous studies
showing little to no correlation between readmissions and PIM medications
alone.(Borenstein et al., 2013; Sehgal et al., 2013) The lack of any such connection is
surprising, as it would seem intuitive that any elderly patients with drugs known to be
risky would be at risk for complications that would require their returns to hospital care.
The original MRCI criteria (George et al., 2004) from George et al. proved optimal for
88
predicting patients’ readmission risks, though adjustments based on an odds ratio analysis
did modestly improve the predictive strength of Table C (drugs with special instructions).
However, the MRCI cut point for separating patients by their readmission risk was
increased to 33 from the original cut point of 20 used in the initial HRMR study.(Olson et
al., 2014) Cut points produced by the analysis of the automated data could prove
instructive as future researchers use these drug-related measurements.
The focus of the third study was on identifying patient subgroups that could
potentially benefit from the clinical utility of the HRMR model. In theory, an EHR could
identify patients by their characteristics – such as elderly males with adult child as
caregivers – and flag clinicians of potential readmission risks. The results from the
unsupervised clustering also offered a hypothesis that contributed to the literature
showing the challenges of adult children and other informal caregivers caring for the
elderly and managing their medications.(Gillespie et al., 2013; Kuzuya et al., 2008;
Thiruchselvam et al., 2012) The results contributed to the evidence base for clinicians,
who could discuss the potential for medication problems with informal caregivers and
also consider this subgroup of elderly males with adult children as caregivers as
candidates for additional support and home health services. The paper also reflects the
novel and successful use of clustering to identify these patient groups within OASIS data.
This rich dataset for home health patients could now be attractive to other researchers
seeking to identify subgroups of patients by the demographics or health care utilization
status.
2. Limitations
89
While providing proof of concept for HRMR and its potential utility as a clinical
support tool, these studies could only go as far as one relatively small data set could carry
them. The conversion of drug data into RxNorm terminology was necessitated by the
older and somewhat crude methods of recording medication data. The data set lacked
clear information about the 911 patients’ diagnoses. Authors reconstructed the most
likely diagnoses of the patients based on the indications of the medications they were
taking. While diagnoses were only relevant in analysis of PIM medications – to
differentiate whether patients were taking drugs that had side effects related to certain
conditions – the authors’ interpretations could have led to some errors in the results.
Lastly, the lack of standards for special instructions and dose frequency resulted in
limited automation from informatics coding standards to compute MRCI values.
Finally, the connection established between HRMR readmission risks and elderly
patients with adult children as caregivers was validated using an FDR statistical method
that is more liberal and is intended for the purpose of hypothesis generation. While there
was research literature to suggest the connection was plausible, additional analysis is
needed to prove it.
3. Future Implications
The increasing adoption of EHRs – expedited in the last few years by government
grants and mandates – has created new datasets and opportunities to analyze patient care
trends and predict what types of patients are most likely to experience complications or
adverse events. Research has grown rapidly in the area of analyzing secondary EHR data
for patient care such as predicting the diagnosis of depression by mining diagnosis and
90
medication and clinical progress notes,(Huang et al., 2014) or earlier identification of
heart failure patients through mining of signs and systems documented on encounter
notes.(Vijayakrishnan et al., 2014) Analysis of patient medication data has been
expedited by RxNorm, which is viewed as “ideal” for standardizing prescription
data,(Richesson et al., 2010) and was used successfully to convert non-standardized
medication records for the calculation of HRMR scores.(Olson et al., 2014) RxNorm is
being adopted directly by EHRs to support live recording of patients’ medication
histories(Bennett, 2012). This presents opportunities for rapid calculation of patient
HRMR scores and other medication metrics using EHR systems without any prior
“normalization” of the medication data they contain. The construction of the HRMR
model, and the ability to automate its calculation, present further opportunities for
research, particularly with different patient populations and datasets to demonstrate the
potential of HRMR as a clinical tool. Those opportunities include:
Larger and more recent OASIS and medication datasets. The original HRMR
automation study was based on a home health care population of 911 patients.
The tools and techniques, such as utilizing RxNorm APIs with SAS
implementation, need to be tested on a larger dataset to determine if they remain
efficient and effective at preparing medication data for analysis. Analyzing a
larger patient population is also important to verify whether the relationship
between HRMRs and hospital readmissions exists beyond the one population in
the original study. The finding that a cluster of men with adult children as
caregivers was more susceptible to medication-related readmission risks also
91
could be verified. And perhaps new clusters of clinically relevant home health
care populations could emerge from data mining of a larger OASIS dataset.
Other clinical EHR datasets. While OASIS is valuable for the clinical and
demographic information it contains, it is limited to the population of home
healthcare patients. As EHR datasets become more robust and formatted for
secondary research, the opportunity arises to test the predictive power of HRMR
on a broader range of ages and demographics. Testing the automated HRMR
algorithm on a broader population is important, because it is possible that HRMR
only has a predictive quality for hospital readmissions in the home health care or
elderly population. It is also possible that the cut points for the HRMR
components such as polypharmacy (the number of drugs that separate patients by
their risk levels) will be different in a broader population. As a result, HRMR
might be clinically useful but will need to be adjusted based on demographic
factors to assess hospital readmission risks. And just as data mining found a
unique subgroup of patients within an OASIS dataset, this same clustering
research might identify high-risk groups within the broader population. Studies,
for example, already point to medication adherence and mental illness as
indicators of readmission.(Haddad, Brain, & Scott, 2014) Other variables that
might be analyzed within an EHR dataset include social history (tobacco use,
illegal drug use, sexual activity, etc.), vitals (height, weight, BMI, blood
pressure), allergies, immunizations, orders (lab, radiology, etc.) and problem lists.
EHRs are currently used to flag clinicians when patients appear at risk of
92
depression and heart failure; it is certainly possible that HRMR tracking could be
integrated into these systems to similarly flag clinicians about patients with
medication-related risks for hospital readmissions.
Medical and Pharmacy Claims data. Similarly, follow-up studies could explore
whether claims databases could efficiently and effectively yield HRMR scores of
patients. The size of public or private insurance claims databases – spanning
across health care providers and systems – could help provide important
validation for the relationship between HRMR and hospital readmission risk.
Claims databases could also expand the analysis of HRMRs to determine whether
they are more likely among patients with higher personal costs of care, or among
patients with different types of health insurance (HMO, PPO, etc.) They could
also allow for comparisons in terms of the net cost of patients – comparing those
who meet the threshold for HRMRs and those who do not. Given that patients
with high risk medication regimens are more likely to be rehospitalized, it would
seem possible that they would cost more than patients with lower medication
usage who don’t meet that threshold. Applying the automated HRMR calculations
to claims databases could prove or disprove that assumption.
4. Conclusion
Applying the automated algorithm to diverse datasets is crucial to validating and
optimizing the clinical utility of HRMR calculations, and to identifying the types of
patients for whom HRMR is a more meaningful predictor of hospital readmissions. The
overall goal of the study demonstrated that HRMR can be automated as a clinical support
93
tool to enhance patient care – and demonstrates ripple effects that point to new directions
for research.
A valid, automated method for deriving HRMR scores from EHRs could compel
other researchers to use the method and to further evaluate using these scores as clinical
tools. Secondary analysis has the potential – as revealed by the third study – to uncover
multiple relationships between patients’ HRMR scores and their health outcomes as
measured by the OASIS and EHR data. The clustering analysis offered new targets for
researchers to explore further in their efforts to understand the linked roles of medication,
medical interventions and the health and outcomes.
94
References
Abdulraheem, I. (2013). Polypharmacy: A risk factor for geriatric syndrome, morbidity &
mortality. Journal of Aging Science, 1(e103) doi:10.4172/2329-8847.1000e103
Abelson, R. (2013, March 29, 2013). Hospitals questioning fairness of medicare rules on
readmissions. New York Times, pp. 1.
Adler-Milstein, J., DesRoches, C. M., Furukawa, M. F., Worzala, C., Charles, D.,
Kralovec, P., . . . Jha, A. K. (2014). More than half of US hospitals have at least A
basic EHR, but stage 2 criteria remain challenging for most. Health Affairs (Project
Hope), 33(9), 1664-1671. doi:10.1377/hlthaff.2014.0453 [doi]
Agency for Healthcare Research and Quality. (2012). Patient safety primers: Medication
reconciliation. Retrieved from http://psnet.ahrq.gov/primer.aspx?primerID=1
Akyuz, A., Alpsoy, S., Akkoyun, D. C., Degirmenci, H., & Guler, N. (2014). Heart rate
recovery may predict the presence of coronary artery disease. Anadolu Kardiyoloji
Dergisi : AKD = the Anatolian Journal of Cardiology, 14(4), 351-356.
doi:10.5152/akd.2014.4824 [doi]
Allegranzi, B. (2011). Report on the burden of endemic health care-associated infection
worldwide. (A systematic review of the literature). Geneva: World Health
Organization.
95
American Geriatrics Society 2012 Beers Criteria Update Expert Panel. (2012). American
geriatrics society updated beers criteria for potentially inappropriate medication use
in older adults. Journal of the American Geriatrics Society, 60(4), 616-631.
doi:10.1111/j.1532-5415.2012.03923.x; 10.1111/j.1532-5415.2012.03923.x
Anderegg, S. V., Wilkinson, S. T., Couldry, R. J., Grauer, D. W., & Howser, E. (2014).
Effects of a hospitalwide pharmacy practice model change on readmission and return
to emergency department rates. American Journal of Health-System Pharmacy :
AJHP : Official Journal of the American Society of Health-System Pharmacists,
71(17), 1469-1479. doi:10.2146/ajhp130686 [doi]
Arnet, I., Abraham, I., Messerli, M., & Hersberger, K. E. (2013). A method for
calculating adherence to polypharmacy from dispensing data records. International
Journal of Clinical Pharmacy, 36(1), 192-201. doi:10.1007/s11096-013-9891-8
Baldoni, A. D., Ayres, L. R., Martinez, E. Z., Dewulf, N. D., Dos Santos, V., & Pereira,
L. R. (2013). Factors associated with potentially inappropriate medications use by
the elderly according to beers criteria 2003 and 2012. International Journal of
Clinical Pharmacy, 36(2), 316-324. doi:10.1007/s11096-013-9880-y
Bao, Y., Shao, H., Bishop, T. F., Schackman, B. R., & Bruce, M. L. (2012). Inappropriate
medication in a national sample of US elderly patients receiving home health care.
Journal of General Internal Medicine, 27(3), 304-310. doi:10.1007/s11606-011-
1905-4; 10.1007/s11606-011-1905-4
96
Beloosesky, Y., Nenaydenko, O., Gross Nevo, R. F., Adunsky, A., & Weiss, A. (2013).
Rates, variability, and associated factors of polypharmacy in nursing home patients.
Clinical Interventions in Aging, 8, 1585-1590. doi:10.2147/CIA.S52698;
10.2147/CIA.S52698
Bennett, C. C. (2012). Utilizing RxNorm to support practical computing applications:
Capturing medication history in live electronic health records. Journal of Biomedical
Informatics, 45(4), 634-641. doi:10.1016/j.jbi.2012.02.011 [doi]
Berry, D., Costanzo, D. M., Elliott, B., Miller, A., Miller, J. L., Quackenbush, P., & Su,
Y. P. (2011). Preventing avoidable hospitalizations. Home Healthcare Nurse, 29(9),
540-549. doi:10.1097/NHH.0b013e31822eb972 [doi]
Blei, D. (2008). Hierarchical clustering. Retrieved from
http://www.cs.princeton.edu/courses/archive/spr08/cos424/slides/clustering-2.pdf
Bonnet-Zamponi, D., d'Arailh, L., Konrat, C., Delpierre, S., Lieberherr, D., Lemaire, A., .
. . Legrain, S. (2013). Drug-related readmissions to medical units of older adults
discharged from acute geriatric units: Results of the optimization of Medication in
AGEd multicenter randomized controlled trial. Journal of the American Geriatrics
Society, 61(1), 113. doi:10.1111/jgs.12037
Borenstein, J., Aronow, H. U., Bolton, L. B., Choi, J., Bresee, C., & Braunstein, G. D.
(2013). Early recognition of risk factors for adverse outcomes during hospitalization
97
among medicare patients: A prospective cohort study. BMC Geriatrics, 13, 72.
doi:10.1186/1471-2318-13-72; 10.1186/1471-2318-13-72
Cardoso, L. G., & Chiavone, P. A. (2013). The APACHE II measured on patients'
discharge from the intensive care unit in the prediction of mortality. Revista Latino-
Americana De Enfermagem, 21(3), 811-819. doi:10.1590/S0104-
11692013000300022; 10.1590/S0104-11692013000300022
Centers for Disease Control and Prevention (CDC). (2012). Adults and older adult
adverse drug event. Retrieved from
http://www.cdc.gov/MedicationSafety/Adult_AdverseDrugEvents.html
Centers for Medicare and Medicaid Services (CMS). (2012a). Data set. Retrieved from
http://www.cms.gov/Medicare/Quality-Initiatives-Patient-Assessment-
Instruments/OASIS/DataSet.html
Centers for Medicare and Medicaid Services (CMS). (2012b). Outcome and assessment
information set (OASIS). Retrieved from https://www.cms.gov/Medicare/Quality-
Initiatives-Patient-Assessment-
Instruments/OASIS/index.html?redirect=/OASIS/046_DataSet.asp#TopOfPage
Charchar, F. J., Bloomer, L. D., Barnes, T. A., Cowley, M. J., Nelson, C. P., Wang, Y., . .
. Tomaszewski, M. (2012). Inheritance of coronary artery disease in men: An
98
analysis of the role of the Y chromosome. Lancet, 379(9819), 915-922.
doi:10.1016/S0140-6736(11)61453-0 [doi]
Charlson, M., Szatrowski, T. P., Peterson, J., & Gold, J. (1994). Validation of a combined
comorbidity index. Journal of Clinical Epidemiology, 47(11), 1245-1251.
Charlson, M. E., Pompei, P., Ales, K. L., & MacKenzie, C. R. (1987). A new method of
classifying prognostic comorbidity in longitudinal studies: Development and
validation. Journal of Chronic Diseases, 40(5), 373-383.
Cheung, M. R. (2014). Optimization of predictors of ewing sarcoma cause-specific
survival: A population study. Asian Pacific Journal of Cancer Prevention : APJCP,
15(10), 4143-4145.
Deleger, L., Brodzinski, H., Zhai, H., Li, Q., Lingren, T., Kirkendall, E. S., . . . Solti, I.
(2013). Developing and evaluating an automated appendicitis risk stratification
algorithm for pediatric patients in the emergency department. Journal of the
American Medical Informatics Association : JAMIA, 20(e2), e212-20.
doi:10.1136/amiajnl-2013-001962; 10.1136/amiajnl-2013-001962
Dey, S., Cooner, J., Delaney, C., Fakhoury, J., Kumar, V., Simon, G., & ... Westra,
B.Data mining to predict mobility outcomes in home health care. Unpublished
manuscript.
99
Dierich, M. (2010). High risk medication regimens and medication related predictors of
hospital readmission in elderly home care patients. (Doctor of Philosophy,
University of Minnesota). , 337p.
(http://conservancy.umn.edu/bitstream/117611/1/Dierich_umn_0130E_11585.pdf)
Donze, J., Aujesky, D., Williams, D., & Schnipper, J. L. (2013). Potentially avoidable 30-
day hospital readmissions in medical patients: Derivation and validation of a
prediction model. JAMA Internal Medicine, 173(8), 632-638.
doi:10.1001/jamainternmed.2013.3023; 10.1001/jamainternmed.2013.3023
Donze, J., Lipsitz, S., Bates, D. W., & Schnipper, J. L. (2013). Causes and patterns of
readmissions in patients with common comorbidities: Retrospective cohort study.
BMJ (Clinical Research Ed.), 347, f7171. doi:10.1136/bmj.f7171 [doi]
Fera, T., Anderson, C., Kanel, K. T., & Ramusivich, D. L. (2014). Role of a care
transition pharmacist in a primary care resource center. American Journal of Health-
System Pharmacy : AJHP : Official Journal of the American Society of Health-
System Pharmacists, 71(18), 1585-1590. doi:10.2146/ajhp130684 [doi]
Fick, D., Cooper, J., Wade, W., Waller, J., Maclean, J. R., & Beers, M. (2003). Updating
the beers criteria for potentially inappropriate medication use in older adults: Results
of a US consensus panel of experts. Archives of Internal Medicine, 163(22), 2716-
2724. doi:10.1001/archinte.163.22.2716
100
Florkowski, C. M. (2008). Sensitivity, specificity, receiver-operating characteristic
(ROC) curves and likelihood ratios: Communicating the performance of diagnostic
tests. The Clinical Biochemist.Reviews / Australian Association of Clinical
Biochemists, 29 Suppl 1, S83-7.
Freund, T., Campbell, S. M., Geissler, S., Kunz, C. U., Mahler, C., Peters-Klimm, F., &
Szecsenyi, J. (2013). Strategies for reducing potentially avoidable hospitalizations
for ambulatory care-sensitive conditions. Annals of Family Medicine, 11(4), 363-
370. doi:10.1370/afm.1498; 10.1370/afm.1498
Fu, A. Z., Jiang, J. Z., Reeves, J. H., Fincham, J. E., Liu, G. G., & Perri, M.,3rd. (2007).
Potentially inappropriate medication use and healthcare expenditures in the US
community-dwelling elderly. Medical Care, 45(5), 472-476.
doi:10.1097/01.mlr.0000254571.05722.34
Genovese, C. (2004). A tutorial on false discovery control. Retrieved from
http://www.stat.cmu.edu/~genovese/talks/hannover1-04.pdf
George, J., Phun, Y. T., Bailey, M. J., Kong, D., & Stewart, K. (2004). Development and
validation of the medication regimen complexity index. The Annals of
Pharmacotherapy, 38(9), 1369-1376. doi:10.1345/aph.1D479
101
Gibson, M. J., & Houser, A. (2007). Valuing the invaluable: A new look at the economic
value of family caregiving. Issue Brief (Public Policy Institute (American
Association of Retired Persons)), (IB82)(IB82), 1-12.
Gillespie, R., Mullan, J., & Harrison, L. (2013). Managing medications: The role of
informal caregivers of older adults and people living with dementia. A review of the
literature. Journal of Clinical Nursing, (Epub ahead of print)
doi:10.1111/jocn.12519; 10.1111/jocn.12519
Granger, B. B., Ekman, I., Granger, C. B., Ostergren, J., Olofsson, B., Michelson, E., . . .
Swedberg, K. (2009). Adherence to medication according to sex and age in the
CHARM programme. European Journal of Heart Failure, 11(11), 1092-1098.
doi:10.1093/eurjhf/hfp142 [doi]
Greiner, M., Pfeiffer, D., & Smith, R. D. (2000). Principles and practical application of
the receiver-operating characteristic analysis for diagnostic tests. Preventive
Veterinary Medicine, 45(1-2), 23-41. doi:S0167-5877(00)00115-X [pii]
Guberman, N., Lavoie, J. P., Blein, L., & Olazabal, I. (2012). Baby boom caregivers:
Care in the age of individualization. The Gerontologist, 52(2), 210-218.
doi:10.1093/geront/gnr140; 10.1093/geront/gnr140
102
Haddad, P. M., Brain, C., & Scott, J. (2014). Nonadherence with antipsychotic
medication in schizophrenia: Challenges and management strategies. Patient Related
Outcome Measures, 5, 43-62. doi:10.2147/PROM.S42735 [doi]
Hajian-Tilaki, K. (2013). Receiver operating characteristic (ROC) curve analysis for
medical diagnostic test evaluation. Caspian Journal of Internal Medicine, 4(2), 627-
635.
Hajjar, E. R., Cafiero, A. C., & Hanlon, J. T. (2007). Polypharmacy in elderly patients.
The American Journal of Geriatric Pharmacotherapy, 5(4), 345-351.
doi:10.1016/j.amjopharm.2007.12.002; 10.1016/j.amjopharm.2007.12.002
Harhay, M., Lin, E., Pai, A., Harhay, M. O., Huverserian, A., Mussell, A., . . . Reese, P.
P. (2013). Early rehospitalization after kidney transplantation: Assessing
preventability and prognosis. American Journal of Transplantation : Official Journal
of the American Society of Transplantation and the American Society of Transplant
Surgeons, 13(12), 3164-3172. doi:10.1111/ajt.12513; 10.1111/ajt.12513
HealthEast Care System. (2010). HealthEast wins innovation award. Retrieved from
http://www.marketwired.com/press-release/HealthEast-Care-System-Wins-
Innovation-Year-Patient-Care-Award-2010-From-Minnesota-Hospital-1262949.htm
Heisey-Grove, D., Danehy, L. N., Consolazio, M., Lynch, K., & Mostashari, F. (2014). A
national study of challenges to electronic health record adoption and meaningful use.
103
Medical Care, 52(2), 144-148. doi:10.1097/MLR.0000000000000038;
10.1097/MLR.0000000000000038
Heng, E. L., Bolger, A. P., Kempny, A., Davlouros, P., Davidson, S., Gatzoulis, M. A., &
Babu-Narayan, S. V. (2014). 46 serum BNP and clinical outcomes prediction in
tetralogy of fallot: A prospective analysis. Heart (British Cardiac Society),
100(Suppl 3), A25-A26. doi:10.1136/heartjnl-2014-306118.46 [doi]
Hiersch, L., Yogev, Y., Domniz, N., Meizner, I., Bardin, R., & Melamed, N. (2014). The
role of cervical length in women with threatened preterm labor - is it a valid
predictor at any gestational age? American Journal of Obstetrics and Gynecology,
(Epub ahead of print) doi:S0002-9378(14)00561-4 [pii]
Holt, E., Joyce, C., Dornelles, A., Morisky, D., Webber, L. S., Muntner, P., & Krousel-
Wood, M. (2013). Sex differences in barriers to antihypertensive medication
adherence: Findings from the cohort study of medication adherence among older
adults. Journal of the American Geriatrics Society, 61(4), 558-564.
doi:10.1111/jgs.12171 [doi]
Huang, S. H., LePendu, P., Iyer, S. V., Tai-Seale, M., Carrell, D., & Shah, N. H. (2014).
Toward personalizing treatment for depression: Predicting diagnosis and severity.
Journal of the American Medical Informatics Association : JAMIA, (Epub ahead of
print) doi:amiajnl-2014-002733 [pii]
104
Hung, W. W., Ross, J. S., Boockvar, K. S., & Siu, A. L. (2011). Recent trends in chronic
disease, impairment and disability among older adults in the united states. BMC
Geriatrics, 11, 47. doi:10.1186/1471-2318-11-47; 10.1186/1471-2318-11-47
Hunter, T., Nelson, J. R., & Birmingham, J. (2013). Preventing readmissions through
comprehensive discharge planning. Professional Case Management, 18(2), 56-63;
quiz 64-5. doi:10.1097/NCM.0b013e31827de1ce [doi]
Inouye, S. K., Schlesinger, M. J., & Lydon, T. J. (1999). Delirium: A symptom of how
hospital care is failing older persons and a window to improve quality of hospital
care. The American Journal of Medicine, 106(5), 565-573. doi:10.1016/S0002-
9343(99)00070-4
Jencks, S., Williams, M., & Coleman, E. (2009). Rehospitalizations among patients in the
medicare fee-for-service program. The New England Journal of Medicine, 360(14),
1418-1428. doi:10.1056/NEJMsa0803563
Kansagara, D., Englander, H., Salanitro, A., Kagen, D., Theobald, C., Freeman, M., &
Kripalani, S. (2011). Risk prediction models for hospital readmission: A systematic
review. JAMA: The Journal of the American Medical Association, 306(15), 1688-
1698. doi:10.1001/jama.2011.1515
Kaufman, D. W., Kelly, J. P., Rosenberg, L., Anderson, T. E., & Mitchell, A. A. (2002).
Recent patterns of medication use in the ambulatory adult population of the united
105
states: The slone survey. JAMA : The Journal of the American Medical Association,
287(3), 337-344.
Kirkham, H. S., Clark, B. L., Paynter, J., Lewis, G. H., & Duncan, I. (2014). The effect of
a collaborative pharmacist-hospital care transition program on the likelihood of 30-
day readmission. American Journal of Health-System Pharmacy : AJHP : Official
Journal of the American Society of Health-System Pharmacists, 71(9), 739-745.
doi:10.2146/ajhp130457 [doi]
Kripalani, S., Theobald, C. N., Anctil, B., & Vasilevskis, E. E. (2013). Reducing hospital
readmission rates: Current strategies and future directions. Annual Review of
Medicine, 65, 471-485. doi:10.1146/annurev-med-022613-090415
Kuzuya, M., Hirakawa, Y., Suzuki, Y., Iwata, M., Enoki, H., Hasegawa, J., & Iguchi, A.
(2008). Association between unmet needs for medication support and all-cause
hospitalization in community-dwelling disabled elderly people. Journal of the
American Geriatrics Society, 56(5), 881-886. doi:10.1111/j.1532-
5415.2008.01676.x; 10.1111/j.1532-5415.2008.01676.x
Lee, K. S., Song, E. K., Lennie, T. A., Frazier, S. K., Chung, M. L., Heo, S., . . . Moser,
D. K. (2010). Symptom clusters in men and women with heart failure and their
impact on cardiac event-free survival. The Journal of Cardiovascular Nursing,
25(4), 263-272. doi:10.1097/JCN.0b013e3181cfbb88 [doi]
106
Leise, M. D., Poterucha, J. J., & Talwalkar, J. A. (2014). Drug-induced liver injury. Mayo
Clinic Proceedings, 89(1), 95-106. doi:10.1016/j.mayocp.2013.09.016;
10.1016/j.mayocp.2013.09.016
Lewandowski, K. E., Sperry, S. H., Cohen, B. M., & Ongur, D. (2014). Cognitive
variability in psychotic disorders: A cross-diagnostic cluster analysis. Psychological
Medicine, , 1-10. doi:S0033291714000774 [pii]
Librero, J., Peiro, S., & Ordinana, R. (1999). Chronic comorbidity and outcomes of
hospital care: Length of stay, mortality, and readmission at 30 and 365 days. Journal
of Clinical Epidemiology, 52(3), 171-179. doi:S0895-4356(98)00160-7 [pii]
Malik, N., Banning, A., & Gershlick, A. (2014). 69 development and validation of a stent
thrombosis risk scoring system. Heart (British Cardiac Society), 100(Suppl 3), A39-
A40. doi:10.1136/heartjnl-2014-306118.69 [doi]
Manning, C., Raghavan, P., & Schutze, H. (2009). Hierarchical clustering. An
introduction to information retrieval (2009th ed., pp. 377) Cambridge University
Press.
Mansur, N., Weiss, A., & Beloosesky, Y. (2008). Relationship of in-hospital medication
modifications of elderly patients to postdischarge medications, adherence, and
mortality. The Annals of Pharmacotherapy, 42(6), 783. doi:10.1345/aph.1L070
107
Markley, J., Sabharwal, K., Wang, Z., Bigbee, C., & Whitmire, L. (2012). A community-
wide quality improvement project on patient care transitions reduces 30-day hospital
readmissions from home health agencies. Home Healthcare Nurse, 30(3), E1-E11.
doi:10.1097/NHH.0b013e318246d540 [doi]
McDonald, M., Peng, T., Sridharan, S., Foust, J., Kogan, P., Pezzin, L., & Feldman, P.
(2013). Automating the medication regimen complexity index. Journal of the
American Medical Informatics Association, 20(3), 499-505. doi:10.1136/amiajnl-
2012-001272
Milligan, G. W. (1980). An examination of the effect of six types of error perturbation on
fifteen clustering algorithms. Psychometrika, 45(3), 325. doi:10.1007/BF02293907
Morandi, A., Bellelli, G., Vasilevskis, E. E., Turco, R., Guerini, F., Torpilliesi, T., . . .
Trabucchi, M. (2013). Predictors of rehospitalization among elderly patients
admitted to a rehabilitation hospital: The role of polypharmacy, functional status,
and length of stay. Journal of the American Medical Directors Association, 14(10),
761-767. doi:10.1016/j.jamda.2013.03.013; 10.1016/j.jamda.2013.03.013
Morrissey, E. F., Morrissey, J., McElnay, M., Scott, B., & McConnell. (2003). Influence
of drugs, demographics and medical history on hospital readmission of elderly
patients. Clinical Drug Investigation, 23(2), 119-128. doi:10.2165/00044011-
200323020-00005
108
Moser, D. K., Lee, K. S., Wu, J. R., Mudd-Martin, G., Jaarsma, T., Huang, T. Y., . . .
Riegel, B. (2014). Identification of symptom clusters among patients with heart
failure: An international observational study. International Journal of Nursing
Studies, 51(10), 1366-1372. doi:S0020-7489(14)00031-5 [pii]
Mursu, J., Robien, K., Harnack, L. J., Park, K., & Jacobs, D. R.,Jr. (2011). Dietary
supplements and mortality rate in older women: The iowa women's health study.
Archives of Internal Medicine, 171(18), 1625-1633.
doi:10.1001/archinternmed.2011.445; 10.1001/archinternmed.2011.445
National Library of Medicine. (2012). RxNorm API. Retrieved from
http://rxnav.nlm.nih.gov/RxNormAPIs.html#
National Library of Medicine. (2013). RxNorm overview. Retrieved from
http://www.nlm.nih.gov/research/umls/rxnorm/overview.html
National Quality Forum. (2010a). Preventing hospital readmissions: A $25 billion
opportunity. Retrieved from
https://www.qualityforum.org/NPP/docs/Preventing_Hospital_Readmissions_CAB.a
spx
National Quality Forum. (2010b). Safe practices for Better Healthcare–2010 update: A
consensus report. Retrieved from
109
http://www.qualityforum.org/Publications/2010/04/Safe_Practices_for_Better_Healt
hcare_%E2%80%93_2010_Update.aspx;
Nelson, S., Zeng, K., Kilbourne, J., Powell, T., & Moore, R. (2011). Normalized names
for clinical drugs: RxNorm at 6 years. Journal of the American Medical Informatics
Association, 18(4), 441-448. doi:10.1136/amiajnl-2011-000116
Olson, C. H., Dierich, M., Adam, T., & Westra, B. L. (2014). Optimization of decision
support tool using medication regimens to assess rehospitalization risks. Applied
Clinical Informatics, 5(3), 773-788.
Olson, C. H., Dierich, M., & Westra, B. L. (2014). Automation of a high risk medication
regime algorithm in a home health care population. Journal of Biomedical
Informatics, (Epub ahead of print) doi:S1532-0464(14)00089-6 [pii]
Orwig, D., Brandt, N., & Gruber-Baldini, A. L. (2006). Medication management
assessment for older adults in the community. The Gerontologist, 46(5), 661-668.
Overby, C. L., Pathak, J., Gottesman, O., Haerian, K., Perotte, A., Murphy, S., . . . Weng,
C. (2013). A collaborative approach to developing an electronic health record
phenotyping algorithm for drug-induced liver injury. Journal of the American
Medical Informatics Association : JAMIA, 20(e2), e243-52. doi:10.1136/amiajnl-
2013-001930; 10.1136/amiajnl-2013-001930
110
Pal, A., Babbott, S., & Wilkinson, S. T. (2013). Can the targeted use of a discharge
pharmacist significantly decrease 30-day readmissions? Hospital Pharmacy, 48(5),
380-388. doi:10.1310/hpj4805-380 [doi]
Pang-Ting, T., Steinbach, M., & Kumar, V. (2006). Cluster analysis: Basic concepts and
algorithms. Introduction to data mining (pp. 487-568). Boston, MA: Pearson
Education, Inc.
Pasina, L., Brucato, A. L., Falcone, C., Cucchi, E., Bresciani, A., Sottocorno, M., . . .
Nobili, A. (2014). Medication non-adherence among elderly patients newly
discharged and receiving polypharmacy. Drugs & Aging, 31(4), 283-289.
doi:10.1007/s40266-014-0163-7 [doi]
Price, S. D., Holman, C. D., Sanfilippo, F. M., & Emery, J. D. (2014a). Association
between potentially inappropriate medications from the beers criteria and the risk of
unplanned hospitalization in elderly patients. The Annals of Pharmacotherapy,
48(1), 6-16. doi:10.1177/1060028013504904 [doi]
Price, S. D., Holman, C. D., Sanfilippo, F. M., & Emery, J. D. (2014b). Impact of specific
beers criteria medications on associations between drug exposure and unplanned
hospitalisation in elderly patients taking high-risk drugs: A case-time-control study
in western australia. Drugs & Aging, 31(4), 311-325. doi:10.1007/s40266-014-0164-
6 [doi]
111
Qato, D. M., Alexander, G. C., Conti, R. M., Johnson, M., Schumm, P., & Lindau, S. T.
(2008). Use of prescription and over-the-counter medications and dietary
supplements among older adults in the united states. JAMA : The Journal of the
American Medical Association, 300(24), 2867-2878. doi:10.1001/jama.2008.892;
10.1001/jama.2008.892
Rau, J. (2013). Armed with bigger fines, medicare to punish 2,225 hospitals for excess
readmissions. Retrieved from
http://www.kaiserhealthnews.org/Stories/2013/August/02/readmission-penalties-
medicare-hospitals-year-two.aspx
Rea, S., Pathak, J., Savova, G., Oniki, T. A., Westberg, L., Beebe, C. E., . . . Chute, C. G.
(2012). Building a robust, scalable and standards-driven infrastructure for secondary
use of EHR data: The SHARPn project. Journal of Biomedical Informatics, 45(4),
763-771. doi:10.1016/j.jbi.2012.01.009; 10.1016/j.jbi.2012.01.009
Rennke, S., Nguyen, O., Shoeb, M., Magan, Y., Wachter, R., & Ranji, S. (2013).
Hospital-initiated transitional care interventions as a patient safety strategy: A
systematic review. Annals of Internal Medicine, 158(5), 433-440. doi:10.7326/0003-
4819-158-5-201303051-00011
Richesson, R. L. (2014). An informatics framework for the standardized collection and
analysis of medication data in networked research. Journal of Biomedical
112
Informatics, (Epub ahead of print) doi:10.1016/j.jbi.2014.01.002;
10.1016/j.jbi.2014.01.002
Richesson, R. L., Smith, S. B., Malloy, J., & Krischer, J. P. (2010). Achieving
standardized medication data in clinical research studies: Two approaches and
applications for implementing RxNorm. Journal of Medical Systems, 34(4), 651-
657. doi:10.1007/s10916-009-9278-5; 10.1007/s10916-009-9278-5
Robert Wood Johnson Foundation. (2013). The revolving door: A report on U.S. hospital
readmissions. Retrieved from
http://www.rwjf.org/content/dam/farm/reports/reports/2013/rwjf404178
Schoonover, H. (2011). The relationship of medication regimen complexity and health
care utilization. (Masters of Nursing, Washington State University). , 19p.
Schwartz, M. B. (2013). New data is in! RARE campaign helps prevent 6,211 avoidable
readmissions. Retrieved from
http://rarereadmissions.org/resources/RARE_Report_2013_11.html#data
Sehgal, V., Bajwa, S. J., Sehgal, R., Bajaj, A., Khaira, U., & Kresse, V. (2013).
Polypharmacy and potentially inappropriate medication use as the precipitating
factor in readmissions to the hospital. Journal of Family Medicine and Primary
Care, 2(2), 194-199. doi:10.4103/2249-4863.117423; 10.4103/2249-4863.117423
113
Sganga, F., Landi, F., Ruggiero, C., Corsonello, A., Vetrano, D. L., Lattanzio, F., . . .
Onder, G. (2014). Polypharmacy and health outcomes among older adults
discharged from hospital: Results from the CRIME study. Geriatrics & Gerontology
International, doi:10.1111/ggi.12241; 10.1111/ggi.12241
Silow-Carroll, S., Edwards, J., & Lashbrook, A. (2011). Reducing hospital
readmissions: Lessons from top-performing hospitals. (). Washington, D.C.: The
Commonwealth Fund.
Smetanka, M. (2014, March 30). Firefighter house calls help after methodist hospital
stay. Star Tribune, pp. 1.
Subramanian, A., Tamayo, P., Mootha, V. K., Mukherjee, S., Ebert, B. L., Gillette, M.
A., . . . Mesirov, J. P. (2005). Gene set enrichment analysis: A knowledge-based
approach for interpreting genome-wide expression profiles. Proceedings of the
National Academy of Sciences of the United States of America, 102 (43), 15545-
15550. doi:10.1073/pnas.0506580102
Tape, T. G.The area under an ROC curve. Retrieved from
http://gim.unmc.edu/dxtests/roc3.htm
Terao, M., Koga, K., Fujimoto, A., Wada-Hiraike, O., Osuga, Y., Yano, T., & Kozuma,
S. (2013). Factors that predict poor clinical course among patients hospitalized with
114
pelvic inflammatory disease. The Journal of Obstetrics and Gynaecology Research,
40(2), 495-500. doi:10.1111/jog.12189; 10.1111/jog.12189
Teymoorian, S. S., Dutcher, D., & Woods, M. (2011). Association between postdischarge
adverse drug reactions and 30-day hospital readmission in patients aged 80 and
older. Journal of the American Geriatrics Society, 59(5), 948-949.
doi:10.1111/j.1532-5415.2011.03376.x [doi]
Thiruchselvam, T., Naglie, G., Moineddin, R., Charles, J., Orlando, L., Jaglal, S., . . .
Tierney, M. C. (2012). Risk factors for medication nonadherence in older adults with
cognitive impairment who live alone. International Journal of Geriatric Psychiatry,
27(12), 1275-1282. doi:10.1002/gps.3778; 10.1002/gps.3778
Trivedi, R. B., Bryson, C. L., Udris, E., & Au, D. H. (2012). The influence of informal
caregivers on adherence in COPD patients. Annals of Behavioral Medicine : A
Publication of the Society of Behavioral Medicine, 44(1), 66-72.
doi:10.1007/s12160-012-9355-8 [doi]
van Walraven, C., Bennett, C., Jennings, A., Austin, P. C., & Forster, A. J. (2011).
Proportion of hospital readmissions deemed avoidable: A systematic review. CMAJ :
Canadian Medical Association Journal = Journal De L'Association Medicale
Canadienne, 183(7), E391-402. doi:10.1503/cmaj.101860; 10.1503/cmaj.101860
115
Vieira de Lima, T. J., Garbin, C. A., Garbin, A. J., Sumida, D. H., & Saliba, O. (2013).
Potentially inappropriate medications used by the elderly: Prevalence and risk
factors in brazilian care homes. BMC Geriatrics, 13, 52. doi:10.1186/1471-2318-13-
52; 10.1186/1471-2318-13-52
Vijayakrishnan, R., Steinhubl, S. R., Ng, K., Sun, J., Byrd, R. J., Daar, Z., . . . Stewart,
W. F. (2014). Prevalence of heart failure signs and symptoms in a large primary care
population identified through the use of text and data mining of the electronic health
record. Journal of Cardiac Failure, 20(7), 459-464.
doi:10.1016/j.cardfail.2014.03.008 [doi]
Walsh, C., & Hripcsak, G. (2014). The effects of data sources, cohort selection, and
outcome definition on a predictive model of risk of thirty-day hospital readmissions.
Journal of Biomedical Informatics, (Epub ahead of print) doi:S1532-0464(14)00187-
7 [pii]
Wardenaar, K. J., van Loo, H. M., Cai, T., Fava, M., Gruber, M. J., Li, J., . . . Kessler, R.
C. (2014). The effects of co-morbidity in defining major depression subtypes
associated with long-term course and severity. Psychological Medicine, , 1-14.
doi:S0033291714000993 [pii]
Weng, M. C., Tsai, C. F., Sheu, K. L., Lee, Y. T., Lee, H. C., Tzeng, S. L., . . . Chen, S.
C. (2013). The impact of number of drugs prescribed on the risk of potentially
inappropriate medication among outpatient older adults with chronic diseases. QJM :
116
Monthly Journal of the Association of Physicians, 106(11), 1009-1015.
doi:10.1093/qjmed/hct141; 10.1093/qjmed/hct141
Westra, B. L., Savik, K., Oancea, C., Choromanski, L., Holmes, J. H., & Bliss, D. (2011).
Predicting improvement in urinary and bowel incontinence for home health patients
using electronic health record data. Journal of Wound, Ostomy, and Continence
Nursing : Official Publication of the Wound, Ostomy and Continence Nurses Society
/ WOCN, 38(1), 77-87.
Willson, M. N., Greer, C. L., & Weeks, D. L. (2014). Medication regimen complexity
and hospital readmission for an adverse drug event. The Annals of
Pharmacotherapy, 48(1), 26-32. doi:10.1177/1060028013510898;
10.1177/1060028013510898
Wimmer, B. C., Dent, E., Bell, J. S., Wiese, M. D., Chapman, I., Johnell, K., &
Visvanathan, R. (2014). Medication regimen complexity and unplanned hospital
readmissions in older people. The Annals of Pharmacotherapy, 48(9), 1120-1128.
doi:1060028014537469 [pii]
Yuan, L., & Kaplowitz, N. (2013). Mechanisms of drug-induced liver injury. Clinics in
Liver Disease, 17(4), 507-518. doi:10.1016/j.cld.2013.07.002;
10.1016/j.cld.2013.07.002
117
Zekry, D., Loures Valle, B. H., Graf, C., Michel, J. P., Gold, G., Krause, K. H., &
Herrmann, F. R. (2012). Prospective comparison of 6 comorbidity indices as
predictors of 1-year post-hospital discharge institutionalization, readmission, and
mortality in elderly individuals. Journal of the American Medical Directors
Association, 13(3), 272-278. doi:10.1016/j.jamda.2010.11.011 [doi]
Zhan, C., Sangl, J., Bierman, A. S., Miller, M. R., Friedman, B., Wickizer, S. W., &
Meyer, G. S. (2001). Potentially inappropriate medication use in the community-
dwelling elderly: Findings from the 1996 medical expenditure panel survey. JAMA:
The Journal of the American Medical Association, 286(22), 2823-2829.
doi:10.1001/jama.286.22.2823
Zhang, M., Holman, C. D., Price, S. D., Sanfilippo, F. M., Preen, D. B., & Bulsara, M. K.
(2009). Comorbidity and repeat admission to hospital for adverse drug reactions in
older adults: Retrospective cohort study. BMJ (Clinical Research Ed.), 338, a2752.
doi:10.1136/bmj.a2752 [doi]
Zhang, S., McClean, S. I., Nugent, C. D., Donnelly, M. P., Galway, L., Scotney, B. W., &
Cleland, I. (2014). A predictive model for assistive technology adoption for people
with dementia. IEEE Journal of Biomedical and Health Informatics, 18(1), 375-383.
doi:10.1109/JBHI.2013.2267549; 10.1109/JBHI.2013.2267549
Ziaeian, B., Araujo, K. L. B., Van Ness, P., & Horwitz, L. (2012). Medication
reconciliation accuracy and patient understanding of intended medication changes on
118
hospital discharge. Journal of General Internal Medicine, 27(11), 1513-1520.
doi:10.1007/s11606-012-2168-4
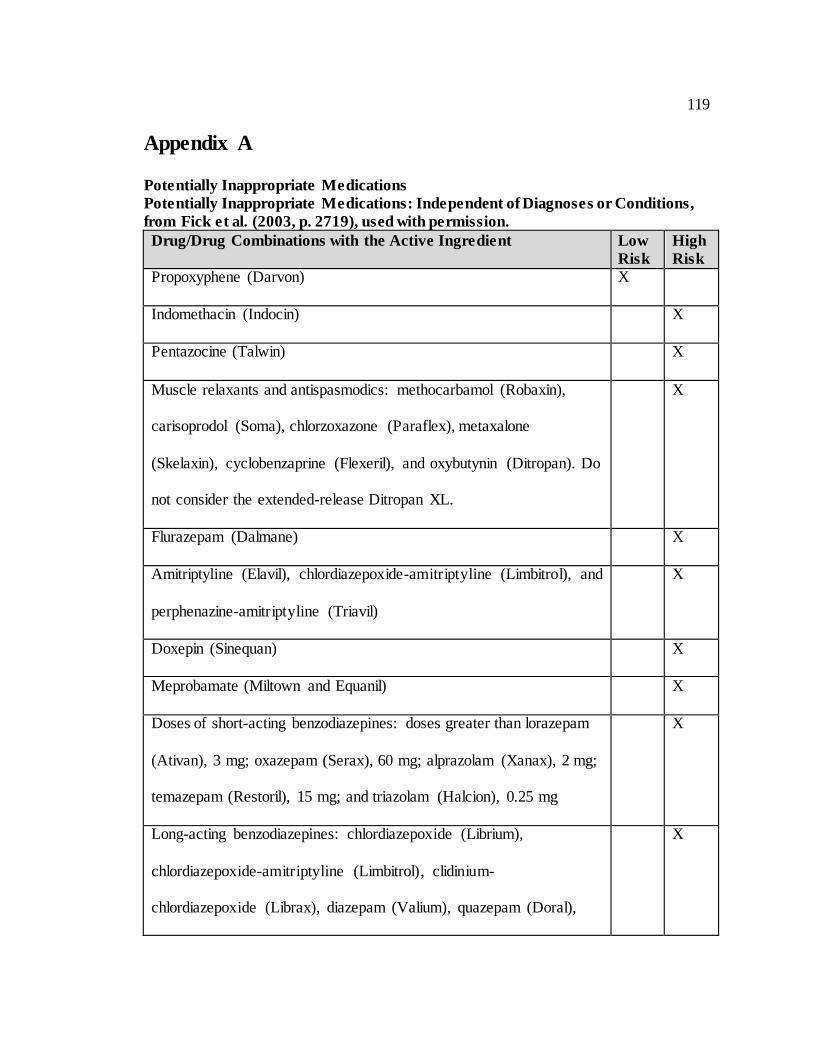
119
Appendix A
Potentially Inappropriate Medications
Potentially Inappropriate Medications: Independent of Diagnoses or Conditions,
from Fick et al. (2003, p. 2719), used with permission.
Drug/Drug Combinations with the Active Ingredient Low
Risk
High
Risk
Propoxyphene (Darvon) X
Indomethacin (Indocin) X
Pentazocine (Talwin) X
Muscle relaxants and antispasmodics: methocarbamol (Robaxin),
carisoprodol (Soma), chlorzoxazone (Paraflex), metaxalone
(Skelaxin), cyclobenzaprine (Flexeril), and oxybutynin (Ditropan). Do
not consider the extended-release Ditropan XL.
X
Flurazepam (Dalmane) X
Amitriptyline (Elavil), chlordiazepoxide-amitriptyline (Limbitrol), and
perphenazine-amitriptyline (Triavil)
X
Doxepin (Sinequan) X
Meprobamate (Miltown and Equanil) X
Doses of short-acting benzodiazepines: doses greater than lorazepam
(Ativan), 3 mg; oxazepam (Serax), 60 mg; alprazolam (Xanax), 2 mg;
temazepam (Restoril), 15 mg; and triazolam (Halcion), 0.25 mg
X
Long-acting benzodiazepines: chlordiazepoxide (Librium),
chlordiazepoxide-amitriptyline (Limbitrol), clidinium-
chlordiazepoxide (Librax), diazepam (Valium), quazepam (Doral),
X
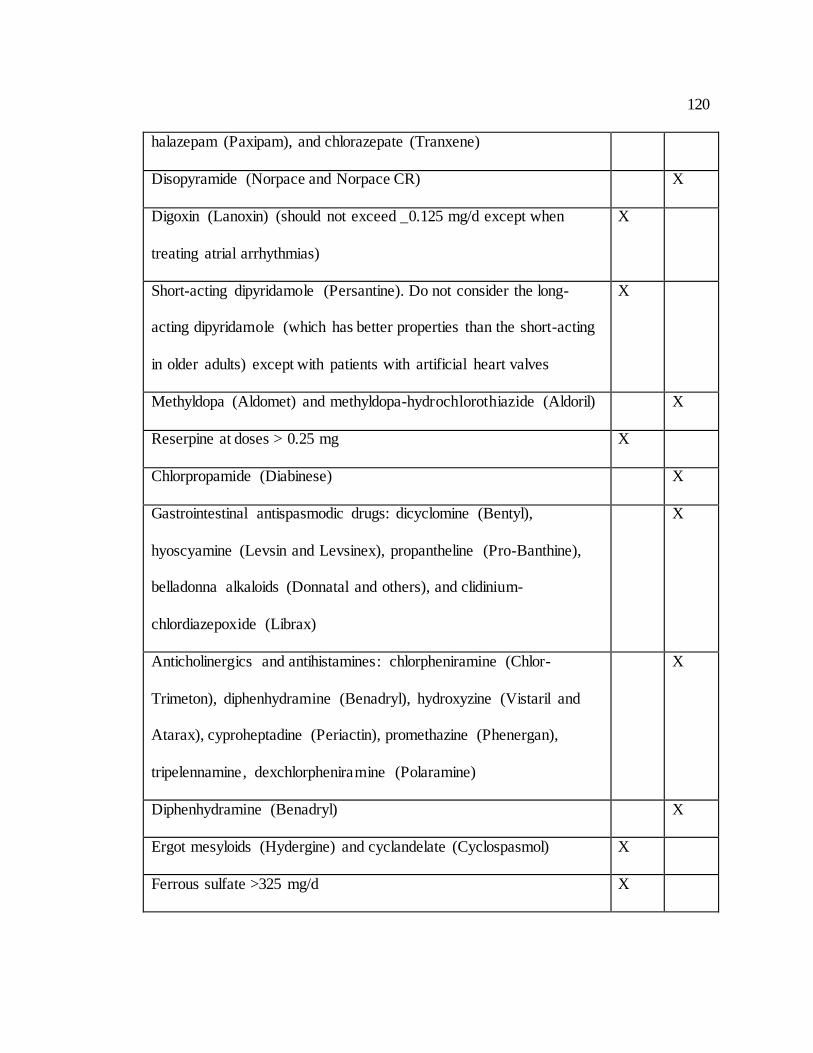
120
halazepam (Paxipam), and chlorazepate (Tranxene)
Disopyramide (Norpace and Norpace CR) X
Digoxin (Lanoxin) (should not exceed _0.125 mg/d except when
treating atrial arrhythmias)
X
Short-acting dipyridamole (Persantine). Do not consider the long-
acting dipyridamole (which has better properties than the short-acting
in older adults) except with patients with artificial heart valves
X
Methyldopa (Aldomet) and methyldopa-hydrochlorothiazide (Aldoril) X
Reserpine at doses > 0.25 mg X
Chlorpropamide (Diabinese) X
Gastrointestinal antispasmodic drugs: dicyclomine (Bentyl),
hyoscyamine (Levsin and Levsinex), propantheline (Pro-Banthine),
belladonna alkaloids (Donnatal and others), and clidinium-
chlordiazepoxide (Librax)
X
Anticholinergics and antihistamines: chlorpheniramine (Chlor-
Trimeton), diphenhydramine (Benadryl), hydroxyzine (Vistaril and
Atarax), cyproheptadine (Periactin), promethazine (Phenergan),
tripelennamine, dexchlorpheniramine (Polaramine)
X
Diphenhydramine (Benadryl) X
Ergot mesyloids (Hydergine) and cyclandelate (Cyclospasmol) X
Ferrous sulfate >325 mg/d X
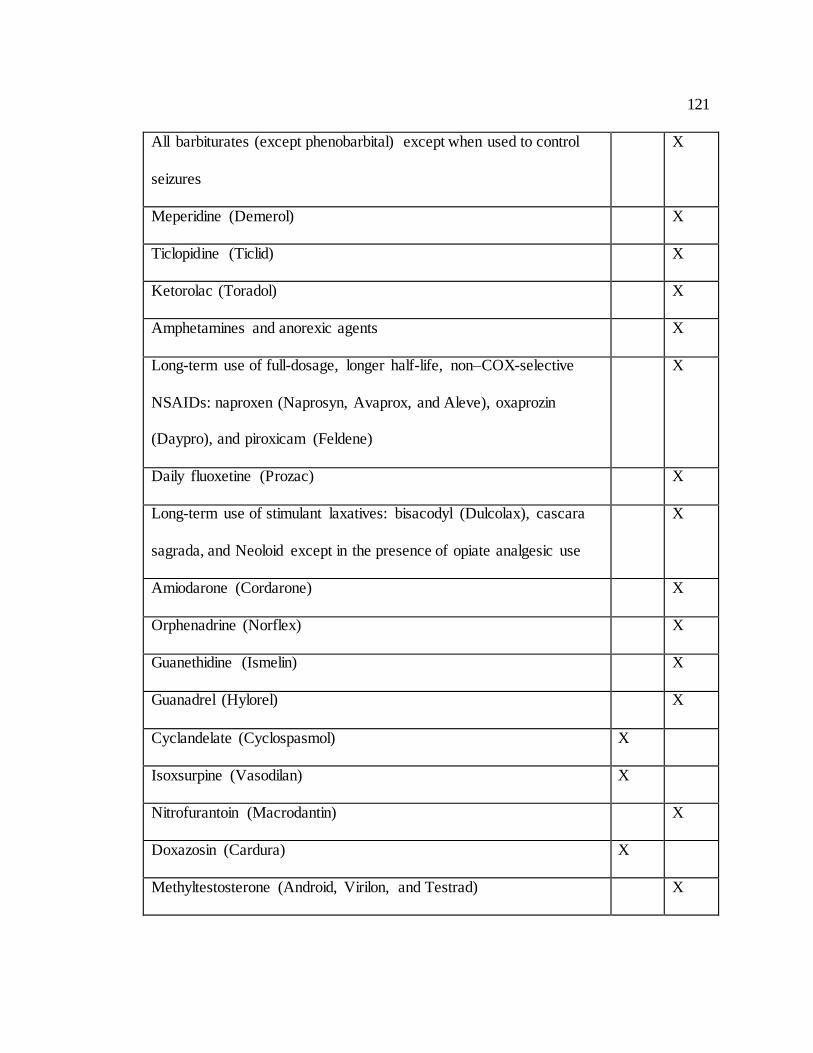
121
All barbiturates (except phenobarbital) except when used to control
seizures
X
Meperidine (Demerol) X
Ticlopidine (Ticlid) X
Ketorolac (Toradol) X
Amphetamines and anorexic agents X
Long-term use of full-dosage, longer half-life, non–COX-selective
NSAIDs: naproxen (Naprosyn, Avaprox, and Aleve), oxaprozin
(Daypro), and piroxicam (Feldene)
X
Daily fluoxetine (Prozac) X
Long-term use of stimulant laxatives: bisacodyl (Dulcolax), cascara
sagrada, and Neoloid except in the presence of opiate analgesic use
X
Amiodarone (Cordarone) X
Orphenadrine (Norflex) X
Guanethidine (Ismelin) X
Guanadrel (Hylorel) X
Cyclandelate (Cyclospasmol) X
Isoxsurpine (Vasodilan) X
Nitrofurantoin (Macrodantin) X
Doxazosin (Cardura) X
Methyltestosterone (Android, Virilon, and Testrad) X
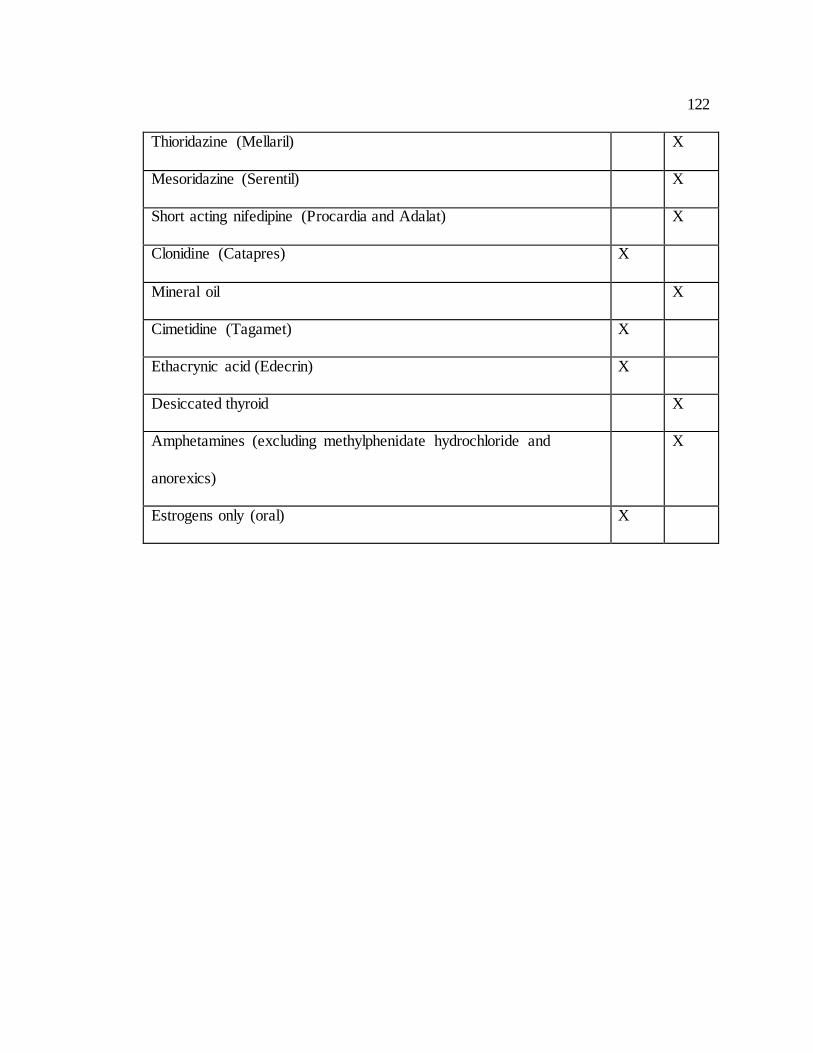
122
Thioridazine (Mellaril) X
Mesoridazine (Serentil) X
Short acting nifedipine (Procardia and Adalat) X
Clonidine (Catapres) X
Mineral oil X
Cimetidine (Tagamet) X
Ethacrynic acid (Edecrin) X
Desiccated thyroid X
Amphetamines (excluding methylphenidate hydrochloride and
anorexics)
X
Estrogens only (oral) X
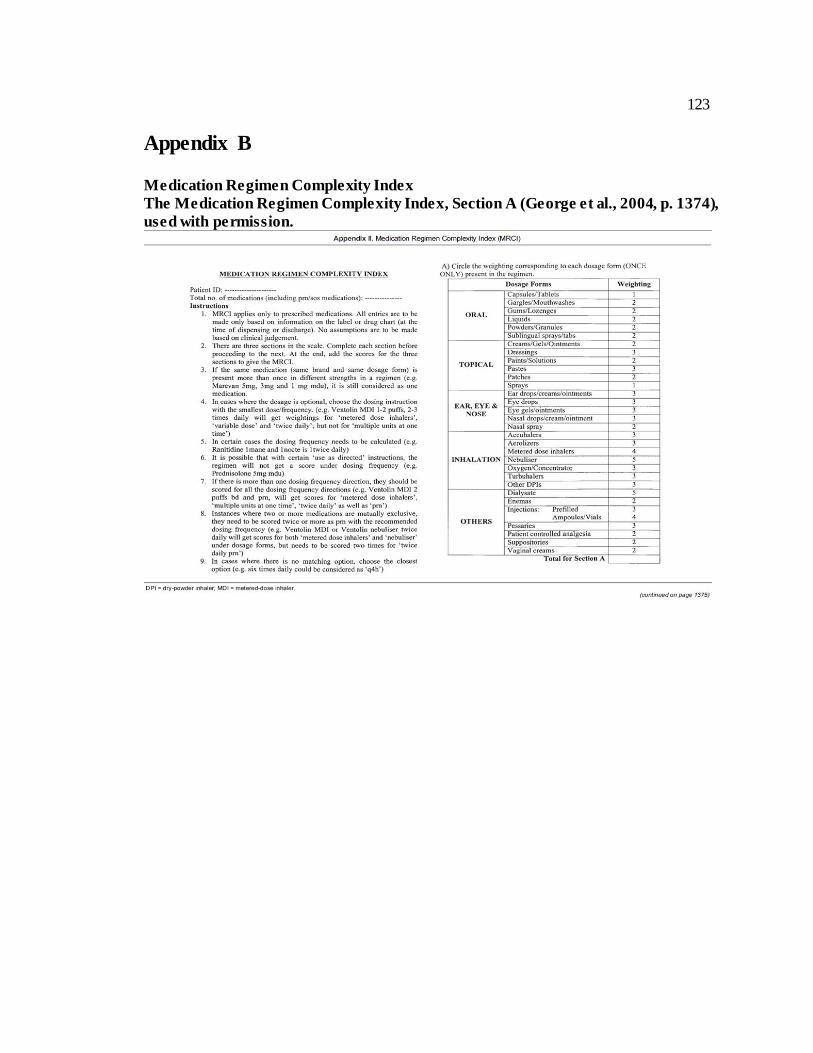
123
Appendix B
Medication Regimen Complexity Index
The Medication Regimen Complexity Index, Section A (George et al., 2004, p. 1374),
used with permission.
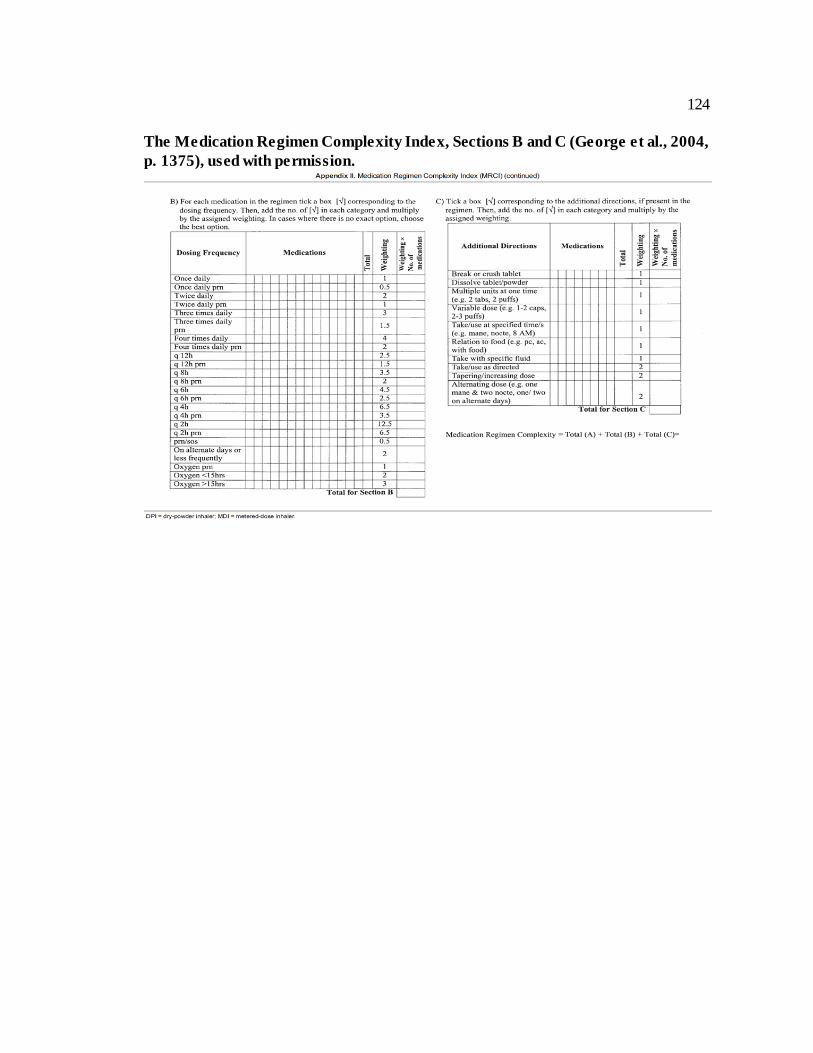
124
The Medication Regimen Complexity Index, Sections B and C (George et al., 2004,
p. 1375), used with permission.