exploiting financial news and social media opinions for … · exploiting financial news and social...
TRANSCRIPT
Comput Econ (2016) 47:589–622DOI 10.1007/s10614-015-9492-9
Exploiting Financial News and Social Media Opinionsfor Stock Market Analysis using MCMC BayesianInference
Manolis Maragoudakis · Dimitrios Serpanos
Accepted: 26 January 2015 / Published online: 25 February 2015© Springer Science+Business Media New York 2015
Abstract Stock market analysis by using Information and Communication Tech-nology methods is a dynamic and volatile domain. Over the past years, there hasbeen an increasing focus on the development of modeling tools, especially when theexpected outcomes appear to yield significant profits to the investors’ portfolios. Inalignment with modern globalized economy, the available resources are becominggradually more plentiful, thus difficult to be analyzed by standard statistical tools.Thus far, there have been a number of research papers that emphasize solely in pastdata from stock bond prices and other technical indicators. Nevertheless, throughoutrecent studies, prediction is also based on textual information, based on the logicalassumption that the course of a stock price can also be affected by news articlesand perhaps by public opinions, as posted on various Web 2.0 platforms. Despite therecent advances in Natural Language Processing and Data Mining, when data tendto grow both in number of records and attributes, numerous mining algorithms facesignificant difficulties, resulting in poor forecast ability. The aim of this study is topropose a potential answer to the problem, by considering a Markov Chain MonteCarlo Bayesian Inference approach, which estimates conditional probability distri-butions in structures obtained from a Tree-Augmented Naïve Bayes algorithm. Thenovelty of this study is based on the fact that technical analysis contains the event andnot the cause of the change, while textual data may interpret that cause. The papertakes into account a large number of technical indices, accompanied with features that
M. Maragoudakis (B)Department of Information and Communication Systems Engineering,University of the Aegean, Samos, Greecee-mail: [email protected]
D. SerpanosQatar Computing Research Institute (QCRI), Doha, Qatare-mail: [email protected]
123

590 M. Maragoudakis, D. Serpanos
are extracted by a text mining methodology, from financial news articles and opinionsposted in different social media platforms. Previous research has demonstrated thatdue to the high-dimensionality and sparseness of such data, the majority of wide-spread Data Mining algorithms suffer from either convergence or accuracy problems.Results acquired from the experimental phase, including a virtual trading experiment,are promising. Certainly, as it is tedious for a human investor to read all daily newsconcerning a company and other financial information, a prediction system that couldanalyze such textual resources and find relations with price movement at future timeframes is valuable.
Keywords Stock return forecasting ·Data mining ·Hierarchical Bayesian methods ·Trading strategies
1 Introduction
Stock market prediction has always gained certain attention from researchers. There isa controversy as regards to whether there is a method for accurate prediction of stockmarket movement, mainly due to the fact that modeling market dynamics is a com-plex and volatile domain. Stock market research encapsulates two main philosophicalattitudes, i.e. fundamental and technical approaches Technical-Analysis (2005). Theformer states that stock market movement of prices derives from a security’s relativedata. In a fundamentalist trading philosophy, the price of a security can be determinedthrough the nuts and bolts of financial numbers. These numbers are derived from theoverall economy, the particular industry’s sector, or most typically, from the companyitself. Figures such as inflation, joblessness, return on equity (ROE), debt levels, andindividual price to earnings (PE) ratios can all play a part in determining the price ofa stock.
In technical analysis, it is believed thatmarket timing is the key concept. Techniciansutilize charts and modeling techniques from past data to identify trends in price andvolume. These strategists believe that market timing is critical and opportunities canbe found through the careful averaging of historical price and volume movements andcomparing them against current prices. Technicians also believe that there are certainhigh/low psychological price barriers such as support and resistance levels whereopportunities may exist. They further reason that price movements are not totallyrandom. Nevertheless, according to several researchers, the goal is not to question thepredictability of financial time series but to discover a good model that is capable ofdescribing the dynamics of stock market.
Towards the latter direction, stock market analysis by utilizing Information Tech-nology methods is a dynamic and challenging domain. Over the past years, there hasbeen an increasing focus on the development of modeling systems, especially whenthe expected outcomes appear to yield significant profits to the investors’ portfolios.In alignment with modern globalized economy, the available resources are becominggradually more plentiful, thus difficult to be analyzed by standard statistical tools.Therefore, technical analysis experts judge that stock market is an excellent repre-sentative field of application with strong dynamics in research through data mining,
123
Stock Market Analysis using MCMC Bayesian Inference 591
mainly due to the quantity and the increase rate that data is being produced. Thus far,there have been a number of research papers that emphasize solely in past data fromstock bond prices and other technical indicators. Nevertheless, throughout recent stud-ies, prediction is also based on textual records, based on the logical assumption thatthe course of a stock price can be influenced by news articles, ranging from companiesreleases and local politics to news of superpower economy Ng and Fu (2003).
However, unrestricted access to news information was not possible until the early1990’s. Nowadays, news are easily accessible, access to important data such as insidecompany information is relatively cheap and estimations emerge from a vast poolof economists, statisticians, journalists, etc., through the World Wide Web. Despitethe large amount of data, advances in Natural Language Processing and text miningallow for effective computerized representation of unstructured document collections,analysis for pattern extraction and discovery of relationships between document termsand time-stamped data streams of stock market quotes. Despite the fact that newsplay an important role towards influencing stock market trends, public mood states orsentiment, as expressed through various means that promote inter-connectivity, suchas Web 2.0 platforms, may also play a similarly important role. Targeted researchin the domain of psychology has proven that emotions in addition to informationhave a direct impact in human decision-making Liu et al. (2007). Therefore, a logicalassumption would be for someone to consider public opinion as a factor that couldalso affect stock market values.
In the present study, the main goal is to study the impact of technical analysis,news articles and public opinions to the task of predicting stock market value. Theimportance of this study lies to the fact that technical analysis contains the event andnot the cause of the change, while textual data may interpret that cause. Followingrecent trends in the task at hand, this paper takes into account a large number of tech-nical indices, accompanied with features that are extracted by a textual analysis phasefrom financial news articles and public opinions from financial information portalsand Twitter. We incorporate Machine Learning algorithms, that have been adjusted tomatch the characteristics of the collected dataset, which is characterized by a plethoraof attributes. Our proposed methodology is based on a novel Markov Chain MonteCarlo (MCMC) Bayesian Inference approach, which estimates the conditional proba-bility distributions of network structures that are obtained by a Tree-Augmented NaïveBayes (TAN) algorithm. Experimental results, including a virtual trading experiment,are promising. Certainly, as it is tedious for a human investor to read the plethoraof available daily news and public reactions concerning a company as well as otherfinancial information, a prediction system that could analyze such textual resourcesand find relationships with price movement at future time windows is beneficial.
The paper is structured as follows: Section 2 provides an overview of literature con-cerning stock market prediction, in an attempt to link previous works with the articleand also to provide a clear motivation for the proposed study. Section 3 presents themethodology overview, introducing Bayesian networks and their use towards model-ing and reasoning under conditions of uncertainty. Since standard Bayesian networksface certain issues when dealing with classification problems in high-dimensionaldomains, in Section 4, we provide the theoretical framework of MCMC inferencewhich suits our needs. Section 5 deals with the proposed method, which utilizes the
123
592 M. Maragoudakis, D. Serpanos
main characteristics of MCMC but also introduces a novel approach on estimatingconditional probability distributions from networks that favor classification tasks. Sec-tion 6 presents the input data characteristics as well as the processing phase of textualinformation and Section 7 describes the experimental evaluation process. Concludingremarks and future directions are found in Section 8.
2 Previous Research
Towards linking the current paper with previous studies and presenting a clear moti-vation for the suggested methodology, the present section discusses previous researchin stock market forecasting by following an event-based approach. More specifically,we intend to focus on the shift from traditional approaches and standard theories tomachine learning approaches, in which a number of attempts in combining differenttypes of explanatory variables into forecasting models is applied. Towards this latterdirection, emphasis shall be given on works that study the influence of news articlesand other forms of public opinions on stock markets since it is also the main target ofour work.
The theory ofRandomWalk states that marketsmove in a random and unpredictablemanner. This theory, reflecting the efficient market hypothesis, used to be very pop-ular and widely accepted by academic financial economists in the first era of stockmarket modeling Fama (1970). The logic behind the random walk idea is that if theflow of information is unimpeded and information is immediately reflected in stockvalues, then a change in tomorrow’s price will only reflect tomorrow’s news and willbe independent of the price changes today. But news is by definition unpredictableand, thus, resulting price changes must be unpredictable and random. Following theabove hypothesis, one could expect no benefit when performing stock market fore-casting. However, as shown by Lo and MacKinlay (1988), evidence of predictabilityexists to some extent. Macroeconomic factors were believed to provide some addi-tional information for stock market forecasting. As illustrated by Chen (1991), variousmacroeconomic factors such as the default spread, the term spread, the one-month T-bill rate, the lagged industrial production growth rate, and the dividend-price ratiopossess certain forecasting power. In a later work by Bilson et al. (2001), a set of com-monmacroeconomic factors was examined on whether they affect returns of emergingmarkets. Their study showed that local macroeconomic factors such as money supply,inflation, industrial production, and exchange rates, as well as microeconomic factorssuch as price-to-earnings and dividend yield are most apparent in explaining the returnvariation for most emerging markets.
Nevertheless, not only fundamental factors were capable of providing informationin predicting stockmarket movements. Technical indicators were also found to containinformation that aids forecasting. For example, Yao et al. (1999) proposed amodel thatapplies lagged index price and some well-known technical indicators such as MovingAverage, Momentum, Relative Strength Index, Stochastics and Moving Average ofStochastics in predicting future trends. Recent studies have depicted a number ofapplications in combining different types of explanatory variables into forecastingmodels. In Bettman et al. (2009), the potential in combining fundamental and technical
123

Stock Market Analysis using MCMC Bayesian Inference 593
variables into US equities forecasting is discussed. Results favor the complementarynature of fundamental and technical factors, which yields a better explanatory powerin prediction.
With the advances of machine learning and data mining, a serious amount of workis performed towards utilizing large input features into more complex forecastingmodels than previously used (e.g. ARIMA, Linear Regression, Buy-and-hold, etc.).As thoroughly described in the survey of Atsalakis and Valavanis (2009), more intelli-gent techniques such asNeural Networks and Support VectorMachines have portrayedtheir forecasting capabilities in numerous applications.
As shown above, significant research work has been devoted to stock price predic-tion data mining techniques that rely only on structured data, like historical prices,traded volumes, and financial rates and figures. Approaches usually employ data min-ing and statistical analysis techniques to forecast the future price of a stock. On theother hand, work concerning the application of text mining to stock market predictionis limited, but has already proven that salient financial and political news affects stockprice at least as strongly as the traditional financial attributes attributes usually selectedto describe a stock. Thereby, a new area of research has emerged; the prediction ofstock price movement based on financial news articles. Approaches regarding the cor-relation between the most recent financial articles and the future price of a stock aredescribed in detail below.
Chung et al. (2002) were among the first to confirm the reaction of the marketto news articles. They used salient political and economic news as proxy for publicinformation. They have discovered that both types of news have impact on measuresof trading activity including return volatility, price volatility, number of shares traded,and trading frequency.
Klibanoff et al. (1998) dealt with closed-end country funds prices and country spe-cific salient news. They argued about the existence of a positive relationship betweentrading volume and news. They investigated the relationship between closed-end coun-try funds’ prices and country-specific salient news. The news that occupied at least twocolumns on The New York Times front-page were considered as salient news. Theyhave discovered that there is a significant correlation between volume and news. Sim-ilar to the aforementioned approach, Chan and John-Wei (1996) discovered that newsthat is placed in the front page of the South China Post increase the return volatilityin the Hong Kong stock market. Mitchell and Mulherin (2002) used the daily numberof headlines of Dow Jones as a measure of public information. They mentioned thepositive impact of news on absolute price changes.
Cho (1999) used the number of news released byReuter’sNewsServicemeasured inper unit of time as a proxy for public information. In contrast toMitchell andMulherin,they examined the impact of news on the intradaymarket activity. Their results suggestthat there is a noteworthy positive relationship between news arrivals and tradingvolume. Mittermayer (2004) proposed a prediction system calledNEWSCATS,whichprovided an estimate of the price after the publication of press releases. Shumaker andChen (2006) examined three different textual representation formalisms and studiedtheir abilities to predict discrete stock prices twenty minutes upon an article releasein press. The Arizona Financial Text System (AZFinText) proposed by them, extractsproper nouns and selects the proper nouns that occurs three or more times to be used
123
594 M. Maragoudakis, D. Serpanos
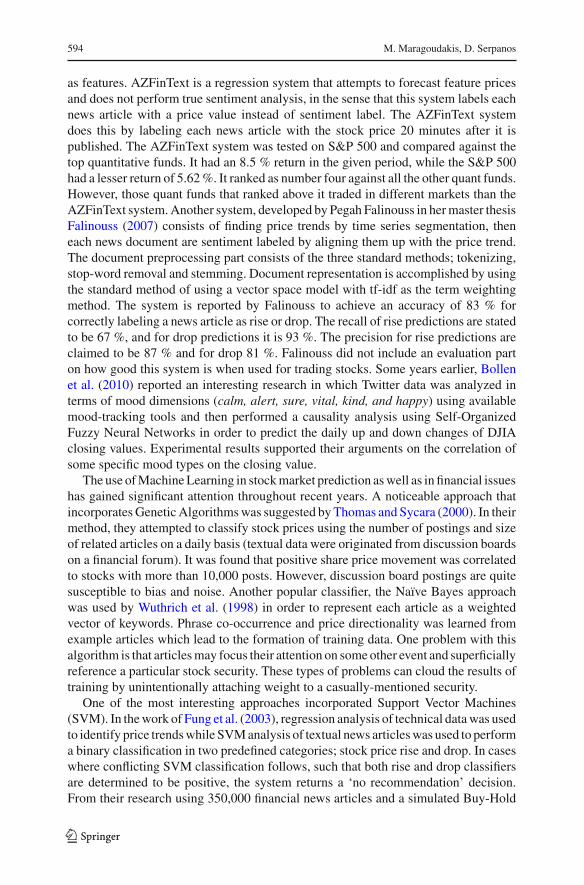
as features. AZFinText is a regression system that attempts to forecast feature pricesand does not perform true sentiment analysis, in the sense that this system labels eachnews article with a price value instead of sentiment label. The AZFinText systemdoes this by labeling each news article with the stock price 20 minutes after it ispublished. The AZFinText system was tested on S&P 500 and compared against thetop quantitative funds. It had an 8.5 % return in the given period, while the S&P 500had a lesser return of 5.62%. It ranked as number four against all the other quant funds.However, those quant funds that ranked above it traded in different markets than theAZFinText system.Another system, developed by Pegah Falinouss in hermaster thesisFalinouss (2007) consists of finding price trends by time series segmentation, theneach news document are sentiment labeled by aligning them up with the price trend.The document preprocessing part consists of the three standard methods; tokenizing,stop-word removal and stemming. Document representation is accomplished by usingthe standard method of using a vector space model with tf-idf as the term weightingmethod. The system is reported by Falinouss to achieve an accuracy of 83 % forcorrectly labeling a news article as rise or drop. The recall of rise predictions are statedto be 67 %, and for drop predictions it is 93 %. The precision for rise predictions areclaimed to be 87 % and for drop 81 %. Falinouss did not include an evaluation parton how good this system is when used for trading stocks. Some years earlier, Bollenet al. (2010) reported an interesting research in which Twitter data was analyzed interms of mood dimensions (calm, alert, sure, vital, kind, and happy) using availablemood-tracking tools and then performed a causality analysis using Self-OrganizedFuzzy Neural Networks in order to predict the daily up and down changes of DJIAclosing values. Experimental results supported their arguments on the correlation ofsome specific mood types on the closing value.
The use ofMachineLearning in stockmarket prediction aswell as in financial issueshas gained significant attention throughout recent years. A noticeable approach thatincorporatesGeneticAlgorithmswas suggested byThomas and Sycara (2000). In theirmethod, they attempted to classify stock prices using the number of postings and sizeof related articles on a daily basis (textual data were originated from discussion boardson a financial forum). It was found that positive share price movement was correlatedto stocks with more than 10,000 posts. However, discussion board postings are quitesusceptible to bias and noise. Another popular classifier, the Naïve Bayes approachwas used by Wuthrich et al. (1998) in order to represent each article as a weightedvector of keywords. Phrase co-occurrence and price directionality was learned fromexample articles which lead to the formation of training data. One problem with thisalgorithm is that articlesmay focus their attention on someother event and superficiallyreference a particular stock security. These types of problems can cloud the results oftraining by unintentionally attaching weight to a casually-mentioned security.
One of the most interesting approaches incorporated Support Vector Machines(SVM). In thework of Fung et al. (2003), regression analysis of technical datawas usedto identify price trendswhile SVManalysis of textual news articleswas used to performa binary classification in two predefined categories; stock price rise and drop. In caseswhere conflicting SVM classification follows, such that both rise and drop classifiersare determined to be positive, the system returns a ‘no recommendation’ decision.From their research using 350,000 financial news articles and a simulated Buy-Hold
123

Stock Market Analysis using MCMC Bayesian Inference 595
strategy based upon their SVM classifications, they showed that their technique wasmildly profitable. Mittermayer (2004) also used SVM is his research to find an optimalprofit trading engine. While relying on a three-tier classification system, his researchfocused on empirically establishing trading limits. It was found that profits can bemaximized by buying or shorting stocks and taking profit on them at 1% upmovementor 3%downmovement. Thismethod slightly beat random trading by yielding a 0.11%average return.
The work of Xidonas et al. (2009) focuses onmodeling the overall corporate perfor-mance using financial analysis techniques. In Chandra et al. (2010), a hybrid SupportVector Machines and Neural Network methodology is adopted towards dealing withbankruptcy prediction. Data mining processes for reducing dimensionality in bank-ing and insurance data are followed by Vasu and Ravi (2011). Genetic algorithms fortuning a technical trading system for the Dow Jones are demonstrated in the work ofNunez-Letamendia et al. (2011). Predicting credit card customer churn in banks usingdata mining has been suggested by Kumar and Ravi (2008). The study of Oyatoyeand Arilesere (2012) combined an ’expanded Lagrangian function with a modifiedtrust region method to propose a method for solving investment portfolio manage-ment problems of insurance companies. In Jayech and Zina (2012), measuring forfinancial contagion in the stock markets using a copula approach was used, while inBebarta et al. (2012), a comparative study of stock market forecasting using differentfunctional link artificial neural networks is presented.
In the work of Preis et al. (2013), it is suggested that within a given time period,Google Trends data did not only reflect the current state of the stock markets butmay have also been able to forecast certain future trends. Their findings are consistentwith the intriguing proposal that notable drops in the financial market are preceded byperiods of investor concern. In such periods, investorsmay search formore informationabout the market, before eventually deciding to buy or sell. By following this logic,during the period 2004 to 2011 Google Trends search query volumes for certainterms could have been used in the construction of profitable trading strategies. Theycompared their approach against the “buy and hold” strategy and a purely randominvestment strategy on theDowJones IndustrialAverage (DJIA). The proposedGoogleTrends strategy utilizing the search volume of the term debt has yielded a profit of326 %.
To sum up, while many of the previous studies have focused mainly on classifica-tions based on historical stock prices, none of them have clearly managed to harnessdatamining algorithms in order to accurately and effectively determine a discrete stockprice prediction, based on both stock prices and financial news articles. For existingapproaches that relied on a “bag-of-words” textual representation format, the plethoraof input variables has obviously posed algorithms with problems and this could be areason for the small improvements that are reported in literature, as regards to stockmarket forecasting. Undoubtedly, semantically-rich text representation of articles ismore beneficial, since less noise and outlier parameters are inserted to the classifier.However, for the majority of languages such as Modern Greek, semantic annotationtools and resources such as WordNet Fellbaum (1998) are not available. Thus, wehave focused our effort in improving the ability of existing data mining algorithms tohandle the “bag-of-words” problem, augmented by numerous additional parameters,
123

596 M. Maragoudakis, D. Serpanos
obtained from technical indices. The proposed approach discusses both theoreticaland experimental issues of the new, hybrid algorithm we propose, which is suitablefor large datasets particularly when the number of non-informative input features islarge.
3 Methodology Overview
In this section we provide an overview of the proposed methodology, which includesthe main challenges and limitations posed in using Bayesian Networks (BN) Hecker-man (1999) for stock market prediction, and in general for similar financial decisionsupport problems, and also how we address them. BN are suitable for reasoning underconditions of uncertainty, because they are flexible models for representing relation-ships among different interacting features (i.e. from technical analysis or text mining)that can be interpreted and visualized. Such relationships could be exploited bothfor predicting stock market and simultaneously for obtaining an insight into whichare the input features that the classification process is based on. Recently, a num-ber of researches about incorporating BN to the financial analysis domain have beenpresented, presenting a series of benefits from shifting from numerical methods tostochastic ones. In our formulation, we use BN to represent two aspects of financialmodeling: a qualitative and a quantitative one. The qualitative structure depicts directrelationships between features and represents their relations as a Directed AcyclicGraph (DAG), where features are denoted as nodes and arcs represent probabilisticrelationships among them. The quantitative structure describes such relationships asconditional probability distributions, explaining the strength of such relationships.
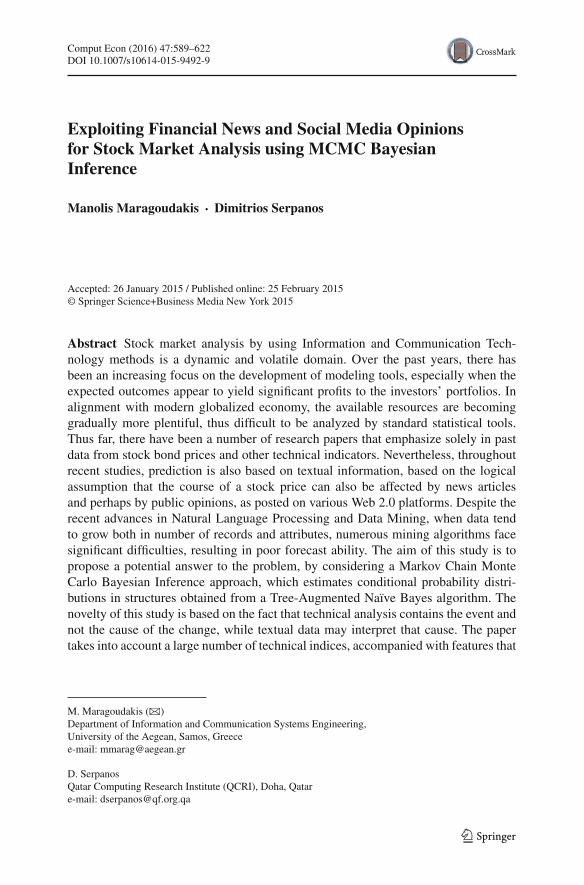
In order to place some emphasis on the benefits of BN in financial and economicsdomain, consider the following example that illustrates some of the functionalities ofBN (Fig. 1). Suppose that one attempts to model whether the Liquidity indicator of a
Fig. 1 A draft BN for financial modeling
123

Stock Market Analysis using MCMC Bayesian Inference 597
company (denoted by L) would beHigh or Low. Such an event can affect the AccountsPayable Turnover (denoted by APT ), which is the number of days in which the averageamount of payables are settled. The outcome of Liquidity is influenced by the Equity(denoted by E) and/or from the Debt ratio (denoted by DR). For simplicity, let usassume that all variables are binary, i.e. High and Low. The Conditional ProbabilityDistribution (CPD) of each variable is listed besides each node in the network. In thisexample, the parents of Liquidity are Equity and Debt Ratio. The child of Liquidity isAccounts Payable Turnover. By following the BN independence assumption, severalstatements can be observed:
(a) the variables Equity and Debt Ratio are marginally independent, but when Liq-uidity is given they are conditionally dependent. The type of this relation is oftennamed as explaining away.
(b) when Liquidity is given, Accounts Payable Turnover is conditionally independentof its ancestors Equity and Debt Ratio.
(c) Instead of factorizing the joint distribution of all variables using the chain rule,i.e. P(E, DR, L , APT ) = P(E)P(DR|E)P(L|DR, E)P(APT |L , DR, E),the BN defines a compact CPD in a factored form, i.e. P(E, DR, L , APT ) =P(E)P(DR)P(L|E, DR)P(APT |L). Note that the BN form reduces the num-ber ofmodel parameters (i.e. the number of rows in theCPD table) from24−1 = 15to only 8. This property is of utmost importance since it allows researchers to createa tractable model of domains with a plethora of features.
Such a reduction provides great benefits from inference, learning (parameter esti-mation), and computational perspective. When people use BNs, they behave similarlyto expert systems, since it is able to represent beliefs and knowledge about a particu-lar class of situations. The network represents the knowledge on a particular thematicarea. Given evidence on the presence or absence of other situations, conclusions can bedrawn on a particular instantiation of a situation. This important observation allows usto build information inference systems that are based on a straightforward probabilisticapproach.
However, BN suffer from significant limitations when applied in particular applica-tions of the financial domain such as the task at hand, mainly because prior knowledgeis not available or extremely difficult to be defined, and the available data are charac-terized as “highly-dimensional” (i.e. having large numbers of features).
Another important limitation of applying generic BN to the task at hand is thatour features have continuous ranges of values (which is quite usual in stock marketanalysis and in many other time series applications). Despite the fact that alternativesolutions exist for dealing with continuous values in BN, the majority of them focuson the use of discrete valued features, since in the former case (continuous range ofvalues) there are significant topology restrictions and only the Gaussian distributionis supported. Nevertheless, discretization is not a preferred approach in such cases,due to loss of information it causes to the original data. Additionally, BN learningconsists of two separate processes, executed in a serial manner: the former is called‘structure learning’ and the latter is called ‘parameter estimation’. Structure learning isconsidered to be NP-hard Friedman and Koller (2003), since as the number of featuresgrows the number of candidate network structures increases super-exponentially to
123

598 M. Maragoudakis, D. Serpanos
huge numbers. For example a dataset of only 10 features would result in the evalua-tion of more than 15.000 possible network structures throughout the learning phase.Also, upon evaluating the most probable network structure, estimation of parameters(Conditional Probability Distributions (CPDs)) of each BN is carried out. Estimat-ing CPDs involves the calculation of p(Xi |parents(Xi )) for each of the features Xi
where parents(Xi ) refers to the set of parent nodes of Xi in the network. This willcause a larger number of calculations to take place.
Finally, a fourth obstacle in BN is the lack of orientation towards the class feature(which we want to be the root node in the estimated network, as stock course classi-fication is the primary aim of this research), which could pose significant problemsto the classification process. BN are, by principle, designed to allow for reasoningunder conditions of uncertainty. This does not necessarily mean that they are suitablefor classification. Since the class node is treated in the same way as all other nodes,a BN does not have special knowledge on the class feature and the topology is notoriented to allow for reasoning over the class label, given evidence of the values ofthe other features; therefore the class node will not be necessarily the root node in theestimated models. To summarize the main challenges and limitations of using BN forstock market classification are:
(a) BN cannot deal efficiently with high-dimensional datasets.(b) BN do not operate optimally when dealing with continuous variables.(c) BN learning of structure and CPD is prone to errors and ambiguity when dealing
with high-dimensional datasets and limited training samples, and can necessitatelarge amounts of calculations.
(d) BN are not oriented towards classification, so the networks estimated do not nec-essarily have the class node as root (which is essential for classification).
This paper makes a contribution in this area by presenting a BN analysis frame-work for identifying causal as well as independent relationships among features offinancial analysis, augmented by textual analysis features,which addresses the abovechallenges and limitations. In particular, similar to other machine learning approaches,but unlike most BN methods, we are handling features as continuous rather than dis-crete, addressing the above-mentioned challenge (b). Additionally, due to the highdimensionality nature of our dataset, exact computation of the CPDs is infeasible andcomputationally costly. Hence, the joint distribution is approximated by stochasticsimulation commonly referred to as “sampling”. Using Markov Chain Monte Carlo(MCMC) we can fit a distribution to the data that converges to the posterior distrib-ution (i.e. the distribution of the class, treated as a random variable, conditional onthe evidence obtained from the dataset) and retain the samples. MCMC can cope withdomains where the state space is vast (i.e. large number of features) with large numberof samples needed to approximate the probabilities reasonably well, by selecting eachsample using the previous sample resulting in the well-known Monte Carlo MarkovChain (MCMC) methods and its variants Pearl (2000). In this way we address theaforementioned challenges (a), (c) and (d). In particular, we propose a new approachto approximate the conditional probability distributions of complexBNusing aMCMCalgorithm. Our work is principally based upon a novel idea, in which the CPD compu-tation is based on the ordered ranking of a structure similar to traditional BNs, which is
123

Stock Market Analysis using MCMC Bayesian Inference 599
oriented towards classification. This structure is called Tree-Augmented Naïve Bayes(TAN) and unlike general, unrestricted BNs, in TAN the class node is the root node,i.e. the parent of all other nodes, which can form a BN among them, addressing inthis way challenge (d). This type of structure is proven to be more efficient than BNfor classification purposes Pearl (1988), since in traditional BN the class node is notconsidered as a special type of node, and it is treated as an ordinary one, so it mayeven not appear in the network resulting in a lack of classification capabilities. Thenwe use it in order to perform forecasting of the course of a stock, studying the impactthat textual features from financial news and from opinions in social media to standardtechnical indices features. Additionally, some widely used alternative classifiers havebeen applied to the same data for comparison purposes.
4 MCMC Bayesian Inference
In this section, the theoretical framework of MCMC sampling is outlined, with afocus on Gibbs sampling, a variation of MCMC, more suitable for DAG structures Liu(2001). Bayesian inference involves the mathematical integration of high-dimensionalprobability distributions, such as those for the task at hand. Nevertheless, this processis analytically intractable; therefore it is common to deploy Monte Carlo (MC) tech-niques.MC techniques are requiring sampling from the probability distributionswhichare to be integrated. However, in many cases, it is not possible to draw such samplesdirectly from the distributions. MCMCmethods provide a unified framework for cop-ing with such problems. The way they operate is twofold: at first, a Markov Chain isgenerated that converges to the target probability distribution. Subsequently, the targetsample values are obtained using Monte Carlo integration.
4.1 MCMC Methods
A probability distribution is specified through a DAGG (a set of interconnected nodes,each of which corresponds to one of the features) and a set of conditional probabilitydistributions S (parameters), one for each feature Xi (node) in G. A BN is actually aDAG G where the topology refers to its structure and the CPD is encoded as a table,named as CPT (Conditional Probability Table). By definition, in G, every node isconditionally independent of all other nodes given the set of its parents. The CPD of aBN is encompassing the probabilities of observing all values of feature (node) Xi , giventhe values of its parent nodes. Large network models will introduce more parameters,so exact computation will be infeasible and thus approximation of the CPD is achievedthrough sampling techniques. The structure of G is essential for sampling and can beobtained by applying a greedy search over the entire space of all possible structures.However, the number of possible DAG structures increases super-exponentially as thenumber of features grows, so greedy search on the space of all possible structures is notefficient as it requires too much computation. Several methodologies for alleviatingthis problem have been proposed, such as the K2 algorithm Heckerman (1999) or theBayesian Scoring Method Pearl (2000). In the following section, a description of the
123
600 M. Maragoudakis, D. Serpanos
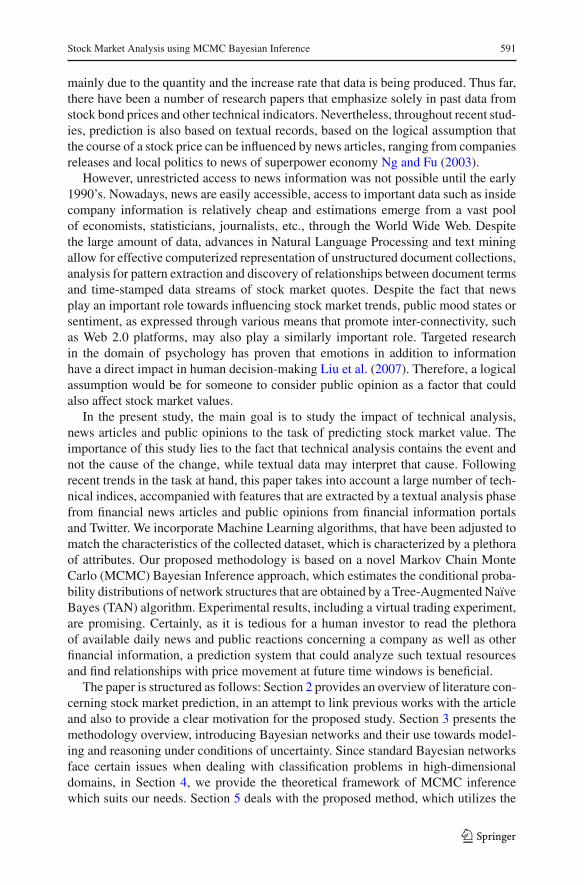
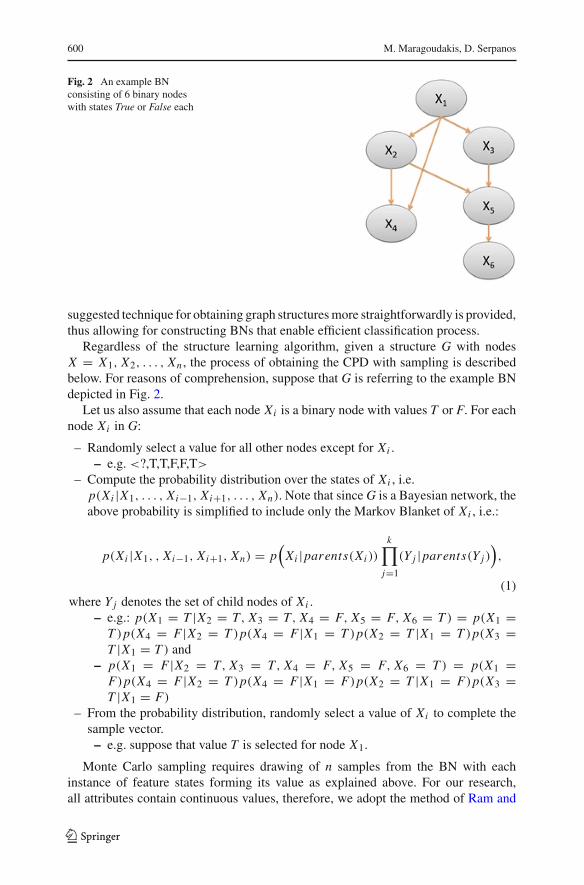
Fig. 2 An example BNconsisting of 6 binary nodeswith states True or False each
suggested technique for obtaining graph structuresmore straightforwardly is provided,thus allowing for constructing BNs that enable efficient classification process.
Regardless of the structure learning algorithm, given a structure G with nodesX = X1, X2, . . . , Xn , the process of obtaining the CPD with sampling is describedbelow. For reasons of comprehension, suppose that G is referring to the example BNdepicted in Fig. 2.
Let us also assume that each node Xi is a binary node with values T or F. For eachnode Xi in G:
– Randomly select a value for all other nodes except for Xi .– e.g. <?,T,T,F,F,T>
– Compute the probability distribution over the states of Xi , i.e.p(Xi |X1, . . . , Xi−1, Xi+1, . . . , Xn). Note that sinceG is a Bayesian network, theabove probability is simplified to include only the Markov Blanket of Xi , i.e.:
p(Xi |X1, , Xi−1, Xi+1, Xn) = p(Xi |parents(Xi ))
k∏j=1
(Y j |parents(Y j )),
(1)where Y j denotes the set of child nodes of Xi .
– e.g.: p(X1 = T |X2 = T, X3 = T, X4 = F, X5 = F, X6 = T ) = p(X1 =T )p(X4 = F |X2 = T )p(X4 = F |X1 = T )p(X2 = T |X1 = T )p(X3 =T |X1 = T ) and
– p(X1 = F |X2 = T, X3 = T, X4 = F, X5 = F, X6 = T ) = p(X1 =F)p(X4 = F |X2 = T )p(X4 = F |X1 = F)p(X2 = T |X1 = F)p(X3 =T |X1 = F)
– From the probability distribution, randomly select a value of Xi to complete thesample vector.– e.g. suppose that value T is selected for node X1.
Monte Carlo sampling requires drawing of n samples from the BN with eachinstance of feature states forming its value as explained above. For our research,all attributes contain continuous values, therefore, we adopt the method of Ram and
123

Stock Market Analysis using MCMC Bayesian Inference 601
Chetty (2008), meaning that we project all samples as a histogram and afterwards wesmooth the histogram to obtain the probability density function of the features of thedataset. In most approaches, the selection of a feature value is performed using thedistribution that best resembles the available data set. This approach is however notsuitable for large feature sets, such as the task at hand, because they tend to be slowand cannot converge to the actual posterior distribution. Therefore, a Markov ChainMonte Carlo (MCMC) approach is more preferable for approximating the challenginghigh dimensional distributions. The Gibbs sampler was chosen as an MCMC utiliza-tion method, because it is more suitable to DAG structures Liu (2001). Furthermore,a Gibbs sampler can allow for convergence in reasonable computation time and itsimplementation code is widely available in the academic community (e.g. WinBUGSLunn et al. 2000).
4.2 MCMC and Gibbs Sampling
Before describing the Gibbs sampler, a few introductory comments onMarkov Chainsare provided. Since Markov Chains by principle contain the concept of time, theyused to be mostly associated with applications of data mining and pattern recognitionwhich directly encompass this dimension, such as speech recognition and time seriesanalysis Nummelin (2004). However, Markov Chains could also be applied to BNsearch process, where each time step denotes a candidate network structure that isevaluated. In our approach, we design a Markov chain where each state is a full jointinstantiation of the distribution (i.e. values are assigned to all features of the network).Hence, a transition in time is a transfer from one joint instantiation to another. Thetarget sampling distribution is the posterior joint distribution P(x |e) where x is theclass feature and e is the set of evidence features. It is typically the unknown that wewant to evaluate. Let Xi
t denote the value of a random variable Xi at time (or step) t,and let the state space refer to the range of possible Xi values. This random variableis a Markov process if the transition probabilities between different values in the statespace depend only on the random variable’s current state, i.e.:
p(Xit+1 = s j X
i0 = sl , . . . , X
it = sk) = p(Xi
t+1 = s j |Xit = sk) (2)
In other words, for a random variable to be considered a Markov process, the onlyinformation about the past needed in order to predict the future is the current stateof it. Any knowledge about the values of earlier states does not affect the transitionprobability. A Markov chain refers to a sequence of random variables generated by aMarkov process. A particular chain is defined most critically by its transition matrixP( j → k), which is the probability that a process at state space s j moves to state skin a single step, i.e.:
P( j → k) = p(Xit+1 = sk |Xi
t = s j ) (3)
For reasons of readability, we shall simplify the notion of Xit into Xt to denote that a
random variable X takes a specific value at time t. Let π j (t) = p(Xt = s j ) denote theprobability that the chain is in state j at time t, and let π(t) denote the row vector of thestate space probabilities at step t.We start the chain by specifying a starting vectorπ(0).
123
602 M. Maragoudakis, D. Serpanos
Often, all the elements of π(0) are zero except for a single element of 1, correspondingto the process starting in that particular state. As the chain progresses, the probabilityvalues get spread out over the possible state space. Using matrix notation, we candefine the probability transition matrix P as the one whose element (i, j) denotes theP(i → j) transition kernel. The probability that the chain has state value si at time(or step) t + 1 is given by:
π(t + 1) = π(t)P = (π(t − 1)P)P = . . . = π(0)P(t+1) (4)
In other words, as the above equation implies, a Markov chain can reach a stationary(final) distributionπ∗, regardless of the selection for the initial distribution parameters.In order to explain this more systematically, consider a random process in which thestate S0 is initialized according to an initial distribution p0. On each time step t, withprobability γ we “stop” the chain and output the current state St . Moreover, withprobability 1 − γ , we will take a state transition step and sample St+1 accordingto the transition probabilities p(St+1|St ). Since the number of steps T is distributedaccording to a geometric distribution with parameter (1− γ ), the random state that isgenerated by this process will also be distributed according to π .
A straightforwardmethodof approaching this distribution includes sampling.Whilethere are numerous sampling strategies, the Gibbs sampler Liu (2001) is well-suitedfor DAGs, as we shall describe in the next paragraphs.
4.3 Gibbs Sampler
The main notion of this methodology is that only univariate conditional distributionsare taken into account, i.e. distributions where all of the random variables except forone are assigned fixed values. The reason for the above consideration lies to the factthat such conditional distributions are more straightforward to simulate than complexjoint distributions and usually have simpler forms. To introduce the Gibbs sampler,consider a bivariate random variable (x, y) and suppose we request the computationof one or both probabilities, p(x) and p(y). The idea behind the sampler is that itis far easier to consider a sequence of conditional distributions, p(x |y) and p(y|x),than it is to obtain the probability by integration of the joint density p(x, y), e.g.p(x) = ∫
(p(x, y)dy). The sampler starts with some initial value y0 for y and obtainsx0 by generating a random variable from the conditional distribution p(x |y = y0).Then, the sampler uses x0 to generate a new value of y1, drawing from the conditionaldistribution based on the value of x0, p(y|x = x0) and so forth. It proceeds as follows:
xi ∼ p(x |y = yi−1)
yi ∼ p(y|x = xi ) (5)
Repeating this process k times, generates a Gibbs sequence of length k, where asubset of points (x j , y j ) for i ≤ j ≤ m < k are taken as the simulated draws fromthe full joint distribution. To obtain the desired total of m sample points (here each“point” on the sampler is a vector of the two parameters), one samples the chain:
123

Stock Market Analysis using MCMC Bayesian Inference 603
(i) after a sufficient burn-in process (i.e. a number of initial samples to be removed dueto removal of the bad effects of the initial sampling values) and (ii) at set time points(say every n samples) following the burn-in phase. The Gibbs sequence converges to astationary distribution that is independent of the starting values, and by the principle ofMCMC, this stationary distribution is the target distribution we are trying to simulateLiu (2001).
5 Methodology Framework
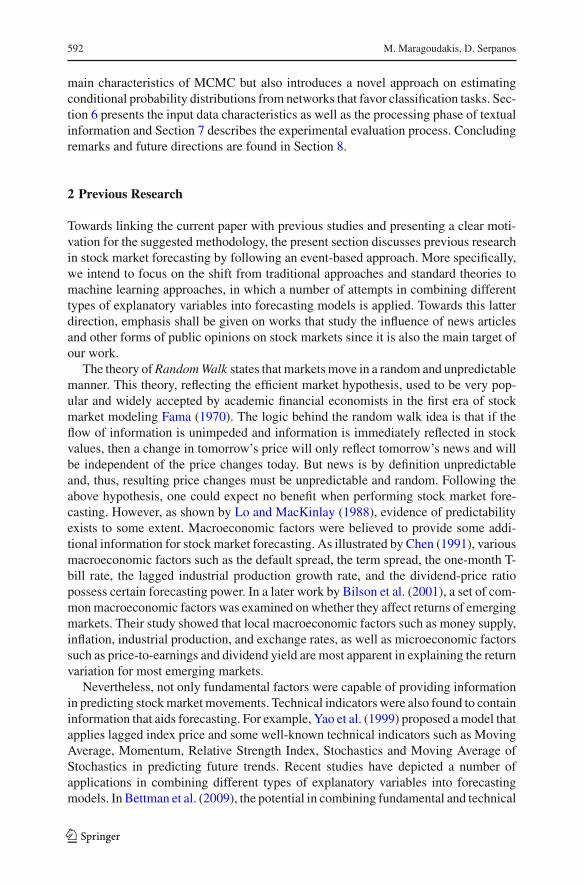
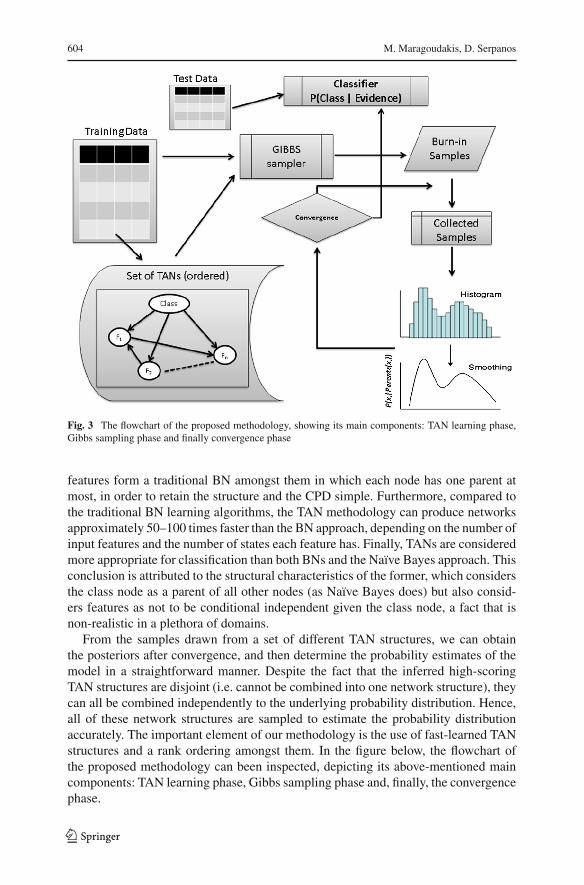
As mentioned above, one critical challenge is that in the occurrence of high-dimensional input vectors, the set of plausible networkmodels is large, thus a full com-parison of all the posterior probabilities associated to the candidate models becomesinfeasible. A solution to this can be grounded on the MCMCmethod and its variation,namely the Gibbs sampler. The proof is based on Markov chain theory, in particularon the fact that the probability of each individual state of a Markov process with pos-itive transition probabilities approaches a certain limit determined by the stationaritycondition. For each variable of the BN, this stationary distribution is identical withits posterior distribution Pearl (1988). Note, however, that a direct application of theabove algorithm for BN estimation within the stock market analysis domain faceslimitations, due to the high dimensionality of the data. This implies that the variancein the values taken by each variable is high and this phenomenon may obstruct theprocess of producing independent uniform samples. The suggested MCMC samplingframework, shown in Fig. 3, can overcome this limitation.
Initially inspired by the work of Ram and Chetty (2008), which proposed the useof an initial set of 10–20 dissimilar but high scoring BN (as regards to the probabilityof the network structure S given the input data D), the probability p(S|D) could beused for calculating the Bayesian posterior probability distribution of all features. Ourapproach is different than the previous one in two points: the former deals with thefact that considering the top-k ranked networks would result in obtaining very similarnetwork structures and therefore, would result in having a set of distributions withlimited variation. The reason is that when using traditional scoring algorithms, suchas K2 Heckerman (1999) or Bayesian Scoring Method Pearl (2000), each candidatenetwork is produced from the previous, most-likely one by performing simple graphoperation such as arc additions, removals or reversals. One possible solution would beto consider multiple and parallel search implementation, but this could create an extracomputational overhead. The latter aspect that our framework differs is the orientationtowards classification, which is not inherent in traditional BN approaches.
The approach of Ram and Chetty (2008) performs Bayesian inference on the classfeature given the set of input variables having simulated generic network structuresthat do not consider the class node as a special one. Our suggestion focuses on cre-ating simple and straightforward BN structures which are suitable for the classifica-tion process (nevertheless, the main goal is to predict the course of a stock). Suchclassification-oriented network structures are constructed using the Tree-AugmentedNaïve Bayes (TAN) algorithm Pearl (1988). By definition, the TAN algorithm createsnetworks where the class node is a parent of all features nodes. The rest of the input
123
604 M. Maragoudakis, D. Serpanos
Fig. 3 The flowchart of the proposed methodology, showing its main components: TAN learning phase,Gibbs sampling phase and finally convergence phase
features form a traditional BN amongst them in which each node has one parent atmost, in order to retain the structure and the CPD simple. Furthermore, compared tothe traditional BN learning algorithms, the TAN methodology can produce networksapproximately 50–100 times faster than the BN approach, depending on the number ofinput features and the number of states each feature has. Finally, TANs are consideredmore appropriate for classification than both BNs and the Naïve Bayes approach. Thisconclusion is attributed to the structural characteristics of the former, which considersthe class node as a parent of all other nodes (as Naïve Bayes does) but also consid-ers features as not to be conditional independent given the class node, a fact that isnon-realistic in a plethora of domains.
From the samples drawn from a set of different TAN structures, we can obtainthe posteriors after convergence, and then determine the probability estimates of themodel in a straightforward manner. Despite the fact that the inferred high-scoringTAN structures are disjoint (i.e. cannot be combined into one network structure), theycan all be combined independently to the underlying probability distribution. Hence,all of these network structures are sampled to estimate the probability distributionaccurately. The important element of our methodology is the use of fast-learned TANstructures and a rank ordering amongst them. In the figure below, the flowchart ofthe proposed methodology can been inspected, depicting its above-mentioned maincomponents: TAN learning phase, Gibbs sampling phase and, finally, the convergencephase.
123

Stock Market Analysis using MCMC Bayesian Inference 605
5.1 TAN Phase
Based on the following process, a set of 10 TAN network structures was produced:
1. Built a Naïve Bayesian structure, where the class node C is a parent to all featurenodes Xi and all feature nodes are not connected with each other.
2. For each pair of different features Xi , X j , compute the conditional mutual infor-mation given the class I (Xi ; X j |C), using the formula provided below:
(a) I (Xi ; X j |C) = ∑Xi ,X j ,C
p(Xi ,X j ,C)log(p(Xi ,X j |C))
p(Xi |C)p(X j |C)
3. Build a complete, undirected graph to connect all features and use I (Xi ; X j |C)
to weight all arcs.4. Build a maximum weighted spanning tree.5. Transform the resulting undirected tree to a directed one by choosing a root feature
and setting the direction of all edges to be outward from it.
For maximizing the performance of TAN, we applied a feature selection algorithmbased on SVM Bi et al. (2003) and eliminated the features that scored below 0.1, thusachieving a mean value of 40–60 % reduction in the number of input features for theTAN learner. According to the authors of the aforementioned article, feature selectionby SVM is more beneficial that other wrapper approaches such as Information Gainand Odds Ratio Brank et al. (2002) when being applied in high-dimensional datasets.
The different TAN structures were obtained by choosing different features as root,in the 5th step of the previously mentioned TAN algorithm. As mentioned above,an ordinary Gibbs sampler chooses features at random and then samples a new valuefrom the estimated posterior of the neighboring variables. Friedman and Koller (2003)argued that sampling from the space of total orders on variables rather than directlysampling DAGs was more efficient than application of ordinary MCMC directly inrandommanner. Since the Gibbs sampler also samples the new value of a feature basedon the parent variables, an ordering of the rank of the TANs, based on their scoreswas applied. The score of each network S is calculated as the probability of S givendataset D, p(S|D) and is given by the following formula Nummelin (2004):
p(S|D) =n∏
i=1
qi∏j=1
(ri − 1)!(Ni j + ri − 1)!
ri∏k=1
Ni jk ! (6)
where n equals to the number of features, ri denotes the number of values in the i thfeature, qi denotes the number of possible different value combinations the parentfeatures can take, Nij depicts the number of rows in data that have j th value combina-tions for parents of ith feature, Nijk corresponds to the number of rows that have kthvalue for the i th variable and which also have j th value combinations for parents ofi th variable.
Note that other graph scoring metrics could be used as well, such as the BIC-TAN measure, proposed by Chickering et al. (1995). The applied scoring metric waschosen because it is implemented in a variety of programming languages and is freelyavailable.
123

606 M. Maragoudakis, D. Serpanos
5.2 Gibbs Sampling Phase
For the Gibbs sampling phase, uniform prior distributions for all the features in thedomain needed to be defined. Instead of applying a random instantiation of the net-work, a multivariate Dirichlet distribution was chosen, inspired by Ram and Chetty(2008). The initial distribution of the values of nodes in the network was assignedby using the density function. It was estimated after smoothing of the histogram ofnormalized feature data. Since all nodes have parent(s), we sampled from the condi-tional distribution of their TAN. Similarly, n independent samples were drawn fromthe target distribution P(x). The samples collected were plotted using a histogramwith n bins as depicted in the figure of the flowchart above. The probability densityfunction P(x) of a continuous feature was approximated by smoothing the histogram.
5.3 Convergence Phase
Convergence is the process of reaching a stationary probability distribution. The initialphase of the convergence is called the burn-in phase. For the proposed approach,multiple TAN structures were fed to a parallelized series of Markov Chains, in orderto obtain a large number of samples from the entire input space of the domain. Recallthat each Markov Chain connects states of the network instantiation and samplingprocess. In other words, if S0 represents the first instantiation of features (X1 =x1, X2 = x2, . . . , Xn = xn) then we can sample a new value x1 for feature X1 usingp(X1 = x1|X2 = x2, . . . , Xn = xn). In similar manner, we can sample the remainingnew values for features X2, X3, . . . Xn until we have a new state S1, instantiated as:< X1 = x1, X2 = x2, . . . , Xn = xn >. In the above Fig. 4, a sample Markov Chainis depicted for a mock-up TAN structure, with two features, each being binary. Thechain represents four states for each instantiation of features X1 and X2.
Throughout the process of multiple chain runs, samples are exchanged between thechains and the overall samples of a number of variables in the top of the specifiedorder are monitored. When the sample values do not exceed a variation threshold(manually defined to 0.05) after a large number of iterations, convergence is assumed.Upon convergence on the stationary distribution, the process of classification of apreviously unseen example is straightforward. We only compute the probability ofthe class c given evidence e (expressed as an input vector of the considered featurevalues), calculated as p(c|e) and classify it to the most probable class.
6 Data Management
Asmentioned earlier, articles containing financial newswere combinedwith a plethoraof technical indices in order to search for direct influence patterns of the former to thelatter. More specifically, we focused on three heterogeneous stock securities from theGreek stock market (Athens Stock Exchange, .ATG), two large Greek banks (AlphaBank, .ALPHA and Eurobank Ergasias Bank, .EUROB), the principal telecommuni-cation provider of Greece (OTE, .OTE) and one of the biggest Greek airline companies(Aegean, .AEGN).We included past data from the major European, Asian and Ameri-
123

Stock Market Analysis using MCMC Bayesian Inference 607
Fig. 4 An example Markov Chain for a mock-up TAN structure—Each feature is instantiated to either true(highlighted circle) or false (non-highlighted circle) at each state
Table 1 The benchmark tickers
Name Category #Articles #Opinions Symbol
O.T.E. Telephony 2623 4250 .OTE
Alpha Bank Bank 1879 3014 .ALPHA
Eurobank Ergasias Bank 1988 3443 .EUROB
Aegean Airlines Airline 1013 1505 .AEGN
can stockmarkets, aswell as data fromenergy andmetal commodities. Finally, for eachof the aforementioned three stock securities, a variety of major technical indices wasemployed. News articles were automatically extracted from the electronic versions ofthe leading Greek financial newspapers, i.e. “Naftemporiki” (www.naftemporiki.gr)and “Capital” (www.capital.gr). Opinionswere also crawled from the afore-mentionedfinancial portals, as well as from Twitter, using the corresponding API and selectingposts that contained either the hashtag of each company or the name of it. The timeperiod for all collected data was from January 2013 to January 2014. The technicalindices were specified using the AnalyzerXL (www.analyzerxl.com) software tool.Table 1 tabulates data regarding the three benchmark stocks and their correspond-ing articles that were collected, while Table 2 presents historical data of other mainmarkets and commodities.
Tables 3 and 4 refer to metal and energy fuel data considered respectively andTable 5 depicts a categorized list of the technical indices and liquidity proxies thatwere also taken into consideration. As regards to the latter, given the inclusion of data
123

608 M. Maragoudakis, D. Serpanos
Table 2 Market and commodities data
Category Description #Days Symbol
European markets FCHI-CAC 40 index 212 .FCHI
FTSE-FTSE 100 index 215 .FTSE
GDAXI-Xetra dax index 207 .GDAXI
ATG-Athens stock exchange 211 .ATG
Asia/Pasific markets HIS-Hang Seng index 216 .HSI
AORD-All ordinaries index 169 .AORD
N225-Nikkei 225 average index 156 .N225
United States markets GSPC-S&P 500 index 158 .GSPC
IXIC-Nasdaq composite index 131 .IXIC
DJI-Dow Jones industrial average index 139 .DJI
Energy Brent DTD 166 BRT-
WTI CUSHING 121 WTC-
Metals Silver 187 XAG-HH
Gold bullion 187 XAU-B-HH
Table 3 Metals dataName Number of quotes
Silver 178
Gold bullion 178
Table 4 Energy fuel dataName Number of quotes
BRENT DTD 207
WTI CUSHING 202
series such as metals and commodities we considered useful to additionally includemeasures of liquidity, based on a rapidly growing literature that uses liquidity proxiesconstructed from low-frequency (daily) stock data Fong et al. (2011).
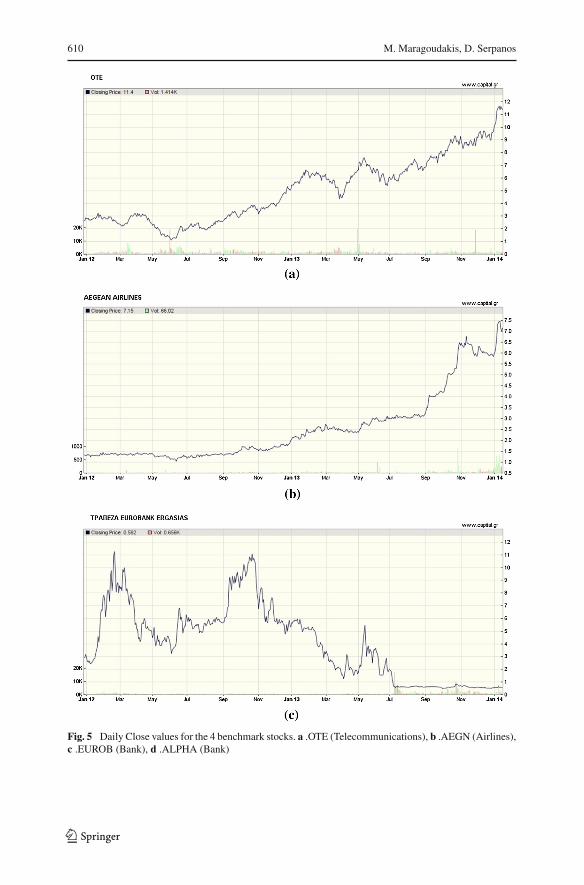
Stock quoteswere gathered on a per day basis and articles were aligned according totheir release date. In case an articlewas published on a Friday evening (after the closingof the Athens stock market) or during the weekend, it was considered as published onMonday. Figure 5 and its sub-figures, depict the closing values of each of the abovementioned stocks that were selected as evaluation data, along with volume data. Theleft axis symbolizes volume and the right axis represents the closing value in Euros.The impressive increase in the values of Eurobank (Fig. 5c) was caused due to thecancellation of a potential merging (announced on April 8, 2013) with another majorbank of Greece, named as National Bank of Greece (NBG). At the same period, aburst was also observed in terms of available news and comments for this company.While the mean value of the distributions for news was about 4.4 per day and about
123

Stock Market Analysis using MCMC Bayesian Inference 609
Table 5 Technical Indicescategorized list
Group name Function or indicator name
Basic functions Median price (AKA Typical PriceIndicator)
Statistical functions Standard deviation
Trend indicators MACD indicator
Simple moving average
Exponential moving average
Line weighted moving average
Volatility indicators Average true range
Bollinger band width
Liquidity proxies Amihud liquidity measure
LOT Mixed impact
Momentum indicators Williams %R
TRIX indicator
Wilder RSI indicator
Chande momentum oscillator
Price Rate-of-charge indicator
Cutler’s relative strength index
DX (Directional movement indicator)
Stochastic oscillator
Price oscillator percentage difference
Market strength indicators Chaikin A/D oscillator
Average of volume ROC
Market facilitation index (MFI)
Support and resistanceindicators
Envelope
14.2 for opinions, after the announcement of the cancellation of the merge and for aperiod of more than 20 days, the distributions were boosted to 25.5 and 123.5 for newsand opinions respectively.
6.1 Text Mining and Sentiment Annotation
The plethora of available text in general and news articles in particular nowadays hasshifted the focus of researchers to mining information from unstructured and semi-structured information sources. The text content of the latest news articles and financialreports is taken into account when trying to automatically predict stock behavior. Theweb sentiment, i.e. “positive”, “neutral” or “negative” content of web articles regard-ing a stock, has been exploited previously using a “bag-of-words” model or a moresophisticated language model Sehgal and Song (2007). Automated approaches to sen-timent analysis also include the use of Word Net in order to estimate the sentimentof words appearing in the text by measuring their semantic similarity with prototype
123
610 M. Maragoudakis, D. Serpanos
Fig. 5 Daily Close values for the 4 benchmark stocks. a .OTE (Telecommunications), b .AEGN (Airlines),c .EUROB (Bank), d .ALPHA (Bank)
123

Stock Market Analysis using MCMC Bayesian Inference 611
Fig. 5 continued
positive and negative words (e.g. “good” or “bad”). Due to the lack of such sophis-ticated resources for Modern Greek , in the present work the sentiment of a wordis determined manually, by a financial analysis expert, and the cumulative weight ofword sentiments is used to estimate the sentiment of the entire text. The words in theacquired lexicon with an occurrence frequency of at least five times have been seman-tically annotated by domain experts, according to their positive or negative meaningfor stock value prediction. One of five discrete weights, i.e. −2 (clearly negative), −1(relatively negative), 0 (neutral), +1 (relatively positive), +2 (clearly positive) wasassigned to each word. The aforementioned weighting scheme was previously appliedby Klibanoff et al. (1998) and provided satisfactory results. The reason for selectingfive as a threshold of term frequency was mainly attributed to the fact that it balancesthe number of extracted words with the painstaking process of manual annotation bythe domain expert. Table 6 displays the ten most frequent words for each semanticlabel. The textual analysis phase consisted of three activities:
1. Removal of stop words (i.e. words that are filtered out since they do not provideany special meaning to the text mining concept. Usually they contain articles,pronouns, special characters, etc.)
2. Lemmatization (i.e. the process of grouping together the various inflected formsof a word so they can be analyzed as a single item) of words using a Levenshteindistance based Greek lemmatizer Lyras et al. (2007).
3. Removal of terms appearing less than 30 times within the complete article corpusand taking the 150 most frequent of them.
Manual consideration of a sentiment lexicon has some drawbacks. Lexical ambigu-ity is a common problem even for Greek, despite the fact that it is highly inflectional.Furthermore, the sentiment of a given term could change over time. For example,the term K υπρoυ (Cyprus) could intuitively associated with a negative sentiment,mainly due to the latest economic events. In our case the same term was considered asneutral because at the time of creation, the domain expert was not aware of the futureproblems. Finally, the context within a word also influences the sentiment, particularly
123

612 M. Maragoudakis, D. Serpanos
Table 6 A sample of frequent terms and their annotated weight
+2 +1 0 -1 -2Κέρδος (Profit) Έσοδο (Income) Ευρώ (Euro) Κόστος (Cost) Μείωση (Decrease)Αύξηση (Increase) Χορήγηση (Sponsorship) Πειραιώς (Piraeus) Χαμηλός (Low) Κρίση (Crisis)Ανάπτυξη (Development) Κατάθεση (Deposit) Τράπεζα (Bank) Κρίσιμος (Critical) Απώλεια (Loss)Κερδοφορία (Profit) Υψηλός (High) Εκατ (Million) Πρόβλημα (Problem) Πτώση (Drop)Άνοδος (Ascension) Ισχυρός (Strong) Μετοχές (Stock) Πίεση (Pressure) Επιβράδυνση (Deceleration)Βελτίωση (Improvement) Επέκταση (Expansion) Δις (Billion) Υποχώρηση (Retreat) Υποβάθμιση (Degradation)Θετικός (Positive) Απόδοση (Yield) Τιμή (Value) Έκτακτος (Unscheduled) Ζημιά (Damage)Αναβάθμιση (Upgrade) Ενδιαφέρον (Interest) Κύπρου (Cyprus) Καθυστέρηση (Delay) Κίνδυνος (Danger)Επιτυχία (Success) Προσφορά (Offer) Ανακοίνωση (Announcement) Επίπτωση (Consequence) Αρνητικός (Negative)Ενίσχυση (Strengthening) Συμφωνία (Agreement) Αγορά (Buy) Δύσκολος (Difficult) Επιδείνωση (Deterioration)
when dealing with social media content. For example, in ordinary situations the termAναπτυξη (Development) is definitely positive. However, inmany socialmedia poststhis is often written together with emoticons (i.e. pictorial representation of a facialexpression) that denote irony or frustration, as “Development” was a main politicalslogan by the Greek government during the austerity period that faced significant con-troversy by citizens. Certainly, the constant update of such domain-specific lexiconsis of major importance, particularly for language with limited linguistic resources.
The class attribute to be predicted was set to the closing value of the followingday. Since the proposed method is suited for nominal classification, we discretized theclass attribute from numerical into nominal according to the following rule: A valuefrom a set of three discrete labels, namely UP, STEADY and DOWN is chosen, if thestock quote closed at a price more than 1 %, between 1 and −1 % and less than −1%in the following day respectively. A window of five days was chosen empirically inorder to predict the class, resulting in a high-dimensional dataset of more than 720features.
Table 7 summarizes the properties of the system described above. It is organized infour parts: The first part provides a rough idea about our prototype, the second partsdetails the parameter settings for the techniques used, the third part summarizes thedata used for training, and the final part gives an overview of the major performancefigures reported, explained in more details in the following section.
7 Experimental Results
Textual as well as stock quotes data was processed by our proposed methodology(MCMC-TAN) and evaluated against several well known classifiers that are eitherused in previous researches or are well-known for their robustness when dealingwith high-dimensional data. More specifically, we considered the traditional NaïveBayesian classifier (NB), an ensemble algorithm named as Random Forests (RF), pro-posed by Breiman (2001), which is proved to perform feature selection, Radial BasisFunctions neural network (RBF) that has two layers and is a special class of multi-layered feed forward networks. Finally, the last benchmarking algorithm used in ourevaluation is a well-known machine learning classifier that has previously applied ina plethora of financial forecasting applications Huang et al. (2005), namely SupportVector Machines (SVM). Following the suggestion of Huang et al. (2005), a radialkernel was utilized in the case of SVM.
123

Stock Market Analysis using MCMC Bayesian Inference 613
Table 7 Summarized propertiesof our prototype
Prototype idea
Aims to forecast... Price trends
Underlying Technical indices
Forecast horizon 24 h
Text mining
Feature definition Manually
Number of features 150
Feature granularity Words
Primary classifier MCMC-TAN
Number of class labels 3
Stock Market Parameters
Number of Features 42
Input data
Information age 0–24 h
Text analyzed Head/body
Labeling Manually
Price frequency Daily close
Test set
Period January 2013 to January 2014
Training/Test ratio 10-fold cross validation
Market 4 stocks (Athens StockExchange—Greece)
Prototype accuracy versusRegression model
20.6 % gain
Note that some of the aforementioned algorithms, including the proposed methodof MCMC-TAN work well in discrete valued labels and some other operate solelywith numerical labels. More specifically, MCMC-TAN, NB and RF were tested onthe discretized data set, where the class attribute contained one of the three nominalvalues. RBF and SVM require a numerical label, therefore, in this case, the predictedvalue was compared to the actual value of the previous day and according to theirdifference, the forecast was discretized based on the approach described earlier (i.e.UP, STEADY and DOWN).
Regarding the experimental design, two different approaches were followed:Experiment 1: In order to evaluate the impact of articles on the predictability
of a stock closing trend (i.e. UP, STEADY, DOWN), the former approach dealt withstandard, 10-fold cross validation, classification in terms of stock quotes closing price,using:
(a) a dataset that contained only technical analysis indices (TA),(b) a dataset that contained technical analysis indices and news articles (TA-NA),(c) a dataset that consisted of (b) plus public opinions from users (TA-NA-PO) and,
finally,(d) a dataset that contained technical analysis indices plus opinions (TA-PO).
123

614 M. Maragoudakis, D. Serpanos
Table 8 Confusion matrix and Recall and Precision metrics for each class (T and F)
Predicted as... Precision T Recall T Precision F Recall F
T F aa+c
aa+b
db+d
dc+d
Actual class T a b f-measure: 2 × (precision × recall)precision+recall
F c d
In order to evaluate the performance of the aforementioned algorithms, the F-measure measurement was used, which is the harmonic mean of precision and recall,two fundamental metrics of data mining algorithms as regards to classification eval-uation. In particular, the precision metric of a classifier about a class label is definedas the percentage of correctly classified instances among those that the algorithmclassifies to belong to this class. The recall of a class is then defined as the fractionof correctly classified in it instances among all instances that actually belong to thisclass. These definitions are illustrated in the following Table 8 showing a “confusionmatrix” which tabulates the classification performance of an algorithm (the columnsof the table) against the actual class distribution (the rows of the table) for a binaryclassification problem (classes T and F). Lower case letters a,b,c and d represent thenumber of times (an integer value) an instance belonging to an actual class (either Tor F) was predicted to belong to the same or a different class.
Two additional model performance measures that are common in forecasting appli-cations (e.g. Clark and McCracken (2013) and West (2006)) have been taken intoconsideration, namely Mean Absolute Error (MAE) and Root Mean Squared Error(RMSE). The former is defined by:
MAE = 1
n
n∑i=1
|Pi − Ti | (7)
where Pi is the value that the model predicted for the i t h sample (from a set ofn examples) and Ti is the target value for that same example. Similarly, the lattermeasure is calculated by:
RSME =√∑n
i=1(Pi − Ti )2
n(8)
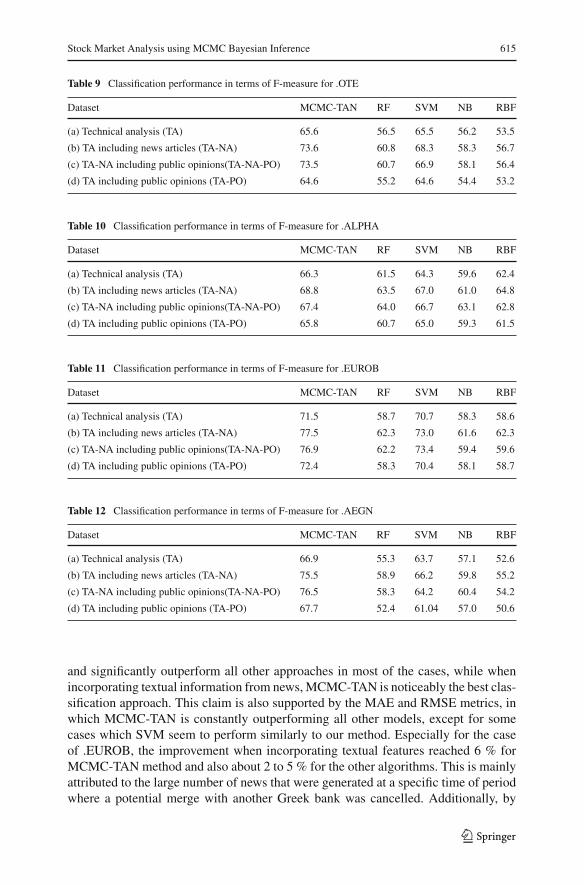
Tables 9, 10, 11 and 12 tabularize the F-measure score of all machine learningalgorithms for each of the four experimental stocks. Correspondingly, Figs. 6 and 7illustrate the MAE and RMSE of each algorithm against each stock and each datasetrespectively.
From the outcomes of the F-measure as well as the MAE and RMSE, we couldinitially observe that combining information from both time series and textual dataleads to a substantial improvement of forecast for all adopted methodologies. Further-more, by using only technical analysis data, SVM perform similar to MCMC-TAN
123
Stock Market Analysis using MCMC Bayesian Inference 615
Table 9 Classification performance in terms of F-measure for .OTE
Dataset MCMC-TAN RF SVM NB RBF
(a) Technical analysis (TA) 65.6 56.5 65.5 56.2 53.5
(b) TA including news articles (TA-NA) 73.6 60.8 68.3 58.3 56.7
(c) TA-NA including public opinions(TA-NA-PO) 73.5 60.7 66.9 58.1 56.4
(d) TA including public opinions (TA-PO) 64.6 55.2 64.6 54.4 53.2
Table 10 Classification performance in terms of F-measure for .ALPHA
Dataset MCMC-TAN RF SVM NB RBF
(a) Technical analysis (TA) 66.3 61.5 64.3 59.6 62.4
(b) TA including news articles (TA-NA) 68.8 63.5 67.0 61.0 64.8
(c) TA-NA including public opinions(TA-NA-PO) 67.4 64.0 66.7 63.1 62.8
(d) TA including public opinions (TA-PO) 65.8 60.7 65.0 59.3 61.5
Table 11 Classification performance in terms of F-measure for .EUROB
Dataset MCMC-TAN RF SVM NB RBF
(a) Technical analysis (TA) 71.5 58.7 70.7 58.3 58.6
(b) TA including news articles (TA-NA) 77.5 62.3 73.0 61.6 62.3
(c) TA-NA including public opinions(TA-NA-PO) 76.9 62.2 73.4 59.4 59.6
(d) TA including public opinions (TA-PO) 72.4 58.3 70.4 58.1 58.7
Table 12 Classification performance in terms of F-measure for .AEGN
Dataset MCMC-TAN RF SVM NB RBF
(a) Technical analysis (TA) 66.9 55.3 63.7 57.1 52.6
(b) TA including news articles (TA-NA) 75.5 58.9 66.2 59.8 55.2
(c) TA-NA including public opinions(TA-NA-PO) 76.5 58.3 64.2 60.4 54.2
(d) TA including public opinions (TA-PO) 67.7 52.4 61.04 57.0 50.6
and significantly outperform all other approaches in most of the cases, while whenincorporating textual information from news,MCMC-TAN is noticeably the best clas-sification approach. This claim is also supported by the MAE and RMSE metrics, inwhich MCMC-TAN is constantly outperforming all other models, except for somecases which SVM seem to perform similarly to our method. Especially for the caseof .EUROB, the improvement when incorporating textual features reached 6 % forMCMC-TAN method and also about 2 to 5 % for the other algorithms. This is mainlyattributed to the large number of news that were generated at a specific time of periodwhere a potential merge with another Greek bank was cancelled. Additionally, by
123

616 M. Maragoudakis, D. Serpanos
Fig. 6 Radar Plot of MAE for all models against all datasets per stock quote
observing the outcomes of Tables 9, 10, 11 and 12, one could observe that the perfor-mance ofMCMC-TANare one of the highest ever reported,with the drawbackof a timeand resource consuming training phase. Training times for each algorithm are reportedin the following sub-section. Despite of the initial assumption that public opinion mayplay an important role to the task of classifying stockmarket trends, results do not sup-port this claim. In the majority of cases, comments do not seem to affect accuracy in aclear positive or negative manner, meaning that in some cases there is a gain from 1 to2% but there are also cases where one could observe loss by the same range. The sameapplies when public opinions are combined with technical analysis indices without thenews, i.e. performance ismore or less the sameor evenworse.Acloser lookonopinionscrawled from Twitter in problematic cases revealed two observations. First, numerouspostswere simply re-transmitting previous posts (i.e. re-tweet). Second, themajority oftweets used abbreviations, idioms, emoticons and other peculiar linguistic expressionswhich were not captured by our limited lexicon-based text mining approach. Finally,a potential logical explanation could be the argument that most of public opinionsare mainly triggered by the events that are already described in news, therefore, thelatter are the main form of expressing an event and opinions may act supplementary.Nevertheless, in order to fully support this claim, advanced text mining techniquesshould be applied to social media opinions, which is not a straightforward approach,especially for languageswith limited lexical and syntactical resources, such asModernGreek.
123

Stock Market Analysis using MCMC Bayesian Inference 617
Fig. 7 Radar Plot of RMSE for all models against all datasets per stock quote
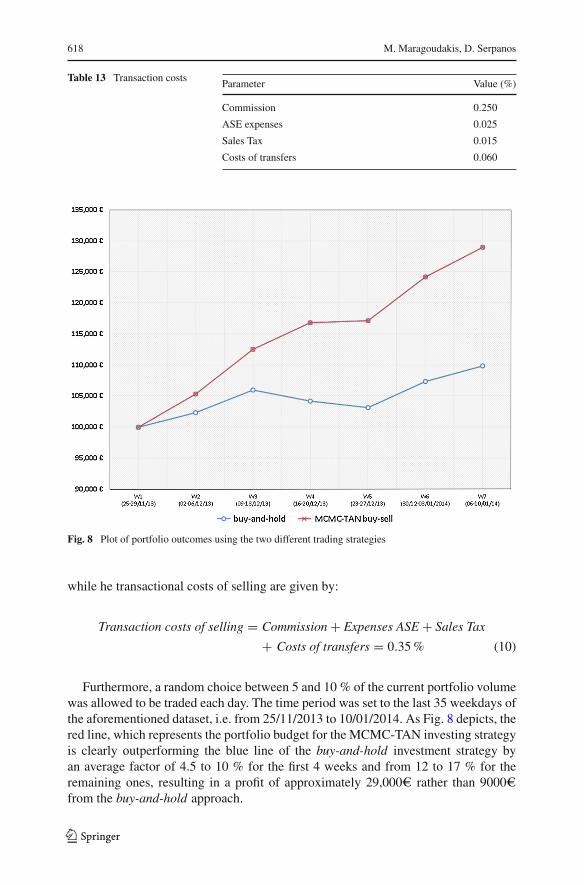
Experiment 2: The latter experimental design focused on a simulated trading strat-egy, in an attempt to further study whether the MCMC-TAN model could practicallybe applied to generate higher profits than those earned by employing the traditionalregression model by simply following a buy-and-hold (passive) investment strategy.The operational details of the trading simulation are explained as follows: The tradingsimulation assumes that the investor has 1,00,000e to create a portfolio by select-ing a balanced percentage of each of the four Greek stock quotes mentioned earlier.Each day, the investor could buy, sell or wait, according to the class prediction of theMCMC-TAN model, trained for case (b) where all technical indices were combinedwith news articles (i.e. the TA-NA dataset), since that was the model with the highestrankings in prediction accuracy. This strategy is most suitable for the assumption ofbuying long at open rather than selling short. Despite the fact that themethodology thatwould be employed in the latter case is analogous to the former, short selling usingmachine learning approaches is a process that requires a larger number of traininginstances and a broader forecasting horizon (e.g. weeks instead of days). We assumedthat transactional costs apply when buying or selling, according to Table 13. As onecould observe, no short-selling costs have been taken into account. More specifically,the transactional costs of buying are estimated according to formula:
Transaction costs of buying = Commission + Expenses ASE
+Costs of transfers = 0.335% (9)
123
618 M. Maragoudakis, D. Serpanos
Table 13 Transaction costsParameter Value (%)
Commission 0.250
ASE expenses 0.025
Sales Tax 0.015
Costs of transfers 0.060
Fig. 8 Plot of portfolio outcomes using the two different trading strategies
while he transactional costs of selling are given by:
Transaction costs of selling = Commission + Expenses ASE + Sales Tax
+ Costs of transfers = 0.35% (10)
Furthermore, a random choice between 5 and 10 % of the current portfolio volumewas allowed to be traded each day. The time period was set to the last 35 weekdays ofthe aforementioned dataset, i.e. from 25/11/2013 to 10/01/2014. As Fig. 8 depicts, thered line, which represents the portfolio budget for the MCMC-TAN investing strategyis clearly outperforming the blue line of the buy-and-hold investment strategy byan average factor of 4.5 to 10 % for the first 4 weeks and from 12 to 17 % for theremaining ones, resulting in a profit of approximately 29,000e rather than 9000efrom the buy-and-hold approach.
123

Stock Market Analysis using MCMC Bayesian Inference 619
Table 14 Training time foreach algorithm
Methodology Training time (min)
Markov Chain MonteCarlo TAN (MCMC-TAN)
25.1
Random forests (RF) 1.7
Support vector machines (SVM) 2.5
Naïve Bayesian classifier (NB) 0.6
Radial basis functions (RBF) 2.4
7.1 Training Time
The experimental section concludes with a comparison of training time of all method-ologies for each evaluation approach. Time is measured in seconds. The hardwareconfiguration of the setting includes a modest PC of an Intel-I5� quad-core proces-sor at 2.4 GHz with 6GB of RAM (5GB usable by the algorithms). MCMC-TAN isobviously the slowest of the selected algorithms as regards to training time. This isattributed to the time consuming process of finding the most probable Bayesian net-work structure, from which the MCMC step is initiated at each run. Note however,that this process is executed in an off-line manner, while the improvement of accu-racy is of major importance, especially in financial domains, and finally, this processcould straightforwardly be parallelized as in each run, different instances are selectedfor Bayesian network training. Table 14 tabularizes the elapsed time during the train-ing stage (evaluating the class label of a previously unseen instance was performedinstantaneously for each algorithm, therefore, it is not considered).
8 Concluding Remarks
The present article considered a novel Markov ChainMonte Carlo (MCMC) BayesianInference approach, which estimates conditional probability distributions in struc-tures obtained from a Tree-Augmented Naïve Bayes (TAN) algorithm. The proposedmethodology can handle datasets characterized by numerous continuous input fea-tures; it addresses the inherent limitations and challenges of using BN for such stockmarket forecasting problems. The proposed technique has been used for the stockmarket forecasting, a dynamic and volatile domain of high dimensionality, due tothe fact that recent trends in stock market analysis pose the use of textual informa-tion apart from technical indices. Additionally, the influence of opinionated texts asexpressed in variousWeb 2.0 platforms has been also taken into consideration. For thispurpose, technical analysis indices have been expanded to include market and com-modities data, financial news articles and opinions of users have been analysed usingsimple sentiment tagging approaches. Studies on four different Greek companies haveresulted in various datasets, which are combinations of the above features, mirroringthe course of each company as regards to its closing stock value from January 2013to January 2014.
123
620 M. Maragoudakis, D. Serpanos
This first prototype gave encouraging results, taking into account the high levelsof noise such as the heterogeneity of our dataset (in terms of acquisition method andconditions) adds and the difficulties this creates for forecasting. In particular, the pro-posed ensemble classification technique exhibited a higher classification performancethan the traditional machine learning algorithms. Results support the claim that incor-poration of financial news as a source of information may play a significant role tothe improvement of forecasting, while this did not seem to validate for the case ofpublic opinions. However, despite the fact that a plethora of sentiment-related featureswere manually annotated, we believe that by utilizing sophisticated Natural LanguageProcessing tools forModernGreek could automate the laborious tasks of hand-labelingfeatures and also improve results.Taking into account the increasing trend for the elec-tronic/digital acquisition of various data from financial resources, the development ofsuch advanced and high performing classification techniques contributes to the emer-gence of the ‘intelligent’ investing tools. Further research is required for validation ofthis potential in other financial problems using various types of features will probablylead to improvement of the proposed technique.
An important drawback is obviously the time consuming process of the MCMCinference stage, at each TAN construction phase. Even though this process can beparallelized and improved, and even though testing an unknown instance is a rapidprocess, we believe that when the learning phase is improved our technique could beapplied to datasets of massive volume of features. In addition to supervised classifica-tion, the idea of using semantic random sampling of features instead of simple randomsampling has the potential to be effective in the unsupervised classification problemas well. It is our future plan to continue developing this work in that direction.
References
Atsalakis, G., & Valavanis, K. (2009). Surveying stock market forecasting techniques - Part II: Soft com-puting methods. Expert Systems with Applications, 36, 5932–5941.
Bebarta, D. K., Biswal, B., & Dash, P. K. (2012). Comparative study of stock market forecasting usingdifferent functional link artificial neural networks. International Journal of Data Analysis Techniquesand Strategies, 4(4), 398–427.
Bettman, J. L., Sault, S. J., & Schultz, E. L. (2009). Fundamental and technical analysis: Substitutes orcomplements. Accounting and Finance: ACCOUNT FINANC, 49(1), 21–36.
Bi, J., Bennett, K., Embrechts, M., Breneman, C., & Song, M. (2003). Dimensionality reduction via sparsesupport vector machines. Journal of Machine Learning Resources, 3(Mar), 1229–1243.
Bilson, C. M., Brailsford, T. J., & Hooper, V. J. (2001). Selecting macroeconomic variables as explanatoryfactors of emerging stock market returns. Pacific-Basin Finance Journal, 9(4), 401–426.
Bollen, J., Mao, H., & Pepe, A. (2010). Determining the public mood state by analysis of microbloggingposts. In Proceedings of the Alife XII Conference, Odense, Denmark. MIT Press.
Brank, J., Grobelnik, M., Milic-Frayling, N., &Mladenic, D. (2002). Feature selection using support vectormachines. Proceedings of the 3rd international conference on data mining methods and databases forengineering, finance, and other fields. September 2002, Bologna, Italy.
Breiman, L. (2001). Random forests. Machine Learning, 45, 5–32.Chan, Y., & John-Wei, K. C. (1996). Political risk and stock price volatility: The case of Hong-Kong.
Pacific-Basin Finance Journal, 4(2–3), 259–275.Chandra, D. K., Ravi, V., & Ravisankar, P. (2010). Support vector machine and wavelet neural network
hybrid: Application to bankruptcy prediction in banks. International Journal of Data Mining, Mod-elling and Management, 2(1), 1–21.
123

Stock Market Analysis using MCMC Bayesian Inference 621
Chen, N. (1991). Financial investment opportunities and the macroeconomy. The Journal of Finance, 46(2),529–554.
Chickering, D., Geiger, D., & Heckerman, D. (1995). Learning Bayesian networks: Search methods andexperimental results. In Proceedings of 5th conference on artificial intelligence and statistics (pp.112–128). Fort Lauderdale, FL.
Cho, V. (1999). Knowledge discovery from distributed and textual data. Hong Kong: Dissertation HongKong University of Science and Technology.
Chung, F., Fu, T. Luk, R. & Ng, V. (2002). Evolutionary time series segmentation for stock data mining, InProceedings of IEEE international conference on data mining, pp. 83–91. Larnaca.
Clark, T. E., & McCracken, M. W. (2013). Testing for unconditional predictive ability. In G. Elliott & A.Timmermann (Eds.), Handbook-of-economic-forecasting (Vol. 2). North-Holland: Elsevier.
Falinouss, P. (2007). Stock trend prediction using news articles: A text mining approach, Master’s Thesis,Lulea University of Technology.
Fama, Eugene. (1970). Efficient capital markets: A review of theory and empirical work. Journal of Finance,25, 383–417.
Fellbaum, Christiane (Ed.). (1998).WordNet: An electronic lexical database. Cambridge, MA: MIT Press.Fong, K., Holden, C., & Trzcinka, C. (2011). What are the best liquidity proxies for global research?.
Available at SSRN: http://ssrn.com/abstract=1558447Friedman, N., & Koller, D. (2003). Being Bayesian about network structure: A Bayesian approach to
structure discovery in Bayesian networks. Machine Learning, 50, 95–126.Fung, G.P.C., Yu, J.X., & Lam, W. (2003). Stock prediction: Integrating text mining approach using real-
time news. In Proceedings IEEE international conference on computational intelligence for financialengineering (pp. 395–402). Hong Kong.
Heckerman, D. (1999). A tutorial on learning with Bayesian networks. In M. Jordan (Ed.), Learning ingraphical models. Cambridge: MIT Press.
Huang,W., Nakamori, Y., &Wang, S.-Y. (2005). Forecasting stockmarket movement directionwith supportvector machine. Computer and Operations Research, 32, 2513–2522.
Jayech, S., & Zina, N. B. (2012). Measuring Financial contagion in the stock markets using a copulaapproach. International Journal of Data Analysis Techniques and Strategies, 4(2), 154–180.
Klibanoff, P., Laymont, O., &Wizman, T. A. (1998). Investor reaction to Salient news in closed-end countryfunds. Journal of Finance, 53(2), 673–699.
Kumar, D. A., & Ravi, V. (2008). Predicting credit card customer churn in banks using data mining.International Journal of Data Analysis Techniques and Strategies, 1(1), 4–28.
Liu, J. S. (2001).Monte Carlo strategies in scientific computing. Heidelberg: Springer.Liu, Y., Huang, X., An, A., & Yu, X. (2007). ARSA: a sentiment-aware model for predicting sales perfor-
mance using blogs. New York, NY: ACM.Lo, A. W., & MacKinlay, A. C. (1988). Stock market prices do not follow random walks: Evidence from a
simple specification test. The Review of Financial Studies, 1(1), 41–66.Lunn, A., Thomas, G., Best, H., & Spiegelhalter, D. (2000). WinBUGS - A Bayesian modeling framework:
Concepts, structure, and extensibility. Statistics and Computing, 10, 325–337.Lyras, D., Sgarbas, K., & Fakotakis, D. (2007). Using the Levenshtein edit distance for automatic lemmati-
zation: A case study for modern greek and english, 19th IEEE international conference on tools withartificial intelligence (Vol. 2, pp. 428–435). Patras.
Mitchell, M. L., & Mulherin, J. H. (2002). The impact of public information on the stock market. Journalof Finance, 49(3), 923–950.
Mittermayer, M.A. (2004). Forecasting intraday stock price trends with text mining techniques. In Proceed-ings of the 37th annual Hawaii international conference on system sciences (HICS). IEEE ComputerSociety (vol. 3(3), 30064.2.) Washington, DC.
Ng, A., & Fu, A.W. (2003). Mining frequent episodes for relating financial events and stock trends. InProceedings of the 7th Pacific-Asia conference on advances in knowledge discovery and data mining,lectures notes in computer science (vol. 2637, pp. 27–39). Seoul.
Nummelin, E. (2004). General irreducible Markov chains and non-negative operators. Cambridge: Cam-bridge University Press. 1984.
Nunez-Letamendia, L., Pacheco, J., & Casado, S. (2011). Applying genetic algorithms to wall street.International Journal of Data Mining, Modelling and Management, 3(4), 319–340.
123
622 M. Maragoudakis, D. Serpanos
Oyatoye, E. O., & Arilesere, W. O. (2012). A non-linear programming model for insurance companyinvestment portfolio management in nigeria. International Journal of Data Analysis Techniques andStrategies, 4(1), 83–100.
Pearl, J. (1988).Probabilistic reasoning in intelligent systems: Networks for plausible inference. SanMateo:Morgan Kaufmann.
Pearl, J. (2000). Causality: Models, reasoning and inference. Cambridge: Cambridge University Press.Preis, T., Moat, H.S. & Stanley, H.E. (2013). Quantifying trading behavior in financial markets using google
trends, Scientific Reports, 3.Ram, R., Chetty, M. (2008). Constraint minimization for efficient modeling of gene regulatory network.
In: M. Chetty, A. Ngom, S. Ahmad (Eds.) PRIB 2008. LNCS (LNBI) (vol. 5265, pp. 201–213)Heidelberg:Springer.
Sehgal, V., & Song, C. (2007). SOPS: Stock prediction using web sentiment. Proceedings of the 7th IEEEinternational conference on data mining workshops. Los Alamitos, CA.
Shumaker, R.P., &Chen,H. (2006). Textual analysis of stockmarket prediction using financial news articles,On the 12th American conference on information systems (AMCIS).
Technical-analysis. The trader’ s glossary of technical terms and topics. (2005). http://www.traders.comThomas, J.D., & Sycara, K. (2000). Integrating genetic algorithms and text learning for financial prediction.
In: Proceedings GECCO-2000 workshop on data mining with evolutionary algorithms (pp. 72–75).Las Vegas.
Vasu, M., & Ravi, V. (2011). A hybrid under-sampling approach for mining unbalanced datasets: Applica-tions to banking and insurance. International Journal of Data Mining, Modelling and Management,3(1), 75–105.
West, K. D. (2006). Forecast evaluation. InG. Elliott, C.W. J. Granger, &A. Timmermann (Eds.),Handbookof-economic-forecasting (Vol. 1). North-Holland: Elsevier.
Wuthrich, B., Cho, V., Leung, S., Peramunetilleke, D., & Sankaran, K. (1998). Daily prediction of majorstock indices from textual WWW data. In J. Zhang, W. Lam (Eds.) Proceedings 4th ACM SIGKDDinternational conference on knowledge discovery and data mining (pp 364–368). New York.
Xidonas, P., Ergazakis, E., Ergazakis, K., Metaxiotis, K., & Psarras, J. (2009). Evaluating corporate per-formance within the frame of the expert systems technology. International Journal of Data Mining,Modelling and Management, 1(3), 261–290.
Yao, J., Tan, C. L., & Poh, H. (1999). Neural networks for technical analysis: A study onKLCI. InternationalJournal of Theoretical and Applied Finance, 2(2), 221–241.
123