explicit precipitation-type diagnosis from a model using a
TRANSCRIPT
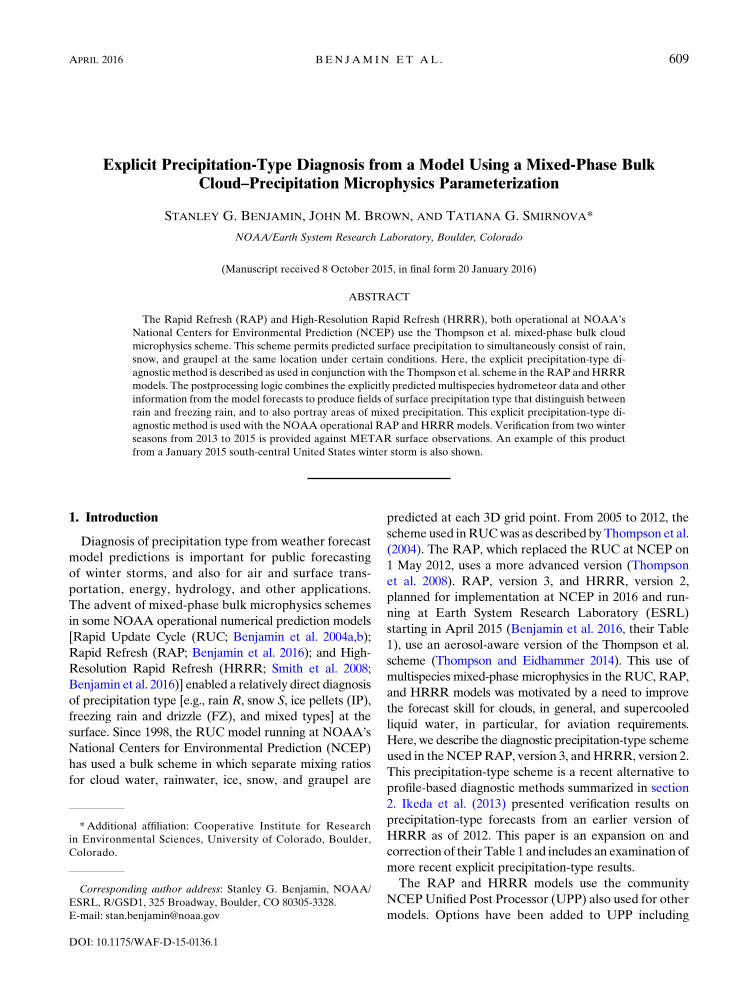
Explicit Precipitation-Type Diagnosis from a Model Using a Mixed-Phase BulkCloud–Precipitation Microphysics Parameterization
STANLEY G. BENJAMIN, JOHN M. BROWN, AND TATIANA G. SMIRNOVA*
NOAA/Earth System Research Laboratory, Boulder, Colorado
(Manuscript received 8 October 2015, in final form 20 January 2016)
ABSTRACT
The Rapid Refresh (RAP) and High-Resolution Rapid Refresh (HRRR), both operational at NOAA’s
National Centers for Environmental Prediction (NCEP) use the Thompson et al. mixed-phase bulk cloud
microphysics scheme. This scheme permits predicted surface precipitation to simultaneously consist of rain,
snow, and graupel at the same location under certain conditions. Here, the explicit precipitation-type di-
agnostic method is described as used in conjunction with the Thompson et al. scheme in the RAP and HRRR
models. The postprocessing logic combines the explicitly predicted multispecies hydrometeor data and other
information from the model forecasts to produce fields of surface precipitation type that distinguish between
rain and freezing rain, and to also portray areas of mixed precipitation. This explicit precipitation-type di-
agnostic method is used with the NOAA operational RAP and HRRRmodels. Verification from two winter
seasons from 2013 to 2015 is provided against METAR surface observations. An example of this product
from a January 2015 south-central United States winter storm is also shown.
1. Introduction
Diagnosis of precipitation type from weather forecast
model predictions is important for public forecasting
of winter storms, and also for air and surface trans-
portation, energy, hydrology, and other applications.
The advent of mixed-phase bulk microphysics schemes
in some NOAA operational numerical prediction models
[Rapid Update Cycle (RUC; Benjamin et al. 2004a,b);
Rapid Refresh (RAP; Benjamin et al. 2016); and High-
Resolution Rapid Refresh (HRRR; Smith et al. 2008;
Benjamin et al. 2016)] enabled a relatively direct diagnosis
of precipitation type [e.g., rain R, snow S, ice pellets (IP),
freezing rain and drizzle (FZ), and mixed types] at the
surface. Since 1998, the RUC model running at NOAA’s
National Centers for Environmental Prediction (NCEP)
has used a bulk scheme in which separate mixing ratios
for cloud water, rainwater, ice, snow, and graupel are
predicted at each 3D grid point. From 2005 to 2012, the
scheme used inRUCwas as described byThompson et al.
(2004). The RAP, which replaced the RUC at NCEP on
1 May 2012, uses a more advanced version (Thompson
et al. 2008). RAP, version 3, and HRRR, version 2,
planned for implementation at NCEP in 2016 and run-
ning at Earth System Research Laboratory (ESRL)
starting in April 2015 (Benjamin et al. 2016, their Table
1), use an aerosol-aware version of the Thompson et al.
scheme (Thompson and Eidhammer 2014). This use of
multispecies mixed-phase microphysics in the RUC, RAP,
and HRRR models was motivated by a need to improve
the forecast skill for clouds, in general, and supercooled
liquid water, in particular, for aviation requirements.
Here, we describe the diagnostic precipitation-type scheme
used in the NCEPRAP, version 3, andHRRR, version 2.
This precipitation-type scheme is a recent alternative to
profile-based diagnostic methods summarized in section
2. Ikeda et al. (2013) presented verification results on
precipitation-type forecasts from an earlier version of
HRRR as of 2012. This paper is an expansion on and
correction of their Table 1 and includes an examination of
more recent explicit precipitation-type results.
The RAP and HRRR models use the community
NCEPUnified Post Processor (UPP) also used for other
models. Options have been added to UPP including
*Additional affiliation: Cooperative Institute for Research
in Environmental Sciences, University of Colorado, Boulder,
Colorado.
Corresponding author address: Stanley G. Benjamin, NOAA/
ESRL, R/GSD1, 325 Broadway, Boulder, CO 80305-3328.
E-mail: [email protected]
APRIL 2016 BEN JAM IN ET AL . 609
DOI: 10.1175/WAF-D-15-0136.1

ceiling (cloud-base height), visibility, and precipitation
type, designed for microphysics schemes with multiple
prognostic hydrometeor-species variables. In this paper,
we describe the UPP option for this explicit, multispe-
cies diagnostic of precipitation type, which is currently
applied only in the RAP and HRRR.
2. Other precipitation-type diagnostic schemes
Well before the introduction of mixed-phase micro-
physics schemes into some operational numerical
weather prediction models, successful diagnostic tech-
niques were designed using implicit assumptions about
microphysical processes to allow estimation of the pre-
cipitation type. These procedures can be grouped into 1)
algorithmic or decision-tree approaches based on an
observed or predicted sounding and 2) statistical pro-
cedures that make use of a training dataset to derive a
set of equations that is then applied to predicted fields.
All of the diagnostic schemes discussed here are for
discrete yes/no identification of each precipitation type,
the same yes or no designation in observer guidelines in
the NOAA Federal Meteorological Handbook No. 1
(OFCM 2005, chapter 8).
a. Algorithmic approaches
A number of simple but effective algorithms have
been developed that use as input model-forecast profiles
of temperature and relative humidity from the surface
upward to the level of assumed precipitation-generating
layers aloft. The algorithms used most often by fore-
casters in North America are those developed by Ramer
(1993) and Baldwin et al. (1994). A description of
Ramer’s algorithm can be found in Bourgouin (2000),
Wandishin et al. (2005), and DeGaetano et al. (2008).
(The latter paper introduces some modifications to
Ramer’s algorithm for application to forecasts of ice
accretion.) In essence, Ramer’s approach is to define an
ice fraction of the precipitation in a precipitation-
generation layer and, based on the temperature of that
layer, assume the ice fraction of this precipitation is ei-
ther 0 (liquid) or 1 (frozen). Then, for the frozen case, a
decision tree that depends on the wet-bulb temperature
profile is used to modify the ice fraction as a function of
height between the base of the generating layer and the
ground. The value of the ice fraction then determines
the precipitation type.
The Baldwin et al. algorithm also considers the ver-
tical profile of the wet-bulb temperature below satu-
rated layers where precipitation is presumed to form. If
this precipitation is presumed frozen, the precipitation
type at the surface is obtained by using the vertically
integrated departure of the wet-bulb temperature from
08C in various layers and the temperature in the lowest
model layer. A more complete description can be found
in Bourgouin (2000) and Wandishin et al. (2005).
b. Statistical approaches
Among statistical approaches of which we are aware,
the earliest to use upper-air data is that of Wagner
(1957). Using surface aviation observations of pre-
cipitation type and collocated rawinsonde observations
(about 40 stations), Wagner compared the thickness of
the 1000–500-hPa layer to the occurrence of frozen
precipitation and determined the thickness values cor-
responding to a 50% probability of frozen precipitation.
The thickness values so obtained are still used by many
forecasters as a point of comparison with predicted
thickness values.
The model output statistics (MOS) approach for
precipitation type was first applied by Bocchieri (1979,
1980) and Bocchieri and Maglaras (1983) to the then-
operational Limited Area Fine Mesh (LFM) model.
Since then, there have been many upgrades, andMOS is
now applied to output from the Global Forecast System
(GFS) as well as the North American Mesoscale Fore-
cast System (NAM) models for precipitation-type pur-
poses. Perfect-prog (Vislocky andYoung 1989) approaches
include Keeter and Cline (1991) and Bourgouin (2000).
Keeter and Cline used radiosonde 1000–700-, 1000–850-,
and 850–700-hPa thickness values at Raleigh–Durham,
North Carolina, regressed against collocated surface ob-
servations. The approach of Bourgouin (2000) classified
sounding temperature profiles into four groupings (freezing
rain or ice pellets, ice pellets or rain, snow or rain, and
snow) and derived statistics separately for each grouping.
Separate positive and negative areas on a thermodynamic
diagram between the 08C isotherm and the observed
temperature profile are computed for each sounding in
the training dataset and are determined to be impor-
tant predictors. Bourgouin considers his approachmost
applicable to synoptic situations characterized by
broad synoptic-scale lift leading to widespread, deep
saturation. Manikin (2005) combined the Baldwin et al.,
Ramer, Bourgouin, and revised Baldwin et al. algorithms
into a single predominant precipitation-type value now
used often in NCEP models (http://www.wpc.ncep.
noaa.gov/wwd/impactgraphics/).
A recent contribution by Schuur et al. (2012) shares
conceptual aspects with the earlier algorithmic ap-
proaches as well as that of Bourgouin in that it classifies
vertical profiles (modeled or observed) according to the
number of 08C crossings by the wet-bulb vertical tem-
perature profile together with the 2-m temperature.
This method considers local extrema of this profile be-
tween the intermediate 08C crossings. This algorithmic
610 WEATHER AND FORECAST ING VOLUME 31

approach could stand alone but is intended for use in
conjunction with polarimetric radar, in which the radar
polarimetric parameters indicate whether a bright band
(i.e., a melting layer) exists. If such a layer is detected,
then the precipitation type at the ground is expected to
be rain, freezing rain, ice pellets, or a mixture of freezing
rain and ice pellets, or possibly even wet (melting) snow
if the melting level is detected at the lowest elevation
scan, but not dry snow.
3. Explicit diagnostic scheme for precipitation type
In the postprocessing algorithm described here, sep-
arate yes/no indicators are diagnosed for each of four
different precipitation-type categories: rain, snow, ice
pellets (including graupel), and freezing rain. These yes/
no indicators are determined from the explicit 3D hydro-
meteor mixing ratios reaching the ground as calculated
in the cloud microphysics parameterization (Thompson
et al. 2008; Thompson andEidhammer 2014) in theRAP
or HRRR models [or from the Thompson et al. (2004)
scheme in the RUC model]. The hydrometeor fields
predicted by the Thompson et al. schemes are mixing
ratios of cloud water (droplets), rain, cloud ice, snow,
and graupel, as well as the number concentration of
raindrops and cloud-ice particles.1 These hydrometeor
mixing ratio prognostic fields undergo horizontal
transport as well as vertical transport at appropriate fall
speeds. The precipitation-type diagnostic algorithm de-
scribed here makes use of the explicit precipitation of
rain, snow, and graupel predicted to reach the surface by
FIG. 1. Flowchart describing the diagnostic logic for determination of precipitation type where Ptot, Ptot-rs, and Psnow are the total,
rain plus snow only (no graupel), and snow only (water equivalent) precipitation, respectively, with 1 h indicating over the last hour. The
instantaneous fall rate for different hydrometeor types is given by Prate where the subscript indicates the type of hydrometeor. The max
rain mixing ratio in the column is represented by Max(qr).
1 The number concentration of cloud water drops is also pre-
dicted in the Thompson–Eidhammer aerosol-aware scheme but is
not used in the precipitation identification described here.
APRIL 2016 BEN JAM IN ET AL . 611

the model. Using continuous model-provided explicit
fields of hydrometeor mixing ratios and fall rates (mass
accumulation at ground per unit time), this algorithm
estimates thresholds for these parameters to approxi-
mate the same discrete yes/no observer guidelines in the
NOAA Federal Meteorological Handbook No. 1
(OFCM 2005, chapter 8).
The explicit precipitation-type scheme described here
depends on the microphysics scheme to provide a ‘‘first
guess’’ of precipitation types reaching the ground. (Note
that because rain, snow, and graupel are each predicted
separately by the forecast model, i.e., each possessing
separate mixing ratios and fall speeds, it is possible for
the model to predict that two or more of these types will
reach a given point on the ground simultaneously.) For
each allowable precipitation type in this diagnostic
scheme (rain, snow, ice pellets, and freezing rain), the
model output within each grid column (not just at the
surface) is used to derive a separate yes/no (1/0) decision
on whether that type is reaching the ground. These
precipitation-type values from the postprocessing are
not mutually exclusive, except for rain versus freezing
rain. More than one value (as many as three) can be yes
(1) at a given grid point at a given time.
a. Diagnostic logic flowchart for precipitation types
The sequence of the diagnostic logic is depicted
completely in the flowchart in Fig. 1, with further dis-
cussion below. The rationale for this scheme is provided
in the following subsection. Each model grid column is
considered separately, and all precipitation rates below
are at the ground and in liquid-water equivalent. After
determining if there was even a minimal amount of
precipitation during the last hour (including that from
parameterized convection, if appropriate, using 08C as a
snow/rain threshold), the explicit precipitation-type di-
agnosis logic is treated for three decisions: rain versus
freezing rain/drizzle, snow versus rain, and ice pellets
versus rain or snow. Each treatment allows consid-
eration of instantaneous precipitation (via fall rates
for rain, snow, or graupel) and precipitation over the
last hour.
Some of the precipitation-type rules are based on a
snow fraction (SF) defined as the mass of snow accu-
mulation divided by the combined mass of snow and
rain. The snow fraction is calculated at each grid point
for accumulation over some previous forecast period.
These precipitation accumulations are updated each
time step from the near-surface mixing ratio times the
fall speed, as described in Thompson et al. (2008) and
Thompson and Eidhammer (2014). In the RAP and
HRRR, the previous forecast period is currently 1 h but
can be set to shorter time periods (e.g., 15min).
FIG. 2. Precipitation type [snow (blue horizontal hatched lines),
rain (green vertical hatched lines), freezing rain (red sloping up-
ward to right hatched lines), and ice pellets (lavender sloping
downward to right hatched lines)] from a 1-h forecast from an
experimental version of the RAP using the explicit diagnostic
method. The RAP 1-h forecast is valid at 1600 UTC 1 Jan 2015 and
was initialized at 1500 UTC, 1 h earlier. Note that precipitation
type is indicated for areas with 1-h precipitation (water equivalent)
less than 0.01 in. (0.25mm) because precipitation type can be di-
agnosed with 1-h precipitation as low as 0.0001mm. Circles shown
are for major airports. (a) Results are given without total 1-h
precipitation. (b) Results are given with total 1-h precipitation (in.;
water equivalent).
612 WEATHER AND FORECAST ING VOLUME 31

1) SNOW VERSUS RAIN
If SF. 0.25 and either the current snow precipitation
rate is .0.000 72mmh21 (0.2 3 1029m s21) (liquid
equivalent) or the total precipitation of rain plus snow
during the previous hour is.0.01mm, snow is diagnosed
as long as the current 2-m temperature (from the model
forecast) is,38C. If the 2-m temperature is$38C, rain is
diagnosed instead.
2) RAIN VERSUS FREEZING RAIN
If SF , 0.6 and either the current rain rate at the
ground is at least 0.01mmh21 or there has been at least
0.01-mm total precipitation of rain plus snow during the
previous hour, then rain or freezing rain is diagnosed. If
the 2-m temperature is ,08C, freezing rain/drizzle is
diagnosed; otherwise, rain is diagnosed.
3) ICE PELLETS AND RELATED DEPENDENCIES
Dependencies regarding IP diagnosis are more com-
plicated as a result of the attempt to match observing
guidelines as described earlier in section 3. If the cur-
rent fall rate for graupel is .0.0036mmh21 (1.0 31029m s21), ice pellet precipitation is generally diag-
nosed, but with further dependencies including 2-m
temperature and relative instantaneous fall rates for
graupel, rain, and snow. First, for IP, the graupel fall rate
at the surface must be greater than that for snow; oth-
erwise, S is diagnosed and not IP. Also to limit IP di-
agnosis to situations with conditions normally expected,
there must be a level aloft with the rain mixing ratio
.0.005 g kg21. [Note that with a previous maximum rain
mixing ratio set as.0.05 g kg21, IP was rarely diagnosed
(Elmore et al. 2015), resulting in this modification.] If, in
FIG. 3. As in Fig. 2, but for precipitation-type forecasts shown separately for each precipitation type with (top left)
rain, (top right) snow, (bottom left) freezing rain, and (bottom right) ice pellets.
APRIL 2016 BEN JAM IN ET AL . 613
addition, the fall rate for graupel is greater than that for
rain, IP only is diagnosed, not FZ and not rain. If the 2-m
temperature is .38C, IP is not diagnosed, thus not al-
lowing IP to include the condition of convectively
produced hail.
b. Rationale for explicit precipitation-type diagnosis
Although the model generally produces a dominant
precipitation type, in the difficult cases of cold-season
mixed precipitation, simply using the precipitation types
directly from the model without any qualification as to
the surface accumulation rate of that particular species
leads to a confusing picture when displayed as a super-
position of binary (0/1) fields. This is because at 2-m tem-
peratures not far from 08C, the physical solution within a
multispecies microphysics scheme can give small amounts
of more than one hydrometeor species falling to the sur-
face in the model. Thus, it was necessary to introduce
postprocessing logic into the classification scheme for ap-
propriate thresholds of the multispecies fall rate.
Thresholds for SF and 2-m temperature in the
precipitation-type diagnostic logic were subjectively
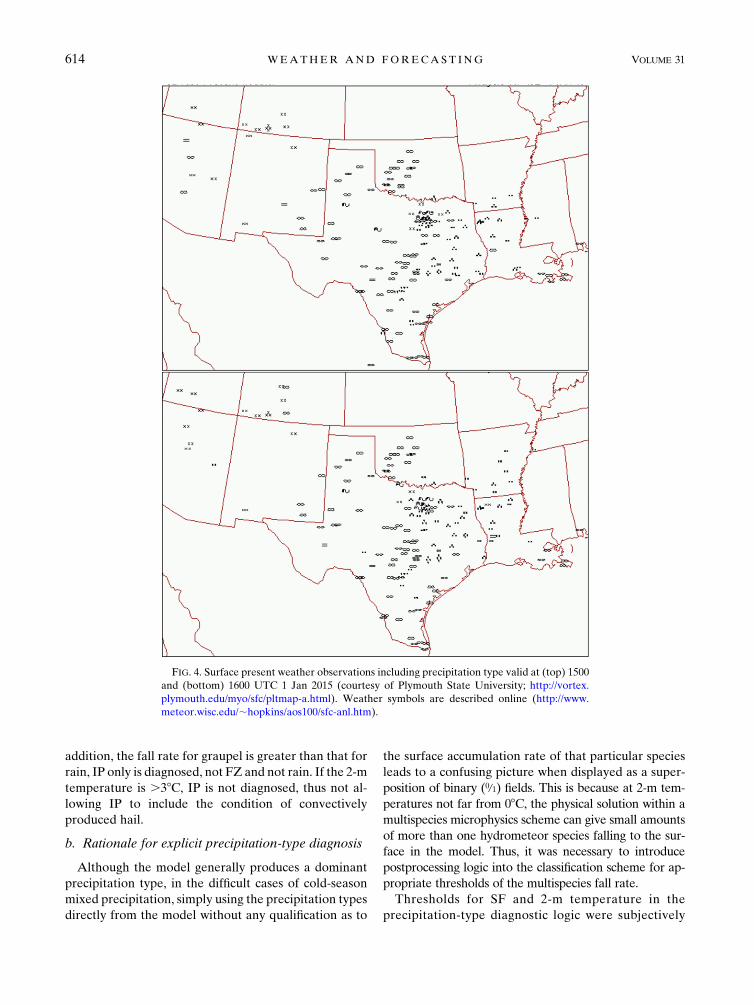
FIG. 4. Surface present weather observations including precipitation type valid at (top) 1500
and (bottom) 1600 UTC 1 Jan 2015 (courtesy of Plymouth State University; http://vortex.
plymouth.edu/myo/sfc/pltmap-a.html). Weather symbols are described online (http://www.
meteor.wisc.edu/;hopkins/aos100/sfc-anl.htm).
614 WEATHER AND FORECAST ING VOLUME 31
estimated (no effect on the actual forecast model solu-
tion) against observations of precipitation type from
Automated Surface Observing System (ASOS) reports
to avoid the problem of diagnosing too large (or too
small) areal coverage of mixed precipitation (e.g., rain/
snow or freezing rain/ice pellets/snow). It is also neces-
sary to make use of the model forecast of the 2-m tem-
perature to identify situations where rain is falling at
temperatures , 08C, and to limit the IP diagnosis to
formation in cold-season storms and exclude convec-
tively produced hail. Allowing snow precipitation-type
identification with 2-m temperatures up to 18C accounts
for the wet-bulb effect, which is already identified in the
Thompson et al. microphysics via energy exchange be-
tween snow and environmental air as the snow falls at its
fall speed.
To increase the likelihood of successfully predicting
freezing drizzle at the surface, the more recent Thompson
et al. microphysics schemes (Thompson et al. 2008;
Thompson and Eidhammer 2014) include a two-moment
rain component in order to better describe the collision–
coalescence process in clouds that aremainly composed of
liquid particles but at temperatures, 08C throughout the
cloud depth.
We also note that the precipitation rates used cur-
rently for themodel explicit precipitation-type diagnosis
are 1) instantaneous and 2) have a minimum threshold
(0.0001mmh21) much lighter than sensible by current
measurement methods. The use of the instantaneous
precipitation rates means that this diagnostic method
could be expanded into higher-frequency products or
into a future PDF precipitation-type field. The very
small precipitation rate thresholds were designed to
capture very light drizzle or light snow events, even at
the expense of showing a bias versus ASOS-level sen-
sitivity for precipitation types (not shown). Thériaultet al. (2006) and Thériault and Stewart (2010)
considered a precipitation-type fraction but did not
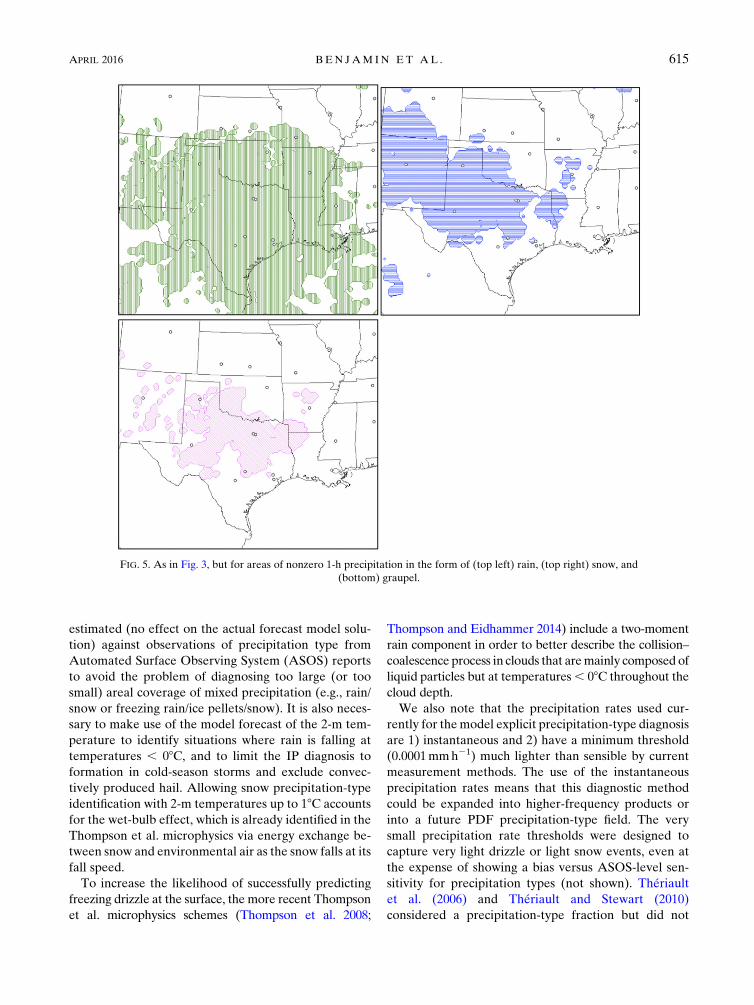
FIG. 5. As in Fig. 3, but for areas of nonzero 1-h precipitation in the form of (top left) rain, (top right) snow, and
(bottom) graupel.
APRIL 2016 BEN JAM IN ET AL . 615

address how to approximate observer guidelines for yes/
no precipitation-type identification.
4. Case study and 2013–15 validation
a. Case example
A brief example is shown to illustrate application of
the explicit precipitation-type diagnosis in Figs. 2–4 for a
winter storm forecast valid at 1600 UTC 1 January 2015.
Figure 2 shows precipitation type diagnosed from an
RAP (13 km) 1-h forecast with areas of snow, freezing
rain, and ice pellets from New Mexico across northern
Texas with rain over southern Texas. Smaller areas of
mixed precipitation types are shown from northern
Texas to the Arkansas–Louisiana border in the 1-h
forecast with the explicit precipitation-type diagnosis,
including S–FZ, FZ–IP, and R–IP mixtures. The total
1-h precipitation is added in Fig. 2b, indicating the su-
perset of possible areas for precipitation-type assign-
ment (gray) and areas of heavier precipitation (.0.1 in. h21
in light green), usually for rain but some for FZ and
IP. A breakdown of each precipitation-type forecast
area is added in Fig. 3 to see the specific coverage areas
of each precipitation type. The METAR observations of
precipitation type valid at the forecast valid time are
shown in Fig. 4. Freezing rain observations in Fig. 4 are
generally within the FZ forecast area evident in Figs. 2
and 3. The rain–snow line in the observations (Fig. 4) is
very close to that diagnosed for the 1-h RAP forecast.
Some snow and FZ reports are shown in the Dallas–Fort
Worth, Texas, area (Fig. 4), similar to the mixed S–FZ
area forecast just west of those cities. A freezing rain
report (Fig. 4) at 1500 UTC in central Texas (Abilene)
was covered by the forecast FZ area in Figs. 2 and 3.
Freezing rain and drizzle was diagnosed near but not
covering the Lubbock FZ report in western Texas. The
areal coverage in the forecast, especially for snow and
freezing rain, is larger than shown in the observations,
because of the very light precipitation threshold of
0.0001mmh21, well below the measurable minimum of
about 0.25mmh21. Areas of 1-h precipitation (supersets
of the areas of instantaneous precipitation) are also
shown for rain, snow, and graupel in Fig. 5, the starting
point for the algorithm. The value added of applying the
explicit precipitation-type algorithm can be seen in
comparing Fig. 5 with Fig. 3 (and in Fig. 2b). The
precipitation-type algorithm identifies areas of FZ and
limits the R, S, and IP assignment by the temperature,
precipitation intensity, and other constraints shown in
the logic flow in Fig. 1 and described in section 3.
For comparison with another precipitation-type di-
agnostic, Fig. 6 shows the results from the dominant pre-
cipitation type (Manikin 2005) combining Baldwin et al.,
Ramer, Bourgouin, and revised Baldwin et al. techniques
using gridded data from the same RAP 1-h forecast
shown in Figs. 2 and 3 for the explicit precipitation-type
diagnostic described in this paper. The general coverage
is slightly larger with the dominant precipitation type in
Fig. 6 (any precipitation greater than zero qualifies). The
dominant precipitation type (Fig. 6) also shows a signifi-
cant area of ice pellets in western Texas not shown with
the explicit precipitation-type diagnosis. A sounding for
Lubbock (Fig. 7) from the same common RAP 1-h
forecast grid used for both precipitation-type diagnoses
indicates a saturated level above 08C that could support
IP, although the explicit precipitation type based on
Thompson et al. microphysics indicated snow with occa-
sional mixed FZ. Observations from 1400 to 1900 UTC
showed only FZ and S observations in western Texas
(only 1600 UTC; shown in Fig. 4). Generally, fewer
details are shown in Fig. 6 (dominant) than Fig. 2 (ex-
plicit), including the freezing rain in western Texas and
snow reports near the Dallas area. The dominant
precipitation-type scheme also cannot show mixed pre-
cipitation, by definition, but this condition is diagnosed
with the explicit precipitation-type scheme in Fig. 2 in
some areas in northern Texas. This comparison is
qualitative and suggests that the explicit precipitation-
type diagnosis is credible.
b. Validation of explicit 1-h precipitation-typeforecasts from HRRR and RAP
Probability of detection for 1-h RAP (ESRL experi-
mental) precipitation-type forecasts is presented in
Fig. 8 over a 28-month period including two full winter
FIG. 6. As in Fig. 2, but for the dominant precipitation-type
diagnostic (Manikin 2005) combining Baldwin et al., Ramer,
Bourgouin, and revised Baldwin et al. diagnostics.
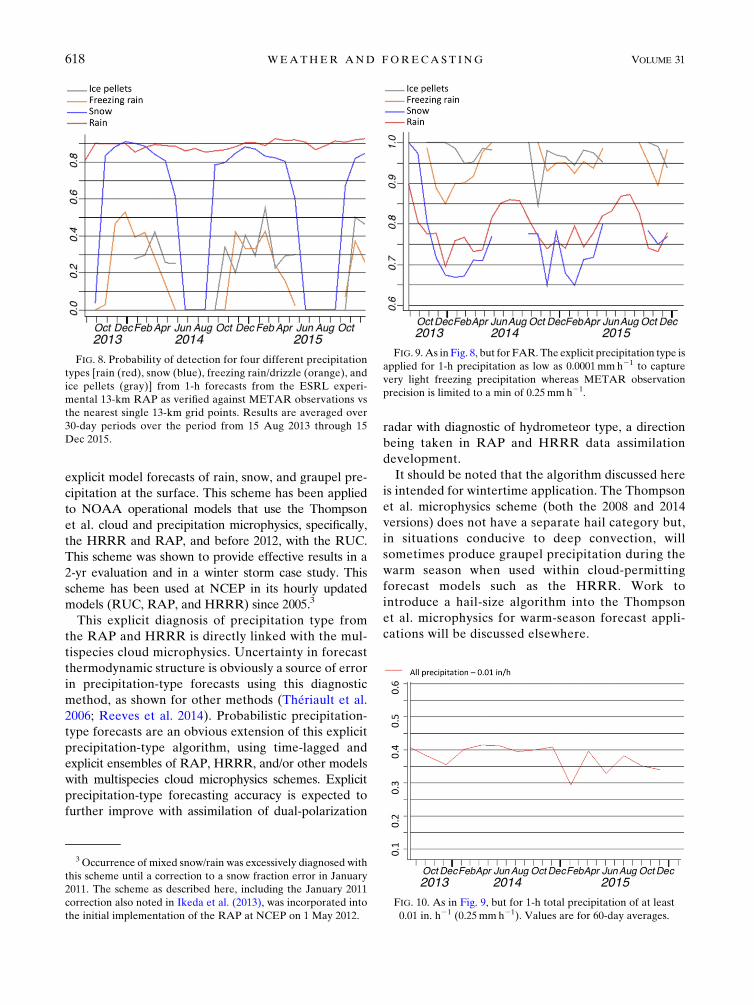
616 WEATHER AND FORECAST ING VOLUME 31

seasons using the nearest 13-km RAP grid point to the
METAR observation location. The probability of de-
tection for occurrence events (PODy) is ;0.9 in all of
the 24 months over the conterminous United States for
rain and about 0.8–0.9 for snow over the same period
during winter months. The PODy for IP ranges from 0.3
to 0.55 (most common month—February) and slightly
lower for FZ. The PODy for IP from this diagnostic is far
higher than that shown in Elmore et al. (2015) who used
RAP results not including the IP algorithm change in the
ESRL version in January 2013. Both IP and FZ usually
occur in geographically limited areas, so high PODy is
difficult to achieve in real-data modeling. The deficiency
in PODy for IP and FZ is likely due to errors in tem-
perature, water vapor, and hydrometeor initialization.
The number of IP and FZ events is rare: for instance,
during February 2015, for METARs within the CONUS
area including southern Canada, the total number of re-
ports was about 60000 for snow, 30000 for rain, 2000 for
freezing drizzle/rain, and 400 for ice pellets. As mentioned
at the end of section 3, the precipitation-type diagnostic
method uses a minimum threshold (0.0001mmh21) that is
much lighter than detectable by current measurement
methods (minimum 0.25mmh21), resulting in a high false
alarm ratio (FAR) versus METAR observations (Fig. 9).2
The overall FAR for measurable (0.25mm) precipitation
for RAP versus METARs is depicted in Fig. 10, showing
an overall FAR of about 0.35–0.40, much lower than that
shown in Fig. 9 with the far lower threshold for the
precipitation-type algorithm designed to capture very
light but significant freezing precipitation events.
5. Conclusions
The explicit precipitation-type diagnostic scheme de-
scribed here is a relatively new approach applicable with
FIG. 7. Sounding skewT–logP profile of temperature andmoisture at Lubbock for the 1-h RAP
forecast valid at 1600 UTC, the same RAP run shown in Figs. 2 and 5.
2 It should be noted that the ASOS used at METAR sites cur-
rently does not have the ability to detect IP. This precipitation type
is nominally only reported when an ASOS observation is aug-
mented by a human observer, partially accounting for the paucity
of IP reports.
APRIL 2016 BEN JAM IN ET AL . 617
explicit model forecasts of rain, snow, and graupel pre-
cipitation at the surface. This scheme has been applied
to NOAA operational models that use the Thompson
et al. cloud and precipitation microphysics, specifically,
the HRRR and RAP, and before 2012, with the RUC.
This scheme was shown to provide effective results in a
2-yr evaluation and in a winter storm case study. This
scheme has been used at NCEP in its hourly updated
models (RUC, RAP, and HRRR) since 2005.3
This explicit diagnosis of precipitation type from
the RAP and HRRR is directly linked with the mul-
tispecies cloud microphysics. Uncertainty in forecast
thermodynamic structure is obviously a source of error
in precipitation-type forecasts using this diagnostic
method, as shown for other methods (Thériault et al.2006; Reeves et al. 2014). Probabilistic precipitation-
type forecasts are an obvious extension of this explicit
precipitation-type algorithm, using time-lagged and
explicit ensembles of RAP, HRRR, and/or other models
with multispecies cloud microphysics schemes. Explicit
precipitation-type forecasting accuracy is expected to
further improve with assimilation of dual-polarization
radar with diagnostic of hydrometeor type, a direction
being taken in RAP and HRRR data assimilation
development.
It should be noted that the algorithm discussed here
is intended for wintertime application. The Thompson
et al. microphysics scheme (both the 2008 and 2014
versions) does not have a separate hail category but,
in situations conducive to deep convection, will
sometimes produce graupel precipitation during the
warm season when used within cloud-permitting
forecast models such as the HRRR. Work to
introduce a hail-size algorithm into the Thompson
et al. microphysics for warm-season forecast appli-
cations will be discussed elsewhere.
FIG. 8. Probability of detection for four different precipitation
types [rain (red), snow (blue), freezing rain/drizzle (orange), and
ice pellets (gray)] from 1-h forecasts from the ESRL experi-
mental 13-km RAP as verified against METAR observations vs
the nearest single 13-km grid points. Results are averaged over
30-day periods over the period from 15 Aug 2013 through 15
Dec 2015.
FIG. 10. As in Fig. 9, but for 1-h total precipitation of at least
0.01 in. h21 (0.25mmh21). Values are for 60-day averages.
FIG. 9. As in Fig. 8, but for FAR. The explicit precipitation type is
applied for 1-h precipitation as low as 0.0001mmh21 to capture
very light freezing precipitation whereas METAR observation
precision is limited to a min of 0.25mmh21.
3 Occurrence of mixed snow/rain was excessively diagnosed with
this scheme until a correction to a snow fraction error in January
2011. The scheme as described here, including the January 2011
correction also noted in Ikeda et al. (2013), was incorporated into
the initial implementation of the RAP at NCEP on 1 May 2012.
618 WEATHER AND FORECAST ING VOLUME 31

Acknowledgments. We thank Joseph Koval at The
Weather Company and Kyoko Ikeda and her NCAR
colleagues for their help in identifying problems with the
precipitation-type diagnosis that led to improvements in
the scheme now documented in this article.We also thank
Greg Thompson at the National Center for Atmospheric
Research for ongoing collaboration, and colleagues at
NOAA/ESRL, especially Curtis Alexander and Brian
Jamison, for their help on evaluation of the precipitation-
type algorithm described here. We thank Kim Elmore
and his colleagues at NSSL for prompting identification
of need for the IP criterion resetting. Ongoing changes
in the precipitation-type diagnostic described in this pa-
per are tracked online (http://ruc.noaa.gov/rr/RAP_var_
diagnosis.html#ptype). Finally, we thank Trevor Alcott,
David Dowell, and John Osborn (NOAA/ESRL) for
very helpful reviews. The Federal Aviation Administra-
tion has partially supported some of this work.
REFERENCES
Baldwin,M., R. Treadon, and S. Contorno, 1994: Precipitation type
prediction using a decision tree approach with NMC’s Meso-
scale Eta Model. Preprints, 10th Conf. on Numerical Weather
Prediction, Portland, OR, Amer. Meteor. Soc., 30–31.
Benjamin, S. G., G. A. Grell, J. M. Brown, and T. G. Smirnova, 2004a:
Mesoscale weather prediction with the RUC hybrid isentropic-
terrain-following coordinatemodel.Mon.Wea. Rev., 132, 473–494,
doi:10.1175/1520-0493(2004)132,0473:MWPWTR.2.0.CO;2.
——, and Coauthors, 2004b: An hourly assimilation–forecast cycle:
The RUC. Mon. Wea. Rev., 132, 495–518, doi:10.1175/
1520-0493(2004)132,0495:AHACTR.2.0.CO;2.
——, and Coauthors, 2016: A North American hourly assimilation
andmodel forecast cycle: TheRapidRefresh.Mon.Wea. Rev.,
doi:10.1175/MWR-D-15-0242.1, in press.
Bocchieri, J. R., 1979: A new operational system for forecasting
precipitation type.Mon. Wea. Rev., 107, 637–649, doi:10.1175/
1520-0493(1979)107,0637:ANOSFF.2.0.CO;2.
——, 1980: The objective use of upper air soundings to specify
precipitation type.Mon. Wea. Rev., 108, 596–603, doi:10.1175/
1520-0493(1980)108,0596:TOUOUA.2.0.CO;2.
——, and G. J. Maglaras, 1983: An improved operational system
for forecasting precipitation type. Mon. Wea. Rev., 111, 405–
419, doi:10.1175/1520-0493(1983)111,0405:AIOSFF.2.0.CO;2.
Bourgouin, P., 2000: A method to determine precipitation types.Wea.
Forecasting, 15, 583–592, doi:10.1175/1520-0434(2000)015,0583:
AMTDPT.2.0.CO;2.
DeGaetano, A. T., B. N. Belcher, and P. L. Spier, 2008: Short-term
ice accretion forecasts for electric utilities using the Weather
Research and Forecasting Model and a modified precipitation-
type algorithm. Wea. Forecasting, 23, 838–853, doi:10.1175/
2008WAF2006106.1.
Elmore, K. L., H. M. Grams, D. Apps, and H. D. Reeves, 2015:
Verifying forecast precipitation type with mPING. Wea.
Forecasting, 30, 656–667, doi:10.1175/WAF-D-14-00068.1.
Ikeda, K., M. Steiner, J. Pinto, and C. A. Alexander, 2013: Eval-
uation of cold-season precipitation forecasts generated by the
hourly updating High-Resolution Rapid Refresh model. Wea.
Forecasting, 28, 921–939, doi:10.1175/WAF-D-12-00085.1.
Keeter, K. K., and J. W. Cline, 1991: The objective use of observed
and forecast thickness values to predict precipitation type in
North Carolina. Wea. Forecasting, 6, 456–469, doi:10.1175/
1520-0434(1991)006,0456:TOUOOA.2.0.CO;2.
Manikin, G. S., 2005: An overview of precipitation type forecasting
using NAM and SREF data. Preprints, 21st Conf. on Weather
Analysis and Forecasting/17th Conf. on Numerical Weather
Prediction, Washington, DC, Amer. Meteor. Soc., 8A.6. [Avail-
able online at https://ams.confex.com/ams/pdfpapers/94838.pdf.]
Office of Federal Coordinator for Meteorology, 2005: Federal
Meteorological Handbook No. 1—Surface Weather Obser-
vations and Reports. [Available online at http://www.ofcm.gov/
fmh-1/fmh1.htm.]
Ramer, J., 1993: An empirical technique for diagnosing precipitation
type from model output. Preprints, Fifth Int. Conf. on Aviation
Weather Systems, Vienna, VA, Amer. Meteor. Soc., 227–230.
Reeves, H. D., K. L. Elmore, A. Ryzhkov, T. Schuur, and
J. Krause, 2014: Sources of uncertainty in precipitation-type
forecasting. Wea. Forecasting, 29, 936–953, doi:10.1175/WAF-D-14-00007.1.
Schuur, T. J., H.-S. Park, A. V. Ryzhkov, and H. D. Reeves, 2012:
Classification of precipitation types during transitional winter
weather using the RUC model and polarimetric radar re-
trievals. J. Appl. Meteor. Climatol., 51, 763–779, doi:10.1175/
JAMC-D-11-091.1.
Smith, T. L., S. G. Benjamin, J. M. Brown, S. Weygandt, T.
Smirnova, and B. Schwartz, 2008: Convection forecasts from
the hourly updated, 3-km High Resolution Rapid Refresh
(HRRR) Model. Preprints, 24th Conf. on Severe Local
Storms, Savannah, GA, Amer. Meteor. Soc., 11.1. [Available
online at https://ams.confex.com/ams/pdfpapers/142055.pdf.]
Thériault, J. M., and R. E. Stewart, 2010: A parameterization of
the microphysical processes forming many types of winter
precipitation. J. Atmos. Sci., 67, 1492–1508, doi:10.1175/
2009JAS3224.1.
——, ——, and W. Henson, 2006: On the dependence of winter
precipitation types on temperature, precipitation rate, and
associated features. J. Appl. Meteor. Climatol., 49, 1429–1442,doi:10.1175/2010JAMC2321.1.
Thompson, G., and T. Eidhammer, 2014: A study of aerosol im-
pacts on clouds and precipitation development in a large
winter cyclone. J. Atmos. Sci., 71, 3636–3658, doi:10.1175/
JAS-D-13-0305.1.
——,R.M.Rasmussen, andK.Manning, 2004: Explicit forecasts of
winter precipitation using an improved bulk microphysics
scheme. Part I: Description and sensitivity analysis.Mon.Wea.
Rev., 132, 519–542, doi:10.1175/1520-0493(2004)132,0519:
EFOWPU.2.0.CO;2.
——, P. R. Field, R. M. Rasmussen, and W. D. Hall, 2008: Ex-
plicit forecasts of winter precipitation using an improved
bulk microphysics scheme. Part II: Implementation of a new
snow parameterization. Mon. Wea. Rev., 136, 5095–5115,
doi:10.1175/2008MWR2387.1.
Vislocky, R. L., and G. S. Young, 1989: The use of perfect prog
forecasts to improve model output statistics forecasts of
precipitation probability. Wea. Forecasting, 4, 202–209,
doi:10.1175/1520-0434(1989)004,0202:TUOPPF.2.0.CO;2.
Wagner, A. J., 1957: Mean temperature from 1000 to 500mb as a
predictor of precipitation type. Bull. Amer. Meteor. Soc., 10,
584–590.
Wandishin, M. S., M. E. Baldwin, S. L. Mullen, and J. V. Cortinas
Jr., 2005: Short-range ensemble forecasts of precipitation type.
Wea. Forecasting, 20, 609–626, doi:10.1175/WAF871.1.
APRIL 2016 BEN JAM IN ET AL . 619