explanation of significant differences … · explanation of significant differences bremerton nava...
TRANSCRIPT
EXPLANATION OF SIGNIFICANT DIFFERENCES BREMERTON NAVAL COMPLEX
OPERABLE UNIT B MARINE
February 2004
EXPLANATION OF SIGNIFICANT DIFFERENCES BREMERTON NAVAL COMPLEX
OPERABLE UNIT B MARINE
I. INTRODUCTION
A. Purpose
The Record of Decision (ROD) for Bremerton Naval Complex (BNC) Operable Unit (OU) B Marine was signed June 13, 2000. The selected remedy for the cleanup of marine sediments included a combination of dredging with disposal in a Confined Aquatic Disposal (CAD) pit, capping, enhanced natural recovery, monitored natural recovery and institutional controls. The purpose of this Explanation of Significant Differences (ESD) is to:
(1) identify a change in the boundary of OU B Marine to address additional sediment cleanup areas, (2) modify action levels for the response action on Washington State Owned Aquatic Lands (SOAL)
adjacent to the Navy's CAD pit, and (3) address institutional control requirements on SOAL.
This ESD will not change any of the remedial action objectives stated in the ROD.
B. Lead and Support Agencies
Department of the Navy (Navy) - Lead Agency
U.S. Environmental Protection Agency (EPA) - Regulatory oversight agency
Washington State Department of Ecology (Ecology) -Regulatory oversight agency
C. Statutory Authority
Comprehensive Environmental Response, Compensation, and Liability Act (CERCLA), Section 117(c) and National Oil and Hazardous Substances Pollution Contingency Plan (NCP), Section 300.435(c)(2)(i).
EL BACKGROUND
A. Site Name, Location, and History
The BNC is located in the City of Bremerton, in Kitsap County, Washington. The Complex includes the Puget Sound Naval Shipyard (PSNS) and Naval Station Bremerton (NSB). The Navy controls a total of 1,350 acres of property located along the shoreline and approximately 230 acres of subtidal land within Sinclair Inlet, an arm of Puget Sound. The primary role of NSB is to serve as a deep draft home-port for aircraft carriers and supply ships. The primary role of PSNS is to provide overhaul, maintenance, conversion, refueling, defueling, and repair services to the naval fleet.
The BNC was proposed for inclusion on the National Priorities List (NPL) on May 10, 1993, and formally listed on May 31, 1994. The BNC has been assigned the facility identification number WA2170023418. BNC is divided into operable units, OU A, OU B, OU C, OU D and OU NSC. Decision documents are complete for OU A and OU NSC and the remedy is in place for these OUs. OU C is a petroleum site managed under the state cleanup program. A separate decision document will be completed for OU D.
The OU B Remedial Investigation (RI) was initiated to address both the marine and terrestrial portions of the OU. The Navy, EPA, and Ecology agreed to accelerate the cleanup of the marine portion of OU B to seize the opportunity to coordinate cleanup with a planned navigational dredging project. The OU B Marine ROD was completed as an early action ROD to address cleanup of marine sediment within OU B.
The OU B Marine Proposed Plan was issued on March 13,2000 and the OU B Marine ROD was signed on June 13, 2000. The ROD for the terrestrial portion of OU B, OU B Terrestrial, is pending signature.
B. Relevant Elements of the OU B Marine ROD
OU B Marine Boundary OU B Marine includes approximately 230 acres of subtidal land within Sinclair Inlet and extends up to 1,500 feet offshore of the terrestrial portions of the BNC to depths of approximately 40 feet below mean lower low water (MLLW). OU B Marine, as described in the ROD, is bounded to the north by the Sinclair Inlet shoreline and is bounded to the south by the Navy property line as shown in Figure 1.
OU B Marine Remedial Action Objectives The OU B Marine ROD established the following remedial action objectives for the OU:
• Reduce the concentration of polychlorinated biphenyls (PCBs) in sediments to below the minimum cleanup level of 3 mg/kg OC in the biologically active zone (0- to 10-cm depth) within OU B Marine, as a measure expected to reduce PCB concentrations in fish tissue
• Control shoreline erosion of contaminated fill material at Site 1 • Selectively remove sediment with high concentrations of mercury collocated with PCBs
Marine Sediment Response Actions and Action Levels The ROD established action levels to define areas of sediment for active remediation and to develop remedial action alternatives. They were developed based on relative risk reduction, consistency with action levels for other regional marine sediment cleanups, implementability, and cost-effectiveness. The sediment action level triggered a particular response action. The ROD action levels for OU B Marine sediments are summarized in Table 1.
Table 1: Action Levels for OU B Marine Sediments Chemical of Response Action" Action Level " Basis of Concern Determination PCBs Dredging and disposal or in >12 mg/kg OC PCBs Relative risk reduction
situ capping Sediment quality standard PCBs Enhanced natural recovery >6 mg/kg OC PCBs Resource agency concern and
Relative risk reduction Mercury Dredging and disposal >6 mg/kg OC PCBs Resource agency concern and
and Practicability >3 mg/kg mercury
" Exceptions are noted in the OU B Marine ROD, Section 10. b Action levels based on composite samples Notes: mg/kg OC - milligram per kilogram organic carbon
PCB - polychlorinated biphenyl
Though a wide variety of marine studies completed during the RI indicate little or no ecological or human health risk from mercury, additional information available at the time of the OU B Marine ROD suggested that mercury concentrations could have an impact on human health. Mercury sediment concentrations did not trigger remedial action; however, remedial action levels were adjusted to include coincidental removal of mercury with PCBs.
Selected Remedy Components The selected remedy for OU B Marine included the following components:
• Dredge and dispose in on-site excavated CAD pit approximately 200,000 cubic yards (cy) of sediment containing PCBs from an area of approximately 32 acres. Cap CAD pit with a 1-foot sand cap followed by a 2-foot native sediment cap.

• Place clean sediment over approximately 13 acres in a combination of thick-layer sediment cap (3feet of material) and enhanced natural recovery (20 cm of material).
• Shoreline stabilization in areas at Site 1 to minimize the potential for erosion of contaminated fill material into the marine environment.
• Monitoring of marine tissue and sediments to document progress toward and attainment of the cleanup goals.
• Implementation of land-use restrictions by the Navy to maintain the integrity of the CAD pit and the shoreline stabilization measures.
C. Construction of the CAD Pit and Related Monitoring Results
The CAD pit was created on Navy property with the southwestern edge on the border between Navy property and SOAL. Removed sediment from the creation of the pit was stockpiled adjacent to the CAD for use as final capping material. Following construction of the CAD pit, dredged contaminated sediment was placed in 1,500-cy capacity split-hull bottom-dump barges, towed to the CAD pit by tugboat, positioned over the CAD pit, and released through the hydraulically powered split-hull. A total of approximately 400,000 cy of dredged sediment, including both CERCLA and unsuitable navigational dredging sediments, were placed inside the CAD pit.
After placement of a nominal 1-foot-thick imported sand cap on the CAD pit and prior to placement of the final sediment cap, sediment samples were collected approximately 20 feet from the perimeter of the CAD pit and the results were compared to pre-construction sediment samples. The data indicated elevated concentrations of PCBs and mercury in the sediment beyond the CAD pit boundary on Navy property and SOAL compared to the baseline samples. The Navy notified the Washington State Department of Natural Resources (DNR), the manager of SOAL, and the Suquamish Tribe of the impact to non-Navy property.
Over the next several months, additional samples were collected at points approximately 50, 95, 100, 125, 155, 200, and 300 feet from the perimeter of the CAD pit in order to delineate the extent of the elevated levels of PCB and mercury concentrations outside the CAD pit boundary. The PCB concentrations of the sediment ranged from <2 mg/kg OC to 40.7 mg/kg OC and mercury concentrations ranged from 0.5 to 3.3 mg/kg. To address the contamination beyond the CAD pit boundary on Navy property, the Navy extended the CAD cap by placing approximately 2-feet of clean sediment up to 100 feet from the CAD pit boundary on the three sides of the CAD pit (Figure 2). The CAD pit remedial design originally included a 20-foot buffer zone around the pit boundary. Extending this buffer zone to 100 feet was determined an acceptable response action consistent with the remedial design. The placed material was from stockpiled material excavated from the CAD pit. No action was taken for the SOAL bordering the CAD pit, pending further study. DNR requested additional evaluation and characterization of the material prior to remedial decisions being made on SOAL.
Further evaluation of collected data was completed to determine if the source of the contamination outside the CAD pit could be identified. There had been no deviations from the approved work plan and water quality protocols. EPA conducted a Sediment Profile Imaging (SPI) study radiating out from the CAD pit boundary to determine the lateral extent of sediment deposition beyond the CAD pit boundary on SOAL. The study confirmed that recently deposited sediment existed beyond the CAD pit footprint and extended up to 600 feet on SOAL from the edge of the CAD pit (Figure 2). The area of impacted sediment on SOAL is approximately 13.2 acres. Based on discussions with the SPI contractor, the likely cause for the deposition beyond the CAD pit boundary was the instantaneous movement of material along the mudline surface, a "wave" of turbid material originating from the deposited material as it made contact with the bottom of the pit. The SPI data indicated several layers of deposition; however, SPI cannot differentiate between contaminated or clean material.
The Navy, EPA and Ecology developed a detailed sampling analysis plan to identify the extent of contamination within the deposited material and support subsequent remedial action decisions for SOAL. DNR and the Suquamish Tribe participated in the development of the plan. A total of 31 discrete sample locations were identified in the impacted area. The discrete sampling strategy, as opposed to the composite

strategy used during development of the OU B Marine action levels, provides greater resolution and allows spatial evaluation of the data. Samples were collected in September 2003.
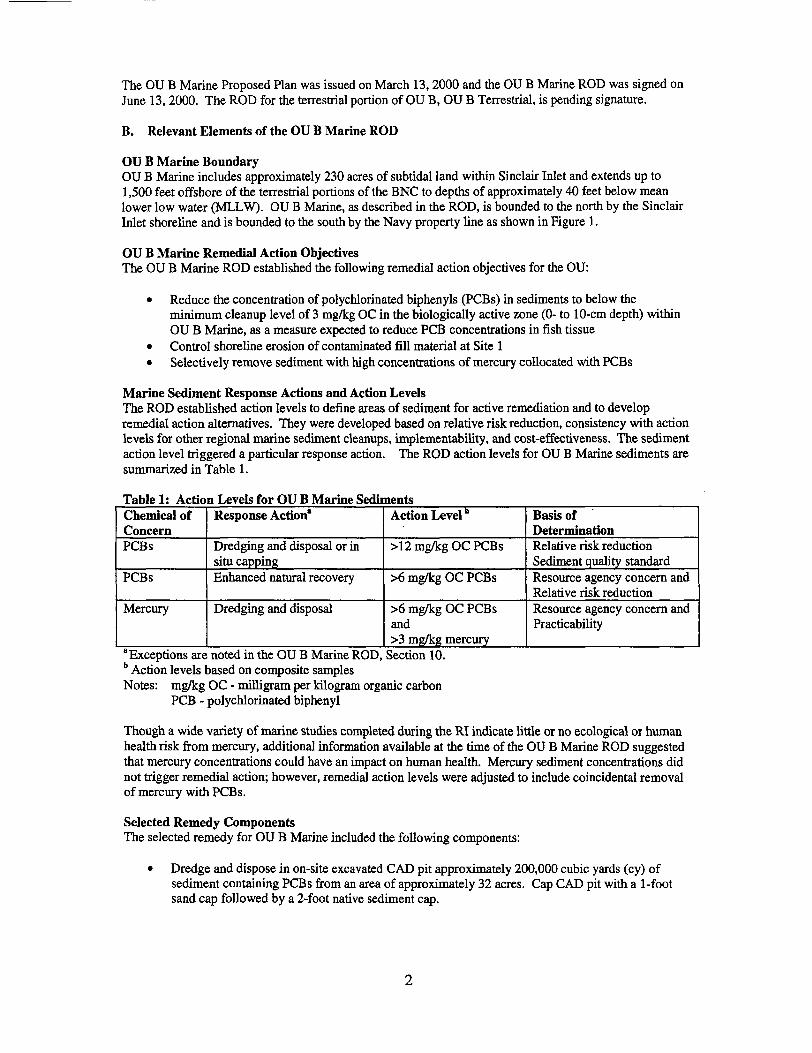
Results of the sampling on the SOAL indicated that total PCB concentrations ranged from undetected to 17.3 mg/kg OC and mercury concentrations ranged from 0.29 mg/kg dry weight to 2.2 mg/kg dry weight. Spatial interpolation of the PCB organic carbon normalized data was conducted using two-dimensional spherical kriging to estimate PCB concentrations and develop contour lines. Contour lines were drawn for PCB concentrations of 12 mg/kg OC, 9 mg/kg OC and 6 mg/kg OC. The contours are included in Figure 3. Based on these results, it appears that previous placement of the clean sediment cap on and around the CAD pit on Navy property served to significantly lower the concentrations immediately adjacent to the CAD pit on SOAL. The results indicated that coincidental remediation of sediments on SOAL occurred at approximately 120 to 210 feet beyond the perimeter of the CAD pit. This conclusion was drawn based on a comparison of the SOAL characterization results to results obtained prior to placement of clean sediment on and around the CAD pit on Navy property.
Based on the contour lines, the area with PCB concentrations greater than or equal to 12 mg/kg OC equates to 12 percent of the total SOAL impacted area. The area with PCB concentrations greater than or equal to 9 mg/kg OC equates to 29 percent of the total area, and for concentrations greater than or equal to 6 mg/kg OC, the area is 51 percent.
m. Description of Significant Differences
The remedial construction for OU B Marine resulted in the unplanned release of contaminated material on to SOAL. The Navy has completed characterization of the impacted area, evaluated the potential response actions, and selected a response action to address the contaminated material. The significant changes from the OU B Marine ROD are identified in the subsections below.
OU B Marine Boundary The boundary of OU B Marine is extended to include the area of impacted sediment on SOAL. The revised boundary of OU B Marine in the area of the CAD pit is depicted in Figure 3.
OU B Marine Remedial Action Objectives This ESD does not change the established remedial action objectives for OU B Marine.
Response Actions and Action Levels The Navy is adjusting the action levels for the SOAL portion of the OU B Marine ROD to address sediment contamination. The action level for SOAL marine sediments is summarized in Table 2.
Table 2: Action Levels for SOAL Marine Sediments Chemical of Response Action Action Level Basis of Concern Determination PCBs Enhanced natural recovery >9 mg/kg OC PCBs Relative risk reduction,
implementability, and cost
As indicated in Table 1, the OUB Marine ROD required dredging or thick-layer capping for PCBs greater than 12 mg/kg OC. For this action, dredging was eliminated as a response action where concentrations exceed 12 mg/kg OC because the deposited sediments are surficial and dredging of less than 2 feet of contaminated sediments is not a cost effective means of risk reduction. This is due to the fact that the volume of material actually requiring removal is substantially less than what would be dredged and the costs associated with dredging and disposal of the non-impacted material would be substantial and disproportionate to the benefit gained from removal of the surficial material. Thick-layer capping was also eliminated as a response action because this area falls within the no-capping boundary defined in the OU B Marine ROD. Therefore, enhanced natural recovery (i.e., placement of 1-foot of clean material) was selected as the appropriate response action for sediments on SOAL with PCB concentrations greater than 12 mg/kg OC.

The OU B Marine ROD also required enhanced natural recovery if PCBs were greater than 6 mg/kg OC. For this action, areas with sediment PCB concentrations greater than or equal to 9 mg/kg OC will be remediated using enhanced natural recovery. Areas with sediment PCB concentrations between 6 and 9 mg/kg will not be specifically targeted because:
• Placement of 1-foot of clean material in the areas with PCB concentrations greater than or equal to 9 mg/kg OC is anticipated to coincidentally remediate areas greater than 6 mg/kg OC. (The SOAL characterization documented coincidental remediation of sediment on SOAL between 120 and 210 feet beyond the perimeter of the CAD pit. The approximate distance between the 6 and 9 mg/kg OC contour lines range from approximately 30 to 120 feet).
• A portion of the impacted area has already been successfully capped by incidental coverage from the CAD capping activities.
• The revised action levels are based on discrete sample data. The discrete sampling strategy generally provides a more conservative determination of action when compared to action levels generated based on composite sampling.
• Following the remedial action, the SOAL is expected to meet the overall area-weighted average ROD OU B Marine cleanup level of 3 mg/kg OC for sediments.
This action applies only to SOAL. As noted in above, the Navy completed a response action to address contamination on Navy property as a result of CAD filling activities.
Remedy Components The response action selected to address contaminated sediment on SOAL includes:
• Placement of 1-foot of clean material (enhanced natural recovery) in areas with sediment PCB concentrations of 9 mg/kg OC or greater.
• Clean material will come from undredged navigational turning basins that were previously characterized and approved for open-water disposal by the Dredged Material Management Office (DMMO). This material was beneficially used as capping material on the CAD pit. Figure 4 shows the proposed Dredged Material Management Units (DMMUs) that will be dredged to provide the sediment to complete the enhanced natural recovery. The turning basins are considered "on-site" in accordance with the "on-site" definition of NCP Section 300.5. The turning basins are immediately adjacent to OU B Marine and less than 1/3 of a mile from the impacted SOAL and meet the requirements of the definition to be "in very close proximity to the contamination" and "necessary for implementation of the response action."
• Verification of sediment placement through performance of pre- and post-bathymetric surveys on the impacted area on SOAL. Dredged volume calculations will also be performed to verify placement of 1-foot of material.
• Monitoring through the OU B Marine Monitoring program. As part of OU B Marine, contaminant concentrations in the SOAL impact area are included in the OU B Marine area-weighted average calculations to determined attainment of the established cleanup goal.
No land use restrictions will be required on the SOAL portion of OU B Marine. This BSD does not change the ROD specified land use restrictions.
DNR and the Suquamish Tribe support this remedial action. Both agencies have been closely involved in the design, review and analysis of the data.

Expected Outcomes Completion of the remedial construction using the revised action levels will effectively reduce the concentration of contaminants on SOAL consistent with the post-remedial construction goal for OU B Marine. Combined with the remedial construction activities, natural recovery is expected to reduce the OU B Marine area-weighted average PCB concentrations to below the minimum cleanup level within 10 years. This action is not anticipated to impact the 10-year natural recovery window. The 10-year natural recovery window, however, does not commence until completion of remedial construction and this response action. The total time to meet the clean up goal is therefore extended.
Remedy Costs Construction of the remedial components identified in this BSD is estimated to cost $879,000.
IV. SUPPORT AGENCY COMMENTS
Ecology supports this remedial action.
V. AFFIRMATION OF THE STATUTORY DETERMINATION
Since the remedy selected in this BSD will meet the remedial action objectives for OU B Marine, this selected remedy is protective of human health and the environment; complies with Federal, State and Tribal requirements that are applicable, or relevant and appropriate to this remedial action as identified in the ROD; and is cost-effective. This remedy utilizes permanent solutions and alternative treatment technologies to the maximum extent practicable for this site. However, because treatment was not found to be practicable, this remedy does not satisfy the statutory preference for treatment as a principle element. Consistent with the OU B Marine ROD, since the remedy will result in hazardous substances remaining onsite above health-based levels, a review will be conducted within five years after commencement of the remedial action to ensure that the remedy continues to provide adequate protection of human health and the environment.
VL PUBLIC PARTICIPATION ACTIVITIES
A public notification on the availability of this BSD will be published in the local newspaper in accordance with NCP Section 300.435(c)2(i).

Signature sheet for the foregoing Bremerton Naval Complex Operable Unit B Marine Explanation of Significant Differences between the U.S. Navy, the Washington State Department of Ecology, and the U.S. Environmental Protection Agency.
Date Captain, U.S. Navy Commanding Officer, Naval Station Bremerton

Signature sheet for the foregoing Bremerton Naval Complex Operable Unit B Marine Explanation of Significant Differences between the U.S. Navy, the Washington State Department of Ecology, and the U.S. Environmental Protection Agency.
W James J. Pendowski Date I I Manager, Toxics Cleanup Program Washington State Department of .Ecology

Signature sheet for the foregoing Bremerton Naval Complex Operable Unit B Marine Explanation of Significant Differences between the U.S. Navy, the Washington State Department of Ecology, and the U.S. Environmental Protection Agency.
tyffdnael Fv Gearheard Date Director, Environmental Cleanup Office U.S. Environmental Protection Agency

Bremerton Naval Complex
AREA Of 5WREUNE HABITAT RESTORATION
[~~1
SJTE 1 SHORELINE STABILIZATION
CERCLA OREDGIHG AREA
DEPARTMENT OF THE NAVY
NAVAL FACILITIES ENGINEERING COMMAND ENGINEERING HELD ACTIVITY. NORTHWEST
POULSBO, WASHINGTON
SUITABLE NAVIGATION DREDGING AREA
UNSUITABLE NAVIGATION DREDGING ARE
ENHANCED NATURAL RECOVERY
FIGURE 1 OU B MARINE & NAVIGATION
DREDGING ACTION

TOP OF SLOPE OF CAD PIT
FLOOR OF CAD PIT s
TRANSECTS
SPI SURVEY LOCATIONS
GREATER THAN 10 cm OF DEPOSITED MATERIAL
ESTIMATED 0 cm DEPOSITED MATERIAL LINE
\ I I \\ 100-FT. EXTENDED CAP (~ 2FT. THICK) BORDER
CAD PIT STOCKPILE AREA
NOTES:
1. THE SPI SURVEY LOCATIONS IDENTIFY BOTH THE TRANSECT AND THE SAMPLE LOCATION DISTANCE IN METERS FROM THE FLOOR OF THE CAD PIT BOUNDARY (I.e.. SW100 INDICATES SAMPLE COLLECTED ON THE SW TRANSECT. 100 METERS ROM THE CAD PIT FLOOR). THE ADDITIONAL INFORMATION PRESENTED ADJACENT TO THE SPI SURVEY LOCATION IS THE DEPTH OF THE DEPOSITED MATERIAL IN CENTIMETERS AS MEASURED BY THE SEDIMENT PROFILE CAMERA (i.e., 5.85 INDICATES THAT THE DEPOSITED MATERIAL WAS 5.85 cm). FOR THOSE LOCATIONS IN WHICH THE DEPOSITED MATERIAL WAS THICKER THAN THE PENETRATION DEPTH OF THE SEDIMENT PROFILE CAMERA PRISM. THE SEDIMENT DEPTHS ARE INDICATED WITH ">" SIGN (i.e., >10.16 INDICATES THAT THE DEPOSITED MATERIAL WAS GREATER THAN THE SEDIMENT CAMERA PRISM'S PENETRATION DEPTH OF 10.16 CM).
2. SPI SURVEY DATA PROVIDED BY US EPA REGION 10 AND GERMANO & ASSOCIATES, INC.
CAD PIT SITE OWPV1EW
J
TETRA TECH FW, INC.
FIGURE 2
CAD PIT WITH SPI
DEPOSITED MATERIAL DEPTHS
TOP OF SLOPE OF CAD PIT
FLOOR OF CAD PIT
LESENDj.
ED LESS THAN OR EQUAL TO 5.9
GREATER THAN OR EQUAL TO 6.0
GREATER THAN OR EQUAL TO 9.0
GREATER THAN OR EQUAL TO 12.0
100-FT. EXTENDED CAP (~ 2FT. THICK) BORDER
o CAD PIT STOCKPILE AREA
OU B MARINE BOUNDARY
NAVY PROPERTY BOUNDARY LINE
LOCATION 1 2 3 4
5
6 7
NORTHING (FT) 204922.1 2047715 204783.6 204810.3 205011.2 205535.8 205701.6
EASTING (FT) 1188721.3 1188983.5 1189341.0 1189673.1 1189705.0
1189928.3 1189949.4
CAD PIT SITE
DEPARTMENT OF THE NAVY NAVAL FACILITIES ENGINEERING COMMAND ENGINEERING HELD ACTIVITY. NORTHWEST
POULSBO. WASHINGTON
TETRA TECH FW. INC
FIGURE 3 OU B MARINE BOUNDARY AND
PCS (mg/kg OC) CONTOURS

AVAILABLE
AREA
1
2
3
4
5
6
7
8
9
10
LEGEND
> 4.0' AVAI BLE 3.5' 4.0' VAILABLE 3.0' 3.5' VAILABLE DATUUS2.5' 3.0' 2.0' 2-5'
VAILABLE VAILABLE
HQWIZCNTAL.
WRTICAL:
NAO S3 WA SPC North Zone
WJ.W •
1.5' 2,0' VAILABLE 1.0' 1.5' VAILABLE 0.5' 1.0' VAILABLE 0.0' 0.5' VAILABLE 150 300
D NONE AVAILABLE
VOLUMES SPECIFIED BY DMMU AREAS
DMMU VOLUME
S5 1.985 C
57 4.117 C
S19 1.650 C
S28 1.943 C
2,530 C
S30 1.399 C
531 1.921 C
532 2.558 CY
S43 2.437 CY
S50 1.259 CY
TOTAL 21.799 CY
DEPARTMENT OF THE NAVY NAVAL FACILITIES ENGINEERING COMMAND tNGINEERING FIELD ACTIVITY, NORTHWEST
POULS80. WASHINGTON
TFTRA TECH FW, INC.
FIGURE 4 TURNING BASIN ENR
SOURCE MATERIAL