explaining race and ethnic disparities in birth weight in chicago
TRANSCRIPT

RAND is a nonprofit institution that helps improve policy and decisionmaking through research and analysis.
RAND’s publications and drafts do not necessarily reflect the opinions or policies of its research sponsors.
Explaining Race and Ethnic Disparities in Birth Weight in Chicago Neighborhoods
Narayan Sastry Jon Hussey
DRU-2933
September 2002
Labor and Population Program Working Paper Series 02–14
The RAND unrestricted draft series is intended to transmit preliminary results of RAND research. Unrestricted drafts have not been formally reviewed or edited. The views and conclusions expressed are tentative. A draft should not be cited or quoted without permission of the author, unless the preface grants such permission.
R
† Helpful comments and feedback were provided by Gunnar Almgren at many stages of the work reported in this paper and are gratefully acknowledged. The authors also thank Glenn Good, Chicago Department of Public Health, and Barbara Sullivan, Illinois Department of Public Health.
Explaining Race and Ethnic Disparities in Birthweight in Chicago Neighborhoods†
September 2002
Narayan Sastry RAND
1700 Main Street, P.O. Box 2138 Santa Monica, CA 90407
and
Jon M. Hussey Department of Maternal and Child Health
School of Public Health and Carolina Population Center
University of North Carolina at Chapel Hill Chapel Hill, NC 27599-7445

Abstract
This paper examines the contribution of neighborhood and maternal characteristics to
birthweight differentials among infants born to non-Hispanic black, non-Hispanic white, and
Mexican-origin Hispanic mothers (of any race). Linear regression models with neighborhood
fixed effects were estimated using birth certificate records for all births in Chicago from 1990.
About 30 percent of the black/white disparity and about 14 percent of the black/Mexican-origin
Hispanic disparity were due to neighborhood conditions. Adjusting for neighborhood and
maternal characteristics accounted for 64 percent of the black/white differential and 57 percent
of the black/Mexican-origin Hispanic differential. Around half of the black/white differential
and the black/Mexican-origin Hispanic differential in birthweight were due to differences, across
racial/ethnic groups, in the relationship between measured characteristics and birthweight.
Efforts to close the birthweight gap between non-Hispanic black and other infants must go
beyond programs aimed solely at reducing the level of risk factors among African-American
women. Future interventions also need to address the causes of differences in the effects of key
risk factors across racial and ethnic groups.

1
1. Introduction
Group differences in health reflect unequal life chances. Studying these differences can
reveal important etiological mechanisms in the pathway to disease and is also valuable for
identifying the groups most in need of—and most likely to benefit from—societal investments in
health (Preston and Taubman, 1994). For these reasons, explaining the large and persistent race
and ethnic disparities in birth outcomes and infant health in the U.S. is a priority. Despite
dramatic improvements over the past century in the health of all infants, significant differences
persist. Today, black infants are about 2.5 times more likely to die than white infants (Hoyert et
al. 2001), compared to 1.5 times in 1900 (Preston and Haines, 1991). The public health impact
of this disparity is enormous but under appreciated. If black newborns faced the same mortality
risk as white newborns, over 60 percent of black infant deaths—a total of about 5,000—would
be averted each year.1
Birthweight is a key indicator of the health of infants at birth, as well as of the mother’s
reproductive health. It is likely to play a key role in the production of race and ethnic group
differences in infant survival because it is one of the strongest predictors of infant mortality risk
(Cramer, 1987; Institute of Medicine, 1985; Mathews, MacDorman, and Menacker, 2002).2 In
1 In 1999 there were 605,970 black births (Ventura et al. 2001) and 8,822 black infant deaths (Hoyert et al.
2001). The white infant mortality rate in 1999 was .0057675 (Hoyert et al. 2001). Applying the white IMR to black
births results in 605,970 x .0057675 = 3,495 expected infant deaths. Thus there were 8,822 actual - 3,495 expected
= 5,327 excess black infant deaths in 1999.
2 In studying the effects of birthweight on infant mortality it is difficult to independently consider the
effects of birthweight from those of prematurity because of the strong association between low birthweight and pre-
term delivery (i.e., delivery before 37 weeks of gestation). In our analysis, we examine birthweight conditional on
gestation length.

2
the mid-1990s, the mean birthweight for singleton black infants in the U.S. was 3,132 grams,
about 277 grams less than the mean birthweight of 3,409 grams for whites (Martin, MacDorman,
and Mathews, 1997). Compared to whites, the variation in black birthweights is also larger and
skewed to the left. The net result is that black infants are more than twice as likely as white
infants to be born at birthweights below 2,500 grams (Martin et al., 2002), where the risk of
infant death is 24 times greater than for birthweights above 2,500 grams, and three times more
likely than whites to be born at birthweights below 1,500 grams, where the risk of infant death is
100 times greater (Mathews, MacDorman, and Menacker, 2002).
The impact of birthweight appears to extend well beyond infancy. According to the fetal
origins hypothesis (Barker, 1998), fetal undernutrition, for which low birthweight is a marker,
may permanently program the body—for example, by reducing the numbers of cells in specific
organs, changing the distribution of cell types, or influencing metabolic processes. These
programmed changes are associated with a variety of chronic disease outcomes during adulthood
and old age, such as diabetes (Barker et al., 1993), hypertension (Law et al., 1993), and
cardiovascular disease (Rich-Edwards et al., 1997). In addition, birthweight may affect
physiological and developmental outcomes extending from infancy through childhood and into
adulthood. Studies have found a significant association between birthweight and school age
disabilities (Avchen, Scott, and Mason 2001), behavioral problems (Sommerfelt, Ellertsen, and
Markestad, 1993), school-age reading and math scores (Boardman et al., 2002; Jefferis, Power,
and Hertzman, 2002), cognitive function during young adulthood (Sorensen et al., 1997;
Richards et al., 2001), and adult educational attainment (Conley and Bennett, 2000), as well as
reproductive outcomes such as low birthweight (Sanderson, Emanuel, and Holt, 1995; Wang et
al., 1995), preterm birth (Porter et al., 1997), and gestational diabetes (Innes et al., 2002). It is
3
unclear, however, the extent to which birthweight has a causal effect on these outcomes
(reflecting intrauterine malnutrition, for example) or, instead, reflects the influence of
unmeasured family background or genetic factors or confounding through, for instance, postnatal
nutrition and stimulation.
Nevertheless, the implication of this research is that improvements in birthweight are
likely to have a large pay-off in several different domains. Most obviously, it will represent an
important enhancement in infant and maternal health. Second, it will lead to better health and
developmental outcomes during childhood and adolescence and lower levels of chronic disease
during adulthood and old age. Finally, reducing birthweight disparities by race and ethnicity will
contribute to a reduction of inequalities across these groups in an array of health outcomes.
The goal of this paper is to explain race and ethnic disparities in birthweight in the city of
Chicago, Illinois. Our analysis drew on vital statistics data for all singleton births in 1990
registered to Chicago resident mothers. Vital statistics contain considerable information on
mothers’ characteristics and pregnancy-related circumstances. We estimated a comprehensive
series of models to examine the role that these factors played in accounting for differences in
birthweight. We also examined variation, by race and ethnicity, in the association between these
characteristics and birthweight. Our analysis incorporated several methodological advances that
distinguish it from previous work on this topic. Of particular note is that we estimated models
with tract-level fixed effects that absorbed the influence of all neighborhood-level characteristics.
We were able to include such a control because the data were geocoded to identify neighborhood
of residence for each woman. This is a major advantage of using data from a single city, with
the cost being a potential lack of generalizability of the findings to other areas.
Non-Hispanic blacks in Chicago in 1990 had significantly lower average birthweights

4
than non-Hispanic whites and Mexican-origin Hispanics. Birth outcomes were qualitatively very
similar for non-Hispanic whites and Mexican-origin Hispanics, which is remarkable because the
latter group was comprised largely of first-generation immigrants with relatively low levels of
education and other disadvantages. This “Hispanic paradox” has been widely noted in the
literature (e.g., Gorman, 1999; Fuentes-Afflick and Lurie, 1997; Buekens et al., 2000). The
results from our regression analysis indicate that neighborhood-level factors, socioeconomic and
demographic background variables, and pregnancy-related behaviors accounted for a substantial
portion of differences in birthweight across the three race and ethnic groups. In particular, these
variables explained between half and two-thirds of the difference in average birthweight between
non-Hispanic blacks and whites (and similar proportions when blacks were compared with
Mexican-origin Hispanics); on the other hand, the variables accounted for all of the difference
between non-Hispanic whites and Mexican-origin Hispanics.3 There was, in addition, important
variation in the effects of certain variables across the three race and ethnic groups. These
differences, together with the effects of unmeasured or unmeasurable variables, accounted for the
3 Previous studies have explained substantially less of the disparities between non-Hispanic blacks and
other race and ethnic groups in birthweight or the risk of low birthweight (Institute of Medicine, 1985). For
example, Shiono et al. (1997) investigated 46 previously defined and new potential risk factors and found that, at
best, they could account for less than one-third of the gap in birthweight between African-Americans and whites in
Chicago and New York. Berg, Wilcox, and d’Almada (2001) found that socioeconomic and behavioral factors
explained approximately 10-15 percent of the higher rate of very low birthweight among black mothers in Georgia.
Finally, Gorman (1999), using the linked birth and death data set for 1990, reported that the unadjusted risk of a low
birthweight birth was 2.637 times greater for non-Latino blacks than for non-Latino whites; after adjusting for a set
of individual-level and county-level covariates, the odds ratio dropped to only 2.165. In contrast, a number of
previous studies have fully accounted for birthweight disparities between Hispanics and non-Hispanic whites with a
standard set of covariates (e.g., Hessol and Fuentes-Afflick, 2000).

5
remainder of the gaps in birthweight by race and ethnicity.
The paper is organized as follows. We begin, in the next section, with a description of
our conceptual framework and modeling approach. In Section 3, we outline our statistical
methods. In Section 4, we provide a detailed overview of the data and the covariates that we
considered. We present the model results in Section 5. We discuss policy issues in the final
section.
2. Conceptual Framework and Modeling Approach
In this section, we present the conceptual framework that guides our analysis and
describe our modeling approach. The conceptual framework shows the range of factors affecting
birthweight and organizes them into a logical arrangement. It helps us to identify specific
variables to include in our analysis and to recognize factors that are unmeasured or
unmeasurable. Our modeling approach operationalizes the conceptual framework and tackles
several potentially important methodological issues.
Our conceptual framework for analyzing the covariates of birthweight is presented in
Figure 1. It is organized, left-to-right, from the distal to the proximate determinants. The
outcome, birthweight, appears on the far right. Among the distal or background factors, few
affect birthweight directly. Rather, they generally operate through the proximate or intermediate
factors shown in the center of the figure.
The various factors covered in the conceptual framework are also organized from top to
bottom according to the level at which they operate or are manifested. Child-specific factors
appear at the top, mother, family or household factors in the middle, and community factors at
the bottom. The boxes with the solid lines for borders represent the measured variables
(described in Section 4 in more detail). Boxes with dashed lines for borders identify factors that
6
are unmeasured but potentially measurable. Finally, the shaded boxes represent unobserved
factors that cannot be measured easily.
Child sex is our only child-specific background factor. It is well documented that males
have higher birthweights than females. Unmeasured child-level factors include various
dimensions of the health of the specific pregnancy. Below we explain why and how unmeasured
factors may affect our analysis.
Relevant measured background characteristics of the mother and family include the
mother’s age, race and ethnicity, education, nativity, and marital status. As discussed below, a
key variable that is unavailable from vital statistics is household economic status. Finally, many
aspects of the mother’s inherent healthiness are not measured and cannot be measured
satisfactorily. This includes, for example, her genetic endowment that either predisposes or
protects her—and her child—from adverse health outcomes.
There is a potentially large group of neighborhood- or community-level factors that might
affect birthweight.4 The existing literature on this topic, although growing, is at present
relatively small primarily because few data sets with information on birth outcomes also include,
or can be linked with, data at the neighborhood level. We included no neighborhood level
factors in our models. This is because their inclusion would distract from the main goal of this
paper, which is to examine race and ethnic disparities in birthweight. Nevertheless, we believe
4 Previous research has examined the effects of various demographic, social and economic characteristics
of neighborhoods on birth outcomes (Collins and David, 1997; O’Campo et al., 1997; Roberts, 1997; Pearl,
Braveman, and Abrams, 2001; Rauh, Andrews and Garfinkel, 2001). Neighborhood demographic factors have
included the age, race, and ethnic composition of residents; social characteristics have included marital status and
immigration status; and economic characteristics have included the proportion of the population falling below the
poverty line, rates of welfare receipt, and home ownership levels.

7
that neighborhood factors are likely to be important. To reconcile these two perspectives, we
included, separately for each tract, a single dummy variable. This variable captures the effects of
all measured—and unmeasured—factors operating at the tract level and hence allowed us to
control for the complete set of neighborhood variables, although it does not permit us to identify
the specific aspects of neighborhoods that are important.5
Intermediate child- or pregnancy-specific risk factors include gestation length,
interpregnancy interval, parity, and medical risk factors. Birthweight is closely tied to gestation
length and it is essential to control for this because there are systematic differences in gestation
length according to race and ethnicity. A pregnancy that occurs only a short duration after the
previous one ended can tax the mother physically and nutritionally and lead to a baby with a
lower birthweight. Parity may represent a similar cumulative process, but there may be benefits
(such as experience) as well as costs to reaching higher parities. A variety of medical risk factors
may directly affect birthweight.
Smoking and alcohol use are intermediate factors that represent longer-term health
behavior choices of mothers. There is considerable evidence that smoking and alcohol use lead
to lower birthweight and worsen other birth outcomes (Lundsberg, Bracken, and Saftlas 1997;
Sprauve et al. 1999). Finally, use of health services represents mother-specific behavior that is
also influenced by neighborhood level factors such as the availability of health care. We
consider three specific dimensions of health service use: prenatal care, birth attendance, and
place of delivery. Prenatal care has been hypothesized to be a key intermediate factor affecting
5 We used census tracts to represent neighborhoods. Census tracts are of moderate size and closely
approximate social definitions of neighborhoods. There is no consequence to this choice if neighborhoods are in
reality comprised of multiple tracts. However, it will matter if true neighborhoods have boundaries that bisect tracts
or are smaller than tracts.
8
birth outcomes and, in particular, to be one that is amenable to policy intervention. However,
evidence for the relationship between prenatal care and birthweight is inconsistent (Alexander
and Korenbrot, 1995; Fiscella, 1995; Huntington and Connell, 1994). In particular, many studies
have found greater prenatal care to be associated with lower birthweight and worse birth
outcomes or for beneficial effects to be substantially underestimated (Frick and Lantz, 1996).
These findings point to the ways in which unobservable pregnancy- or mother-specific
characteristics can shape the nature of the relationship between certain intermediate
characteristics and birthweight. It is unreasonable to conclude from this evidence that prenatal
care is unassociated with or reduces birthweight. Rather, the observed association reflects the
adverse selection among mothers who are experiencing a difficult pregnancy, or who are
unhealthy, that leads them to obtain earlier and more intensive prenatal care.6 Our use of cross-
sectional data unfortunately precluded us from addressing the problem of adverse selection (e.g.,
regarding use of prenatal care) or endogeneity (e.g., regarding neighborhood of residence).
Our conceptual framework suggests an analytical approach to disentangling the effects of
race and ethnicity on birthweight. The starting point is to examine the gross differences in
birthweight across race and ethnic groups. The next step is to remove the effects of
neighborhood factors which, for the current analysis, we view principally as a nuisance. We did
so by examining race and ethnic disparities in birthweight with a model that included a control
solely for tract of residence. We then began a more systematic analysis of the background and
intermediate factors identified in the conceptual framework. We first estimated models that
6 Mismeasurement of the number of prenatal visits and the timing of prenatal care may lead to downward
bias in the estimated effects of prenatal care on birthweight (Penrod and Lantz, 2000). Penrod and Lantz (2000)
noted that birth certificate reports of prenatal care, which we used, provided the best source of information.

9
looked at the effects of background factors alone. The results from these models show the gross
effects of background factors while controlling for other background factors but none of the
pathways or intermediate factors through which background characteristics affect birthweight.
The next step was to add intermediate factors to the previous model. These results reveal how
these intermediate factors affect birthweight. They also shed light on ways in which the
background factors affect birth outcomes. In particular, by examining differences in the effects
of background factors between this model and the previous one, we learn the extent to which the
intermediate factors included in our models account for the gross effects.
Our first set of results show the disparities in birthweight by race and ethnic group—as
well as the factors that account for these disparities—based on models using data that were
pooled across the different groups. This approach has the advantage of providing a simple and
clear way to examine the gross and net effects of race and ethnicity. In particular, the disparity
in birthweight between the (omitted) baseline group and any other race and ethnic group is
represented by the coefficient on a dummy variable. This coefficient can be read directly from a
table of results and is straightforward to understand and interpret. A shortcoming of the pooled
data approach, however, is that it constrains the effects of all covariates to be identical for all the
different race and ethnic groups. Imposing this structure on the model may be wrong and
potentially misleading if the effects of covariates are substantially different across race and
ethnic groups. One solution would be to estimate models that allow for certain covariate effects
to vary by race and ethnicity through the use of interaction effects. A more general approach is
to stratify the data and estimate separate models for the different groups. The results from the
stratified model are equivalent to those from a model that includes the full set of interaction
effects involving race and ethnicity, although the former model is simpler to understand and

10
interpret. However, it is not straightforward to summarize disparities in birthweight that remain
after controlling for the included covariates using either of these models. To do this we draw
instead on a simple decomposition of birthweight disparities that separates the total difference
into two components, with the first component representing the contribution of differences in
characteristics and the second component representing the differences the effects of any given
set of characteristics. This decomposition in essence constructs a counterfactual case that
estimates what the mean birthweight for one group (e.g., non-Hispanic whites) would be if they
had their own characteristics but the relationship between these characteristics and birthweight
that prevailed for another group (e.g., non-Hispanic blacks).
3. Statistical Methods
We used linear regression models to estimate the effects on birthweight of the factors
discussed above. There are several methodological issues that we addressed and we discuss each
of these in turn.
We modeled birthweight as a continuous outcome, in contrast to most—but not all—of
the previous literature which has used a dichotomous variable that distinguishes low birthweight
(<2,500 grams) from normal birthweight and logistic regression techniques.7 We did so because
a tremendous amount of information is discarded in the process of converting a continuous
variable into a dichotomous one. This is problematic because it results in a loss of statistical
power to estimate covariate effects with precision, which it makes it more difficult to uncover
true relationships that are present in the data.
7 Examples of recent studies analyzing birthweight as a dichotomous outcome include Roberts (1997),
O’Campo et al. (1997), and Zhu et al. (1999). Among studies examining birthweight as a continuous outcome are
David and Collins (1997), Pearl, Braveman, and Abrams (2001), and Shiono et al. (1997).

11
Although the cut-off of 2,500 grams is a meaningful in certain ways, in others it is
arbitrary. As Rose (1992) notes, disease is nearly always a quantitative rather than a categorical
phenomenon and hence has no natural definitions. The sharp distinction provided by the contrast
of low birthweight with normal birthweight is in many ways a medical artifact. In particular, any
increase in birthweight generally leads to better health and development outcomes, though the
benefits are relatively large below 2,500 grams. This is illustrated in Figure 2, which shows the
relationship between birthweight and infant mortality risk for Chicago in 1990 based on the vital
statistics described below. This figure demonstrates first of all why birthweight is important:
throughout virtually its entire distribution, higher birthweight is clearly associated with lower
infant mortality risks.8 The rise in infant mortality risks at the high end of the birthweight
distribution suggests that increases in birthweight may not be always be beneficial.9
We incorporated tract-level fixed effects in our models to capture the effects of all factors
influencing birthweight that were common to births occurring in the same neighborhood. These
factors include measurable and unmeasurable neighborhood characteristics as well as individual
level attributes that are shared among all mothers in the same tract. Most prior studies (e.g.,
8 Wilcox (2001) raises the important point that a unit increase in birthweight may not have the same effects
on infant mortality risks across the three ethnic groups, given their different birthweight distributions. However, it is
not clear whether this extends to other important outcomes that are also of interest, such as measures of development
and other health outcomes—particularly those in later childhood and in the adult years. Given this uncertainty, we
decided not to analyze birthweight normalized by ethnic group, the approach Wilcox suggests.
9 The rise in mortality risks for birthweights above 4,750 grams is the result of birth trauma (Spellacy et al.,
1985) and congenital anomalies and congenital syndromes such as hypoglycemia that are often associated with
gestational diabetes (Jones, 2001). However, relatively few babies are born with birthweights this high. In Chicago
in 1990, less than four-tenths of one percent of babies had birthweights above 4,750 grams.

12
Collins, Schulte, and Drolet, 1998; Roberts, 1997; Pearl, Braveman, and Abrams, 2001;
O’Campo et al., 1997) have only partly adjusted for neighborhood characteristics through the
incorporation of measured community-level variables. This is necessarily true because the array
of community level variables available through the decennial census or most other data sources
is limited. Controlling for omitted neighborhood variables though the use of fixed effects also
provides a way to account for the correlation among birthweights in the same tract that would
otherwise result in standard errors for parameter estimates being understated. Fixed effects
models represent a specific alternative to the multilevel modeling approach that is growing in
popularity among studies in public health, sociology, and other disciplines (Goldstein, 1995). In
particular, multilevel models are based on the incorporation of random effects (at one or more
levels) that absorb level-specific errors. However, an important assumption behind standard
multilevel models is that the random effects are independent of the measured covariates that
appear in the model. This assumption may be violated quite commonly. However, few
researchers test this assumption, although a straightforward statistical test, developed by
Hausman (1978), is available. In contrast, fixed effects models provide a simple means to
control for the possible correlation between these unmeasured effects and the covariates that
appear in the model by including a separate dummy variable for each tract represented in the
data. To the extent that this correlation is present and important, it means that random effects
models, in contrast to fixed effects models, lead to biased and inconsistent parameter estimates.10
The fixed effects approach was a better choice for our analysis because a series of formal
Hausman tests comparing this approach to the random effects approach consistently rejected the
assumption on which the random effects model is based (namely, that the regressors and the
10 Random effects models provide more efficient estimates, and hence are preferred, when correlation
between the unobserved effects and measured covariates is unimportant.

13
random tract-level effect are uncorrelated). The main disadvantage of a fixed-effects approach is
that it precludes our being able to include neighborhood-level variables in the models. However,
examining the effects of specific neighborhood-level factors is not a goal of this paper.
An additional complication in studies such as ours that analyze data from contiguous
neighborhoods is the potential for spatial correlation. Similarities, or interactions, between
neighboring areas could lead to spatial correlation in the error terms. Standard errors that do not
take this correlation into account may be understated, leading possibly to incorrect statistical
inference. However, the fixed effects capture not only tract-specific factors, but also correlation
among tracts. Thus the fixed effects approach removes much of the problem of spatial
correlation. Finally, we report heteroscedasticity-consistent standard errors (estimated via the
Huber/White/sandwich procedure) that should also diminish the effects of any remaining spatial
correlation.
4. Data and Setting
The data for our study are based on individual birth certificate records for all births in
1990 that occurred to mothers who resided in the city of Chicago, Illinois.11 The size and
diversity of Chicago and the large health disparities found there make this city an interesting and
important setting for our research. Chicago is the third largest city in the United States (U.S.
Census Bureau, 2001a). It has the second largest African American and third largest Hispanic
populations in the country (U.S. Census Bureau, 2001b, 2001c). Furthermore, Chicago has a
large number of immigrants, half of whom originate in Central or South America (U.S. Census
11 Mothers from suburban locations who gave birth in Chicago hospitals are excluded. Virtually all (99.3
percent) births to Chicago-resident mothers in 1990 occurred in Cook County; the remainder occurred in contiguous
counties, with a small number occurring outside Illinois (primarily in Indiana).

14
Bureau, 2001d).
There were 60,242 live births to Chicago-resident mothers in 1990. For our analysis, we
used information on 49,104 singleton births with complete information that were born to mothers
who were non-Hispanic white (12,918 births), non-Hispanic black (26,005), or Mexican-origin
Hispanic (10,181). We excluded all 1,530 multiple births (2.5 percent of total) because they
differ systematically from singleton births and the approximately 3,235 of births (5.4 percent of
total) that were missing key variables (such as birthweight or mother’s race and ethnicity). We
also excluded 6,373 births to mothers of other race and ethnic groups. The majority of these
births (4,440) were to non-Mexican Hispanics, principally mothers from Puerto Rico (2,808) and
Central and South America (881). We focused on the three largest race and ethnic groups
because the sizes of the remaining groups were substantially smaller and preliminary findings
suggested that the different groups could not be pooled.
A key feature of these data is that the residential address of the mother was geocoded—
that is, the latitude and longitude coordinates specifying the exact location of the residence were
calculated and assigned to each record. The geocoded address was used to determine the census
tract of residence.12 Approximately 99 percent of addresses were successfully geocoded with a
valid census tract identifier.
The 1989 revision of the U.S. Standard Certificate of Live Birth collects a considerable
amount of information on the pregnancy, the birth, and demographic characteristics of the
12 The data were geocoded by the Chicago Department of Public Health. The Illinois Department of Public
Health also created a database with geocoded birth records. However, we relied on the Chicago Department of
Public Health database because its geocoding was more accurate. In particular, geocoding errors affecting as much
as 10 percent of all Chicago birth records for the period 1989-1996 were discovered in the birth record files from the
Illinois Department of Public Health.

15
mother (see National Center for Health Statistics, 1999). Pregnancy-related information includes
live-birth order and parity, preceding birth interval, gestation length, prenatal care, tobacco and
alcohol use during pregnancy, weight gained, medical risk factors, and obstetric procedures.
Birth information includes birthweight, place of delivery, method of delivery, and delivery
attendant, Apgar score, complications of labor and delivery, abnormal conditions of the newborn,
and congenital anomalies. Finally, information on the mother includes her race and ethnicity,
national origin, age, educational attainment, and marital status. There is no information from the
birth certificate on the economic status of the mother or her household. The certificate asks
about the father’s characteristics, such as his age, race/ethnicity, place of birth, and education,
but missing data is a major problem. Information contained in birth certificates is largely
retrospective and hence may be misreported. Although this is unlikely for certain characteristics,
such as education, it is more likely for use of alcohol, tobacco, and illicit substances. Validation
studies suggest that birth weight is recorded very reliably on birth certificates (Buescher et al.
1993; Piper et al. 1993). Information on maternal medical risk factors, complications of labor
and delivery, and conditions of the newborn appears to be somewhat less reliable (Adams 2001;
Buescher et al. 1993; Piper et al. 1993). Although data on tobacco use during pregnancy appear
to be more reliable than data on alcohol use, there is evidence that both behaviors are
underreported on the birth certificate (Buescher et al. 1993; Piper et al. 1993).
Birthweight
The mean birthweight for the analysis sample was 3,236 grams (see Table 1). Non-
Hispanic whites had a mean birthweight of 3,419 grams, while non-Hispanic blacks averaged
3,087 grams and Mexican-origin Hispanics’ mean birthweight was 3,384 grams.
Although differences in average birthweights across the three groups were relatively
16
modest, they translated into substantial differences in low birthweight rates. For example, 13.4
percent of births to non-Hispanic blacks were of low birthweight (< 2,500 grams) which was
almost three times higher than the rate among non-Hispanic whites of 4.8 percent.
Model Covariates and their Differences Across Race and Ethnic Groups
The covariates of birthweight that we examined were suggested by the conceptual
framework outlined above and circumscribed by information contained in vital statistics for
births. Although the specific covariates were similar to those used in previous studies, a number
were coded differently and we highlight these differences in the brief overview of model
covariates that we provide here. We also discuss similarities and differences in summary
statistics for covariates across the three race and ethnic groups.
The list of covariates we examined appears in Table 2, along with the means for the three
race and ethnic groups and the analysis sample as a whole. Background child and mother
characteristics included child sex and mother’s age, marital status, nativity, education, and race.
For mother’s education, Table 2 shows summary statistics for the number of years of schooling.
In our models, however, we examined the effects of years of schooling beyond the eleventh
grade. Our preliminary models suggested that it was reasonable to pool all mothers who had not
completed high school as a single, homogenous group and then consider the linear effects of an
additional year of education. This provided a good compromise between simplicity and
obtaining a good fit to the data. In particular, it was much better than treating education as linear
through its entire range or having a dummy variable comparing high school-graduates with non-
high school graduates. The other background variables followed standard coding practices.
There were large differences between race and ethnic groups in mother’s education,
nativity, marital status, and age. Mexican-origin Hispanics had substantially lower levels of
17
education and were vastly more likely to have been foreign born. Mean years of education for
Mexican-origin Hispanic mothers was 8.9 years, three years below that for non-Hispanic blacks
and almost four and a half years below non-Hispanic whites. Over 80 percent of Mexican-origin
Hispanics were foreign born, in contrast to 18 percent of non-Hispanic whites and fewer than
two percent of non-Hispanic blacks. Non-Hispanic blacks stand out in terms of the percent of
births to unmarried mothers, which at 82 percent were two-and-a-half times higher than the
proportion for Mexican-origin Hispanics and over four times higher than for non-Hispanic
whites. Non-Hispanic blacks had births at much younger ages than women in the other two
groups.
Intermediate covariates included first birth status, interpregnancy interval, gestation
length, adequacy of prenatal care, medical risk factors, tobacco and alcohol use, place of
delivery, and birth attendant. The interpregnancy interval was modeled as a three-part linear
spline13 that provided an excellent fit to the data—substantially better than treating this covariate
as a categorical variable (for example, as in Rawlings, Rawlings, and Read, 1995 or Zhu et al.,
1999). Our coding of this variable was based on a preliminary analysis that showed birthweight
to have a very strong positive relationship with interpregnancy intervals when there was less than
12 months separating births, a moderate positive relationship for interpregnancy intervals
between 12 and 59 months, and finally a weak negative relationship after 60 months. First births
were set to the mean and were flagged using a separate covariate. Gestation length was also
modeled as a spline, with a break at 41 weeks reflecting that birthweight increased with gestation
length up to this point and declined beyond it. Information from the birth certificate on the
13 A spline is a piecewise function comprised of connecting linear segments. It provides a simple and
straightforward approach to modeling non-linear relationships.

18
number of prenatal care visits and the month during the pregnancy that prenatal care began were
recoded into Kotelchuck’s (1994a and 1994b) Adequacy of Prenatal Care Utilization Index that
included two parts. The first part provides an assessment of the timing of prenatal care initiation
and the second part describes the frequency of visits received after initiation. In addition, we
examined the effects of the number of prenatal care visits which was also modeled as a two-part
spline with a knot at the mean of 14 visits. Information on 16 different medical risk factors
during pregnancy was collected on birth certificates beginning in 1989. In our models we
included a covariate indicating whether a woman had any medical risk factors because the
quality of the information on any specific item is subject to reporting error.
Non-Hispanic whites generally had the most favorable set of intermediate factors relating
to pregnancy and delivery. They had the lowest fertility rates, although they subsequently had
shorter interpregnancy intervals. Almost half of births to non-Hispanic whites were first births,
in contrast to around one-third of births for the other two groups. Non-Hispanic whites were far
more likely to have had adequate or better prenatal care, according to both timing of initiation of
care and the number of prenatal care visits. Approximately 90 percent of non-Hispanic whites
had adequate or better prenatal care initiation, compared to three-quarters of non-Hispanic blacks
and Mexican-origin Hispanics. Non-Hispanic whites reported a higher number of medical risk
factors than the other two groups, although this may be related to the better prenatal care that
they received.
Mexican-origin Hispanics had a number of highly favorable intermediate factors. Most
notably, they had very low reported rates of smoking and alcohol use during pregnancy. Less
than three percent of Mexican-origin Hispanic mothers reported smoking during pregnancy,
compared to 17 percent of non-Hispanic whites and almost 20 percent of non-Hispanic blacks.
19
Half of one percent of Mexican-origin Hispanics reported consuming any alcohol during
pregnancy; rates for non-Hispanic blacks and whites were roughly seven times higher, although
non-Hispanic black mothers who drank reported an average of 2.4 alcoholic drinks per week
compared to 1 drink per week by non-Hispanic white mothers who drank. Smoking and alcohol
use during pregnancy was self-reported by mothers and hence may be subject to reporting biases.
Mexican-origin Hispanics were less likely to have a medical risk factor (only 12 percent did)
compared to non-Hispanic blacks (17 percent) or non-Hispanic whites (20 percent).
Similar across the three race and ethnic groups were place of delivery and birth attendant.
Adequacy of prenatal care initiation was similar for non-Hispanic blacks and Mexican-origin
Hispanics, although the latter group had more prenatal care visits. These two groups also had
similar reproductive patterns, as reflected in the number of first births. Finally, non-Hispanic
whites and Mexican-origin Hispanics had similar mean gestation length (of 39.2 weeks), while
non-Hispanic blacks had a shorter mean length (38.5 weeks).
5. Results
Our results are presented in three subsections. In the first subsection, we present results
for models estimated using data pooled across the three race and ethnic groups. We then present
models estimated separately for each groups. Finally, we present a decomposition of race and
ethnic differences in birthweight.
All our results are based on linear regression models described above. The parameter
estimates show the effect on birthweight in grams of a one-unit increase in the explanatory
variable for a continuous covariate or a one-category change, compared to the baseline group, for
a categorical covariate. The tables of results include, for each parameter estimate, its standard
error in parentheses and indicate the level of statistical significance.

20
Results from Models Estimated Using Pooled Data
We present our first set of findings in Table 3, which shows results for four different
models of birthweight estimated using data pooled across all three race and ethnic groups. We
begin by focusing on race and ethnic differences in birthweight across the four models. In
Model I, which includes only a control for race and ethnicity, we recover the means from Table 1
and highlight the differences in birthweight between the baseline group (non-Hispanic blacks)
and the other two groups (non-Hispanic whites and Mexican-origin Hispanics). The parameters
in this model can be interpreted as the average difference in birthweight between non-Hispanic
blacks and, say, non-Hispanic whites if we picked one non-Hispanic black birth and one non-
Hispanic white birth from anywhere in Chicago. On average, we would find that non-Hispanic
whites had birthweights 332 grams higher than non-Hispanic blacks. Birthweights for Mexican-
origin Hispanics were only slightly lower than the average for non-Hispanic whites, but were
substantially above those for non-Hispanic blacks.
The introduction of fixed effects for each census tract in Model II changes the nature of
the comparison of birthweights across race and ethnic groups. In particular, by controlling for
all measurable and unmeasurable neighborhood-level variables through the use of a tract-specific
dummy variable, we are essentially examining birthweight disparities by race and ethnic group
among births that occurred in the same neighborhood. We find that neighborhood factors
accounted for 30 percent of the average birthweight disparity between non-Hispanic whites and
non-Hispanic blacks; the difference in birthweight between these two groups is 231 grams in
Model II, down from 332 grams in Model I. The birthweight disparity between non-Hispanic
blacks and Mexican-origin Hispanics dropped 14 percent, from 297 grams to 255 grams. Fixed
effects provide a nearly perfect control for neighborhood characteristics, although they provide

21
no insights into what specific neighborhood factors might be important. In addition,
neighborhood effects in the model will pick up any observed or unobserved individual
characteristics that were shared by all births in the same tract. Nevertheless, these results suggest
that neighborhood factors played a significant role in explaining race and ethnic differences in
birthweight.
Models III and IV introduce additional controls for background and intermediate
characteristics. We interpret the coefficients for race and ethnicity in these models to be the
average difference in birthweight among births in the same neighborhood after controlling for
differences in mother’s education, nativity, marital status, age, and child sex (Model III) and, in
addition, birth order, interpregnancy intervals, gestation length, prenatal care, medical risk
factors, smoking and alcohol use, place of delivery, and delivery assistance (Model IV).
We find from Model III that background factors accounted for 17 percent of the total
birthweight differential between non-Hispanic blacks and non-Hispanic whites, while adding
intermediate factors accounted for a further 17 percent of the differential. For the comparison
between Mexican-origin Hispanics and non-Hispanic blacks, background factors explained 14
percent of the differential while intermediate factors explained an additional 30 percent. Model
IV, which includes the full set of covariates, explained 64 percent of the birthweight differential
between non-Hispanic blacks and non-Hispanic whites and 57 percent of the differential between
Mexican-origin Hispanics and non-Hispanic blacks. Note, however, that the remaining
unexplained birthweight differential is statistically significant at the .01 level for both
comparisons (although the difference between non-Hispanic whites and Mexican-origin
Hispanics is not statistically significant). Our results indicate that observed differences in a
comprehensive set of covariates describing the mother’s demographic and social characteristics,
22
as well as behaviors leading up to and during her pregnancy, accounted for a considerable part of
the differences across race and ethnic groups—however, they did not explain it all. Roughly 36-
43 percent of the differential between non-Hispanic blacks and the two comparison groups
remains unexplained by the variables in our model.
Two sets of factors account for the unexplained portion of the differential. First, several
potentially important covariates were not included in the model, because they were either not
measured or had a large fraction of missing values. These include measures of the economic
status of the mother and the household to which she belongs; background characteristics of the
father; and indicators describing the healthiness of the mother (such as her height and her own
birthweight). Although indicators of economic status and the mother’s healthiness can be
measured in principle, they are not collected on birth certificates. Information on fathers is
collected on birth certificates, but missing data was a major problem. There are, in addition,
unmeasurable child and mother factors—described in the conceptual framework—that we were
unable to control for because we did not have multiple observations for each child or for each
mother. Second, our models assume that the effects of all covariates on birthweight operate
exactly the same way for each race and ethnic group. There are, however, good reasons to
expect differences in covariate effects, at least for certain types of variables. For instance, there
were substantial differences in marriage patterns across race and ethnic groups, reflecting in part
the distinct types of marriage markets, competing prospects, and cultural constraints or
opportunities that each group faced. These differences may also mean that being married was
associated with different support arrangements across the groups, which in turn could translate

23
into marital status having varying effects on birthweight.14 This issue is important not only from
a modeling point of view, but also with regard to policy implications of the findings. In
particular, the pooled model implies that, from a policy perspective, efforts to reduce the
birthweight gap across race and ethnic groups should focus on improving the characteristics of
disadvantaged groups. However, allowing different covariate effects across the groups will tell
us the extent to which relationships may be different, which may suggest an alternative set of
interventions. We investigate this issue in more detail in the next subsection. In the remainder
of this subsection we describe the results for the other covariates in our models.
There were positive effects on birthweight of infant sex, mother’s education, and
mother’s marital status. Each year of education beyond eleventh grade was associated with a 20
gram increase in birthweight. Especially large effects were present for infant sex and mother’s
marital status. Females had birthweights 114 grams lower than males and children born to
married mothers have birthweights that were 121 grams higher, on average, than those born to
unmarried mothers. Mother’s nativity was not associated with birthweight and the effects of
mother’s age, although negative and significant in Model III, switched signs in Model IV.
The background variables included in the models presented in Table 3 represent a range
from purely biological (infant sex) to largely social (marital status). A comparison of the
estimated effects of these background variables between Models III and IV show that a
14 To make this illustration more concrete, consider that non-Hispanic blacks may have lower birthweights
than non-Hispanic whites not only because they have lower marriage rates (and knowing that, after controlling for
other factors, children born to married parents have higher birthweights), but also perhaps because the beneficial
effects of having a birth within a marriage are smaller for non-Hispanic blacks. This may occur, for example,
because lower marriage rates mean that marriage is a weaker institution and hence fewer resources, less care, and
limited information is provided to the mother by the husband.

24
substantial portion of the largely social variables is accounted for by the intermediate variables.
For instance, birthweights for married women were 121 grams higher than those for unmarried
women, when controlling for other background characteristics but no intermediate variables
(Model III). Adding the intermediate variables (in Model IV) lowered the beneficial effect of
being married by almost two-thirds. In contrast, there was no difference in the effect of infant
sex between Models III and IV, since this variable does not operate through a behavioral
pathway.
Among the intermediate variables, we find that first births have birthweights 100 grams
lower than births of higher parity. Birthweights increased with interpregnancy intervals, with the
effect especially strong for the first 11 months, then declining, and finally switching to a small
negative effect after 60 months. Not surprisingly, gestation length had an exceptionally large
effect. Our results indicate that one additional week of gestation was associated with a 150 gram
increase in birthweight; only when gestation length exceeds 42 weeks does a negative effect
appear. There were relatively small effects associated with the number of prenatal care visits
while the timing of initiation was not statistically significant. Nevertheless, there was a clear
positive association between a greater number of prenatal care visits and higher birthweight. The
presence of one or more medical risk factors during the pregnancy was associated with a modest
decline in birthweight. Finally, smoking and alcohol use during pregnancy were associated with
large deleterious effects on birthweight that are highly significant. Smoking during pregnancy
lowered birthweight by 163 grams while alcohol use was associated with a 94 gram drop.
Results from Models Stratified by Race and Ethnicity
Because there may be important differences in covariate effects across race and ethnic
groups, we stratified the sample and reestimated the final two models from Table 3 separately for

25
non-Hispanic whites, non-Hispanic blacks, and Mexican-origin Hispanics. The results for the
models including only background variables are presented in Table 4 while the results for the
models that add intermediate variables are presented in Table 5. We focus our discussion on
covariates whose effects differed substantially across race and ethnic groups. We do so because
the stratified models (or models that interact these covariates with the race and ethnicity
variables) provide unique substantive and policy insights only for these variables. Covariates
effects that differed substantially by race and ethnicity include mother’s age, education, and
nativity, medical risk factors, and alcohol use.
There were relatively small differences by race and ethnicity in covariate effects for the
remaining variables, including infant sex, mother’s marital status, first births, gestation length,
and cigarette smoking. Consequently, the simpler models presented in Table 3 that use data
pooled across all race and ethnic groups would be fine for these variables. This is true even
when there were dramatic differences in characteristics across race and ethnic groups. One
example of this concerns the effects of mother’s marital status. Results from the pooled model
(Model III, Table 3) show that children born to married women had birthweights 121 grams
higher than their non-married counterparts. When we estimated this relationship separately by
race and ethnicity, we found (from Table 4) that the marriage effect was 155 grams for non-
Hispanic whites, 132 grams for non-Hispanic blacks, and 76 grams for Mexican-origin
Hispanics. Especially noteworthy is the relative similarity in the effects for non-Hispanic whites
and blacks. This is remarkable because 80 percent of births to non-Hispanic whites occurred
within marriages, four times the percentage among non-Hispanic blacks.
The effects of mother’s age differed the most dramatically across race and ethnic groups.
In contrast, differences in mothers’ mean ages were much smaller, with non-Hispanics blacks

26
giving birth at the youngest ages (mean of 24 years), followed by Mexican-origin Hispanics at 26
years, and non-Hispanic whites at 28 years. However, the lower average ages translate into far
higher teenage pregnancy rates among non-Hispanic blacks, which at 28 percent were roughly
twice as high compared to Mexican-origin Hispanics (15 percent) and almost four times higher
than non-Hispanic whites (7 percent). Mother’s age was unrelated to birthweight for non-
Hispanic whites. For non-Hispanic blacks, the age effect was negative and statistically
significant: a one-year increase in age was associated with a 7-gram decrease in birthweight.
Finally, for Mexican-origin Hispanics, age was positive and significant, with a one-year
increment in age associated with a 10-gram increase in birthweight. Although these differences
were not enough to account for much of the total birthweight disparity between non-Hispanic
blacks and the other two groups, they certainly contributed towards it. The deleterious effects of
age on maternal and child health for African Americans has been characterized as a form of rapid
“weathering” that arises from their more difficult life circumstances (Geronimus, 1992).
Differences in the effects of mother’s education were large across race and ethnic groups.
Education had a statistically significant relationship with birthweight only for non-Hispanic
whites and non-Hispanic blacks; for Mexican-origin Hispanics, education for women had
extremely small (and insignificant) effects on birthweight. One additional year of education
(beyond the eleventh grade) was associated with a 34 gram increase in birthweight for non-
Hispanic blacks, an effect twice as high as that for non-Hispanic whites of 16 grams. However,
the difference in mean years of education between non-Hispanic whites and non-Hispanic blacks
was just over one year, substantially smaller than the difference in years of education between
Mexican-origin Hispanics and non-Hispanic whites of 3.4 years. A possible reason for the
substantially larger effect of education for non-Hispanic blacks is that they face a more
27
challenging environment to navigate in order to achieve a healthy pregnancy and birth, due to
disadvantage and discrimination, and education provides women with the knowledge and ability
to navigate these environments more successfully.
There was no difference in birthweight between native born and foreign-born Mexican-
origin Hispanics after adjusting for background characteristics, in contrast to previous studies
that were unable to account entirely for higher birthweights among foreign-born Mexican-origin
Hispanics (e.g., Landale, Oropesa, and Gorman, 1999). However, non-Hispanic black
immigrants had substantially higher birthweights than non-immigrants. This is likely to be
related to the selectivity of these two groups, compared to their native-born co-ethnics. Under 2
percent of non-Hispanic blacks were foreign born, in contrast to 81 percent of Mexican-origin
Hispanics. The small immigrant stream of non-Hispanic blacks was likely to have been more
select, in terms of both observed and unobserved characteristics, than the huge stream of
Mexican-origin Hispanics. For non-Hispanic whites, foreign-born mothers had slightly lower
birthweights.
We turn next to Table 5, which presents results for models that include intermediate
factors. We focus on two sets of findings. First, we discuss changes in the effects of the
background variables (comparing these results to those in Table 4). Second, we discuss the
effects of the intermediate factors, highlighting again similarities and differences across the three
ethnic groups.
As expected, the effects of the background variables were again attenuated in almost
every instance once we incorporated intermediate factors into the models. There were, however,
essentially no statistically significant effects rendered insignificant, although some of the effects
changed substantially. In particular, by including the intermediate factors, we accounted for a

28
large portion of the effect of education (for non-Hispanic whites and blacks), of mother’s nativity
(for non-Hispanic blacks), marital status (for all three groups), and mother’s age (especially for
non-Hispanic blacks). The largest and most consistent changes occurred for marital status. The
intermediate factors in our models accounted for roughly two-thirds of the birthweight advantage
experienced by children of married mothers. This suggests that married women generally
practiced health-related behaviors during their pregnancy that were beneficial for their babies,
such as not smoking nor consuming alcohol. The other notable change is that the effect of
mother’s age for non-Hispanic blacks was attenuated substantially and is only significant at the
.10 level after controlling for the intermediate factors. This suggests that older non-Hispanic
black mothers had less favorable pregnancy-related behaviors than younger mothers; once these
behaviors were taken into account, mother’s age had a minor effect on birthweight (as was the
case for non-Hispanic whites).
Intermediate variable effects that were similar across the three race and ethnic groups
included first birth, interpregnancy interval, gestation length, and smoking. Substantial
differences were observed for medical risk factors, alcohol use, and place of delivery. A number
of the intermediate variables did not have significant effects. For example, few of the indicators
regarding prenatal care were statistically significant.
For the three intermediate variables for which there were substantial differences in effects
across the groups, the only statistically significant effects were for non-Hispanic blacks. For this
group, the deleterious effects of having a medical risk factor, using alcohol during pregnancy, or
having a non-hospital delivery were large, even though in all three cases there were minor
differences in levels compared to non-Hispanic whites. This suggests a source of disadvantage
for non-Hispanic blacks that may reflect either more serious medical risk factors, more damaging

29
patterns of alcohol use, poorer delivery assistance, or worse treatment for medical risk factors.
The absence of clear effects for prenatal care may have been caused by adverse selection (i.e.,
women who anticipated problems with a pregnancy may have initiated earlier prenatal care) or
other factors. However, there is some evidence that adequacy of prenatal care visits was
associated with higher birthweight.
Decomposing Race/Ethnic Differentials in Birthweight
The final task is to summarize the differences in birthweight across the three race and
ethnic groups and, in particular, to identify the extent to which the measured background and
intermediate covariates accounted for observed differences. In Table 6 we present a
decomposition of birthweight differences among the three groups. The entries along the
diagonal show observed values. The off-diagonal elements describe the counterfactual
associated with a model (identified by the column) and a set of characteristics (identified by the
row). For example, the top right entry in the table shows the predicted mean birthweight for
non-Hispanic whites if the effects of their (background and intermediate) characteristics on
birthweight were the same as for Mexican-origin Hispanics. The difference between this value
(3,417.4) and the actual value for non-Hispanic whites (3,418.5) reflects overall differences in
relationships—which are minor. The difference compared to the actual value for Mexican-origin
Hispanics (3,383.8) reflects differences in characteristics—which in this case accounts for
essentially the entire differential in birthweight between these two groups. Thus, the results
indicate that the background and intermediate factors in the models account for all the
birthweight difference between non-Hispanic whites and Mexican-origin Hispanics. The result
is symmetric, in that we reach the same conclusion when examining predicted mean birthweight
for Mexican-origin Hispanics using estimated relationships for non-Hispanic whites.

30
Measured characteristics account for just over half of the birthweight gap between non-
Hispanic blacks and whites. Of the 331.7 gram difference in birthweight between non-Hispanic
blacks and whites, 51 percent is accounted for by measured characteristics based on the model
for non-Hispanic whites and 55 percent based on the model for non-Hispanic blacks. That leaves
44-49 percent that is accounted for by differences in the ways that the measured characteristics
affect birthweight, as well as omitted variables.
Comparing non-Hispanic blacks and Mexican-origin Hispanics, we find that the results
differ based on which model is selected as the standard (note, however, that the standard errors
of the counterfactual estimates are large). Of the 297.0 gram difference in birthweight between
these two groups, 66 percent is accounted for by differences in characteristics when using the
non-Hispanic black model while 44 percent is accounted for when the Mexican-origin Hispanic
model is used. The higher percentage explained by the non-Hispanic black model is due to this
model’s substantially better fit. In particular, the non-Hispanic black model has an adjusted R2
of .48—indicating that this model explained roughly half the variation in birthweight for non-
Hispanic blacks. In contrast, the model for Mexican-origin Hispanics has an adjusted R2 of .30.
The implication, however, is that there is a fairly large confidence interval in attributing this
race/ethnic gap in birthweight between characteristics and relationships. Nevertheless, it is clear
that differences in characteristics do not explain the entire differential between non-Hispanic
blacks and Mexican-origin Hispanics.
Overall these results suggest that the disadvantage in birthweights for infants born to non-
Hispanic black mothers—compared to non-Hispanic white and Mexican-origin Hispanic
mothers—was not simply the result of non-Hispanic blacks being more disadvantaged according
to their (measured) social characteristics and reproductive behaviors. Rather, there were

31
significant differences in birth outcomes between non-Hispanic blacks and the other two groups
when the characteristics of the mother and the pregnancy were set at exactly the same values,
with non-Hispanic blacks faring substantially worse. This may be the result of the omission of
important covariates—such as household income or measures of maternal stress or health status.
However, it also suggests that, for non-Hispanic blacks, not only were the effects of
demographic, social, and reproductive factors overall less beneficial for the positive factors and
more deleterious for the negative factors (as we showed above), but that the consequences for
birthweight of these differences were large.
6. Conclusions
The goal of this study was to examine differences in birthweight across race and ethnic
groups in Chicago, Illinois in 1990. Specifically, our analyses addressed three questions. First,
what proportion of racial and ethnic birthweight disparities is explained by differences in
maternal characteristics and health and reproductive behaviors? Second, what proportion of
these disparities is explained by differences in the effects of these characteristics or behaviors on
birthweight? Third, what proportion of racial and ethnic birthweight disparities are accounted by
neighborhood factors?
We found that measured characteristics accounted for about half of the birthweight gap
between non-Hispanic whites and blacks (of 332 grams) and between non-Hispanic blacks and
Mexican-origin Hispanics (of 297 grams). In both cases, the remainder was accounted for by
differences in variable effects or unmeasured variables. This result has important implications
for policies and programs to improve birthweight and to eliminate race and ethnic disparities in
infant health. In particular, it suggests that it is not enough simply to provide non-Hispanic black
women with more advantageous characteristics, such as better education and access to medical
32
care. Although this might eliminate roughly half of the current disparity in birthweight, it would
not, however, be sufficient to erase it entirely. Rather, more significant structural changes are
required—changes that would alter the way in which mothers’ characteristics and behaviors
affect birth outcomes.
The principal differences in characteristics that led to low birthweight among non-
Hispanic black mothers were their lower levels of education, higher rates of non-marital births,
less adequate prenatal care, higher rates of smoking and, especially, shorter gestation lengths. A
number of factors had distinct effects for non-Hispanic blacks compared to the other two groups,
including mother’s age, mother’s education, medical risk factors, and alcohol use. Policy
interventions to improve birthweight among non-Hispanic blacks need to focus on both sets of
factors in order to eliminate race and ethnic disparities. Policies designed to alter mothers’
characteristics are fairly easy to design and implement, but ones aimed at changing relationships
are more difficult to conceptualize, let alone implement.
One reason that relationships may differ—for example, that the effects of medical risk
factors have a strong negative effect on birthweight only for non-Hispanic blacks—is that the
underlying factor is actually different across the race/ethnic groups. For example, given the
same risk factor, non-Hispanic blacks may suffer from worse forms of the disease or condition.
Better measurement of these factors may be the solution to this problem. However, another
reason that relationships may vary is that processes may differ fundamentally across the
race/ethnic groups. For instance, non-Hispanic blacks may, due to a variety of reasons, may
receive poorer health care for their risk factors, although the actual type and severity of the
disease or condition is no different than that for either of the other two groups. Both of these
issues should be investigated in order to develop a better understanding of race and ethnic

33
differences in birthweight and to design policies to eliminate them.
Mexican-origin Hispanics in Chicago had remarkably good birth outcomes, despite their
apparent socioeconomic disadvantage. Among the specific factors that contributed to Mexican-
origin Hispanics having such favorable birth outcomes were their lower levels of smoking and
alcohol use and their lack of medical risk factors. In addition, they had very similar gestation
lengths to non-Hispanic whites. Our results suggest that although their mean birthweight was
slightly lower than that for non-Hispanic whites, differences in the levels of measured covariates
accounted for all of this difference. There are a number of clear changes that might be pursued
from a policy perspective to improve birthweight among Mexican-origin Hispanics. These
include increasing mothers’ ages at birth and reducing non-marital births.
Our results suggest that neighborhood factors are important in explaining differences in
birthweight, accounting for 14 percent of the raw differential between non-Hispanic blacks and
Mexican-origin Hispanics and as much as 30 percent of the raw differential between non-
Hispanic blacks and whites. This is a particularly noteworthy result given the persistent and
striking spatial variation in the social, economic, and health characteristics of urban populations.
In on-going research we are investigating the specific neighborhood factors that account for this
finding.

34
References Adams, Melissa. 2001. “Validity of birth certificate data for the outcome of the previous
pregnancy, Georgia, 1980-1995,” American Journal of Epidemiology 154: 883-888. Alexander, G.R., and C.C. Korenbrot. 1995. “The role of prenatal care in preventing low birth
weight,” The Future Child 4: 103-120. Avchen, Rachel Nonkin, Keith G. Scott, and Craig A. Mason. 2001. “Birth weight and school-
age disabilities: A population-based study,” American Journal of Epidemiology 154: 895-901.
Barker, D.J.P. 1998. Mothers, babies, and disease in later life. Second edition. London: BMJ
Publishing Group. Barker, D.J.P. 1995. “Fetal origins of coronary heart disease,” British Medical Journal 311:171-
174. Barker, D.J.P., C.N. Hales, C.H.D. Fall, C. Osmond, K. Phipps, and P.M.S. Clark. 1993. “Type 2
(non-insulin-dependent) diabetes mellitus, hypertension and hyperlipidaemia (Syndrome X): Relation to reduced fetal growth,” Diabetologia 36: 62-67.
Berg, Cynthia J., Lynne S. Wilcox, and Philip J. d’Almada. 2001. “The prevalence of
socioeconomic and behavioral characteristics and their impact on very low birth weight in black and white infants in Georgia,” Maternal and Child Health Journal 5: 75-84.
Boardman, Jason D., Powers, Daniel A., Padilla, Yolanda C, and Hummer, Robert A. 2002.
“Low birth weight, social factors, and developmental outcomes among children in the United States,” Demography 39: 353-368.
Buekens, Pierre, Francis Notzon, Milton Kotelchuck, and Allen Wilcox. 2000. “Why do
Mexican Americans give birth to few low-birth-weight infants?” American Journal of Epidemiology 152: 347-351.
Chicago Department of Planning and Development. 2001. Chicago Fact Book: Geography.
(http://www.cityofchicago.org/PlanAndDevelop/ChgoFacts/Geo.html). Collins, J.W., and R.J. David. 1997. “Urban violence and African-American pregnancy outcome:
An ecological study,” Ethnicity and Disease 7: 184-190. Collins, James W., Nancy Fisher Schulte, and Aimee Drolet. 1998. “Differential effect of
ecologic risk factors on the low birthweight components of African-American, Mexican-American, and non-Latino white infants in Chicago,” Journal of the National Medical Association 90: 223-229.
Conley, Dalton, and Neil G. Bennett. 2000. “Is biology destiny? Birth weight and life chances,”

35
American Sociological Review 65: 458-467. Cramer, James C. 1987. “Social Factors and Infant Mortality: Identifying High-Risk Groups and
Proximate Causes,” Demography 24: 299-322. Fiscella, K. 1995. “Does prenatal care improve birth outcomes? A critical review,” Obstetrics
and Gynecology 85: 236-244. Frick, K.D., and P.M. Lantz. 1996. “Selection bias in prenatal care utilization: Linking economic
and health services research,” Medical Care Research Review 53: 371-396. Fuentes-Afflick, E., and P. Lurie. 1997. “Low birth weight and Latino ethnicity: Examining the
epidemiologic paradox,” Archives of Pediatric and Adolescent Medicine 141: 665-74. Geronimus, A.T. 1992. “The weathering hypothesis and the health of African American women
and infants: Evidence and speculations,” Ethnicity and Disease 2: 207-221. Goldstein, H. 1995. Multilevel statistical models. London: Edward Arnold. Gorman, Bridget K. 1999. “Racial and ethnic variation in low birthweight in the United States:
Individual and contextual determinants,” Health and Place 5: 195-207. Hausman, J. 1978. “Specification tests in econometrics,” Econometrica 47: 153-162. Hessol, N.A., and E. Fuentes-Afflick. 2000. “The perinatal advantage of Mexican-origin Latina
women,” Annals of Epidemiology 10: 516-523. Hoyert, Donna L., Elizabeth Arias, Betty L. Smith, Sherry L. Murphy, and Kenneth D.
Kochanek. 2001. Deaths: Final data for 1999. National Vital Statistics Reports, Vol. 49, No. 8. Hyattsville, MD: National Center for Health Statistics.
Huntington, J., and F.A. Connell. 1994. “For every dollar spent: The cost savings argument for
prenatal care,” New England Journal of Medicine 331: 1303-07. Illinois Department of Public Health. 2002. “Health Service Area 06, City of Chicago, selected
vital statistics among residents.” (www.idph.state.il.us/vital/pdf/1998.pdf). Innes, Kim E., Tim E. Byers, Julie A. Marshall, Anna Barón, Miriam Orleans, and Richard F.
Hamman. 2002. “Association of a woman’s own birth weight with subsequent risk for gestational diabetes,” Journal of the American Medical Association 287: 2534-2541.
Institute of Medicine. 1985. Preventing low birth weight. Washington, D.C.: National Academy
Press. Jefferis, Barbara J. M. H., Chris Power, and Clyde Hertzman. 2002. “Birth weight, childhood
socioeconomic environment, and cognitive development in the 1958 British birth cohort

36
study,” British Medical Journal 325:1-6. Jones, C.W. 2001. “Gestational diabetes and its impact on the neonate,” Neonatal Network 20:
17-23. Kotelchuck, M. 1994a. “The Adequacy of Prenatal Care Utilization Index: Its US distribution
and association with low birthweight,” American Journal of Public Health 84: 1486-1489. Kotelchuck, M. 1994b. “An evaluation of the Kessner Adequacy of Prenatal Care Index and a
proposed Adequacy of Prenatal Care Utilization Index,” American Journal of Public Health 84: 1414-1420.
Landale, Nancy S., R.S. Oropesa, and Bridget K. Gorman. 1999. “Immigration and infant health:
Birth outcomes of immigrant and native-born women,” in Donald J. Hernandez (ed.) Children of Immigrants: Health, Adjustment, and Public Assistance. Washington, DC: National Academy Press, pp. 244-285.
Law, C.M., M. de Swiet, C. Osmond, et al. 1993. “Initiation of hypertension in utero and its
amplification throughout life,” British Medical Journal 306: 24-27. Lundsberg, Lisbet S., Michael B. Bracken, and Audrey F. Saftlas. 1997. “Low-to-moderate
gestational alcohol use and intrauterine growth retardation, low birthweight, and preterm delivery,” Annals of Epidemiology 7:498-508.
Martin, Joyce A., Brady E. Hamilton, Stephanie J. Ventura, Fay Menacker, and Melissa M. Park.
2002. Births: Final Data for 2000. National Vital Statistics Reports, Vol. 50, No. 5. Hyattsville, MD: National Center for Health Statistics.
Martin, Joyce A., Marian F. MacDorman, and T. J Mathews. 1997. “Triplet births: Trends and
outcomes, 1971-94,” Vital and Health Statistics, Ser. 21, No. 55. Hyattsville, MD: National Center for Health Statistics.
Mathews, T. J., Marian F. MacDorman, and Fay Menacker. 2002. “Infant mortality statistics
from the 1999 period linked birth/infant death data set,” National Vital Statistics Reports, Vol. 50, No. 4. Hyattsville, MD: National Center for Health Statistics.
National Center for Health Statistics. 1999. Vital Statistics of the United States: Natality, 1997.
Hyattsville, MD: National Center for Health Statistics. O’Campo, P., X. Xue, M.C. Wang, and M. Caughy. 1997. “Neighborhood risk factors for low
birthweight in Baltimore: A multilevel analysis,” American Journal of Public Health 87: 1113-1118.
Pearl, Michell, Paula Braveman, and Barbara Abrams. 2001. “The relationship of neighborhood
socioeconomic characteristics to birthweight among 5 ethnic groups in California,” American Journal of Public Health 91: 1808-1814.

37
Penrod, John R., and Paula M. Lantz. 2000. “Measurement error in prenatal care utilization:
Evidence of attenuation bias in the estimation of impact on birthweight,” Maternal and Child Health Journal 4:39-52.
Porter, T.F., A.M. Fraser, C.Y. Hunter, R.H. Ward, and M.W. Varner. 1997. “The risk of preterm
birth across generations,” Obstetrics and Gynecology 90: 63-67. Preston, Samuel H., and Michael R. Haines. 1991. Fatal years: Child mortality in late
nineteenth-century America. Princeton, NJ: Princeton University Press. Preston, Samuel H., and Paul Taubman. 1994. “Socioeconomic differences in adult mortality and
health status,” in Linda G. Martin and Samuel H. Preston (eds.), Demography of Aging. Washington, DC: National Academy Press, pp. 279-318.
Rauh, Virginia A., Howard F. Andrews, and Robin S. Garfinkel. 2001. “The contribution of
maternal age to racial disparities in birthweight: A multilevel perspective,” American Journal of Public Health 91: 1815-1824.
Rawlings, James S., Virginia B. Rawlings, and John A. Read. 1995. “Prevalence of low birth
weight and preterm delivery in relation to the interval between pregnancies among white and black women,” New England Journal of Medicine 332: 69-74.
Richards, Marcus, Rebecca Hardy, Diana Kuh, and Michael E. J. Wadsworth. 2001. “Birth
weight and cognitive function in the British 1946 birth cohort: Longitudinal population based study,” British Medical Journal 322: 199-203.
Rich-Edwards, J.W., M.J. Stampfer, J.E. Manson, et al. 1997. “Birth weight and the risk of
cardiovascular disease in a cohort of women followed up since 1976,” British Medical Journal 315: 396-400.
Roberts, E.M. 1997. “Neighborhood social environments and the distribution of low birthweight
in Chicago,” American Journal of Public Health 87: 597-603. Sanderson, M., I. Emanuel, and V.L. Holt. 1995. “The intergenerational relationship between
mother’s birthweight, infant birthweight, and infant mortality in black and white mothers,” Paediatric Perinat Epidemiol. 9: 391-405.
Shiono, P.H., V.A. Rauh, M. Park, S.A. Lederman, and D. Zuskar. 1997. “Ethnic differences in
birthweight: The role of lifestyle and other factors,” American Journal of Public Health 87: 787-793.
Singh, G.K., and S.M. Yu. 1996. “Adverse pregnancy outcomes: Differences between US and
foreign-born women in major US racial and ethnic groups,” American Journal of Public Health 86: 837-843.

38
Sommerfelt, K., B. Ellertsen, and T. Markestad. 1993. “Personality and behavior in eight-year-old, non-handicapped children with birthweight under 1500 g,” Acta Paediatrica 82: 723-728.
Sorensen, Henrik Toft, Svend Sabroe, Jorn Olsen, Kenneth J. Rothman, Matthew W. Gillman,
and Peer Fischer. 1997. “Birth weight and cognitive function in young adult life: Historical cohort study,” British Medical Journal 315: 401-403.
Spellacy, W.N., S. Miller, A. Winegar, and P.Q. Peterson. 1985. “Macrosomia: Maternal
characteristics and infant complications,” Obstetrics and Gynecology 66: 158-161. Sprauve, Margaret E., Michael K. Lindsay, Carolyn D. Drews-Botsch, and William Graves.
1999. “Racial patterns in the effects of tobacco use on fetal growth,” American Journal of Obstetrics and Gynecology 181: S22-S27.
U.S. Census Bureau. 2001a. “Ranking tables for incorporated places of 100,000 or more: 1990
and 2000.” (http://www.census.gov/population/www/cen2000/phc-t5.html). Downloaded 4/26/02.
U.S. Census Bureau. 2001b. The Black Population: 2000. Census 2000 Briefs. U.S. Census Bureau. 2001c. The Hispanic Population: 2000. Census 2000 Briefs. U.S. Census Bureau. 2001d. “Profile of selected social characteristics: 2000.”
(http://factfinder.census.gov/home/en/c2ss.html). Downloaded 4/22/02. U.S. Census Bureau. 2001e. “Profile of Selected Economic Characteristics: 2000.”
(http://factfinder.census.gov/home/en/c2ss.html). Downloaded 4/22/02. Ventura, Stephanie J., Joyce A. Martin, Sally C. Curtin, Fay Menacker, and Brady E. Hamilton.
2001. Births: Final data for 1999. National vital statistics reports, Vol. 49, No. 1. Hyattsville, MD: National Center for Health Statistics.
Wang, X., B. Zucherman, G.A. Coffman, and M.J. Corwin. 1995. “Familial aggregation of low
birth weight among whites and blacks in the United States,” New England Journal of Medicine 333: 1744-1749.
Wilcox, Allen J. 2001. “On the importance—and the unimportance—of birthweight,”
International Journal of Epidemiology 30: 1233-1241. Zhu, Bao-Ping, Robert T. Rolfs, Barry E. Nangle, and John M. Horan. 1999. “Effect of the
interval between pregnancies on perinatal outcomes,” New England Journal of Medicine 340: 589-594.

39
Table 1. Summary birthweight statistics by race/ethnicity for Chicago, 1990
Race
Non-Hispanic
Whites Non-Hispanic
Blacks Mexican-origin
Hispanics Total Birthweight (grams) Mean 3,418.5 3,086.8 3,383.7 3,235.7 Standard deviation 568.7 628.9 546.4 617.7 Low birthweight (< 2,500 g) 4.8% 13.4% 4.4% 9.1% Very low birthweight (< 1,500 g) 0.9% 2.7% 0.8% 1.7% Number of observations 12,918 26,005 10,181 49,104 Source: Authors’ calculations from Chicago birth certificate data.
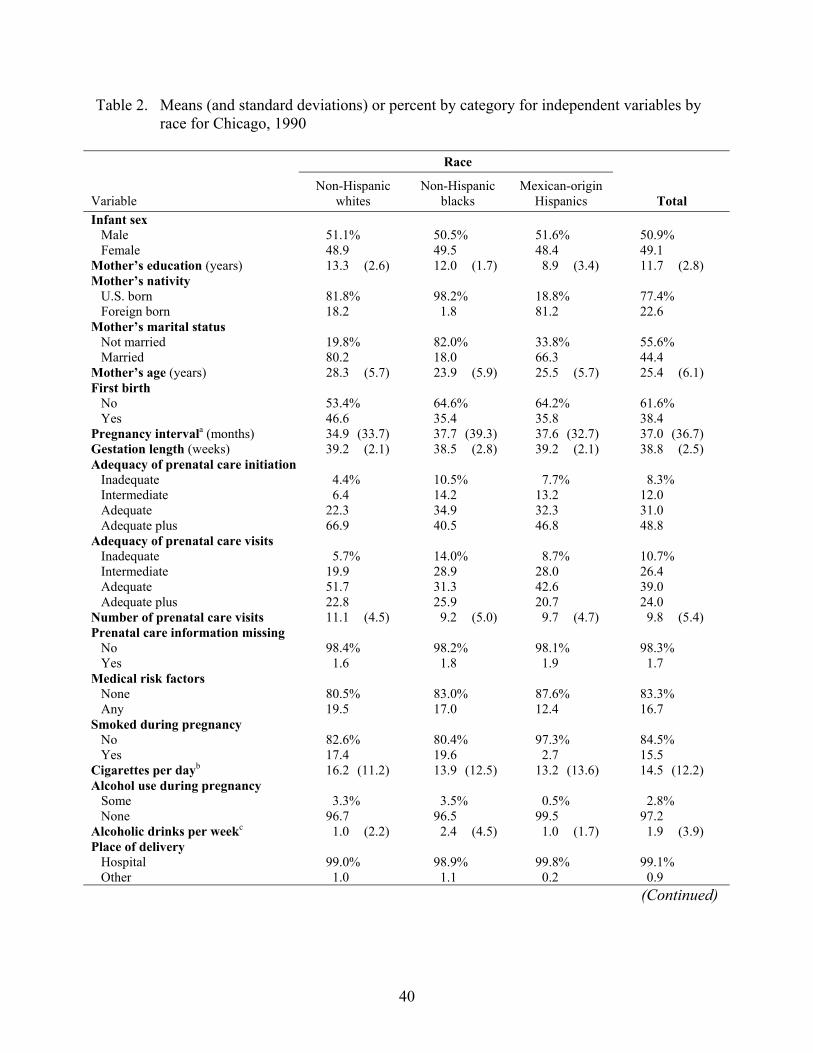
40
Table 2. Means (and standard deviations) or percent by category for independent variables by race for Chicago, 1990
Race
Variable
Non-Hispanic whites
Non-Hispanic blacks
Mexican-origin Hispanics
Total
Infant sex Male Female
51.1% 48.9
50.5% 49.5
51.6% 48.4
50.9% 49.1
Mother’s education (years) 13.3 (2.6) 12.0 (1.7) 8.9 (3.4) 11.7 (2.8) Mother’s nativity U.S. born Foreign born
81.8% 18.2
98.2% 1.8
18.8% 81.2
77.4% 22.6
Mother’s marital status Not married Married
19.8% 80.2
82.0% 18.0
33.8% 66.3
55.6% 44.4
Mother’s age (years) 28.3 (5.7) 23.9 (5.9) 25.5 (5.7) 25.4 (6.1) First birth No Yes
53.4% 46.6
64.6% 35.4
64.2% 35.8
61.6% 38.4
Pregnancy intervala (months) 34.9 (33.7) 37.7 (39.3) 37.6 (32.7) 37.0 (36.7) Gestation length (weeks) 39.2 (2.1) 38.5 (2.8) 39.2 (2.1) 38.8 (2.5) Adequacy of prenatal care initiation Inadequate 4.4% 10.5% 7.7% 8.3% Intermediate 6.4 14.2 13.2 12.0 Adequate 22.3 34.9 32.3 31.0 Adequate plus 66.9 40.5 46.8 48.8 Adequacy of prenatal care visits Inadequate 5.7% 14.0% 8.7% 10.7% Intermediate 19.9 28.9 28.0 26.4 Adequate 51.7 31.3 42.6 39.0 Adequate plus 22.8 25.9 20.7 24.0 Number of prenatal care visits 11.1 (4.5) 9.2 (5.0) 9.7 (4.7) 9.8 (5.4) Prenatal care information missing No Yes
98.4% 1.6
98.2% 1.8
98.1% 1.9
98.3% 1.7
Medical risk factors None Any
80.5% 19.5
83.0% 17.0
87.6% 12.4
83.3% 16.7
Smoked during pregnancy No Yes
82.6% 17.4
80.4% 19.6
97.3% 2.7
84.5% 15.5
Cigarettes per dayb 16.2 (11.2) 13.9 (12.5) 13.2 (13.6) 14.5 (12.2) Alcohol use during pregnancy Some None
3.3% 96.7
3.5% 96.5
0.5% 99.5
2.8% 97.2
Alcoholic drinks per weekc 1.0 (2.2) 2.4 (4.5) 1.0 (1.7) 1.9 (3.9) Place of delivery Hospital Other
99.0% 1.0
98.9% 1.1
99.8% 0.2
99.1% 0.9
(Continued)

41
Table 2. Continued
Race
Variable Non-Hispanic
whites Non-Hispanic
blacks Mexican-origin
Hispanics
Total Birth attendant
Medical person 94.2% 92.6% 91.7% 92.8% Midwife 2.8 1.3 2.3 1.9 Other 3.1 6.1 6.0 5.3
Number of observations 12,918 26,005 10,181 49,104 Source: Authors’ calculations using 1990 Chicago vital statistics data. Notes: a. Among women with a prior live birth.
b. Cigarettes per day among women who smoked during pregnancy. c. Alcoholic drinks per week among women who used alcohol during pregnancy.
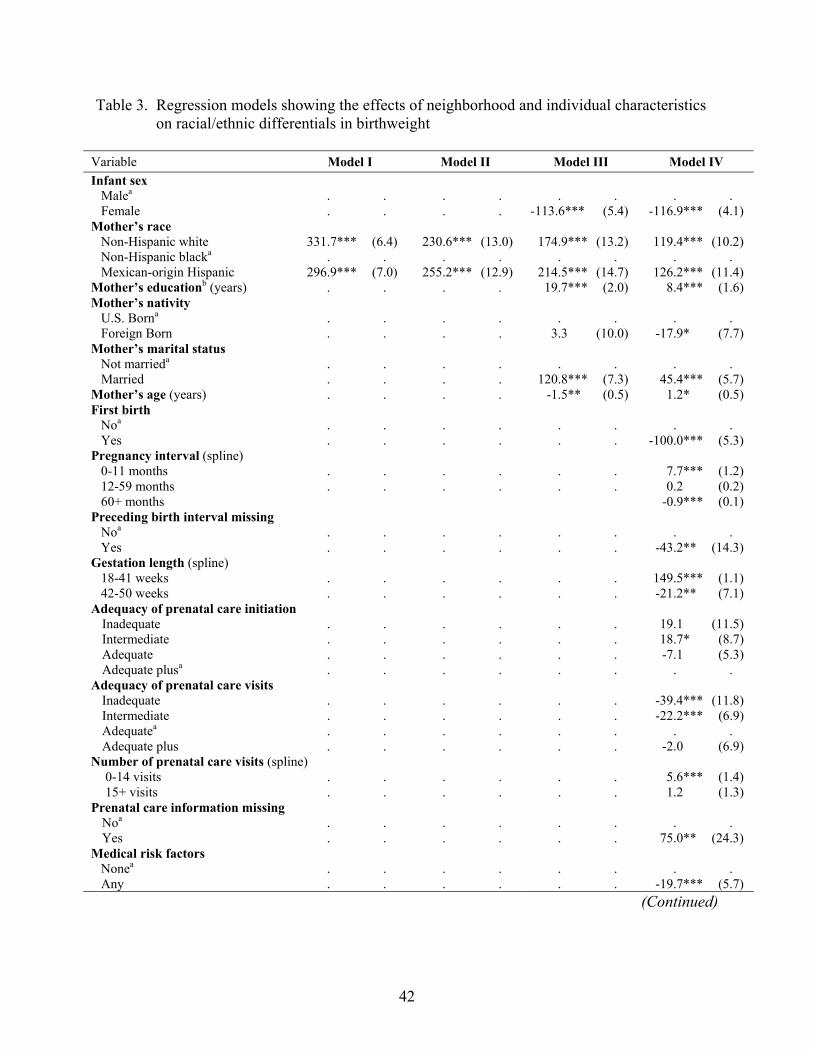
42
Table 3. Regression models showing the effects of neighborhood and individual characteristics on racial/ethnic differentials in birthweight
Variable Model I Model II Model III Model IV Infant sex Malea
Female
. . . .
. . . .
. . -113.6*** (5.4)
. . -116.9*** (4.1)
Mother’s race Non-Hispanic white Non-Hispanic blacka Mexican-origin Hispanic
331.7*** (6.4) . . 296.9*** (7.0)
230.6*** (13.0) . . 255.2*** (12.9)
174.9*** (13.2) . . 214.5*** (14.7)
119.4*** (10.2) . . 126.2*** (11.4)
Mother’s educationb (years) . . . . 19.7*** (2.0) 8.4*** (1.6) Mother’s nativity U.S. Borna
Foreign Born
. . . .
. . . .
. . 3.3 (10.0)
. . -17.9* (7.7)
Mother’s marital status Not marrieda
Married
. . . .
. . . .
. . 120.8*** (7.3)
. . 45.4*** (5.7)
Mother’s age (years) . . . . -1.5** (0.5) 1.2* (0.5) First birth Noa
Yes
. . . .
. . . .
. . . .
. . -100.0*** (5.3)
Pregnancy interval (spline) 0-11 months 12-59 months 60+ months
. . . .
. . . .
. . . .
7.7*** (1.2) 0.2 (0.2) -0.9*** (0.1)
Preceding birth interval missing Noa
Yes
. . . .
. . . .
. . . .
. . -43.2** (14.3)
Gestation length (spline) 18-41 weeks 42-50 weeks
. . . .
. . . .
. . . .
149.5*** (1.1) -21.2** (7.1)
Adequacy of prenatal care initiation Inadequate . . . . . . 19.1 (11.5) Intermediate . . . . . . 18.7* (8.7) Adequate . . . . . . -7.1 (5.3) Adequate plusa . . . . . . . .
Adequacy of prenatal care visits Inadequate . . . . . . -39.4*** (11.8) Intermediate . . . . . . -22.2*** (6.9) Adequatea . . . . . . . . Adequate plus . . . . . . -2.0 (6.9)
Number of prenatal care visits (spline) 0-14 visits . . . . . . 5.6*** (1.4) 15+ visits . . . . . . 1.2 (1.3)
Prenatal care information missing Noa
Yes
. . . .
. . . .
. . . .
. . 75.0** (24.3)
Medical risk factors Nonea Any
. . . .
. . . .
. . . .
. . -19.7*** (5.7)
(Continued)

43
Table 3. Continued
Variable Model I Model II Model III Model IV Smoked during pregnancy Noa
Yes
. . . .
. . . .
. . . .
. . -162.5*** (9.1)
Cigarettes per dayc . . . . . . -0.7 (0.4) Alcohol use during pregnancy Somea
None
. . . .
. . . .
. . . .
. . -94.1*** (22.4)
Alcoholic drinks per weekd . . . . . . 2.7 (3.6) Place of delivery Hospitala Other
. . . .
. . . .
. . . .
. . -60.5** (22.5)
Birth attendant Medical persona . . . . . . . . Midwife . . . . . . 37.2* (15.3) Other . . . . . . -14.0 (9.4) Constant 3,086.8*** (3.7) 3,122.1*** (6.2) 3,119.1*** (7.4) 3,530.7*** (36.3) Model F-test (df) 1,727.3*** (2) 2,14.9*** (2) 1,94.6*** (7) 1,077.2*** (33) Tract fixed effect No Yes Yes Yes Adjusted R-squared 0.07 0.06 0.09 0.46 Number of observations 49,104 49,104 49,104 49,104 *p<.05; **p<.01; ***p<.001; standard errors in parentheses. Source: Authors’ calculations using 1990 Chicago vital statistics data. Notes: a. Reference category.
b. Years of schooling beyond the 11th grade. c. Cigarettes per day among women who smoked during pregnancy. d. Alcoholic drinks per week among women who used alcohol during pregnancy.

44
Table 4. Fixed effects regression of birthweight on exogenous characteristics by race/ethnicity
Race Variable
Non-Hispanic whites
Non-Hispanic blacks
Mexican-origin Hispanics
Infant sex Malea
Female
. . -119.3*** (10.0)
. . -114.9*** (7.8)
. . -102.8*** (10.9)
Mother’s education (years) 15.6*** (3.0) 33.7*** (3.3) -1.3 (5.2) Mother’s nativity U.S. borna
Foreign born
. . -35.6* (14.0)
. . 89.6** (31.4)
. . -5.8 (15.4)
Mother’s marital status Not marrieda
Married
. . 155.0*** (14.9)
. . 131.5*** (11.4)
. . 76.3*** (12.2)
Mother’s age (years) -0.8 (1.0) -6.6*** (0.8) 9.5*** (1.0) Constant 3,322.2*** (13.9) 3,070.0*** (7.1) 3,383.4*** (15.9) Model F-test (df) 66.2*** (5) 106.9*** (5) 50.6*** (5) Tract fixed effect Yes Yes Yes Adjusted R-squared 0.03 0.02 0.02 Number of observations 12,918 26,005 10,181 *p<.05; **p<.01; ***p<.001; standard errors in parentheses. Source: Authors’ calculations using 1990 Chicago vital statistics data. Note: a. Reference category.
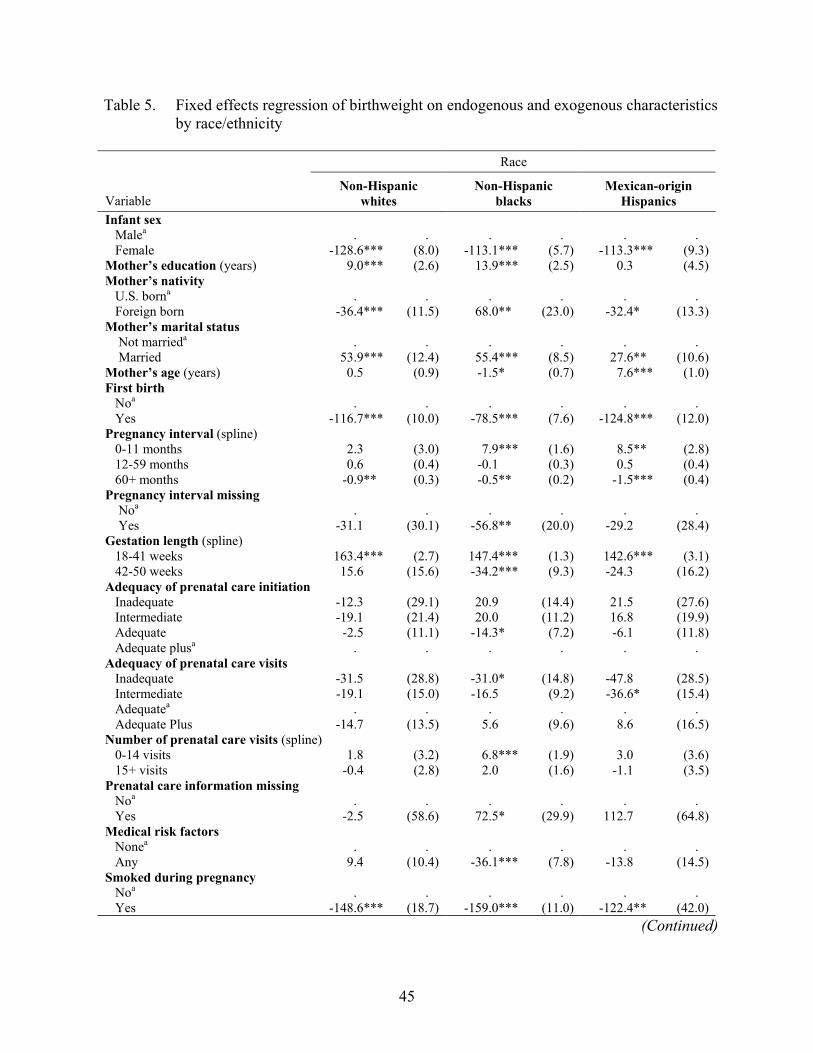
45
Table 5. Fixed effects regression of birthweight on endogenous and exogenous characteristics by race/ethnicity
Race
Variable
Non-Hispanic whites
Non-Hispanic blacks
Mexican-origin Hispanics
Infant sex Malea Female
. . -128.6*** (8.0)
. . -113.1*** (5.7)
. . -113.3*** (9.3)
Mother’s education (years) 9.0*** (2.6) 13.9*** (2.5) 0.3 (4.5) Mother’s nativity U.S. borna Foreign born
. . -36.4*** (11.5)
. . 68.0** (23.0)
. . -32.4* (13.3)
Mother’s marital status Not marrieda Married
. . 53.9*** (12.4)
. . 55.4*** (8.5)
. . 27.6** (10.6)
Mother’s age (years) 0.5 (0.9) -1.5* (0.7) 7.6*** (1.0) First birth Noa Yes
. . -116.7*** (10.0)
. . -78.5*** (7.6)
. . -124.8*** (12.0)
Pregnancy interval (spline) 0-11 months 2.3 (3.0) 7.9*** (1.6) 8.5** (2.8) 12-59 months 0.6 (0.4) -0.1 (0.3) 0.5 (0.4) 60+ months -0.9** (0.3) -0.5** (0.2) -1.5*** (0.4) Pregnancy interval missing Noa Yes
. . -31.1 (30.1)
. . -56.8** (20.0)
. . -29.2 (28.4)
Gestation length (spline) 18-41 weeks 42-50 weeks
163.4*** (2.7) 15.6 (15.6)
147.4*** (1.3) -34.2*** (9.3)
142.6*** (3.1) -24.3 (16.2)
Adequacy of prenatal care initiation Inadequate -12.3 (29.1) 20.9 (14.4) 21.5 (27.6) Intermediate -19.1 (21.4) 20.0 (11.2) 16.8 (19.9) Adequate -2.5 (11.1) -14.3* (7.2) -6.1 (11.8) Adequate plusa . . . . . . Adequacy of prenatal care visits Inadequate -31.5 (28.8) -31.0* (14.8) -47.8 (28.5) Intermediate -19.1 (15.0) -16.5 (9.2) -36.6* (15.4) Adequatea . . . . . . Adequate Plus -14.7 (13.5) 5.6 (9.6) 8.6 (16.5) Number of prenatal care visits (spline) 0-14 visits 1.8 (3.2) 6.8*** (1.9) 3.0 (3.6) 15+ visits -0.4 (2.8) 2.0 (1.6) -1.1 (3.5) Prenatal care information missing Noa Yes
. . -2.5 (58.6)
. . 72.5* (29.9)
. . 112.7 (64.8)
Medical risk factors Nonea Any
. . 9.4 (10.4)
. . -36.1*** (7.8)
. . -13.8 (14.5)
Smoked during pregnancy Noa Yes
. . -148.6*** (18.7)
. . -159.0*** (11.0)
. . -122.4** (42.0)
(Continued)
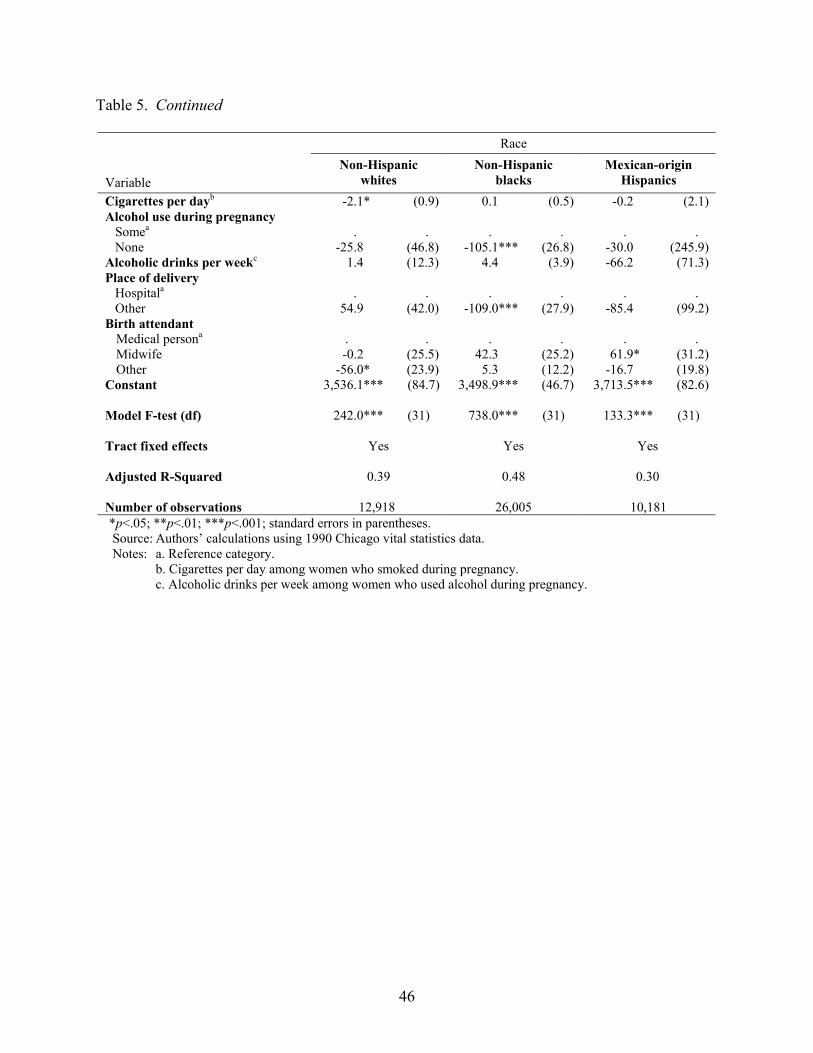
46
Table 5. Continued
Race Variable
Non-Hispanic whites
Non-Hispanic blacks
Mexican-origin Hispanics
Cigarettes per dayb -2.1* (0.9) 0.1 (0.5) -0.2 (2.1) Alcohol use during pregnancy Somea None
. . -25.8 (46.8)
. . -105.1*** (26.8)
. . -30.0 (245.9)
Alcoholic drinks per weekc 1.4 (12.3) 4.4 (3.9) -66.2 (71.3) Place of delivery Hospitala Other
. . 54.9 (42.0)
. . -109.0*** (27.9)
. . -85.4 (99.2)
Birth attendant Medical persona . . . . . . Midwife -0.2 (25.5) 42.3 (25.2) 61.9* (31.2) Other -56.0* (23.9) 5.3 (12.2) -16.7 (19.8)
Constant 3,536.1*** (84.7) 3,498.9*** (46.7) 3,713.5*** (82.6) Model F-test (df) 242.0*** (31) 738.0*** (31) 133.3*** (31) Tract fixed effects Yes Yes Yes Adjusted R-Squared 0.39 0.48 0.30 Number of observations 12,918 26,005 10,181
*p<.05; **p<.01; ***p<.001; standard errors in parentheses. Source: Authors’ calculations using 1990 Chicago vital statistics data. Notes: a. Reference category. b. Cigarettes per day among women who smoked during pregnancy. c. Alcoholic drinks per week among women who used alcohol during pregnancy.

47
Table 6. Decomposition of race/ethnic differences in birthweight based on fixed effects regression models with endogenous and exogenous characteristics
Model Group
Non-Hispanic whites
Non-Hispanic blacks
Mexican-origin Hispanics
Non-Hispanic whites
3,418.5a (3.9)
3,269.4 (7.0)
3,417.4 (13.0)
Non-Hispanic blacks
3,249.3 (8.7)
3,086.8a (2.8)
3,253.9 (12.3)
Mexican-origin Hispanics
3,385.6 (9.4)
3,292.4 (18.9)
3,383.8a (4.5)
Source: Authors’ calculations using 1990 Chicago vital statistics data. Notes: a. Actual observed value; standard errors in parentheses.
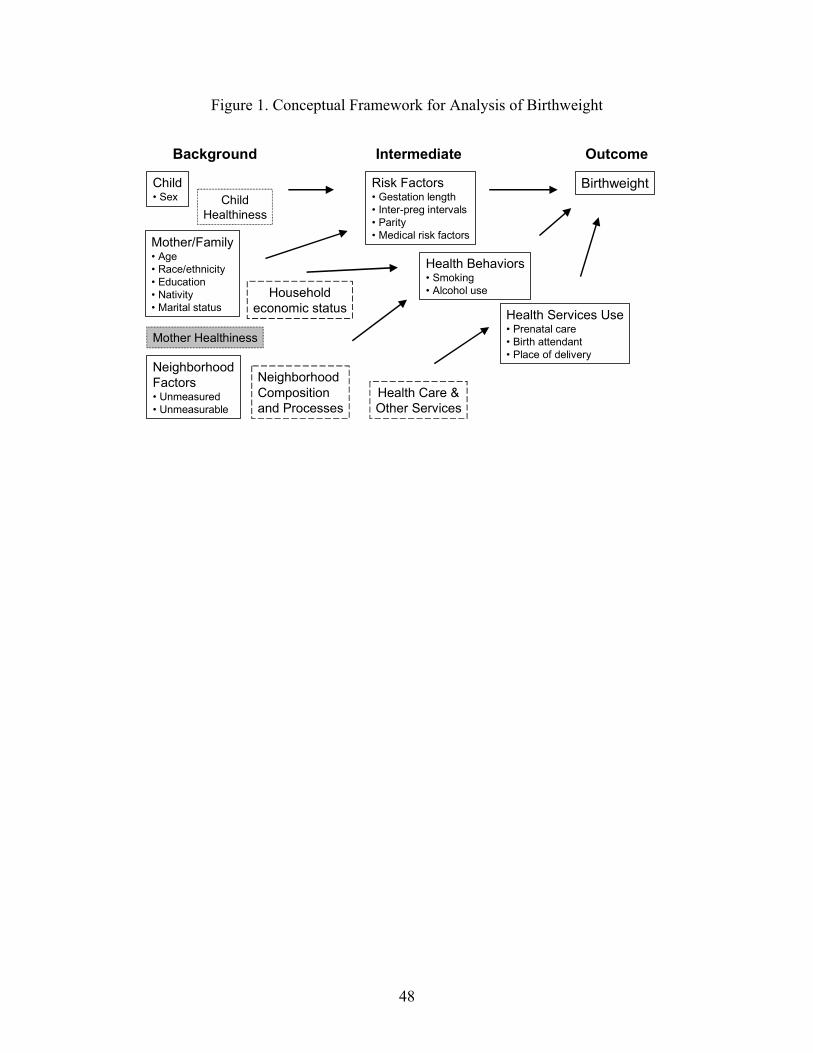
48
Figure 1. Conceptual Framework for Analysis of Birthweight
NeighborhoodFactors• Unmeasured• Unmeasurable
Background
Health Behaviors• Smoking• Alcohol use
Birthweight
Health Services Use• Prenatal care• Birth attendant• Place of delivery
Child• Sex
Health Care &Other Services
Mother/Family• Age• Race/ethnicity• Education• Nativity• Marital status
ChildHealthiness
Mother Healthiness
Intermediate Outcome
Risk Factors• Gestation length• Inter-preg intervals• Parity• Medical risk factors
NeighborhoodComposition and Processes
Householdeconomic status

49
Figure 2. The Relationship Between Birthweight and the Risk of Infant Mortality Based on Vital Statistics for Chicago, IL, 1990
Pre
dic
ted
Mo
rta
lity
Pro
ba
bili
ty
Birthweight in Grams401 1000 1599 2198 2797 3396 3995 4594 5193 5792
2500
0
1
Note: Figure plots the predicted probability of death based on a linear probability mortality model for infant
mortality with birthweight treated as a spline with 15 evenly spaced segments. The infant mortality rate for Chicago in 1990 was 12.5 per 1,000.