explaining plant-level differences in manufacturing
TRANSCRIPT

PRODUCTION AND OPERATIONS MANAGEMENT Vol. 4, No. 4, Fall 199.5
Primed in U.S.A.
EXPLAINING PLANT-LEVEL DIFFERENCES IN MANUFACTURING OVERHEAD: STRUCTURAL AND
EXECUTIONAL COST DRIVERS IN THE WORLD AUTO INDUSTRY *
CHRISTOPHER D. ITTNER AND JOHN PAUL MACDUFFIE The Wharton School, University of Pennsylvania,
Philadelphia, Pennsylvania 19104, USA
Using data from 62 automobile assembly plants worldwide, we examine the extent to which various structural cost drivers (plant scale, automation, and product mix complexity) and exe- cutionalcost drivers (product manufacturability, management policies, and production practices) account for plant-level differences in manufacturing overhead. Our analysis of structural drivers finds that overhead hours per vehicle are negatively associated with production volumes, consistent with economies of scale in overhead functions. However, automation appears to have little influence on overhead levels. Product mix complexity’s effect on overhead requirements varies with the complexity’s form and the plant’s manufacturing capabilities. Option and parts complexity (mea- sures of peripheral and intermediate product variety) both exhibit adverse effects on overhead, reflecting the considerable logistical, coordination, and supervisory challenges that accompany an increased number of parts and more complex manufacturing tasks. In contrast, model mix complexity (a measure of fundamental variety) appears to have little impact on direct or overhead labor requirements in auto assembly plants. Our analysis of executional drivers provides empirical support for the claim that advanced manufacturing practices such as the reduction of buffers, multiskilled production workers, and the use of teams can lower overhead costs. We also find preliminary evidence that the lower overhead costs in Japanese auto assembly plants are due primarily to the use of multiskilled work teams and the shifting of traditional overhead activities to production workers. Overall, our results indicate that manufacturing overhead is a function not only of the structural cost drivers that have dominated the academic literature but also of executional cost drivers that are harder to duplicate and therefore potentially more valuable for achieving competitive advantage. (STRATEGIC COST MANAGEMENT; COST DRIVERS; LEAN MANUFACTURING; ORGANIZATIONAL DESIGN)
1. Introduction
The need to reassess both overhead structure and the number of overhead employees has emerged as a top management priority. According to a study by Boston University, manufacturing executives in the United States and Europe rank “high or rising overhead costs” among their top concerns, ahead of new product introductions, direct labor pro- ductivity, and technological innovation (De Meyer, Nakane, and Ferdows 1989 ) . Sim- ilarly, an Industry Week survey of American companies found that 77.9% of the respond- ing managers and executives were “seriously concerned” about overhead costs, with
* Received October 1994; revised July 1995; accepted July 1995.
312 1059-1478/95/0404/312$1.25
Copyright 0 1995, Production and Operations Management society

AUTO INDUSTRY DIFFERENCES IN MANUFACTURING OVERHEAD 313
another 16.6% “moderately concerned.” More significantly, over 90% of the Industry Week respondents said that their companies were making a determined effort to reduce overhead (Sheridan 1988 ) .
In response to growing concerns about overhead costs, literally hundreds of American companies have implemented overhead downsizing programs. Yet, despite the widespread adoption of these programs, critics charge that the resulting overhead cuts are often temporary (Neumann 1987; Blaxill and Hout 199 1; Peterson 1992; Cascio 1993). Ward, Berger, and Miller ( 1992 ), for example, argue that overhead workforce reductions are often motivated solely by the desire to reduce payroll rather than a deeper understanding of the causes of overhead growth. Once cost pressures are reduced, overhead staffing typically returns to its original size. Business writers and academics alike contend that lasting overhead reductions require companies to identify the underlying drivers of over- head costs and integrate this information into a process of continuous improvement and organizational redesign (e.g., Miller and Vollmann 1985; Neilson 1990; Blaxill and Hout 1991; Istvan 1992; Cascio 1993).
Using data from the MIT International Motor Vehicle Program (IMVP) study of au- tomobile assembly plants worldwide, we investigate the extent to which various structural and executional cost drivers account for plant-level differences in manufacturing overhead. The IMVP sample offers a unique database for our exploratory analysis. First, the data focus on a common set of activities within a single-production process. Empirical research has shown that manufacturing overhead levels vary significantly by industry and process type (Raffi and Swamidass 1987; Ward, Berger, and Miller 1992). By concentrating on a standardized set of activities within auto assembly, we minimize the confounding effects of industry and process differences.
Second, variations in product strategies within the sample allow us to evaluate the consequences of different forms of product variety (and therefore product mix complexity) on manufacturing overhead. Evidence indicates that the world’s auto manufacturers follow strikingly different strategies in providing customers with product choices (Wom- ack, Jones, and Roos 1990; MacDuffie, Sethuraman, and Fisher 1996). US domestic car makers have traditionally believed that extremely high production volumes are required to achieve the economies of scale needed to keep production costs low. This has led to a strategy of minimizing the variation in fundamentally different models (fundamental variety), while differentiating products for the customer by offering a large number of options that can be varied without altering the core design (peripheral variety). In contrast, Japanese manufacturers, at least in Japan, offer more distinct models from which cus- tomers can choose but far fewer possible option combinations. Approaches to product variety in European, Australian, and New Entrant (Brazil, Korea, Mexico, and Taiwan) plants tend to fall between the American and Japanese extremes.
Finally, the automobile industry has been widely cited for its use of advanced man- agement and production practices, particularly in Japanese plants (e.g., Abegglen and Stalk 1985; Cusamano 1985; Womack, Jones, and Roos 1990). Miller and Vollmann ( 1985 ) , Alster ( 1989 ) , and Blaxill and Hout ( 199 1) argue that production practices such as just-in-time manufacturing, workforce cross-training, and autonomous teams can yield significant reductions in overhead costs, in part because shop floor employees assume more indirect and supervisory responsibilities. While previous studies (e.g., Cusamano 1985; Krafcik 1988; Womack, Jones, and Roos 1990; MacDuffie and Krafcik 1992; Rommel, Kempis, and Kaas 1994) have identified the overall productivity advantages of advanced management and production practices in the automobile industry, none has examined the extent to which these practices account for differences in manufacturing overhead.
The remainder of the paper is organized as follows. The next section develops hypotheses regarding the drivers of manufacturing overhead, followed by a detailed description of the International Assembly Plant Study sample and variables in Section 3. Section 4

314 CHRISTOPHER D. ITTNER AND JOHN PAUL MACDUFFIE
provides descriptive statistics for the assembly plant data, and empirical results are pre- sented in Section 5. The paper concludes with a discussion of the results and implications for theory development and future research.
2. Structural and Executional Drivers of Manufacturing Overhead
A growing number of researchers and consultants contend that a strategic approach to cost reduction must be adopted if companies are to create and sustain long-term competitive advantage (e.g., Porter 1985, ch. 3; Riley 1987; Richardson 1988; Shank and Govindarajan 1994; Shields and Young 1995 ). According to advocates of “strategic cost management,” effective cost reduction integrates competitive strategy, technology strategies, human resource management strategies, and organizational design consider- ations to provide a focused and coordinated basis for generating lasting improvements in cost position relative to competitors. The keys to effective strategic cost management are understanding how these factors, or cost drivers, influence the organization’s cost structure, and using this knowledge to improve the performance of key activities in the firm’s value chain.
The strategic cost management literature suggests that cost drivers can be grouped into two general categories (e.g., Shank and Govindarajan 1994). Structural cost drivers are determined from a company’s choices regarding its underlying economic structure. Key cost drivers at this level include the organization’s scale and scope, the level and type of technology, and the organization’s product strategy with respect to the variety of products offered to customers. Executional or operational cost drivers are those determinants of a firm’s cost position that hinge on its ability to “execute” its operations or activities suc- cessfully. Critical executional cost drivers include work force involvement, the extent of total quality management activities, plant layout, and aspects of product design that affect the ease of manufacturing.
The purpose of this paper is to examine the ability of structural and executional cost drivers to explain plant-level differences in manufacturing overhead. In contrast to pre- vious overhead studies that have examined subsets of these drivers, we investigate the direct effects of a wider variety of structural and executional cost drivers on overhead. In addition, we examine whether these cost drivers indirectly affect overhead productivity by increasing direct labor requirements, thereby creating additional demand for super- visory and support personnel. In doing so, we attempt to develop a deeper understanding of the drivers of manufacturing overhead and the organizational methods available to control overhead growth.
2.1. Structural Cost Drivers
Data in the IMVP survey allow us to examine three primary structural cost drivers: automation, plant scale, and product mix complexity.
2.1.1. AUTOMATION. Organizational researchers have long argued that one of the strongest determinants of overhead is the level of automation in a plant. Early organi- zational design studies found that more automated manufacturing plants required greater overhead support because of higher engineering, maintenance, and computer program- ming requirements, more difficult setups, and more complex production scheduling (e.g., Blau, Falbe, McKinley, and Tracy 1976; Marsh and Mannari 198 1). However, recent research suggests that advances in manufacturing automation may actually lead to lower overhead requirements in more automated plants (e.g., Susman 1990; Kambayashi 1994). According to these authors, new manufacturing technologies are less reliant on hierarchical coordination and control, reducing the need for direct super- vision and complex production planning and control activities. The new technologies can also improve product quality and enhance the gathering and storing of information, making it possible to decrease quality assurance activities and increase the ability of

AUTO INDUSTRY DIFFERENCES IN MANUFACTURING OVERHEAD 315
machines to store and transmit information to other operations. Thus, the relationship between automation and overhead rates in modern automobile assembly plants remains an open issue.
2.1.2. PLANT SCALE. The strategic cost management literature suggests that a second key structural cost driver is plant scale. Organizational design studies indicate that larger organizations are more specialized, have more rules, more documentation, and more extended organizational hierarchies (e.g., Blau, Falbe, McKinley, and Tracy 1976; Grinyer and Yasai-Ardekani 1980; Marsh and Mannari 198 I), leading to higher overhead rates. The strategy and industrial organizations literatures, in contrast, have emphasized po- tential economies of scale in overhead resources (e.g., Scherer 1980; Porter 1985 ). These studies suggest that increased scale allows firms to spread fixed overhead costs over larger production volumes. Consequently, overhead costs per unit of production may actually be lower in larger organizations. These competing hypotheses provide conflicting pre- dictions regarding the influence of organizational size on manufacturing overhead.
2.1.3. PRODUCT MIX COMPLEXITY. One structural cost driver that has received con- siderable attention in the accounting and operations management literatures is product variety strategy and the product mix complexity that results from this choice. Researchers in these fields argue that product mix complexity creates considerable challenges for manufacturing overhead functions (e.g., Skinner 1974; Hayes and Wheelwright 1984; Miller and Vollmann 1985; Cooper and Kaplan 199 1) . With an increasingly complex product mix comes additional parts, greater inventory and material handling, additional setups, more complex scheduling and task assignment, and increased supervisory re- quirements. As a result, greater overhead resources must be committed to handle the increasing number of transactions and to ensure the smooth operation of the plant.
Although greater product mix complexity is widely believed to be associated with higher overhead costs, empirical studies have provided only limited support for this claim. Research using the Profit Impact of Marketing Strategies ( PIMS) database found that significant market share benefits accrued from broader product lines but observed no relationship between production costs and product variety ( Kekre and Srivasan 1990). Cross-sectional studies by Foster and Gupta ( 1990) and Banker, Potter, and Schroeder ( 1993 ) also found little association between direct measures of product mix complexity (e.g., number of parts, number of suppliers, breadth of product line) and manufacturing overhead. In contrast, Banker, Datar, Kekre, and Mukhopadhyay’s ( 1990) study of an auto parts manufacturer found that product mix heterogeneity had a significant impact on the overhead resources consumed by individual products within the plant. MacDuffie, Sethuraman, and Fisher ( 1996) found that some proxies for product mix complexity were negatively associated with labor productivity while others appeared to have little impact. However, their study did not examine the association between complexity and overhead requirements.
One explanation for the mixed results found in previous studies is that product mix complexity’s effect on overhead depends on its form. As noted earlier, variations in an auto assembly plant’s product mix can range from fundamental differences in vehicle designs (e.g., platforms, models, body styles, and drive train configurations) to peripheral differences in options such as air conditioning, power windows, and sun roofs that do not affect the basic vehicle design. Fundamental variety primarily affects the assembly plant’s body shop, a highly automated operation that welds together the basic infrastructure of the car, including the floor plan and inner body panels. Fisher, Jain, and MacDuffie ( 1995) argue that the tooling in an assembly plant’s body shop establishes a clear-cut ceiling on the fundamental variety that the plant can handle. If body shops have equipment that is dedicated to a single platform, it is impossible to build another platform without retooling. As a result, dedicated plants, which are able to produce only a very restricted range of models off a single platform, may see no association between minor variations

316 CHRISTOPHER D.ITTNER AND JOHN PAUL MACDUFFIE
in model mix (e.g., different body styles) and overhead requirements. Conversely, if companies have invested in flexible automation, the flexible equipment may be able to accommodate multiple platforms or models with little or no direct or overhead labor penalty. For example, high-speed transfer presses in the stamping area, automated for rapid die change, eliminate much of the downtime penalty associated with changing models. Similarly, flexible robots in the weld shop can be programmed to change the number, sequence, and placement of welds from one model to the next without additional labor input.
Peripheral variety, in contrast, allows manufacturers to differentiate products for cus- tomers without altering the core designs produced in a plant. However, peripheral variety is not without potential costs. Greater peripheral variety increases manufacturing com- plexity by multiplying the number of parts that must be ordered, received, unpacked, sequenced, delivered to the assembly line, and installed. Auto companies attempt to reduce the adverse effects of peripheral variety by using complex scheduling algorithms to determine, for the current day’s scheduled production, the build sequence that min- imizes assembly line productivity losses due to option variability. For example, if 25% of all cars require sunroofs, these algorithms will seek to smooth, or balance, the distri- bution of work on the line so that every fourth car require a sunroof.
Line balancing becomes easier when only a few option packages are available on any given vehicle. This has led more and more companies to follow a policy of installing many “options” as standard equipment and then bundling the remaining options into just a few packages. Although line balancing and option bundling minimize the disruptive effect of options on direct labor workers, they may do little to shield overhead functions from the additional material handling and production control requirements caused by higher option and parts complexity.
2.2. Executional Cost Drivers
Following the strategic cost management literature, we investigate three broad categories of executional cost drivers: product manufacturability, management policies, and pro- duction practices.
2.2.1. PRODUCT MANUFACTURABILITY. One factor that is hypothesized to influence a plant’s overhead costs is the manufacturability of the organization’s product designs. In particular, the product development literature argues that designing a product for ease of manufacturability reduces the number of parts and eliminates unnecessary and difficult steps, leading to reduced assembly times, lower coordination and material handling costs, and fewer defects and the associated costs of inspection and rework (Whitney 1988; Semich 1989; Ulrich, Sartorius, Pearson, and Jakiela 1993). Thus, plants assembling products that are designed for ease of manufacturability are expected to have lower manufacturing overhead.
2.2.2. MANAGEMENTPOLICIESANDPRODUCTIONPRACTICES. Even more important than differences in product manufacturability may be variations in management policies and production practices. Recent studies suggest that the organizational “logic” in tra- ditional mass production assembly plants differs from that in plants employing advanced manufacturing practices ( Womack, Jones, and Roos 1990; Blaxill and Hout 199 1; MacDuffie and Krafcik 1992; Lawler, Mohrman, and Ledford 1992; Barker 1994; MacDuffie 1995). Mass production plants typically carry large buffers to protect them- selves from disruptions of various kinds, require minimal skill in production jobs, assign many problem-solving tasks to specialized staff, and demand little motivation or com- mitment from the workforce. In contrast, advanced production practices such as just- in-time production and “lean” manufacturing reduce inventory and repair-buffers, making problems in the system more visible and thereby creating pressure to eliminate those problems as quickly as possible. The emphasis on ongoing problem solving makes these

AUTO INDUSTRY DIFFERENCES IN MANUFACTURING OVERHEAD 317
plants highly reliant on employee involvement, flexible work arrangements, and “high commitment” human resource policies that seek to maximize employee motivation and flexibility.
Advanced management and production practices offer a number of potential benefits to overhead functions. The use of just-in-time production methods lessens the need for elaborate and time-consuming inventory-tracking and shop floor control systems, decreasing the number of transactions that must be processed by overhead personnel (Miller and Vollmann 1985; Barker 1994). Requirements for high-quality parts and components lead to the discovery and elimination of defects, reducing the costs of sched- uling, expediting, inventory management, material handling, inspection, rework, and downtime that are driven by defective parts and components (Ittner 1994). Moreover, the implementation of lean production practices requires plants to decentralize many production and problem-solving responsibilities from supervisors and specialized indirect labor employees to multiskilled production workers and autonomous teams, shifting work. from overhead to direct labor functions ( Alster 1989; Blaxill and Hout 199 1; Pe- terson 1992).
2.3. Indirect Efects through Direct Labor The preceding discussions focus on the direct effects of structural and executional cost
drivers on manufacturing overhead. In addition, the organizational structure literature suggests that these factors may also impact manufacturing overhead indirectly through direct labor requirements (e.g., Zwerman 1970; Blau, Falbe, McKinley, and Tracy 1976). Effective managerial span of control arguments, for example, suggest that higher direct labor requirements lead to an increased need for managerial personnel. Consequently, if the hypothesized cost drivers increase or decrease direct labor requirements, the number of supervisors and managers should rise or fall as well.
Indirect labor requirements such as maintenance and personnel administration may also vary with direct labor content. Anecdotal evidence indicates that both American and Japanese companies use heuristics on the required ratio of indirect-to-direct labor workers when developing overhead budgets (Doe 1992)) suggesting that higher direct labor requirements lead to increased indirect labor staffing. As a result, the hypothesized determinants of manufacturing overhead are expected to affect overhead levels not only directly but also indirectly through direct labor requirements.
3. Research Design
3.1. Sample To examine the structural and executional drivers of manufacturing overhead, we
employ data from the International Assembly Plant Study carried out under the auspices of the International Motor Vehicle Program ( IMVP) at MIT. Ninety assembly plants were contacted to participate, with survey responses received from 70 during 1989 and early 1990. The 70 plants represent 24 producers in 16 countries and approximately 60% of total assembly plant capacity worldwide. Questionnaires were sent to a contact person, often the plant manager, who distributed different sections to the appropriate departmental manager or staff group. Plants and companies were guaranteed complete confidentiality and, in return for their participation, received a feedback report comparing their responses with mean scores for different regions. All of the participating plants were visited by one of the two primary IMVP researchers, providing an opportunity to fill in missing data, clarify responses that were unclear or internally inconsistent, and carry out interviews to aid later interpretation of statistical analyses.
This study analyzes the 62 volume plants in the final sample; 8 plants making luxury/ specialist products are omitted to enhance the comparability of the data. Because of missing observations for some variables, the number of plants falls to 57 in some tests.
318 CHRISTOPHER D. ITTNER AND JOHN PAUL MACDUFFIE
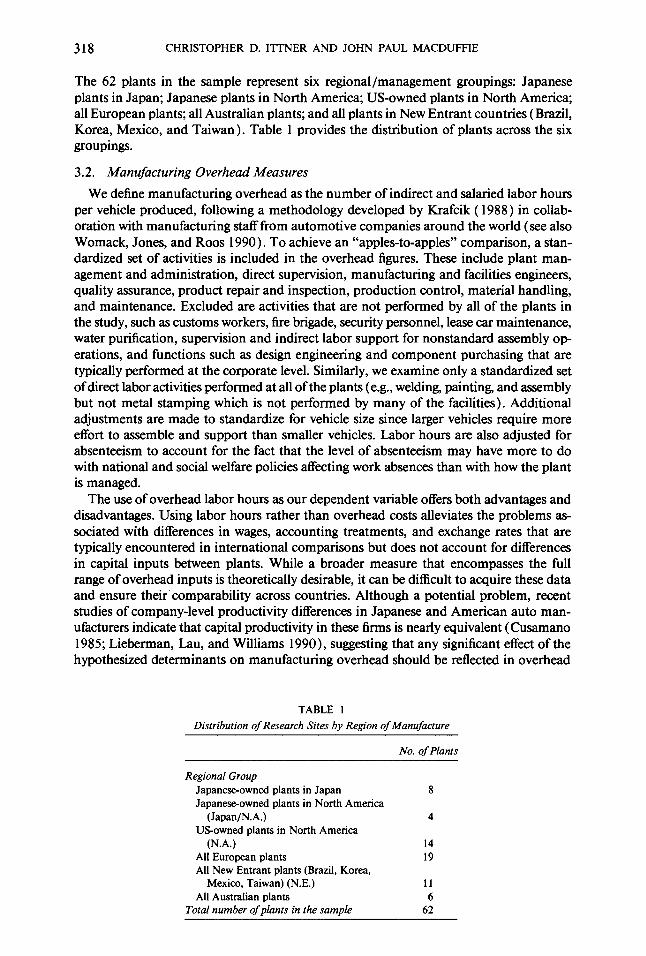
The 62 plants in the sample represent six regional/management groupings: Japanese plants in Japan; Japanese plants in North America; US-owned plants in North America; all European plants; all Australian plants; and all plants in New Entrant countries (Brazil, Korea, Mexico, and Taiwan). Table 1 provides the distribution of plants across the six groupings.
3.2. Manufacturing Overhead Measures
We define manufacturing overhead as the number of indirect and salaried labor hours per vehicle produced, following a methodology developed by Krafcik ( 1988) in collab- oration with manufacturing staff from automotive companies around the world (see also Womack, Jones, and Roos 1990). To achieve an “apples-to-apples” comparison, a stan- dardized set of activities is included in the overhead figures. These include plant man- agement and administration, direct supervision, manufacturing and facilities engineers, quality assurance, product repair and inspection, production control, material handling, and maintenance. Excluded are activities that are not performed by all of the plants in the study, such as customs workers, fire brigade, security personnel, lease car maintenance, water purification, supervision and indirect labor support for nonstandard assembly op erations, and functions such as design engineering and component purchasing that are typically performed at the corporate level. Similarly, we examine only a standardized set of direct labor activities performed at all of the plants (e.g., welding, painting, and assembly but not metal stamping which is not performed by many of the facilities). Additional adjustments are made to standardize for vehicle size since larger vehicles require more effort to assemble and support than smaller vehicles. Labor hours are also adjusted for absenteeism to account for the fact that the level of absenteeism may have more to do with national and social welfare policies affecting work absences than with how the plant is managed.
The use of overhead labor hours as our dependent variable offers both advantages and disadvantages. Using labor hours rather than overhead costs alleviates the problems as- sociated with differences in wages, accounting treatments, and exchange rates that are typically encountered in international comparisons but does not account for differences in capital inputs between plants. While a broader measure that encompasses the full range of overhead inputs is theoretically desirable, it can be difficult to acquire these data and ensure their’comparability across countries. Although a potential problem, recent studies of company-level productivity differences in Japanese and American auto man- ufacturers indicate that capital productivity in these firms is nearly equivalent (Cusamano 1985; Lieberman, Lau, and Williams 1990), suggesting that any significant effect of the hypothesized determinants on manufacturing overhead should be reflected in overhead
TABLE 1 Distribution of Research Sites by Region of Manufacture
No. of Plants
Regional Group Japanese-owned plants in Japan Japanese-owned plants in North America
(Japan/N.A.) US-owned plants in North America
(N.A.) All European plants All New Entrant plants (Brazil, Korea,
Mexico, Taiwan) (N.E.) All Australian plants
Total number of plants in the sample
8
4
14 19
11 6
62

AUTO INDUSTRY DIFFERENCES IN MANUFACTURING OVERHEAD 319
labor. In addition, our automation variable (described below) provides a partial control for capital-labor substitutions. While this measure does not capture total capital invest- ment, it does capture investments in process equipment that should be most directly linked to labor requirements.
Another potential concern with our overhead labor figures is differences in employee skill levels. “Human capital” theory has long held that investments in general and firm- specific skills can boost both personal outcomes (income, career advancement) and firm- level economic performance (Oi 1962; Becker 1964). General skills, which are easily transferable across jobs and firms, are assumed to arise primarily through education outside the firm (e.g., schooling in basic reading, writing, and analytical skills). Firm- specific skills, in contrast, cannot be easily transferred across organizations, providing an incentive to invest in training when acquisition of these skills boosts economic perfor- mance. We capture plant-level differences in firm-specific training in our human resource management variable, discussed in the following section. In addition, we examined the effect of general skills on overhead productivity by repeating the analyses below after introducing an additional independent variable that measured the average years of formal education for the workers in the plant. The education measure, which was available for 44 of the 62 plants, had no significant direct or indirect effect on overhead requirements. Given the already small sample size and the minimal association with overhead, we exclude the education measure in subsequent analyses.
Finally, the activities included in the overhead figures may differ across plants if some of the facilities have shifted traditional overhead labor activities such as inspection and machine setup to production workers. If so, these activities will be included in the direct labor measures rather than the overhead figures. To examine the effect of job definition on our results, we include a measure of direct labor responsibility for various traditional indirect labor activities as an additional explanatory variable in later analyses.
3.3. Measures of the Hypothesized Structural Drivers
3.3.1. AUTOMATION. We utilize two measures to examine the hypothesis that au- tomation influences overhead requirements. The robotic index represents the number of robots (defined as programmable and having three or more axes of movement) in the welding, paint, and assembly areas, adjusted for the scale of the plant. Since robots typically represent new investment and are by definition flexible automation, this index provides a proxy for the technological complexity of plant automation. However, the robotic index misses the often substantial investments plants make in fixed or “hard” automation and thus only partially reflects the level of plant automation. The total au- tomation measure, in contrast, captures the level of both fixed and flexible automation. The total automation measure reflects the percentage of direct production steps in the welding, paint, and assembly areas that are automated. For each functional area, a proxy measure for direct production activities was developed (e.g., the percentage of spot and seam welds applied by automation in the body welding operation and the percentage of total square inches of paint applied by automation ) . A weighted average level of auto- mation was then calculated on the basis of the amount of direct labor each functional area requires in an average unautomated plant. Since the two measures are highly cor- related ( r = 0.8 1) and yield similar results when included in the regressions, only results using the more comprehensive total automation variable are reported in the paper.
3.3.2. PLANT SCALE. We define production scale as the natural logarithm of the average number of vehicles built during a standard, nonovertime day, adjusted for capacity utilization. Overtime is excluded from both production levels and hours worked to adjust for overcapacity situations. In undercapacity situations, we distinguish between short- and long-term undercapacity. When undercapacity is short-term, we utilize data from the most recent period of full capacity operation. When undercapacity is long-term, we

320 CHRISTOPHER D.ITTNER AND JOHN PAUL MACDUFFIE
assume that the plant has adjusted labor inputs to the new capacity level and regard the new level as the effective capacity of the plant.
3.3.3. PRODUCT MIX COMPLEXITY. Three measures capture the various forms of product mix complexity from fundamental to peripheral:
3.3.3.1. Model Mix Complexity. The model mix complexity measure reflects the level of fundamental variety within a plant. The variable is based on the mix of different products and product variants produced. It includes the number of distinct platforms, models, body styles, drive train configurations (front-wheel versus rear-wheel drive), and export variations (right-hand versus left-hand steering), weighted in accordance with interview data from plant managers about their contribution to model mix complexity (Krafick 1988). For example, 10 points are given for each unique platform (the fun- damental infrastructure of the car, which includes a unique underbody and wheelbase), 5 points for each unique model (greater than 50% unique exterior parts), and 5 points for each body style (two-door, four-door, station wagon ), etc. Managers reported that dedicated assembly lines largely eliminate the complexity problems associated with fun- damental variety, although parts and option complexity (described below) may be higher. Consequently, the model mix measure includes a correction factor to account for the number of body shops and assembly lines in the plant. For instance, a plant producing two models on two parallel assembly lines, with one model per line, is given the same model mix score as a plant that produces one model on one assembly line. Although this correction reflects the experience of plant managers, our results change little when the assembly line correction is not made. The resulting model mix complexity measure is scaled to yield a score from 0 to 100, where 0 represents the plant with the least complexity in the sample and 100 the plant with the most complexity.
3.3.3.2. Option Complexity. The option complexity variable captures the option con- tent of models produced in a plant, a measure of peripheral variety. Option content consists of product variations that are independent of the core design and can therefore be installed without affecting the level of fundamental variety. The option complexity index represents the percentage of vehicles produced in a plant with a particular option, from a list of 11 options (air conditioning; power steering, brakes, locks, and windows; cruise control; left- and right-hand remote mirrors; sunrooc four-wheel drive; and antilock brakes). The options for each product are weighted by their retail price, and the total price of options as a percentage of selling price is calculated. Total option complexity for the plant is derived from the proportion of total production devoted to each product, with the resulting measure resealed from 0 to 100 as above.
3.3.3.3. Parts Complexity. The parts complexity measure refers to an intermediate level of complexity between fundamental and peripheral. The index is computed from two subgroups of variables. The first subgroup includes three measures of parts or com- ponent variation-the number of engine/transmission combinations, wire harnesses, and exterior paint colors-that affect the sequencing of vehicles, the variety of required subassemblies, and material and parts flow through the system. The second subgroup includes three measures-the number of total parts to the assembly area, the percentage of common parts across models, and the number of suppliers to the assembly area-that affect both the logistical requirements of material and parts flow and the administrative/ coordination requirements for dealing with suppliers. Each of these variables is scored on a l-6 scale, with higher scores representing higher levels,of parts complexity. The individual parts complexity measures are standardized to z-scores and then summed, with the resulting index resealed from 0 to 100. The Cronbach’s alpha for this index is 0.75.
3.4. Measures of the Hypothesized Executional Drivers 3.4.1. PRODUCT DESIGN AGE. Product design age is defined as the weighted average
number of years since a major model change for each of the products currently being

AUTO INDUSTRY DIFFERENCES IN MANUFACTURING OVERHEAD 321
built in a plant. The measure is a crude proxy for manufacturability, under the assumption that products designed more recently are more likely to have been conceived with ease of assembly in mind than older products. Clearly, this assumption must be qualified. Although newer models may be more likely to reflect the movement to more manufac- turable designs, older models may be associated with fewer labor hours per vehicle because of learning curve effects. Most evidence, however, suggests that the benefits from more manufacturable automobile designs outweigh learning curve gains (Womack, Jones, and Roos 1990).
3.4.2. ADVANCEDMANAGEMENTANDPRODUCTIONPRACTICES. Three separatein- dices measure the extent to which a plant employs various advanced management and production practices. Each index is made up of multiple variables that are standardized to z-scores before being combined. The combined indices are then resealed from 0 to 100, where a low score indicates a traditional mass production system and a high score an advanced manufacturing environment.
3.4.2.1. Use of Bu.rs. This index measures a set of production practices that are indicative of overall production philosophy with respect to buffers (e.g., incoming and work-in-process inventory), with a low score signifying a “buffered” system and a high score a “lean” system. The measure consists of three items:
l the space (in square feet) dedicated to final assembly repair, as a percentage of total assembly area square footage;
l the average number of vehicles held in the work-in-process buffer between the paint and assembly areas, as a percentage of one shift production; and
l the average level of inventory stocks, in days, for a sample of eight key parts, weighted by the cost of each part.
3.4.2.2. HRM Policies. This index measures a set of policies that affect the “psycho- logical contract” between the employee and the organization and, therefore, employee motivation and commitment. A low score for this variable indicates a “low commitment” set of human resource management (HRM) policies and a high score indicates “high commitment” policies. The index consists of five different items:
l the hiring criteria used to select employees in three categories: production workers, first line supervisors, and engineers
[the sum of rankings of the importance of various hiring criteria for these three groups of employees, with low scores for criteria that emphasize the fit between an applicant’s existing skills and job requirements (“previous experience in a prior job”) and high scores for criteria that emphasize openness to learning and interper- sonal skills (“a willingness to learn new skills” and “ability to work with others”)] ;
l the extent to which compensation is contingent upon performance
(0 = no contingent compensation; 1 = compensation contingent on corporate per- formance; 2 = compensation contingent on plant performance, for managers only; 3 = compensation contingent on plant performance or skills acquired, production employees only; and 4 = compensation contingent on plant performance, all employees);
l the extent to which status barriers between managers and workers are present
(0 = no implementation of policies that break down status barriers and 1, 2, 3, 4 = implementation of 1,2, 3, or 4 of the following policies: common uniform, com- mon cafeteria, common parking, no ties);
l the level of training provided to newly hired production workers, supervisors, and engineers in the first 6 months of employment
(0 = up to 1 week of training for newly hired production workers, first line supervisors, and engineers; 1 = l-2 weeks of training for newly hired employees in each group; 2 = 2-4 weeks of training; and 3 = over 4 weeks of training); and

322 CHRISTOPHER D. ITTNER AND JOHN PAUL MACDUFFIE
l the level of ongoing training provided to experienced production workers, supervisors, and engineers
(0 = O-20 hours of training for experienced [over 1 year of service] production workers, first line supervisors, and engineers per year; 1 = 2 l-40 hours of training per year in each group; 2 = 4 l-80 hours of training per year; and 3 = over 80 hours of training per year).
3.4.2.3. Work SJLV&~S. This index captures how work is organized (in terms of both formal work structures and the allocation of work responsibilities) and the participation of employees in production-related problem-solving activities. A low score for this variable indicates a work system that is “specializing” in orientation while a high score indicates a “multiskilling” orientation. The index consists of six different items:
l the percentage of the workforce involved in formal work teams; l the percentage of the workforce involved in employee involvement groups; l the number of production-related suggestions received per employee; l the percentage of production-related suggestions implemented; l the extent of job rotation within and across teams
(0 = no job rotation, 1 = infrequent rotation within teams, 2 = frequent rotation within teams; 3 = frequent rotation within teams and across teams in the same department; 4 = frequent rotation within teams, across teams, and across depart- ments) ; and
l the degree to which production workers carry out quality tasks (0 = functional specialists responsible for all quality problems; 1,2,3,4 = production workers responsible for 1, 2, 3, or 4 of the following tasks: inspection of incoming parts, work-in-process, finished products; gathering statistical process control data).
Reliability tests for the three management and production organization indices indicate satisfactory internal consistency among their components. The Cronbach’s alphas are 0.62 for the use of buffers index, 0.70 for the HRM index, and 0.8 1 for the work systems index. Construct validity is further supported by factor analysis. Each of the variables comprising the individual management and production organization indices loads on only one factor, with the percentage of variation explained by that factor ranging from 45% for the HRM index to 58% for the use of buffers index.
The three management and production organization indices are highly correlated--r = 0.62 between use of buffers and work systems, 0.48 between use of buffers and HRM
policies, and 0.63 between work systems and HRM policies. Given the magnitude of these correlations, the three indices are individually entered into subsequent regressions to avoid problems with multicollinearity.
4. Descriptive Statistics
Table 2 provides descriptive statistics for the variables defined above. The data show sizeable regional differences in nearly every measure. Both mean (Student’s t) and median (Mann-Whitney) tests indicate that Japanese plants in Japan tend to have the fewest overhead hours per vehicle (mean = 5.73 hours), followed by Japanese-owned plants in North America and U.S.-owned plants in North America (means = 9.17 and 9.66 hours, respectively). Plants in Europe, Australia, and New Entrant countries tend to be least efficient on average, using more than 13 overhead hours per vehicle.
Consistent with their respective product strategies, Japanese plants have the highest model mix and parts complexity, and American plants the highest option complexity. European and Australian plants fall between the Japanese and American plants on each of the complexity measures, while New Entrant plants contend with high model mix complexity and moderate levels of parts and option complexity. Japanese plants in Japan have made the greatest progress in implementing advanced management and production practices. Japanese-owned plants in North America approach their corporate siblings in
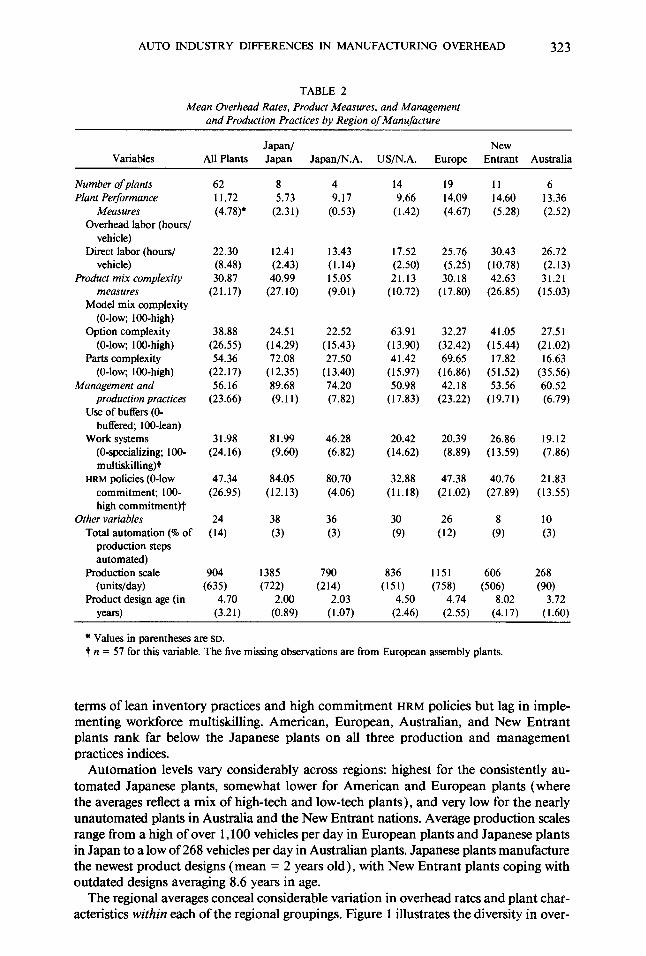
AUTO INDUSTRY DIFFERENCES IN MANUFACTURING OVERHEAD 323
TABLE 2 Mean Overhead Rates, Product Measures, and Management
and Production Practices by Region of Manufacture
Variables Japan/ New
All Plants Japan Japan/N.A. US/N.A. Europe Entrant Australia
Number of plants Plant Performance
Measures Overhead labor (hours/
vehicle) Direct labor (hours/
vehicle) Product mix complexity
measures Model mix complexity
(O-low; IOO-high) Option complexity
(O-low; lOO-high) Parts complexity
(O-low; loo-high) Management and
production practices Use of buffers (O-
buffered; 100-&r) Work systems
(O-specializing; lOO- multiskilling)t
HRM policies (O-low commitment; IOO- high commitment)t
Other variables Total automation (% of
production steps automated)
Production scale
62 8 4 11.72 5.73 9.17 (4.78)* (2.3 1) (0.53)
22.30 (8.48) 30.87
(21.17)
12.41 (2.43) 40.99
(27.10)
13.43 (1.14) 15.05 (9.01)
38.88 (26.55) 54.36
(22.17) 56.16
(23.66)
24.5 1 22.52 (14.29) (15.43) 72.08 27.50
(12.35) (13.40) 89.68 74.20 (9.11) (7.82)
31.98 (24.16)
47.34 (26.95)
(ii)
81.99 46.28 (9.60) (6.82)
84.05 80.70 (12.13) (4.06)
38 (3)
36 30 (3) (9)
904 1385 790 (722) (214)
2.00 2.03 (units/day) (63%
Product design age (in 4.70
14 19 11 6 9.66 14.09 14.60 13.36
(1.42) (4.67) (5.28) (2.52)
17.52 (2.50) 21.13
(10.72)
63.91 (13.90) 41.42
(15.97) 50.98
(17.83)
20.42 20.39 26.86 19.12 (14.62) (8.89) (13.59) (7.86)
32.88 47.38 40.76 21.83 (11.18) (21.02) (27.89) (13.55)
836 1151 606 268 (151) (758) (506) (90)
4.50 4.74 8.02 3.72
25.76 30.43 (5.25) (10.78) 30.18 42.63
(17.80) (26.85)
32.27 41.05 (32.42) (15.44) 69.65 17.82
(16.86) (51.52) 42.18 53.56
(23.22) (19.71)
26.72 (2.13) 31.21
(15.03)
27.51 (21.02) 16.63
(35.56) 60.52 (6.79)
10 (3)
y-1 (3.2 1)
* Values in parentheses are SD.
(0.89) (1.07) (2.46) (2.55) (4.17) (1.60)
t n = 57 for this variable. The five missing observations are from European assembly plants.
terms of lean inventory practices and high commitment HRM policies but lag in imple- menting workforce multiskilling. American, European, Australian, and New Entrant plants rank far below the Japanese plants on all three production and management practices indices.
Automation levels vary considerably across regions: highest for the consistently au- tomated Japanese plants, somewhat lower for American and European plants (where the averages reflect a mix of high-tech and low-tech plants), and very low for the nearly unautomated plants in Australia and the New Entrant nations. Average production scales range from a high of over 1,100 vehicles per day in European plants and Japanese plants in Japan to a low of 268 vehicles per day in Australian plants. Japanese plants manufacture the newest product designs (mean = 2 years old), with New Entrant plants coping with outdated designs averaging 8.6 years in age.
The regional averages conceal considerable variation in overhead rates and plant char- acteristics within each of the regional groupings. Figure 1 illustrates the diversity in over-

CHRISTOPHER D. ITTNER AND JOHN PAUL MACDUPFJE
Japan Japan/TVA N.A. EWJpe N.E. Australia
Regional Groupings
FIGURE 1. Distribution of Overhead Hours per Vehicle by Region of Manufacture.
head labor content by identifying the best, worst, and median performers in each of the six groupings. The evidence indicates that individual plants in the United States, Europe, Australia, and New Entrant countries outperform some of their Japanese competitors. Moreover, the range of overhead rates among plants in Japan belies the notion that these plants are all equally efficient. The standard deviations in Table 2 provide similar evidence on the widespread variations in management practices and plant characteristics within regions.
Table 3 presents Pearson correlations between the various independent and dependent variables. Although some of the predictor variables are highly correlated, low variance
TABLE 3 Pearson Correlations between the Independent and Dependent Variables
in 62 International Auto Assembly Plants
1 2 3 4 5 6 7 8 9 10 11
1. Overhead car 1.00* 0.74 -0.49 -0.41 0.08 -0.26 0.06 0.47 -0.56 -0.41 -0.52 2. Direct labor per car 1.00 -0.69 -0.40 0.18 0.07 0.05 0.10 0.08 0.13 0.20 3. Automation 1.00 0.66 -0.27 0.12 0.21 -0.49 0.43 0.47 0.30 4. Scale 1.00 -0.09 0.09 0.55 -0.20 0.34 0.24 0.27 5. Model mix 1.00 -0.14 0.29 0.13 0.05 -0.09 0.18 6. Option complexity 1.00 -0.03 0.13 -0.26 -0.30 -0.28 7. Parts complexity 1.00 0.10 0.08 0.13 0.20 8. Design age 1.00 -0.48 -0.40 -0.31 9. Buffers 1.00 0.48 0.62
10. HRM policies? 1.00 0.63 11. Work systems? 1.00
* Correlations greater in absolute value than approximately 0.22,0.25, and 0.33 are significant at the 10, 5, and 1% levels, respectively.
t n = 57 for this variable.

AUTO INDUSTRY DIFFERENCES IN MANUFACTURING OVERHEAD 325
inflation factor (VIF) scores indicate no serious problems with multicollinearity in sub- sequent regressions (Fox 199 1) . As a further check, we reestimated the regressions after individually and jointly excluding the two independent variables that are most highly correlated with the other measures (automation level and product design age). The results for the remaining variables changed little from those presented in the paper.
5. Empirical Results
We employ path analysis to estimate the model illustrated in Figure 2. Coefficients and standard errors for the direct effects on direct and overhead labor are estimated using ordinary least squares. Bootstrap methods are then used to compute empirical standard errors for the total effects (i.e., combined direct and indirect effects on overhead through direct labor requirements). Specifically, we generate 500 random samples (each with 57 to 62 observations, depending on the number of plants with complete information for the model being estimated) and use the resulting distributions to compute bias-corrected confidence intervals for each variable (see Stine 1990).
The empirical results are presented in Table 4. Panel A of Table 4 provides the direct effects of the structural and executional cost drivers on direct labor productivity. Panel B contains the direct effects of these drivers on overhead requirements. Finally, panel C lists the drivers’ total effects (direct plus indirect effects through direct labor) on manu- facturing overhead.
5.1. Automation and Scale
Column 1 of Table 4 provides the base case regression of overhead hours per vehicle on automation levels, production volume, and direct labor requirements. The adjusted R2 for the direct effects of automation, scale, and direct labor on overhead labor is 0.55, and the overall coefficient of determination (a measure of the strength of several rela- tionships jointly) for the system of equations equals 0.52, indicating that these structural cost drivers explain a significant proportion of plant-level differences in overhead. The coefficients on direct labor hours and scale each have the expected signs-overhead labor
Structural Drivers
9 Plant Scale l Automation l Product h4ix Complexity
Executional Drivers * Product Manufacturability l Use of Bulk l HRh4 Policies l Work S#ems
Direct Labor -
Overhead Labor
FIGURE 2. Structural Model Examining the Effects of Structural and Executional Cost Drivers on Manu- facturing Overhead.

326 CHRISTOPHER D. ITTNER AND JOHN PAUL MACDUPPIE
TABLE 4 Path Models Examining the Determinants of Overhead Labor Hours per Vehicle (t-statistics in parentheses)
Panel A: Direct Effects on Direct Labor Hours per Car
(1) (2) (3) (4) (5) (6) n = 62 n = 62 n = 62 n = 57 n = 57 n = 57
Constant
Scale
Automation
Parts complexity
Option complexity
Model mix
Design age
Buffers
HRM policies
Work systems
Direct labor responsibilities
Adjusted RZ
25.53*** 31.88*** 32.57- 35.17*** 30.37*** 30.90*** (2.8 1) (3.46) (3.58) (3.65) (3.33) (3.25) 2.86 -3.48 -2.32 -4.14 -2.48 -2.90
(0.80) (-0.89) (-0.59) (-1.06) (-0.65) (-0.73) -46.83*** -33.90*** -31.77*** -25.12*** -28.64*** -32.07*** (-6.07) (-4.03) (-3.77) (-2.73) (-3.35) (-3.63)
- 0.09** 0.08* 0.09** 0.09** 0.08* (2.W (1.85) (2.14) (2.02) (1.74)
- 0.03 0.02 0.01 0.02 0.04 (1.15) (0.66) (0.39) (0.53) (1.24)
- -0.03 -0.02 -0.04 -0.02 -0.03 (-0.72) (-0.43) (-1.11) (-0.49) (-0.53)
- 0.75*** 0.62** 0.79*** 0.76*** 0.73** (2.74) (2.17) (2.8 1) (2.74) (2.47)
- - -0.06’ - - - (-1.56)
- - - -0.07** - - (-2.03)
- - - - -0.08** - (-2.39)
- - - - - -0.5 1 (-1.12)
0.47 0.56 0.58 0.6 1 0.62 0.58
Panel B. Direct Eflects on Overhead Labor Hours per Car
(1) (2) (3) (4) (5) (6)
Constant
Scale
Automation
Direct labor hours per car
Parts complexity
Option complexity
Model mix
Design age
Buffers
HRM policies
Work systems
Direct labor responsibilities
Adjusted R2
10.73** (2.13)
-3.66* (-1.97)
6.85 (1.34) 0.44***
(6.50) -
-
-
-
-
-
-
-
0.55
16.45*** (2.92)
-6.1 l*** (-2.8 1)
4.25 (0.80) 0.36***
(4.79) 0.05**
(2.01) 0.03**
(2.13) -0.02
(-0.87) 0.06
(0.34) -
-
-
-
0.58
17.61*** (3.14) -5.534***
(-2.54) 4.63
(0.88) 0.33***
(4.42) 0.05*
(1.95) 0.03*
(1.68) -0.0 1
(-0.6 1) -0.00
(-0.02) -0.03*
(-1.56) -
-
-
0.59
17.37*** (2.84)
-6.07**+ (-2.73) - 4.83
(0.87) 0.27***
(3.39) 0.05*
(1.93) - 0.03*
(1.94) -0.02
(-1.04) 0.24
(1.W -
-0.01 (-0.28)
-
-
0.57
18.56*** (3.34)
-5.87*** (-2.79)
4.46 (0.85) 0.23***
(2.91) 0.05**
(2.22) 0.03*
(1.73) -0.01
(-0.69) 0.24
(1.44) -
-
-0.04* (-1.98)
-
0.60
18.70*** (3.43)
-5.87*“* (-2.87)
3.57 (0.69) 0.24***
(3.19) 0.05
(1.68) 0.04**
(2.64) 0.00
(0.05) 0.17
(1.06) -
-
-
-0.60** (-2.47)
0.62

AUTO INDUSTRY DIFFERENCES IN MANUFACTURING OVERHEAD 327
TABLE 4 (cent ‘d)
Panel C: Total Efects on Overhead Labor Hours per Car
(1) (2) (3) (4) (5) (6)
Scale
Automation
Direct labor hours per car
Parts Complexity
Option complexity
Model mix
Design age
Buffers
HRM policies
Work systems
Direct labor responsibilities
Overall coefficient of determination
-2.40 (-1.00) -13.76** (-2.65)
0.44*** (6.50)
-
-
-
-
-
-7.36*++ (-2.88) -7.95
(-1.42) 0.36***
(4.79) 0.08***
(2.89) 0.04**
(2.50) -0.03
(-1.16) 0.33**
(1.82) -
- -
-6.30** (-2.50) -5.85
(-1.10) 0.33***
(4.42) 0.08**
(2.64) 0.04*
(1.74) -0.02
(-0.76) 0.20
(1.12) -0.05**
(-2.2 1) -
-
-7.19*** (-2.98) -1.95
(-0.34) 0.27***
(3.39) 0.07***
(2.87) 0.03*
(1.94) -0.03
(-1.43) 0.45**
(2.64) -
-0.03 (-1.15)
-
-6.44*** (-3.04) -2.13
(-0.34) 0.23***
(2.91) 0.07***
(2.92) 0.03*
(1.76) -0.01
(-0.86) 0.41**
(2.53) -
-
-0.06*** (-2.85)
0.52 0.68 0.71 0.74 0.77
-6.57*** (-2.92) -4.13 (0.2 1) 0.24***
(3.19) 0.07**
(2.35) 0.05***
(3.06) -0.01 (0.19) 0.35**
(2.08) -
-
-0.72*** (-2.75)
0.76
*** Significant at the 1% level (two-tailed test). ** Significant at the 5% level (two-tailed test). * Significant at the 10% level (two-tailed test). ’ Significant at the 15% level (two-tailed test).
per vehicle increases with direct labor hours and falls with scale, consistent with effective managerial span of control arguments and economies of scale. However, the direct effect of automation on overhead, though positive, is insignificant. Furthermore, the overall impact of automation on overhead is negative and statistically significant at the 1% level because of automation’s effect on direct labor requirements, contradicting early orga- nizational design studies that found higher levels of automation associated with increased overhead requirements.
5.2. Product-Related Drivers
Column 2 of Table 4 introduces the four product-related drivers (i.e., the three structural product mix complexity measures and the executional product design age measure) into the base case model. The addition of the product-related measures helps to explain plant- level differences in overhead, increasing the adjusted R* for the overhead direct effects equation to 0.58 and the overall coefficient of determination to 0.68. The strongest re- lationship is between overhead and parts complexity, which increases overhead labor not only directly but also indirectly through higher direct labor requirements. These results are consistent with the group technology and product design literatures (e.g., Whitney 1988; Dean and Susman 1989; Semich 1989) that contend that higher part counts not only increase assembly times and raise the number defects by production workers but also increase overhead requirements by expanding the number of suppliers with which production must be coordinated, multiplying the number of parts that must be ordered, received, unpacked, sequenced, and delivered to the line, and increasing

328 CHRISTOPHER D. ITTNER AND JOHN PAUL MACDUFFIE
opportunities for quality problems and the associated overhead costs of inspection and rework.
Option complexity is significantly associated with higher overhead but not with direct labor requirements. The limited association between option content and direct labor hours suggests that auto manufacturers’ efforts to shield assembly line workers from the effects of option complexity using option bundling and sophisticated line balancing al- gorithms have generally been successful. However, the significant positive relationship between option content and overhead labor indicates that line balancing and option bundling have not insulated overhead functions from the additional material handling and production control requirements created by higher option complexity.
Model mix complexity (a measure of fundamental variety) is not significantly associated with either direct or overhead labor. The minimal effect of model mix complexity on direct and overhead labor content is consistent with Fisher, Jain, and MacDuffie’s ( 1995 ) observation that model mix primarily impacts the body shop, a highly automated op- eration. Switching models among the variants that the body shop equipment can handle appears to have little impact on direct or overhead labor requirements. Taken together, the differential results for the three complexity measures support the hypothesis that product variety’s effect on overhead can vary with the variety’s form and the operation’s technological and organizational capabilities.
Design age, a proxy for ease of manufacturability, shows no direct effect on manufac- turing overhead. However, since older designs typically take more direct labor hours to assemble than newer designs (Womack, Jones, and Roos 1990)) design age appears to indirectly affect overhead levels through the additional supervisory and indirect employees needed to support the higher direct labor requirements.
5.3. Management and Production Practices
Columns 3-5 add the three management and production practice indices to the previous model to test the proposition that advanced management and production practices allow organizations to execute activities more efficiently, leading to lower overhead. The just- in-time literature contends that the minimization of buffers reduces overhead labor re- quirements by lowering the number of inventory transactions that must be processed by overhead personnel and forcing the elimination of poor quality materials and components. The evidence in column 3 provides modest support for this assertion. The coefficients on the use of buffers index are marginally significant at the 13% level (two-tailed test) in both the direct labor and overhead regressions. However, the buffers index has a highly significant total effect on overhead (p < 0.05, two-tailed test), indicating that plants following lean inventory practices have been able to reduce both supervisory and general overhead requirements.
When the use of buffers index is replaced by the human resource management ( HRM)
measure in column 4, the HRM variable emerges negative and significant in the direct labor equation but not in the overhead model. This finding may reflect the primary focus of high commitment HRM policies. Many associated practices, such as the elimination of status barriers, are primarily aimed at increasing the motivation and commitment of direct labor workers and, thereby, their productivity. Unless these direct labor employees subsequently take over work responsibilities that were previously carried out by specialized support staff or supervisors, high commitment HRM policies may have little effect on overhead labor productivity.
We examine the impact of work organization and employee participation on labor requirements by substituting the work systems index for the HRM measure. The evidence in column 5 of Table 4 indicates that a work system that is multiskilling in orientation can yield productivity gains in both direct and overhead labor. The coefficients on the work system index are negative and significant at the 5% level or better in nearly all of the equations, a result consistent with claims that a multiskilled workforce allows com-

AUTO INDUSTRY DIFFERENCES IN MANUFACTURING OVERHEAD 329
panies to lower overhead by shifting work responsibilities from supervisors and specialized indirect labor employees to production workers.
To investigate whether this shift in responsibilities actually boosts overall efficiency or simply moves labor hours from the overhead category to the direct labor category, we replace the work systems index with a second variable measuring the number of traditional overhead activities (from a list of 11) carried out by direct labor workers (equipment set up; maintenance; inspection of incoming parts, work-in-process, and finished products; gathering statistical process control data; development of quality control methods; setting production standards and methods; programming robots or other programmable auto- mation; installation of new equipment; and technical training). The resulting variable ranges from 0 to 7 and is highly correlated with the work systems index (r = 0.56). As shown in column 6, increasing the number of direct labor responsibilities reduces overhead labor requirements but does not lead to corresponding increases in direct labor content (in fact, the coefficient on the production responsibilities variable is negative, though not significant, in the direct labor model). Taken together, the evidence in columns 5 and 6 of Table 4 supports claims that shifting specialized indirect labor tasks to multiskilled production workers and autonomous work teams provides a powerful means for con- trolling overhead (Blaxill and Hout 199 1; Ostroff and Smith 1992; Peterson 1992 ).
5.4. Exploring the Japanese Overhead Advantage
One reason underlying the growing emphasis on overhead reduction is concern that skyrocketing overhead costs have put Western manufacturers at a competitive disadvan- tage relative to their Japanese competitors (Doe 1992; Peterson 1992). Studies by Abegglen and Stalk ( 1985 ) , Miller and Vollmann ( 1985 ) , and Dixon, Nanni, and Vollmann ( 1990) indicate that Japanese manufacturers have significantly lower factory overhead than American and European companies in the same industry. Among the explanations offered to account for the lower overhead in Japanese factories are flatter organizational structures and wider managerial spans of control (Rehder 1988; Dixon, Nanni, and Vollmann 1990), more focused factories (Magaziner and Hout 1980; Abegglen and Stalk 1985), greater application of advanced manufacturing practices (Miller and Vollmann 1985; Blaxill and Hout 199 1) , and workforce policies such as self-supervised teams and worker cross-training (Peterson 1992).
We extend the analyses to investigate the extent to which these explanations account for the lower overhead levels found in Japanese auto assembly plants. Given the small number of Japanese plants in the sample, the analyses should be viewed as exploratory. However, the results (not reported in the tables but available from the authors) do suggest some preliminary explanations for the Japanese overhead advantage.
Even though variations in scale, automation, and direct labor account for a significant proportion of plant-level overhead differences for the sample as a whole, these factors do not completely explain the lower overhead in Japanese firms. When an indicator (O/ 1) variable for Japanese plants in Japan is entered into the base case model, the results for these three variables change little, while the Japan indicator emerges negative and sta- tistically significant in both the direct and overhead labor regressions (p < 0.10, two- tailed test ) .
Similarly, the addition of the product-related measures does little to account for the lower overhead rates found in Japanese plants. Japanese plants in Japan continue to exhibit lower direct labor and overhead requirements after controlling for product mix characteristics, scale, and automation, with the results for the plant-specific variables changing little from those in the model without the Japan indicator variable. However, the fact that the Japan variable remains significant does not suggest that Japanese plants have escaped the adverse effects of product mix complexity on overhead. Nonparametric Spearman correlations between overhead and the variety measures in the Japanese plants are 0.54 for option complexity, 0.64 for parts complexity, and a statistically insignificant

330 CHRISTOPHER D. ITTNER AND JOHN PAUL MACDUFFIE
-0.05 for model mix complexity. These correlations are consistent with the results for the sample as a whole and indicate that variations in option and parts complexity help to explain overhead differentials even among Japanese plants. Indeed, there is increasing evidence that Japanese auto companies are rethinking the value of maintaining extremely high levels of product variety, both in terms of meeting customer demands and controlling manufacturing and overhead costs (Chandler and Williams 1993; Stalk and Webber 1993).
When the Japan indicator is entered along with the use of buffers index, the buffers variable is no longer statistically different from zero. The Japan indicator, on the other hand, remains significant at the 10% level or better (two-tailed test). The insignificant coefficients on the buffers variable may be due to the high correlation between the buffers index and the Japan variable (r = 0.56), causing problems with multicollinearity. Given the high correlation between the two variables, it is difficult to empirically disentangle the effect of inventory buffers from that of other practices used more frequently in Japanese plants.
In the model containing the HRM variable, the Japan indicator is not significantly different from zero in the direct labor model, while the HRM measure remains significant at the 10% level (two-tailed test). This evidence suggests that the use of high commitment HRM policies plays a role in the lower direct labor content found in Japanese plants. However, the human resource management variable does little to explain the Japanese overhead advantage. The coefficients on the HRM variable are statistically insignificant in the overhead and total effect models whereas the Japan indicator continues to exhibit highly significant direct and total effects on overhead requirements.
In contrast, our earlier findings regarding the value of multiskilled production workers and teams to overhead reduction remain essentially unchanged when the Japan indicator is introduced into the model. Moreover, the Japan indicator is no longer significantly correlated with overhead requirements when the work systems or direct labor responsibility variables are included in the regressions. Substantial reductions in the size of the Japan coefficients when the work systems or direct labor responsibilities measures are included in the overhead regressions suggest that these variables are picking up much of variance explained by the Japan indicator in the earlier analyses. In addition, the adjusted R2 and overall coefficient of determination are slightly higher when the work systems and direct labor responsibilities variables are included ( AR2 = 0.02 to 0.03, p < 0.10, two-tailed test), suggesting that these measures have additional explanatory,power that is not fully captured by the Japan indicator. Overall, the evidence in the work systems models suggests that multiskilling practices make a significant contribution to the lower overhead rates found in Japanese auto assembly plants.
6. Conclusion and Implications
This paper examined the sources of plant-level differences in manufacturing overhead to develop a better understanding of the drivers of overhead costs and the methods available to control overhead growth. Although the results from any single-industry study may not generalize to other manufacturing processes and competitive environments, our analysis of data from the International Assembly Plant Study provides a number of implications for theory development and future research. First, the results indicate that both structural and executional cost drivers account for differences in manufacturing overhead. However, prior academic research has generally focused on structural deter- minants of overhead costs. For example, the organizational design literature has empha- sized the influence of scale and automation on administrative intensity, while the industrial organizations literature has highlighted technology and economies of scale, and the ac- counting and operations management literatures have stressed product mix complexity.
Although our results indicate that these structural drivers explain a significant pro- portion of plant-level differences in manufacturing overhead, executional cost drivers

AUTO INDUSTRY DIFFERENCES IN MANUFACTURING OVERHEAD 331
such as product manufacturability, human resource management and work systems practices, and just-in-time production, which are harder to replicate and therefore po- tentially more valuable for achieving competitive advantage, also play a role in determining overhead costs. In particular, work systems appear to account for much of the Japanese overhead advantage. Clearly, the advanced production philosophy of locating responsi- bility for production matters as close as possible to the point of production pays off in lower overhead costs. This represents a partial reversal of the Taylorist philosophy of separating conception (“thinking” work) from execution (“doing” work). Having pro- duction workers who can “think” as well as “do” eliminates the rationale for many overhead activities.
The empirical evidence also indicates that structural and executional cost drivers impact manufacturing overhead not only directly but also indirectly through direct labor re- quirements. Many overhead cost driver studies have treated direct labor as a control variable, overlooking the indirect effects of these cost drivers on manufacturing overhead. If researchers are to develop a deeper understanding of overhead cost functions, both the direct and indirect effects of these drivers on overhead must be taken into account.
The negative or insignificant total associations between automation and manufacturing overhead in this sample challenge earlier organizational design studies that found higher overhead in more automated organizations. Our findings are consistent with recent claims that new manufacturing technologies can actually decrease overhead requirements. In the assembly plant context, these results are primarily due to the ability of advanced flexible automation to reduce setup times, achieve more consistent quality, and capture statistical information-all tasks once performed by indirect production staff or quality control specialists. Our findings suggest that the conclusions of many of the organizational design studies conducted in the 1960s and 1970s must be reexamined in light of the significant changes that have occurred in manufacturing over the past decade.
Finally, our evidence indicates that the effects of product mix complexity on overhead are related to the complexity’s form and the organizational and technological capabilities possessed by the firm. In the automotive industry, model mix complexity appears to have little impact on overhead or direct labor costs as long as plants produce models that are within the organization’s capabilities. Parts and option complexity, on the other hand, have a negative effect on overhead productivity regardless of the plant’s organi- zational and technological capabilities. This evidence suggests that one reason cross- sectional overhead studies have been unable to detect significant associations between product mix complexity and overhead costs is because they have not considered how organizational and technological capabilities in different industries influence the impact of various forms of product mix complexity on manufacturing overhead. Additional industry-specific studies will be required to understand how organizational capabilities influence the association between product mix complexity and overhead costs in different competitive settings.
Our results suggest a number of avenues for future research. One promising avenue is exploring the influence of structural and executional drivers on the entire value chain. The strategic cost management literature suggests that cost driver analyses should not be limited to the activities carried out within the firm but should also incorporate linkages with suppliers and customers. Suppliers not only produce and deliver inputs used in a firm’s activities, they profoundly influence the firm’s cost position as well. Similarly, distribution channels have a significant impact on a firm’s cost structure. Analyzing cost drivers throughout the value chain is essential for determining exactly where in the chain- from design to distribution-cost can be lowered or customer value enhanced (Shank and Govindarajan 1994).
Perhaps most important is understanding the interactions and trade-offs between the various structural and executional cost drivers. In this study, we have treated the various cost drivers as independent. However, cost drivers frequently counteract or re-

332 CHRISTOPHER D. ITTNER AND JOHN PAUL MACDUFFIE
inforce each other (Porter 1985, p. 84). In some cases, cost drivers are offsetting, with improvements in the utilization of one driver negatively impacting another. For example, a greater number of product offerings may allow firms to increase total production volumes and thereby achieve economies of scope in some overhead functions but may increase the costs of product mix complexity. In other cases, cost drivers can reinforce each other. MacDuffie ( 1995 ), for example, found that work systems, human resource management policies, and just-in-time production practices interact to produce greater productivity gains than provided by any of the practices individually. Similarly, research by MacDuffie, Sethuraman, and Fisher ( 1996) indicates that advanced management and production organization practices can reduce the adverse effects of product mix complexity. The presence of counteracting and reinforcing cost drivers implies the need to optimize entire processes to generate lasting improvements in cost position relative to competitors. Future research can attempt to identify and resolve these trade-offs in different manufacturing settings. ’
’ The comments of Robert Kaplan, two anonymous reviewers, and seminar participants at MIT, the University of Minnesota, the Wharton School, and the 1994 TIMSIORSA conference in Boston are greatly appreciated. We also thank Kannan Sethuraman for his assistance on early drafts of this paper. Financial support for the first author was provided by KPMG Peat Marwick. The work of the second author was supported by the International Motor Vehicle Program at MIT, one of the Sloan Foundation-funded projects on industrial competitiveness.
References
ABEGGLEN, J. C. AND G. STALK ( 1985), KAISHA: The Japanese Corporation, Basic Books, New York. ALSTER, N. ( 1989), “What Flexible Workers Can Do,” Fortune, 119,4, February 13,62-66. BANKER, R. D., S. DATAR, S. KEKRE, AND T. MUKHOPADHYAY ( 1989), “Costs of Product and Process Com-
plexity,” in Measures for Manufacturing Performance, R. Kaplan (ed.), Harvard Business School Press, Boston, MA, 269-290.
-, G. POTTER, AND R. G. SCHROEDER ( 1993), An Empirical Analysis of Manufacturing Overhead Cost Drivers, Working Paper, University of Minnesota, Minneapolis, MN.
BARKER, R. C. ( 1994), “Production Systems without MRP: A Lean Time Based Design,” Omega, 22,4,349- 360.
BECKER, G. ( 1964), Human Capital: A Theoretical and Empirical Analysis, National Bureau of Economic Research, Columbia University Press, New York.
BLAU, P. M., C. FALBE, W. MCKINLEY, AND P. K. TRACY ( 1976), “Technology and Organization in Manu- facturing,” Administrative Science Quarterly, 2 1, 1, 20-40.
BLAXILL, M. F. AND T. H. HOUT ( 199 1 ), “The Fallacy of the Overhead Quick Fix,” Harvard Business Review, 69,4, July-August, 93-101.
CASCIO, W. F. ( 1993), “Downsizing: What do we Know? What Have we Learned?” Academy ofManagement Executive, 7, 1, 95-104.
CHANDLER, C. AND M. WILLIAMS ( 1993), “A Slump in Car Sales Forces Nissan to Start Cutting Swollen Costs,” The Wall Street Journal, March 3, Al and A6.
COOPER, R. AND R. S. KAPLAN ( 1991), The Des@ of Cost Management Systems, Prentice-Hall, Englewood Cliffs, NJ.
CUSAMANO, M. ( 1985), The Japanese Auto Industry: Technology and Management at Toyota and Nissan, Harvard University Press, Cambridge, MA.
DEAN, J. W. AND G. L. SUSMAN ( 1989)) “Organizing for Manufacturable Design,” Harvard Business Review, 67, 1, January-February, 28-36.
DEMEYER, A., J. NAKANE, J. G. MILLER, AND K. F!ZRDOWS (1989), “Flexibility: The Next Competitive Battle,” Strategic Management Journal, 10, 2, 135-144.
DIXON, J. R., A. J. NANNI, AND T. E. VOLLMANN ( 1990), The New Performance Challenge: Measuring Operations for World-Class Competition. Business One Irwin, Homewood, IL.
DOE, P. (1992), “What’s Really Inside Japanese Annual Reports,” Electronic Business, 18, 8, May 18, 103- 107.
RSHER, M., A. JAIN, AND J. P. MACDUF!=~E ( 1995), “Strategies for Product Variety: Escaping the Variety/Cost Tradeoff, in Redesigning the Firm, E. Bowman and B. Kogut (eds.), Oxford University Press, New York.
FOSTER, G. AND M. C&PTA ( 1990)) “Manufacturing Overhead Cost Driver Analysis,” Journal of Accounting and Economics, 12, 1, 309-337.
Fox, J. ( 199 1 ), Regression Diagnostics: An Introduction, Sage University Paper Series on Quantitative Appli- cations in the Social Sciences, 07-079, Newbury Park, CA.

AUTO INDUSTRY DIFFERENCES IN MANUFACTURING OVERHEAD 333
GRINYER, P. H. AND M. YASAI-ARDEKANI (1980), “Dimensions of Organizational Structure: A Critical Rep lication,” Academy of Management Review, 23, 3,405-42 1.
HAYES, R. H. AND S. C. WHEELWRIGHT ( 1984), Restoring Our Competitive Edge: Competing Through Man- ufacturing, John Wiley, New York.
ISTVAN, R. L. ( 1992), “A New Productivity Paradigm for Competitive Advantage,” Strategic Management Journal, 13, 7, 525-537.
ITTNER, C. D. ( 1994), “An Examination of the Indirect Productivity Gains from Quality Improvement,” Production and Operations Management, 3, 3, 153-170.
KAMBAYASHI, N. ( 1994), “Organization Design Under New Technologies: Towards Humanization of Work,” Annals of the School ofBusiness Administration, Kobe University, 38, 3 l-57.
KEKRE, S. AND K. SRIVASAN ( 1990), “Broader Product Lines: A Necessity for Success?” Management Science, 36, 10, 1216-1231.
KRAFCIK, J. F. ( 1988), Comparative Analysis of Performance Indicators at World Auto Assembly Plants, Un- published M.S. thesis, Sloan School of Management, MIT, Cambridge, MA.
LAWLER, E. E., S. A. MOHRMAN, AND G. E. LEDFORD, JR. ( 1992), Employee Involvement and Total Quality Management, Jossey-Bass, San Francisco, CA.
LIEBERMAN, M., L. LAU, AND M. WILLIAMS ( 1990), “Firm-Level Productivity and Management Influence: A Comparison of U.S. and Japanese Automobile Producers,” Management Science, 36, 10, 1193- 12 15.
MACDUFFIE, J. P. ( 1995), “Human Resource Bundles and Manufacturing Performance: Organizational Logic and Flexible Production Systems in the World Auto Industry,” Industrial and Labor Relations Review, 48,2, 197-221.
- AND J. F. KRAFCIK ( 1992), “Integrating Technology and Human Resources for High Performance Manufacturing,” in Transforming Organizations, T. A. Kochan and M. Useem (eds.), Oxford University Press, New York, 209-225.
-, K. SETHURAMAN, AND M. L. RSHER ( 1996), “Product Variety and Manufacturing Performance: Evidence From the International Automotive Assembly Plant Study,” Management Science, forthcoming.
MAGAZINER, I. C. AND T. M. HOUT ( 1980), Japanese Industrial Policy. Policy Studies Institute, London, UK. MARSH, R. M. AND H. MANNARI ( 198 I ), “Technology and Size as Determinants of the Organizational Structure
of Japanese Factories,” Administrative Science Quarterly, 26, 1, March, 33-57. MILLER, J. G. AND T. E. VOLLMANN ( 1985), “The Hidden Factory,” Harvard Business Review, 63,5, September-
October, 142- 150. NEUMANN, J. L. ( 1987), “OVA: Avoid Slash-and-Burn Overhead Reduction,” Management Review, 76, 1,
January, 34-39. NIELSON, G. L. ( 1990), “Restructure for Excellence: The Secret in Downsizing,” Management Review, 79, 2,
February, 44-47. 01, W. ( 1962), “Labor as a Quasi-Fixed Factor,” Journal of Political Economy, 70, 6, 538-555. QSTROFF, F. AND D. SMITH ( 1992), “The Horizontal Organization,” The McKinsey Quarterly, 1, 148-168. PETERSON, T. ( 1992), “Can Corporate America Get Out From Under its Overhead?” Business Week, 3266,
May 16, 102. PORTER, M. E. ( 1985 ), Competitive Advantage: Creating and Sustaining Superior Performance, The Free Press,
New York. RAN, F. AND P. M. SWAMIDASS ( 1987), “Towards a Theory of Manufacturing Overhead Cost Behavior: A
Conceptual and Empirical Analysis,” Journal of Operations Management, 7, l-2, 12 I- 137. REHDER, R. R. ( 1988)) “Japanese Transplants: A New Model for Detroit,” Business Horizons, 3 1, 1, January-
February, 52-6 1. RICHARDSON, P. R. ( 1988), Cost Containment: The Ultimate Advantage, The Free Press, New York. RILEY, D. ( 1987), “Competitive Cost-Based Investment Strategies for Industrial Companies,” Manufacturing
Issues, Booz, Allen and Hamilton, New York. ROMMEL, G., R. KEMPIS, AND H. KAAS ( 1994)) “Does Quality Pay ?,” The McKinsey Quarterly, 1, 5 l-63. SCHERER, F. M. ( 1980), Industrial Market Structure and Economic Performance, 2nd ed., Rand McNally, New
York. SEMICH, J. W. ( 1989), “Designing for Quality,” Purchasing, 106, 1, January 19, 82-84. SHANK, J. K. AND V. GOVINDARAIAN ( 1994), Strategic Cost Management, The Free Press, New York. SHERIDAN, J. H. (1988), “Attacking Overhead,” Industry Week, 237,2, July 18,49-55. SHIELDS, M. D. AND S. M. YOUNG ( 1995), “Effective Long-Term Cost Reduction: A Strategic Perspective,”
in Readings in Management Accounting, S. M. Young (ed.), Prentice Hall, Englewocd Cliffs, NJ, 200- 211.
SKINNER, W. ( 1974), “The Focused Factory,” Harvard Business Review, 53, 3, 113-121. STALK, G. AND A. M. WEBBER ( 1993)) “Japan’s Dark Side of Time,” Harvard Business Review, 7 1, 4, July-
August, 93-102. STINE, R. ( 1990), “An Introduction to Bootstrapping Methods: Examples and Ideas,” Sociological Methods
and Research, 18, November 1989 /February 1990,243-9 1.

334 CHRISTOPHER D. ITTNER AND JOHN PAUL MACDUIWE
SUSMAN, G. I. ( 1990), “Work Groups: Autonomy, Technology, and Choice,” in Technology and Organizations, P. S. Goodman, L. S. Sproull, and Associates (eds.), Jossey-Bass, San Francisco, CA, 87-108.
ULRICH, K., D. SARTORIUS, S. PEARSON, AND M. JAKIELA ( 1993), “Including the Value of Time in Design- for-Manufacturing Decision Making,” Management Science, 39,4,429-447.
WARD, P. T., P. D. BERGER, AND J. G. MILLER ( 1992), “Manufacturing Process Technology and Support Staff Composition: An Empirical View of Industry Evidence,” Production and Operations Management, 1, 1, 5-21.
WHITNEY, D. ( 1988), “Manufacturing by Design,” Harvard Business Review, 66,4, July-August, 83-90. WOMACK, J. P., D. JONES, AND D. Roos ( 1990)) The Machine That Changed the World, Rawson-MacMillan,
New York. ZWERMAN, W. L. ( 1970), New Perspectives on Organizational Theory, Greenwood Press, Westport, CT.