“expert elicitation of the value per statistical life in ... · expert elicitation of the value...
TRANSCRIPT

12-290
January, 2012
“Expert Elicitation of the Value per Statistical Life in an Air
Pollution Context”
HAMMITT, JAMES K., ROMAN, HENRY A., STIEB,
DAVID M. AND WALSH, TYRA L.
Research Group: Environmental Economics and Natural Resources

Expert Elicitation of the Value per Statistical Life in an Air Pollution Context
Henry A. Roman*1, James K. Hammitt
2 , Tyra L. Walsh
1, David M. Stieb
3
1Industrial Economics, Incorporated, 2067 Massachusetts Ave, Cambridge, MA, 02140,
USA. [email protected].
2Harvard University (Center for Risk Analysis), 718 Huntington Avenue, Boston, MA,
02115, USA and Toulouse School of Economics (LERNA-INRA), 21, allée de Brienne,
31000 Toulouse, France. [email protected]
3Health Canada, Air Health Effects Research, P.L. 4903B, 269 Laurier Avenue West, Third
Floor, Ottawa, Ontario, Canada, K1A 0K9.
January 2012

Abstract
The monetized value of avoided premature mortality typically dominates the calculated
benefits of air pollution regulations; therefore, characterization of the uncertainty surrounding
these estimates is key to good policymaking. Formal expert judgment elicitation methods are
one means of characterizing this uncertainty. They have been applied to characterize
uncertainty in the mortality concentration-response function, but have yet to be used to
characterize uncertainty in the economic values placed on avoided mortality. We report the
findings of a pilot expert judgment study for Health Canada designed to elicit quantitative
probabilistic judgments of uncertainties in Value-per-Statistical-Life (VSL) estimates for use
in an air pollution context. The two-stage elicitation addressed uncertainties in both a base
case VSL for a reduction in mortality risk from traumatic accidents and in benefits transfer-
related adjustments to the base case for an air quality application (e.g., adjustments for age,
income, and health status). Results for each expert were integrated to develop example
quantitative probabilistic uncertainty distributions for VSL that could be incorporated into air
quality models.
Keywords Value per statistical life, air pollution, expert judgment, uncertainty analysis

1
1 Introduction
The monetized value of reduced mortality risk typically dominates the calculated
benefits of air pollution regulations. For example, tens of thousands of deaths are avoided
annually due to the Clean Air Act in the US, which comprise up to 90 percent of the US
Environmental Protection Agency’s (EPA’s) total estimated monetized benefits in regulatory
analyses (USEPA, 2005 and 2011). The value of avoided mortality is calculated as the
product of the estimated number of avoided premature deaths and the economic value applied
to those avoided deaths. A comprehensive characterization of uncertainty in both of these
elements is therefore critical to effective regulatory decision-making.
Two recent studies have applied formal expert elicitation (EE) to improve the
characterization of uncertainty about avoided deaths through elicitation of judgments about
the concentration-response (C-R) relationship between airborne fine particulate matter (PM)
and mortality (Industrial Economics, Inc. (IEc), 2004; Roman et al., 2008; Cooke et al.,
2007). EE is “a structured method for synthesizing existing data, models, and understanding
by eliciting subjective probability distributions from subject-matter experts” (U.S. EPA,
2010). EE has not previously been applied to characterize uncertainty about the Value per
Statistical Life (VSL), the welfare economic measure most commonly used to value avoided
mortality.
VSL is defined as an individual’s marginal rate of substitution between money and
the probability of surviving a specified time period (often the current year). It is not the value
of living compared with dying, but a measure of an individual’s willingness to forgo some
amount of consumption (or alternatively his willingness-to-pay or WTP) to slightly increase
his chance of surviving the current period. Standard economic theory implies that VSL is
increasing with income and wealth, and also increasing in the individuals’ total mortality risk
in the specified period (Drèze, 1962; Jones-Lee, 1974; Weinstein et al., 1980; Hammitt, 2000;

2
Johannson, 2001; Viscusi and Aldy, 2003). In principle, VSL may depend on characteristics
of the individual (e.g., age, health, life expectancy, family status) and characteristics of the
risk (e.g., traumatic injury, degenerative disease, latency period between exposure to a hazard
and resulting fatality), but whether these factors increase or decrease VSL is theoretically
ambiguous and empirical results are mixed (Hammitt, 2000; Hammitt and Haninger, 2010).
VSL may also depend on characteristics of the society in which an individual lives (e.g., his
need to save for retirement or unanticipated medical expenses), cultural, religious, or other
factors, raising questions about how best to transfer estimates from one society to another
(Hammitt and Robinson, 2011).
VSL is most often estimated using revealed-preference (RP) or stated-preference (SP)
methods (Hammitt, 2000; Cropper et al., 2011). The most common RP method is to estimate
how wages vary with risk of occupational fatality (controlling for other factors), on the
assumption that workers choose the job (among those available to them) that offers the
combination of wage and occupational risk they find most attractive. RP methods are limited
in that they can only be applied to situations (like occupational risk) in which the
consequences of individual choices that affect mortality risk and money available for
consumption can be observed. SP methods are based on surveys in which respondents are
asked how they would choose in hypothetical situations involving tradeoffs between fatality
risk and money. They are more flexible than RP methods, as the researcher can choose the
type of risk and the population to survey. Important limitations include the fact that the
questions are hypothetical and the respondent faces no significant consequences as a result of
his choice, and that respondents may not understand the change in mortality risk or other
features of the question.
VSL has been estimated using different approaches, on a variety of study populations,
and in a variety of risk contexts. As a result, when developing a VSL to quantify monetary

3
benefits of air pollution regulations, analysts must consider both uncertainty in estimates of
VSL and uncertainty about what adjustments should be made to reflect differences in
populations and risk context between each study and the populations at risk from air pollution
(a process known as “benefits transfer”). EPA’s Science Advisory Board has indicated that
EE “may be particularly useful in cases where it is necessary to extrapolate some distance
from available data,” (U.S. EPA, 2010). This implies that EE may be an appropriate method
to explore for characterizing VSL uncertainty. The challenge for an EE study is to try to
address and characterize both kinds of uncertainty in developing estimates of VSL suitable
for use in an air pollution policy context.
The pilot study described in this article was sponsored by Health Canada and was
intended to explore alternative methods for assessing uncertainty in the benefits of air
pollution regulations in Canada. The results are not intended to substitute for the values in
Health Canada’s current benefits assessment model. Nonetheless, they demonstrate that EE
methods can be applied to generate quantitative probabilistic representations of uncertainty in
VSL and suggests that a more refined and expansive EE study could be used to update benefit
models in the future. The results also provide perspective on the potentially substantial effect
that uncertainties in benefit transfer adjustments, particularly for age, can have on an overall
uncertainty distribution for VSL in an air pollution risk context.
2 Study Methods
This study followed standard best practices for EE studies based on the body of
literature accumulated over the past two decades. As shown in Figure 1, these include
explicit criteria for expert selection, use of a detailed written protocol, providing
comprehensive briefing materials to experts in advance of the interview, elicitation of
judgments in individual interviews, and convening experts prior to the elicitation (e.g.,

4
Cooke, 1991; Morgan et al., 1984 and 2001; Evans et al., 1994; Walker et al., 2001 and 2003;
Roman et al., 2008). The motivation behind these practices is to help experts avoid some of
the well-documented heuristics and biases that lead to poorly calibrated judgments
(Kahneman et al., 1982). These heuristics include the tendency to rely on data or studies that
come most easily to mind (availability) and the tendency to adhere too closely to published or
initial estimates and failing to make adequate adjustments for key uncertainties (anchoring
and adjustment). These and other heuristics can contribute to expert over-confidence (the
tendency to express more certainty about a quantitative estimate than is warranted).
2.1 Elicitation Protocol
An extensive written protocol was developed to: ensure that experts were answering
the same, clearly specified questions; make explicit the critical assumptions and rationale
underlying the experts’ judgments; encourage experts to think critically about potential
uncertainties; and establish a logical structure for the elicitation interview.
The protocol evolved through a series of steps beginning with a workshop in
November 2007 in Cambridge, Massachusetts that brought together experts on VSL and on
EE. The discussion included assessing whether the state of knowledge and published
literature on VSL is sufficient to support an EE study focused on VSL in the air quality
context, whether EE might be more informative than additional meta-analyses or primary
research, and how one might design a pilot-scale EE study of VSL to inform regulatory
analyses (see Supplementary Materials for a summary of this workshop). The initial protocol
drafts relied extensively on the ideas raised during the workshop for structuring the problem
as a two-stage elicitation that involved first eliciting probabilistic distributions for a base
VSL, and then eliciting probabilistic distributions for adjustments to the base VSL for factors
relevant to the air pollution context. The protocol was pre-tested with two independent

5
experts.1 The Project Team finalized the protocol in November 2008, following a Pre-
elicitation Workshop with the selected expert panel (discussed below).
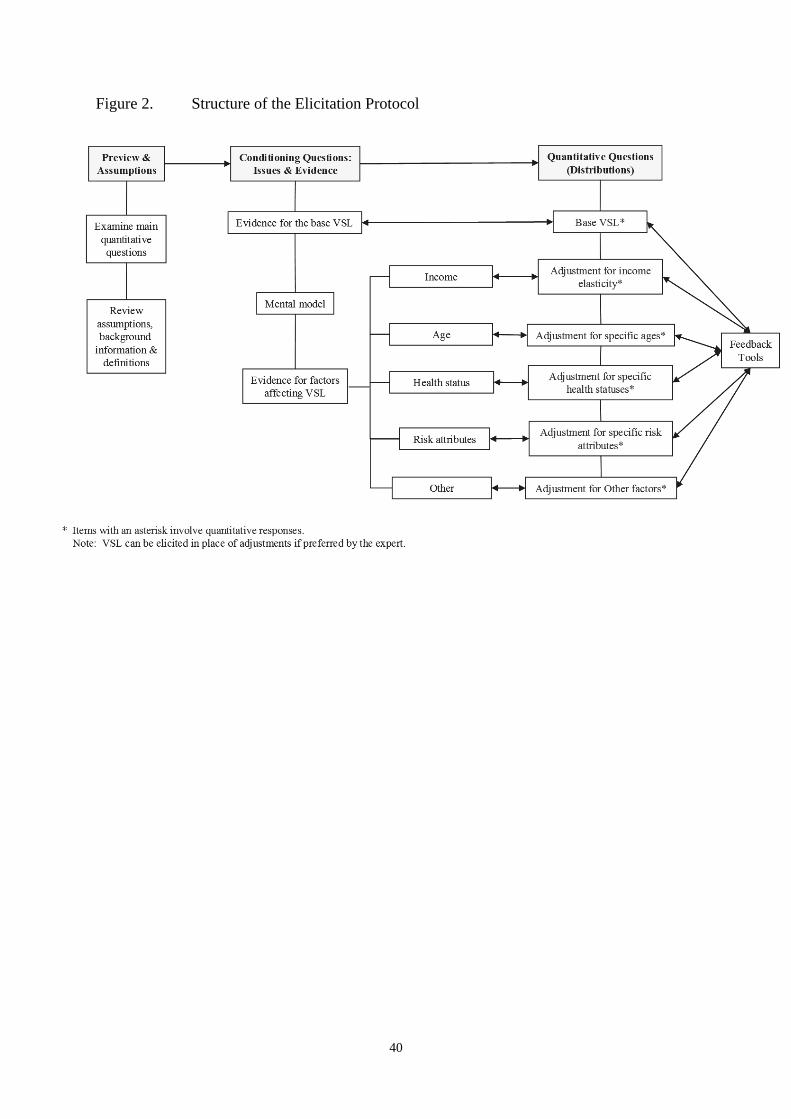
Figure 2 shows the three-part structure of the elicitation protocol. The first part
promoted careful examination and discussion of the key quantitative questions. The second
part consisted of a systematic discussion of key theoretical and empirical evidence to
consider when characterizing uncertainty in VSL and the impact of factors such as age on
VSL when conducting a benefits transfer exercise (see Figure 2 for a complete list of factors).
The final section involved eliciting key quantitative information. Experts specified a
distribution around the “Base case” VSL for a typical 40-year old Canadian, based on a
reduction in mortality risk from traumatic injury, i.e., the type of injury reflected in
occupational- and traffic-safety contexts, which are the most common context for valuation
studies. Specifically, we asked the following question:
Consider the characteristics of an average 40-year old Canadian provided in this
protocol and briefing book. Please describe, using the percentiles below, a
probability distribution that characterizes your uncertainty about the mean VSL
for a population with these characteristics, where VSL describes an individual’s
WTP to reduce his or her current annual mortality risk2 from traumatic
accidents.
1 We conducted protocol pre-tests in June of 2008 with Dr. Henrik Andersson, a Harvard postdoctoral
fellow at the time of the pre-test and currently assistant professor at the Toulouse School of Economics; and Dr.
Nathalie Simon, Associate Office Director of the U.S. EPA’s National Center for Environmental Economics in
the Office of Policy.
2 In pre-elicitation discussion, the experts concurred with the definition of VSL as a marginal rate of
substitution between money and mortality risk in a specified period.
6
Experts then specified uncertainty distributions for factors to adjust the base VSL for
each of the factors discussed in Part 3.3 For instance, we asked experts the following
question about the effect of age on VSL:
Please describe, using the percentiles below, a probability distribution that
characterizes your uncertainty about the mean VSL for a population of average
Canadians (described above) for a reduction in current annual mortality risk
from traumatic accidents, as that population ages from 25 years to 80 years old,
i.e., at ages 25, 60, 70, and 80. Please assume for each age category that the
population’s income level and health status are at the average for its age and that
other relevant characteristics in your mental model are at their mean values. It
may be useful to provide distributions for adjustment factors by which the VSL
at age 40 is modified, or to provide VSL distributions for each age, or some other
approach if you prefer.
We elicited the distributions for the base case and adjustment factors by asking
experts to report specified percentiles of their distributions (minimum (optional), 5th
, 25th
,
50th
, 75th
, 95th
, maximum (optional)). Experts were also given the option to provide fewer
percentiles (e.g., 5th
, 50th
, and 95th
), which were then fit to an expert-specified parametric
distribution in real-time using Crystal Ball (CB) software, a forecasting and risk analysis
program that utilizes Monte Carlo (MC) simulation methods. To minimize experts’ use of
the “anchoring and adjustment” heuristic (Kahneman et al., 1982), the elicitation began with
the tails of the distribution (minimum, maximum, 5th
and 95th
percentiles) before eliciting
central values. As shown in Figure 2, the protocol was iterative, revisiting the expert’s
responses to conditioning questions to ensure his or her distribution was consistent with
previous responses.
3 Experts could provide a distribution of VSLs reflecting these adjustments instead of adjustment
factors, if they preferred.

7
2.2 Expert Selection
The expert selection process was intended to create a panel of experts with
appropriate expertise to address the questions posed to them and that, as a group, represents a
reasonably balanced range of respected views on the study topic. Other objectives included
the use of an explicit and reproducible process that was cost-effective and straightforward to
execute and that minimized the level of control of the researchers selecting the experts
(Hawkins and Graham, 1990).
We selected experts using a peer-nomination process, first identifying suitable experts
to provide nominations through a literature search and publication count. The 10 authors
with the most publications on VSL were asked to provide nominations. We asked nominators
to provide 5 to 10 names that met the criteria shown in Table 1. We received eight sets of
nominations. We then ranked experts based on the number of peer nominations they
received. We began inviting experts in the order they were ranked. If an invited expert was
unwilling or unable to participate, we typically replaced the expert with the next most highly
nominated candidate; however we also gave consideration to the nominees’ expertise
studying VSL in Canada, in one case using this criterion to select an expert from the next
lower-ranked group of nominees. The final panel consisted of three experts: Joseph Aldy and
Alan Krupnick of Resources for the Future and Lauraine Chestnut of Stratus Consulting.4 To
maintain confidentiality, each expert was assigned a randomized letter between A and C to
identify his or her judgments in this paper. We compensated experts using a uniform
competitive academic consulting rate.
4 Joseph Aldy is currently Assistant Professor at the Harvard Kennedy School. Kip Viscusi was also
contacted but declined to participate.

8
2.3 Briefing Book
Each expert was sent a “briefing book” binder at least two weeks in advance of the
interview. The purpose of the briefing book was to provide experts with a baseline set of
materials to assist them in preparing for the elicitation interview; however, experts were free
to consider other materials not included in the briefing book. It included the elicitation
protocol,
a CD of relevant papers and compendia, recent Canadian and U.S. socioeconomic data on
individual and household income, household expenditures, mortality rates, life expectancy,
prevalence of chronic diseases by age, health related quality of life scores by age, population
demographics, and other relevant topics, and a document describing factors to consider when
providing probability judgments in order to avoid potential sources of bias. Examples of
briefing book materials are included in the Supplementary Information.
2.4 Pre-Elicitation Workshop
All three experts participated in a four-hour teleconference in October 2008 to
introduce the project, provide background information on expert judgment and the elicitation
process, and to discuss the key evidence available to answer the questions posed by the study.
Promoting consensus was not a goal of the workshop. A workshop summary, copies of
presentations and papers cited at the workshop were sent to the experts after the
teleconference.
2.5 Elicitation Interviews
The study team elicited the judgments of each expert individually during a personal
interview. The elicitations were conducted in November and December 2008 at each expert’s

9
office. The elicitation team consisted of two interviewers, one experienced in the elicitation
of expert judgments (Roman) and one with expertise in VSL (Hammitt).
The elicitations were conducted over the course of a single eight-hour day. Typically,
after a brief review of the introductory material, the day was split approximately evenly
between answering the conditioning and quantitative questions. Experts were asked to think
systematically about, and cite, evidence in support of their responses. The team encouraged
experts to evaluate the robustness of their judgments by considering evidence that might
support an opposing or alternative position, as well as sources of uncertainty, error, or bias
that might influence their interpretation of that evidence.
Each expert was given the opportunity to use feedback tools operated remotely by a
study team member via Internet conferencing. These tools provided real-time feedback on
the expert's responses to protocol questions. For example, the expert could visualize his or
her base case VSL distribution and array it against results from published studies or reports.
He or she could see the WTP for an expert-specified mortality risk change associated with his
or her VSL responses as an annual household payment or as a percentage of annual
household income and total annual household expenditures and compare the latter percentage
with other expenditure categories. Each expert was given the option to combine his or her
base case VSL distribution with one or more of the adjustment factor distributions using MC
sampling. A series of age-specific VSL distributions were generated, adjusted only for age,
which were plotted to show the expert his or her curve of VSL versus age. By applying the
expert’s age-specific adjustment factors with the current age distribution of the Canadian
population, the expert could see the implied distribution of VSL (for mortality risk from
traumatic injury, unless otherwise specified) across the Canadian population.

10
Following each interview, we provided the expert with a summary of his or her
qualitative and quantitative judgments for review, adjustment and/or confirmation. These
summaries are provided in the Supplementary Materials.
2.6 Evaluating Experts’ Judgments
Research has suggested that experts tend to be overconfident, and therefore poorly
calibrated (see Morgan and Henrion, 1990 for a review). Their confidence intervals tend to
be overly narrow, causing them to “miss” the true value entirely, or they may provide biased
estimates. At the same time, we do know that experts can perform well making predictions in
their areas of expertise. Walker et al. (2003) demonstrated that exposure experts asked to
predict benzene concentrations in EPA Region V were reasonably well-calibrated, and
Winkler and Poses (1993) found that physicians estimates of the probability that patients
admitted to an intensive care unit would be discharged alive were also well calibrated,
especially among physicians with regular intensive care unit experience.
Techniques do exist to objectively evaluate experts’ performance. The “gold
standard” for judging their performance in the current context would require knowledge of
the true VSL distribution for all Canadians. For studies like this one, the gold standard is
clearly beyond reach due to data gaps. Other investigators have used additional sets of
questions, for which the truth can subsequently be known, to assess the calibration of experts
(Cooke, 1991). This approach requires careful selection of a set of questions that are likely to
be valid predictors of calibration on the questions that are the focus of the assessment. The
value of such calibration approaches has been the subject of considerable debate. We chose
not to explore the development of calibration questions for this pilot study.
In the absence of these calibration measures, we have evaluated the results of this
study considering whether: 1) the judgments were statistically coherent; 2) the judgments

11
were reasonably consistent with the rationales given by the experts; and 3) the process helped
experts avoid some of the common pitfalls associated with giving subjective judgments.
2.7 Illustrative Analysis of Pilot Results
After all elicitations were complete, we conducted an illustrative two-step exercise to
explore how the results of the pilot might be used to produce probabilistic distributions of
VSL for a benefits analysis model. First, we calculated a series of age-specific VSL
distributions based on the results elicited from each expert, adjusted for an air-pollution
context according to their judgments in this study. Second, we generated example summary
distributions of the average VSL for PM air pollution-related mortality in Canada by
combining the results of the first step with an estimated distribution of avoided PM-related
mortality in Canada by age.
2.7.1 Example Age-Specific VSL Distributions for an Air Pollution Context
We generated the age-specific VSL distributions by first aggregating each expert’s
responses using MC simulations that sampled from each expert’s base case VSL and
adjustment factor distributions and multiplied the results to obtain a series of age-specific
VSLs adjusted for an air pollution context. Table 2 indicates which adjustment factors were
applied to the base case VSL for each expert, based on his or her responses in the elicitation
interview. Because we did not elicit experts’ judgments about the probabilistic dependence
among the adjustment factors and the base case VSL, there is uncertainty about the
appropriate combination of adjustment factors. To address this uncertainty, we combined
adjustment factors for each of three aggregation scenarios:

12
1. A "No Constraints" (NC) case that sampled independently from the expert’s base case
VSL distribution and from the expert's adjustment factor distributions relevant to
estimating an air pollution context VSL. This approach may artificially inflate the
resulting uncertainty and may be considered an upper bound on uncertainty
2. A "Fixed Adjustment Factors" (FAF) approach that sampled from the full elicited
base case VSL distribution, but fixed each adjustment factor at the elicited median
value. This approach likely understates uncertainty in the air pollution context VSL.
3. A "Fixed Base Case” (FBC) approach that focuses on uncertainty in the benefits
transfer adjustment factors by freezing the base case VSL at the elicited median and
sampling from all the relevant adjustment factor distributions independently and
without restriction.
We believe the first case illustrated a reasonable upper bound on the VSL uncertainty
expressed by these experts, while the latter two stylized examples allowed us to examine the
contribution of uncertainty in the base case and adjustment factors, respectively, to that upper
bound distribution.
2.7.2 Example Summary Distributions of VSL for PM-related Mortality in Canada
We next generated example summary distributions of the average VSL for air pollution
related mortality in Canada by combining the age-specific VSL distributions derived in step
one with an estimated distribution of avoided PM-related mortality in Canada by age. We
derived the latter distribution using a standard C-R function for PM-related mortality based
on the relative risk (RR) reported in Pope et al., 2002; the population of Canadian adults
stratified by age; and age-specific all-cause mortality rates in Canada. We used the C-R
function to estimate the fraction of avoided deaths in each age group associated with a

13
nominal change in PM, assuming no variation in the RR across age groups. Finally, we
estimated the distribution of VSL for air-pollution-related deaths by sampling from each of
the age-specific VSL distributions from step one using the fractions of avoided deaths by age
as sampling weights.
3 Results
The results of this study include the experts’ subjective probabilistic distributions for
uncertainty in a mean base case VSL, plus their distributions for any adjustment factors they
believed should be applied for population- and risk-based criteria that are relevant to air
pollution-related mortality risks. We discuss the base case results first.
3.1 Base case VSL
Table 3 indicates the literature each expert cited in developing his or her foundation
for the distribution of uncertainty in the mean base case VSL for a 40 year-old Canadian.
Figure 3 displays each expert’s distribution of the base case VSL. For comparison, the
contemporary low, central and high VSL used in air pollution policy analysis by Health
Canada for those under age 65 and the low, central and high VSLs recommended in a recent
review (Chestnut and DeCivita, 2008) are included.5 Two of the three experts (B and C)
provided a median base case VSL for traumatic accidents that is slightly lower than the
contemporaneous Health Canada central VSL of $6.7 million (in 2007 Canadian dollars).
However, Expert A, who relied exclusively on wage-risk literature and primarily on recent
studies, provided a central estimate base case VSL nearly twice as large as that used by
Health Canada and a 5th percentile value that is 33 percent higher.
5 These results are included to provide some context for the experts’ responses and to illustrate past and
current Health Canada thinking on this issue rather than to validate the experts’ responses. Subsequent to the
elicitation, Health Canada adopted primary VSL estimates based on Chestnut and DeCivita (2008) that do not
vary with age. See Chestnut and DeCivita (2009).

14
Expert A provided the narrowest distribution, exhibiting confidence in the results of
wage risk studies to address this question, and Expert C provided the broadest distribution,
which reflects that expert’s efforts to integrate evidence across both the RP and SP literatures.
Two experts (A and B) expressed reluctance to rely on the results of existing meta-
analyses of VSL, citing concerns about changes in the quality of the underlying data and
study designs over time among the studies included in the meta-analyses, and in the case of
the Kochi et al., 2006 study, concern over combining RP and SP study results. Expert C
argued for the importance of meta-analyses as a tool for integrating this large and complex
literature, but also acknowledged concerns with the methods applied in the recent major
meta-analyses in the U.S. (Kochi et al., 2006, Mrozek and Taylor, 2002, and Viscusi and
Aldy, 2003), and it was not ultimately clear how influential existing meta-analyses were in
Expert C’s distribution. Experts B and C both cited the importance of the 1995 Canadian
wage-risk study by Lanoie et al. (1995) for its attempt to assess each subject’s perceived on-
the-job mortality risks and compare results using perceived risks to results estimated using
measured risks. Neither ascribed much weight to this study because of sampling issues, but
both appeared to recommend further research of this kind to help better understand
uncertainty in RP results.
Finally, Expert B preferred not to use the traumatic accident base case VSL
distribution as a reference point when developing adjustment factors in the second stage of
the elicitation. Expert B instead specified that the base case distribution should first be
modified to a distribution of VSLs reflecting willingness-to-pay (WTP) to reduce disease-
related mortality risk. Expert B provided a distribution of adjustment factors to convert the
accident-related base case estimates to disease-related VSLs to which further adjustments
(e.g., for age) could then be made. Applying the factors Expert B specified would increase

15
the median VSL to approximately $8.5 million in 2007 Canadian dollars, prior to adjustment
for other factors.
3.2 Key Adjustment Factors
Overall, there was greatest agreement among the experts in their adjustment factors
for income, health status, and latency, and less agreement in the adjustment factors for age,
children, and for the effects of risk attributes associated with air-pollution mortality on VSL.
Table 3 lists the literature the experts’ relied on when developing their distributions for the
VSL adjustment factors. Figure 4 shows the experts’ distributions for an age-related VSL
adjustment, and Figure 5 shows the experts’ distributions of adjustment factors for
infants/children, income, health status, and latency.
3.2.1 Age
Figure 4 displays graphs of VSL versus age for each expert. Economic theory
provides no clear prediction concerning how VSL varies with age, though some models
suggest an inverted-U shape (Hammitt 2007, Shepard and Zeckhauser, 1982). All three
experts’ curves suggest an “inverted-U” but vary dramatically in curvature (Expert C’s graph
is nearly flat). The difference among experts seems to be related to the distinctly different
results observed in the RP and SP literature; Expert A relied more strongly on the life-cycle
theoretical basis for the shape and the results observed in wage-risk studies. Experts B and C
ascribed less weight to results examining the effect of age found in the wage-risk literature
because of the limited numbers of individuals aged 65 and older in those studies. Experts B
and C also cited a range of SP studies in Canada, the U.S., and elsewhere showing that the
finding of a decline in VSL with age is not robust. Expert C also was less convinced that life-
cycle models require an inverted-U shape.

16
Figure 5 presents experts’ distributons of an adjustment factor for mortality risks to
infants and children. All three experts thought that empirical evidence in this area is limited.
Expert B added that economic theory is not well-suited to predict VSL for children, who are
not economic agents. Available SP studies have focused on parents’ WTP to prevent non-
fatal illness in their children, not mortality risk, and RP evidence comes from consumer
market studies, such as purchasing bicycle helmets or car seats for children. Expert A felt
there was insufficient evidence on which to base a distribution. Experts B and C differed in
the weight each was willing to assign to the available RP and SP results. Expert C displayed
greater concerns about methodological issues associated with the consumer market studies
and the applicability of SP studies of WTP to avoid non-fatal illness in one’s children to WTP
for mortality risk; Expert B was more willing to allow for the possibility that VSL for a child
may be significantly higher than for an adult based on these studies, assigning only a five
percent likelihood that the VSL could be the same or smaller.
3.2.2 Income
The second set of box and whisker plots in Figure 5 shows the experts’ distributions
of the elasticity of VSL with respect to income. There is generally good agreement among
the three experts regarding the median elasticity estimate, with values ranging from 0.45 to
0.6 percent increase in VSL for each one percent increase in income. The experts differed in
the spread and skewness of their distributions, with A providing a relatively narrow and
symmetrical distribution, and B and C providing more positively skewed distributions. The
experts were confident in consistent findings across a number of studies, both individual RP
and SP studies as well as meta-analyses. Experts A and B were more comfortable relying on
meta-analysis results to inform income elasticity estimates than they had been when
developing base case VSL estimates. Differences across experts primarily related to the

17
degree to which they discounted theory and/or empirical results suggesting elasticities of one
or greater. While all experts expressed some concern over the robustness of the findings of a
greater than proportional income-VSL relationship in studies such as Costa and Kahn (2004),
they varied in their willingness to allow for the possibility that such results may be accurate,
with Expert C explicitly accounting for this possibility in the distribution.
3.2.3 Health Status
The third set of box and whisker plots in Figure 5 present the results for health status-
related VSL adjustment factors. Experts were generally in agreement that the underlying
theory regarding the effect of health status on VSL is ambiguous and empirical results are
limited. Expert A indicated that health status primarily affects VSL through its effects on
longevity, but did not provide an additional adjustment for this effect. (Expert A noted earlier
that the longevity aspect of health status was correlated with age.) Experts B and C focused
less on the longevity aspect, but all agreed the empirical evidence of an effect was limited.
All of the experts provided a central estimate of no effect (implied by Expert A’s non-
response), and Experts B and C placed significant probability on little or no effect; however,
Experts B and C also allowed for the possibility of a larger positive effect, based on their
respective reviews of results of SP studies in Canada and the U.S.
3.2.4 Latency
The rightmost set of box and whisker plots in Figure 5 present the results for latency-
related VSL adjustment factors (i.e., adjustments to VSL when the mortality risk being
reduced would occur some years in the future instead of increasing your survival in the
current year). The experts took different approaches to characterizing uncertainty in the
latency adjustment to VSL. Experts A and C based a distribution for latency impacts on

18
uncertainty in the mean discount rate Canadians would apply to avoiding a future mortality
risk. Expert B’s distribution was based on consideration of latency effects on VSL reported
in literature studies that address that topic (e.g., DeShazo and Cameron, 2004 and Alberini et
al., 2006). Despite these difference in approach there was generally good agreement among
the experts on the effect of latency on VSL, particularly between Experts B and C. Expert
A’s distribution reflected a larger effect of discounting, due to a wider range of discount rates
that included a 7 percent median rate and rates as high as 17 percent.
3.2.5 Risk Attributes
When asked about the effect of risk attributes on VSL associated with air pollution
mortality, the experts exhibited differences, though this may in part reflect a possible lack of
clarity regarding the question. As with several other areas, Expert A did not feel there was
sufficient evidence to support a distribution for this adjustment and did not provide one.
Expert C believed that risk attributes would be unlikely to lower the base case VSL when
applied to air pollution risks, but felt there was at least a 50 percent chance of no impact at
all. If there was an effect, Expert C believed it to be moderately positive (i.e., a 75th
percentile adjustment factor of 1.2 and a 95th
percentile adjustment factor of 1.5, based on
empirical evidence comparing cancer (a disease with a potentially higher “dread” factor) with
either accidents or another type of disease. While one cited study (Van Houtven et al., 2008)
found a strong cancer premium compared to accidental death, others cited by Expert C as
particularly relevant to this issue found either no difference or the difference was not
statistically significant. Expert B chose to provide a distribution of VSL for the air pollution
context (not shown) that featured , higher values at the low end of the distribution compared
to B’s base case distribution (e.g., a doubling of the 5th
percentile and a 40 percent increase in
the 25th
percentile), but either a negative or no impact on the upper end of the distribution.

19
Expert B’s values tended to be more highly influenced by stated preference study results.
However, we believe that Expert B may have been responding to a different and more all-
encompassing question than the one intended, based on Expert B’s discussion of this issue
and the fact that the studies cited by Expert B in response to this question (see Table 3)
include SP studies that address the influence of other factors in addition to risk attributes.
Expert B’s distribution may, in fact, better reflect an attempt to integrate VSL adjustments
across all relevant factors to the air pollution context, not simply the impact of risk attributes.
3.3 Example EE-derived Distributions of Age- and Air Pollution-specific VSL in Canada
As described above, we conducted an illustrative exercise using the expert judgments
from the pilot study to assess how our pilot results might translate to a VSL distribution that
could be used in a regulatory air quality health benefits model. That process yielded
distibutions of VSL in Canada for a general air pollution context, and distributions for PM
mortality specifically. Figure 6 shows the distributions we derived from each expert’s
judgments for a 60-year old Canadian facing mortality risk from air pollution. Distributions
for other ages elicited were also developed (not shown). Figure 6 shows results for each of
the three uncertainty scenarios described in the methods section – an upper bound No
Constraints scenario, a scenario where the base case VSL is fixed at elicted median values,
and a scenario where the adjustment factors are fixed at elicted median values.
We also generated summary distributions of the average VSL for PM-related
mortality using the elicited distributions of each expert combined with data on the age
distribution of Canadian adults, age-specific all-cause mortality rates, and the relative risk
(RR) for PM-related mortality reported in Pope et al. (2002). The results of this analysis are
presented in Figure 7.
20
Summary VSL distributions for PM-related mortality based on experts B & C feature
medians that are between the contemporary age-weighted central estimate in Health Canada’s
Air Quality Benefits Assessment Tool (AQBAT) and the central recommendation in Chestnut
and DeCivita (2009) (i.e., the current Health Canada guidance). Expert A’s judgments
produce a median VSL that is smaller than the AQBAT central estimate.
4 Discussion
This pilot study represents a first-of-its-kind application of formal expert elicitation to
a welfare-economics measure, namely the VSL appropriate for benefits analyses of air-
pollution regulation. The pilot produced quantitative, probabilistic distributions of VSL
values that can be applied in a regulatory benefits model and yields useful insights about
using EE in future studies to evaluate uncertainty in both VSL and its relationship to key
population and risk-related factors. We group our conclusions into two general categories:
observations from evaluation of the quantitative results and observations from an evaluation
of the pilot-study process.
4.1 Observations on Results
The results of this EE pilot reflect clearly the influence of the primary economics
literature the experts used in forming their judgments. However, they also suggest that
experts did consider uncertainties in the strength of theoretical and empirical evidence and
integrated these into their distributions. The results demonstrate agreement in some areas and
distinct disagreement in others. For example, Expert A, who relied exclusively on wage-risk
literature and primarily on recent studies, provided a base case central estimate VSL nearly
twice as large as that used by Health Canada at the time and a 5th
percentile value that is 33
percent higher. Experts B’s and C’s responses to the base case question align rather closely

21
with recently recommended VSLs in the review by Chestnut and DeCivita (2008), suggesting
possible anchoring on this review or the studies that most influenced its findings. It is worth
noting that both Experts A and B expressed the view that RP studies, particularly wage-risk
studies, were most relevant to address the base case VSL question, yet their resulting
distributions are markedly different. Possible factors that could contribute to these
differences include Expert A’s assigning more weight to very recent studies from the U.S.
and the greater reliance of Expert B on Canadian wage-risk results in addition to U.S. results.
Expert C, who made the greatest effort to integrate across the RP and SP literatures, provided
the broadest distribution in the base case. Experts A and B expressed reluctance to rely on
the results of existing meta-analyses of VSL, citing concerns about changes in the quality of
the underlying data and study designs over time among the studies included in the meta-
analyses, and concern about combining RP and SP study results in the Kochi et al., 2006
meta-analysis.
Concerning adjustments to VSL for benefits transfer, we found general agreement on
adjustments for income and latency and a consensus that existing theory and empirical
research are insufficient to support adjustments of VSL for an individual’s underlying health
status. We saw more difference in elicited judgments about adjustments for age, reductions
in mortality risk to children, and the risk attributes specific to air pollution-related mortality.
Most notably, the results of our illustrative benefits transfer exercise show the striking impact
of differences across our experts in the effect of age on VSL ; Expert A's steeply sloping
inverted-U curve produces a dramatic downward shift in the age-and risk-weighted VSL
distribution for air-pollution mortality compared with that expert’s base case VSL
distribution, dropping the median value by a factor of nearly six. The effects of the flatter
age-adjustment curves for Experts B and C were correspondingly modest.

22
The study also illustrated the potential range of uncertainties in both the base case
VSL and in the benefits-transfer adjustment factors. The spread of these distributions vary
across experts and by scenario. When uncertainty in both the base case and adjustment
factors was combined, the 90 percent credible intervals ranged from $1.0 million to $8.9
million for Expert A to $0.8 million to $20 million for Expert B. When we focused only on
uncertainty in the adjustment factors, the 90 percent credible intervals ranged from $1.0
million to $8.9 million for Expert A to $2.4 million to $17 million for Expert B. The focus
on adjustment factors increased the 5th percentiles based on Experts B and C from around $1
million to around $2.5 million, illustrating that much of the uncertainty in the lower tails in
the unconstrained case comes from the experts’ expressed uncertainty in the base case VSL
for traumatic accidents.
4.2 Observations on the process
The VSL pilot study was designed to use state-of-the-art methods to produce well-
calibrated judgments, but it also highlighted some areas for refinement in future VSL EE
studies. Its strengths include expert selection, structuring of the problem, expert training
and preparedness, and the use of real-time feedback tools. The expert-selection process
produced a group with a reasonable range of perspectives and appropriate expertise, both in
general and specific to Canada. The experts exhibited differences of opinion on several
issues, including the base case VSL and the effect of age on VSL. Their discussion of these
issues and their approaches to expressing their views quantitatively provide insight into both
differences of opinion among economists and how they may be dealt with in the elicitation of
subjective judgments.
The extensive protocol development and testing process produced protocol questions
that were generally well-specified and understood by the experts and covered most of the

23
major issues the experts felt were relevant to answering the quantitative questions. The
protocol was flexible enough to allow experts to raise additional issues as well. For example,
it allowed Expert B to specify a disease-related mortality risk adjustment factor for the
accident-focused base case VSL. In addition, the experts accepted, with relatively minor
reservations, the disaggregated mental model specifying the relationship of the base case
VSL to the VSL in an air pollution context.
The experts for this pilot were well-prepared for the elicitation interviews. The
experts’ responses in the interviews showed that they understood probability concepts well.
They were able to assign probabilities to values with relative ease. The use of tools, such as
probability wheels, to illustrate probabilistic concepts was not necessary for this group of
experts. The pre-elicitation workshop teleconference proved an effective means of
conducting the motivating phase of the elicitation process; it introduced experts to the EE
process, familiarized them with the potential issues that might bias their responses, and
provided them with opportunities to practice providing judgments. It also allowed experts to
voice any concerns or questions about the elicitation protocol and key assumptions
underlying the elicitation, which facilitated their understanding and acceptance of the
problem structure described in the protocol.
Finally, the feedback tools provided experts with real-time information in the form of
distributions, graphs, and tables that allowed them to visualize their responses and place them
in real-world contexts (e.g., the annual value of risk reduction as a fraction of household
income or expenditures, VSL distribution in Canada based on the current age distribution of
adults).
A future study ought to consider potential refinements to panel size and composition,
adjustments to the problem structure, and additional efforts to minimize potential bias.
24
Future studies should include at least five experts, a reasonable minimum for
addressing questions of similar complexity (Walker, 2004). Of the 44 EE studies described
by Cooke and Goosens (2008), half included eight or fewer experts and three quarters
included 11 or fewer experts. Hora (2004) provides evidence that calibration of distributions
obtained by pooling experts judgments increases substantially as the number of experts
increases to about five, with modest additional improvement as the number increases to 10.
In addition, we recommend that the selection process ensures a balance in expertise
with RP and SP studies and the inclusion of experts who can evaluate VSL from both
perspectives, given the often divergent results and perspectives associated with these
alternative methodological approaches to estimating VSL. Alternatively, one could select a
panel of highly-regarded economists with no specific expertise in VSL, provide them with
relevant literature using both approaches, and elicit their judgments. The latter approach has
the added advantage of reducing the potential for conflicts of interest and reducing the
likelihood that experts will anchor on their own studies, though it is would require significant
additional resources for expert preparation prior to the elicitation inteview.
The experts generally accepted the overall mental model framework and the protocol
was flexible enough to accommodate their changes; nonetheless, we recommend revisiting
the problem structuring phase in a subsequent study to address two issues we encountered in
the pilot study. First, when combining the base case and adjustment factor distributions to
estimate the VSL distribution for a population with specific characteristics, the compounding
of uncertainties across multiple adjustment factors may produce distributions with greater
uncertainty than the expert intended. This can be particularly problematic when making the
simplifying assumption that the adjustments are independent. For example, if, as we suspect,
Expert B provided an integrated VSL distribution for the air pollution context in response to
the question on risk attributes, that distribution is significantly narrower than the distribution
25
of VSL for an air pollution context created by combining Expert B’s distribution for
traumatic accident-based base case VSL with distributions for multiple adjustment factors via
MC simulation.
Second, we found it challenging to specify the base case VSL question in a way that
did not introduce potential bias towards RP or SP studies. Initial attempts focused on a
neutral “all-cause” mortality risk reduction, but our first protocol tester was unable to answer
the question formed in this way. We revised the question to focus the base case on traumatic
accident-related mortality risk, which is the type of risk most aften addressed by VSL studies
and has been addressed using both RP and SP methods; however our second tester, who
placed more weight on SP studies, expressed concerns about tying the base case to this risk
context. Our ultimate approach to pose the traumatic accident risk base case VSL question
but allow the experts flexibility in their response was successful in that it enabled Expert B to
provide the disease-related adjustment.
An alternative, aggregated approach to problem structuring (i.e., asking directly about
the VSL distribution for an air pollution reduction context) is not without challenges, most
notably significant cognitive burdens on the expert to integrate uncertainties, difficulties
understanding how specific concerns factor into the end judgment, and the possibility of
inadequate adjustments for the multiple sources of uncertainty involved in VSL benefits
transfer. However, we would recommend that a subsequent study re-evaluate alternative
structuring strategies in light of the results of this work.
Regarding potential biases, most of the experts relied on literature-based estimates in
the development of their distributions, which raises the potential for anchoring and
adjustment bias. In this process, the expert begins his or her estimates with, or “anchors” on,
a particular study or set of studies, then adjusts that value to develop confidence intervals to
account for various factors that influence his or her judgment. Some expert-judgment

26
research has shown that use of this approach leads to overconfidence, and thus poor
calibration, because individuals fail to adjust confidence intervals adequately for what they
do not know (Kahneman et al., 1982). The protocol did ask the experts to begin
development of their distributions by discussing the maximum and minimum values they
believed possible, a technique that can help experts decrease the impact of anchoring and
(inadequate) adjustment. However, given the experts’ expressed confidence in particular
studies, their reliance on the data is not surprising. In addition, some of the experts appeared
to place greater weight on their own studies than on others, which is unsurprising as they are
most familiar with their own studies and may judge them to be of high quality. This raises a
general issue with EE, whether it is best to include experts who have made important
contributions to the primary research or others who can view the research base from a greater
distance.
A future study could consider requiring experts to complete the initial conditioning
questions in the elicitation protocol in advance of the face-to-face interview; this approach
would help the project team identify potential anchor points early and to allow more time in
the interview to encourage the experts to consider a broader set of evidence. This could also
help avoid the potential for over-reliance on the newest research.
Finally, motivational bias among experts is a potential concern in any expert-
judgment assessment where the political stakes for the outcome are high. The elicitation team
made reasonable attempts during each interview to probe experts' responses and obtain
reasoned justifications for their positions. However, it is not possible to rule out the potential
for motivational bias. A subsequent study could consider the use of calibration methods,
such as those used by Cooke (1991) and others as an alternative means of evaluating expert
responses and providing incentives against bias.
27
References
Adamowicz W., D.Dupont, A.J.Krupnick, and J. Zhang. 2007. Valuation of Cancer and
Microbial Disease Risk Reductions in Municipal Drinking Water: An Analysis of
Risk Context Using Multiple Valuation Methods. Resources for the Future Discussion
Paper 07-39.
Alberini A., M.Cropper, A.Krupnick, and N. Simon. 2006. Willingness to pay for mortality
risk reductions: Does latency matter? Journal of Risk and Uncertainty, 32(3),231-245.
Alberini, A., Cropper, M., Krupnick, A., Simon, N.B. 2004. Does the Value of a Statistical
Life Vary with Age and Health Status? Evidence from the U.S. and Canada. Journal
of Environmental Economics and Management 48(1): 769-792.
Aldy, J.E. and W. Kip Viscusi, 2008. Adjusting the Value of a Statistical Life for Age and
Cohort Effects. The Review of Economics and Statistics, MIT Press, vol. 90(3),
pages 573-581, 04.
Cameron, T.A., J.R. DeShazo, and E.H. Johnson. 2008. Willingness to Pay for Health Risk
Reductions: Differences by Type of Illness. Working paper presented at the
Association of Environmental and Resource Economists workshop on Health and the
Environment. June
Carlin, P.S. and R. Sandy. 1991. “Estimating the Implicit Value of a Young Child’s Life,”
Southern Economic Journal 58(1), 186–202.
Chestnut, L.G. and DeCivita, P. 2008. Economic Valuation of Mortality Risk Reduction:
Review and Recommendations for Policy Analysis. Government of Canada Policy
Research Initiative Working Paper Series 037. September.

28
Chestnut, L.G. and DeCivita, P. 2009. Economic Valuation of Mortality Risk Reduction:
Review and Recommendations for Policy and Regulatory Analysis. Government of
Canada Policy Research Initiative Research Paper PH4-51/2009E-PDF. March.
Chestnut, L.G., R.D. Rowe, and W.S. Breffle. 2004. Economic Valuation of Mortality Risk
Reduction: Stated Preference Approach in Canada. Report prepared for Paul De
Civita, Health Canada by Stratus Consulting Inc., Boulder, CO, December.
Chestnut, L.G., R.D. Rowe, J.K. Lazo, and W.S. Breffle. 2003. Economic Valuation of
Mortality Risk Reduction: Stated Preference Approach. Report prepared for Cornell
University by Stratus Consulting Inc., Boulder CO, November.
Chilton, S.; Jones-Lee, J.; Kiraly, F.; Metcalf, H.;Pang, W. 2006. Dread risks. Journal of Risk
and Uncertainty. 33, 165-182.
Cooke, R.M. 1991. Experts in uncertainty: opinion and subjective probability in science.
(New York: Oxford University Press).
Cooke, R.M.; Goossens, L.H.J. 2008. TU Delft expert judgment data base. Reliability
Engineering and System Safety. 93, 657-674.
Cooke, R.M.; Wilson, A.M.; Toumisto, J.T.; Morales, O.; Tanio, M.; Evans, J.S. 2007. A
probabilistic characterization of the relationship between fine particulate matter and
mortality: elicitation of European experts. Environmental Science and Toxicology. 41,
6598-6605.
Costa, D.L. and Kahn, M. 2004. Changes in the value of life, 1940-1980. Journal of Risk and
Uncertainty 29(2): 159-180.
Cropper, M.L.; Hammitt, J.K.; Robinson, L.A. 2011. Valuing mortality-risk reductions:
progress and challenges. Annual Review of Resource Economics. 3, 313–336.

29
DeLeire, T. and C. Timmins, 2008. Roy Model Sorting and Non-Random Selection in the
Valuation of a Statistical Life. NBER Working Papers 14364, National Bureau of
Economic Research, Inc.
DeShazo, J.R., and T.A. Cameron. 2004. “Mortality and Morbidity Risk Reduction: An
Empirical Life-Cycle Model of Demand with Two Types of Age Effects.”
Unpublished paper, Department of Policy Studies, University of California at Los
Angeles.
DeShazo, J.R., Cameron, T.A. 2005. The Effect of Health Status on Willingness to Pay for
Morbidity and Mortality Risk Reductions. California Center for Population Research,
Online Working Paper Series. CCPR-050-05.
Dickie, M. and V.L. Messman. 2004. “Parental Altruism and the Value of Avoiding Acute
Illness: Are Kids Worth More than Parents?” Journal of Environmental Economics
and Management. Vol. 48, No. 3, pp. 1146-1174.
Drèze, J. 1962. L’utilité sociale d’une vie humaine. Revue Française de Recherche
Opérationelle. 6, 93-118.
Evans, J. S.; Gray, G. M.; Sielken, R. L.; Smith, A. E.; Valdez-Flores, C.; Graham, J. D.
1994. Use of probabilistic expert judgment in uncertainty analysis of carcinogenic
potency. Regul Toxicol Pharmacol. 20, 15-36.
Gayer, T., J.T. Hamilton, and W. K. Viscusi. 2002. The Market Value of Reducing Cancer
Risk: Hedonic Housing Prices with Changing Information. Southern Economic
Journal. 69:2, 266-289.
Hammitt, J. K. 2000. Valuing mortality risk: theory and practice. Environmental Science and
Technology 34, 1396-1400.
Hammitt, J.K. 2007. Valuing changes in mortality risk: lives saved vs. life years saved.
Review of Environmental Economics and Policy 1, 228-240.
30
Hammitt, J.K., J-T Liu, and J-L Liu. 2000. ”Survival is a Luxury Good: The Increasing Value
of a Statistical Life.” Prepared for the NBER Summer Institute Workshop on Public
Policy and the Environment.
Hammitt, J.K.; Haninger, K. 2010. Valuing fatal risks to children and adults: effects of
disease, latency, and risk aversion. Journal of Risk and Uncertainty. 40, 57-83.
Hammitt, J.K.; Robinson, L.A. 2011. The income elasticity of the value per statistical life:
transferring estimates between high and low income populations. Journal of Benefit-
Cost Analysis. 2(1): Article 1, DOI: 10.2202/2152-2812.
Hawkins, N. C.; Graham, J. D. 1990. Expert scientific judgment and cancer risk assessment:
a pilot study of pharmacokinetic data. Risk Anal. 8, 615-625.
Hora, S.C. 2004. Probability judgments for continuous quantities: linear combinations and
calibration. Management Science 50, 567-604.
Industrial Economics, Inc. 2004. An expert judgment assessment of the concentration-
response relationship between PM2.5 exposure and mortality; EPA: Research
Triangle Park, NC.
Jenkins, R.R., N. Owens, and L.B. Wiggins. 2001. “Valuing Reduced Risks to Children: The
Case of Bicycle Safety Helmets,” Contemporary Economic Policy 19(4), 397–408.
Johannesson, Magnus and Per-Olov Johansson. 1996. To Be or Not to Be, That is the
Question: An Empirical Study of the WTP for an Increased Life Expectancy at an
Advanced Age. Journal of Risk and Uncertainty 13: 163-174.
Johansson, P.-O. 2001. Is there a meaningful definition of the value of a statistical life?
Journal of Health Economics. 20, 131–139.
31
Johansson, P.-O. 2002. On the definition and age dependency of the value of a statistical life.
Journal of Risk and Uncertainty. 25: 251-63
Jones-Lee, M.W. 1974. The value of changes in the probability of death or injury. Journal of
Political Economy 99, 835-849.
Kahneman, D., Slovic, P.; Tversky, A. 1982. Judgment Under Uncertainty: Heuristics and
Biases. Cambridge University Press: Cambridge, UK.
Kniesner, K.J., W.K. Viscusi, C. Woock, J.P. Ziliak. 2007. Pinning Down the Value of
Statistical Life. IZA Discussion Paper No. 3107. October.
Kochi, I., Hubbell, B., Kramer, R. 2006. An Empirical Bayes Approach to Combining and
Comparing Estimates of the Value of a Statistical Life for Environmental Policy
Analysis. Environment and Resource Economics 34: 385-406.
Krupnick, A. 2007. Mortality-risk Valuation and Age: Stated Preference Evidence. Review of
Environmental Economics and Policy 1(2): 261-282.
Krupnick, A., M. Cropper, A. Alberini, N. Simon, B. O'Brien, and R.Goeree. 2002. Age,
Health and the Willingness to Pay for Mortality Risk Reductions: A Contingent
Valuation Survey of Ontario Residents. Journal of Risk and Uncertainty 24(2). 161-
175.
Lanoie, P., C. Pedro and R. Latour 1995. ‘The Value of a Statistical Life: A Comparison of
Two Approaches’, Journal of Risk and Uncertainty 10(3), 235–257.
Liu, J-T., J.K. Hammitt, J-D. Wang and J-L Liu. 2000. “Mother’s Willingness to Pay for Her
Own and Her Child’s Health: A Contingent Valuation Survey in Taiwan.” Health
Economics. Vol. 9, No. 4, pp. 319–326.

32
Magat, W.A., Viscusi, W.K., Huber, J. 1996. A Reference Lottery Metric for Valuing Health.
Management Science 42(8):1118-1130.
Meng, R. and D.A. Smith. 1999. “The Impact of Workers’ Compensation on Wage Premiums
for Job Hazards,” Applied Economics 31(9), 1101–1108.
Moore, M.J. and Viscusi, W. K. 1990. Discounting environmental health risks: New evidence
and policy implications. Journal of Environmental Economics and Management.
18(2): S51-S62
Morgan, M. G.; Morris, S. C.; Henrion, M; Amaral, D. A. L.; Rish, W. R. 1984. Technical
uncertainty in quantitative policy analysis - a sulfur air pollution example. Risk Anal.
4, 201-216.
Morgan, M. G.; Pitelka, L. F.; Shevliakova, E. 2001. Elicitation of expert judgments of
climate change impacts on forest ecosystems. Climatic Change, 49, 279-307.
Morgan, M.G., Henrion M., 1990. Uncertainty: A Guide to Dealing With Uncertainty in
Quantitative Risk and Policy Analysis. Cambridge University Press: New York, NY.
Mrozek, J.R., Taylor, L.O. 2002. What Determines the Value of Life? A Meta-Analysis.
Journal of Policy Analysis and Management 21(2): 253-270.
Pope, C. A., III; Burnett, R. T.; Thun, M. J.; Calle, E. E.; Krewski, D.; Ito, K.; Thurston, G.
D. 2002. Lung cancer, cardiopulmonary mortality, and long-term exposure to fine
particulate air pollution. J. Am. Med. Assoc. 287: 1132-1141.]
Roman, H.A.; Walker, K.D.; Walsh, T.L.; Conner, L.; Richmond, H.M.; Hubbell, B.J.;
Kinney, P.L. 2008. Expert judgment assessment of the mortality impact of changes
in ambient fine particulate matter in the U.S. Environmental Science and Technology,
42 (7): 2268-2274.

33
Shepard, D.S., and R.J. Zeckhauser. 1982. Life cycle consumption and willingness to pay for
increased survival. Pp. 95-141 in Value of Life and Safety, M.W. Jones-Lee, ed.
Amsterdam: North-Holland.
Slovic, P. (1987). Perception of risk. Science, 236: 280-285.
Smith, V. Kerry; Mary F. Evans, Huyn Kim, and Donald H. Taylor, Jr. 2004. Do the Near-
Elderly Value Mortality Risks Differently? The Review of Economics and Statistics,
86(1).
US. Environmental Protection Agency. 2011. The benefits and costs of the Clean Air Act
from 1990 to 2010; EPA: Washington, DC.
US. Environmental Protection Agency. 2005. Regulatory impact analysis for the final Clean
Air Interstate Rule; EPA: Washington, DC.
U.S. Environmental Protection Agency - Science Advisory Board (US.EPA-SAB), 2010.
"Review of EPA’s Draft Expert Elicitation Task Force White Paper." EPA-SAB-10-
003.
http://yosemite.epa.gov/sab/sabproduct.nsf/061D0E0A700B6D4F852576B20074C2E
2/$File/EPA-SAB-10-003-unsigned.pdf
Van Houtven, G., M.B. Sullivan, and C. Dockins 2008. Cancer premiums and latency effects:
A risk tradeoff approach for valuing reductions in fatal cancer risks. J Risk
Uncertainty 36:179-199.
Viscusi, W K. 2003. Racial Differences in Labor Market Values of a Statistical Life. Journal
of Risk and Uncertainty, 27(3): 239-56.
Viscusi, W.K. 2004. The Value of Life: Estimates with Risks by Occupation and Industry.
Economic Inquiry 42(1): 29-48.

34
Viscusi, W.K. and J.E. Aldy. 2007. Labor Market Estimates of the Senior Discount for the
Value of Statistical Life. Journal of Environmental Economics and Management 53,
no. 3: 377-92.
Viscusi, W.K. and J.E. Aldy. 2003. “The Value of a Statistical Life: A Critical Review of
Market Estimates Throughout the World.” Journal of Risk and Uncertainty. Vol. 27,
No. 1, pp. 5-76.
Viscusi, W.K., Evans, W.N. 1990. Utility Functions that Depend on Health Status: Estimates
and Economic Implications. American Economic Review 80: 353-374.
Walker, K.D. 2004. Memorandum to Jim Neumann, Henry Roman, and Tyra Gettleman,
Industrial Economics, Inc. Appropriate Number of Experts for the Particulate Matter
Expert Judgment Project. November 11.
Walker K. D.; Evans, J. S.; MacIntosh, D. 2001. Use of expert judgment in exposure
assessment. Part I. Characterization of personal exposure to benzene. J Expo Anal
Environ Epidemiol. 11, 308-322.
Walker, K. D.; Catalano, P.; Hammitt, J. K.; Evans, J. S. 2003. Use of expert judgment in
exposure assessment: Part 2. Calibration of expert judgments about personal
exposures to benzene. J Expo Anal Environ Epidemiol. 13, 1-16.
Weinstein, M.C.; Shepard, D.S.; Pliskin, J.S. 1980. The economic value of changing
mortality probabilities: a decision-theoretic approach. Quarterly Journal of
Economics. 94, 373-396.
Winkler, R.L.; Poses, R.M. 1993. Evaluating and combining physicians’ probabilities of
survival in an intensive care unit. Management Science. 12, 1526-1543.

35
SELECTION CRITERIA
1. Ideal experts should possess the educational background and/or
experience to both display a thorough understanding of results from the
economic literature addressing the concept of Value of a Statistical Life
(VSL), and to evaluate these results in the context of papers or other
evidence addressing uncertainties in VSL estimates as well as the
relationship of VSL to factors relevant to benefits transfer of VSL
estimates.
2. Experts may include primary economic researchers as well as
prominent individuals from advisory panels, institutions, journal editorial
boards, and other such groups who, through their educational background
and experience, are in a position to carefully interpret the key evidence
regarding VSL.
3. The overall set of experts nominated should be a balanced group
that reflects the full range of respected opinions concerning VSL and
related key benefits transfer issues.
4. We are particularly, but not exclusively, interested in VSL experts
who are based in Canada and/or have experience analyzing Canadian VSL
data for research or policy purposes.
5. The nominees should all be based in either the U.S. or Canada.
Table 1. Expert Selection Criteria

36
Table 2. Adjustment Factors Applied by Age

37
Table 3. Literature Cited by Experts When Developing Base Case VSL and Adjustment
Factor Uncertainty Distributions
STUDY
EXPERT A EXPERT B EXPERT C
BASE
CASE
ADJUSTMENT
FACTORS
BASE
CASE
ADJUSTMENT
FACTORS
BASE
CASE
ADJUSTMENT
FACTORS
Adamowicz and Krupnick, 2007 RA
Alberini et al., 2004 HS I
Alberini et al., 2006 L I, L
Aldy and Viscusi, 2008 A A
Cameron et al., 2008 HS, RA
Carlin and Sandy, 1991 I/C I/C
Chestnut et al., 2003 A, HS, RA
Chestnut et al., 2004 HS I, A, HS, RA
Chestnut and De Civita, 2008 L
Chilton et al., 2006 RA
Costa and Kahn, 2004 I I
DeLeire and Timmins, 2008
DeShazo and Cameron, 2004 A, HS
DeShazo and Cameron, 2005 RA HS
Dickie and Messmann, 2004 I/C
Gayer et al., 2002 RA
Hammitt et al., 2000 I
Jenkins et al., 2001 I/C I/C I/C
Johannesson and Johansson, 1996
L
Johansson, 2002 A
Knieser et al., 2007
Kochi et al., 2006
Krupnick et al., 2002 I, A, HS
Krupnick, 2007 A A
Lanoie et al., 1995 1
1
Liu et al., 2000 I/C I/C
Magat et al., 1996 RA
Meng and Smith, 1999
Moore and Viscusi, 1990 L
Mrozek and Taylor, 2002
Shepard and Zeckhauser, 1982 A
Slovic, 1987 RA
Smith et al., 2004 A A
Van Houtven et al., 2008 RA
Viscusi and Aldy, 2003 I, A, L I I
Viscusi and Aldy, 2007 A

38
STUDY
EXPERT A EXPERT B EXPERT C
BASE
CASE
ADJUSTMENT
FACTORS
BASE
CASE
ADJUSTMENT
FACTORS
BASE
CASE
ADJUSTMENT
FACTORS
Viscusi, 2004
Viscusi and Evans, 1990 HS
Viscusi, 2003 O2
Notes:
1. B & C ascribed little weight to Lanoie due to sampling issues.
2. Explores VSL and Race.
Key:
I: Effect of income on VSL
A: Effect of age on VSL
I/C: Relating VSL for infants and children
HS: Effect of health status on VSL
O: VSL and other factors
RA: Effect of risk attributes on VSL
L: latency/discounting VSL

39
Figure 1. Overview of the Expert Elicitation Process
Protocol Pre-testing
Pre-Elicitation Workshop
Briefing Book Development
Protocol Development
Expert Selection
Expert Judgments
Elicitation Interviews
40
Figure 2. Structure of the Elicitation Protocol

41
Figure 3. Distribution of Each Expert’s Base Case VSL Estimates

42
Figure 4. The Relationship between Age and VSL
The Relationship Between Age and VSL
(50th percentile with 5th and 95th percentiles marked)
0.00
5.00
10.00
15.00
20.00
25.00
20 30 40 50 60 70 80
Age in Years
VS
L (
Millio
ns, 2007 C
$)
Expert C
The Relationship Between Age and VSL
(50th percentile with 5th and 95th percentiles marked)
0.00
5.00
10.00
15.00
20.00
25.00
20 30 40 50 60 70 80
Age in Years
VS
L (
Millio
ns, 2007 C
$)
The Relationship Between Age and VSL
(50th percentile with 5th and 95th percentiles marked)
0.00
5.00
10.00
15.00
20.00
25.00
20 30 40 50 60 70 80
Age in Years
VS
L (
Millio
ns, 2007 C
$)
Expert A
Expert B
The Relationship Between Age and VSL
(50th percentile with 5th and 95th percentiles marked)
0.00
5.00
10.00
15.00
20.00
25.00
20 30 40 50 60 70 80
Age in Years
VS
L (
Millio
ns, 2007 C
$)
Expert C
The Relationship Between Age and VSL
(50th percentile with 5th and 95th percentiles marked)
0.00
5.00
10.00
15.00
20.00
25.00
20 30 40 50 60 70 80
Age in Years
VS
L (
Millio
ns, 2007 C
$)
The Relationship Between Age and VSL
(50th percentile with 5th and 95th percentiles marked)
0.00
5.00
10.00
15.00
20.00
25.00
20 30 40 50 60 70 80
Age in Years
VS
L (
Millio
ns, 2007 C
$)
Expert A
Expert B
25
20
15
10
5
0
25
20
15
10
5
0
25
20
15
10
5
0

43
Figure 5. Expert Distributions of Adjustment Factors (AFs) to VSL for Population-based
and Risk-based Criteria
Infant/Child AF is a multiplicative factor for estimating VSL for an infant/child from base case VSL for a 40-year old
adult.
Income AF is an elasticity of VSL with respect to income that can be used to scale the base case VSL for
changes in income.
Health Status AF is a multiplicative factor for scaling the base case VSL to a VSL for an individual suffering from
ischaemic heart disease, chronic obstructive pulmonary disease, or cancer.
Latency AF is a multiplicative factor for scaling the base case VSL for a mortality risk reduction that will be
realized 20 years in the future, instead of in the current year.

44
Figure 6. VSL in an Air Pollution Context for a 60-year old Canadian
Notes:
Results combine a Base VSL distribution of the mean VSL for a 40-year old Canadian with
distributions of adjustment factors (AFs) for populations and risk-based criteria associated with air
pollution health risks.
1. “No Constraints” case: Assumes uncertainties in Base VSL and AFs are independent. Samples
independently from Base VSL and AF distributions before combining.
2. “Fixed AFs” case: Adjustment Factors are fixed at their elicited mean value, and combined with a
sample drawn from the corresponding full Base VSL distribution elicited from each expert.
3. “Fixed Base” case: Base VSL is fixed at the elicited median from each expert and combined with
samples of AFs drawn from the corresponding full distributions for each AF elicited from each
expert.
0
5
10
15
20
25
30
A-No
Constraints
A-Fixed
AFs
A-Fixed
Base VSL
B-No
Constraints
B-Fixed
AFs
B-Fixed
Base VSL
C-No
Constraints
C-Fixed
AFs
C-Fixed
Base VSL
VS
L (
Millio
ns, 200
7 C
AD
)

45
Figure 7. Age- and Risk-Weighted VSL Distributions for an Air Pollution Context
Notes:
Results combine a Base VSL distribution of the mean VSL for a 40-year old Canadian with
distributions of adjustment factors (AFs) for populations and risk-based criteria associated with air
pollution health risks.
1. “No Constraints” case: Assumes uncertainties in Base VSL and AFs are independent. Samples
independently from Base VSL and AF distributions before combining.
2. “Fixed AFs” case: Adjustment Factors are fixed at their elicited mean value, and combined with a
sample drawn from the corresponding full Base VSL distribution elicited from each expert.
3. “Fixed Base” case: Base VSL is fixed at the elicited median from each expert and combined with
samples of AFs drawn from the corresponding full distributions for each AF elicited from each
expert.