experimental test stand for development of an opposed ... · experimental test stand for...
TRANSCRIPT
Article citation info:
KALKE, J., OPALIŃSKI, M., MAZURO, P. Combustion and heat release analysis in an opposed-piston engine. Combustion Engines.
2017, 169(2), 76-82. DOI: 10.19206/CE-2017-213
76 COMBUSTION ENGINES, 2017, 169(2)
Jakub KALKE CE-2017-213
Marcin OPALIŃSKI
Paweł MAZURO
Experimental test stand for development of an opposed-piston engine and initial
results
The article presents the reason for developing a 0D predictive and diagnostic model for opposed-piston (OP) engines. Firstly, a
description of OP engines, together with their most important advantages and challenges are given together with current research work.
Secondly, a PAMAR-4 engine characteristic is presented. After that the proposed 0D predictive model is described and compared with
the commercially availible software. Test stand with most important sensors and solutions are presented. After that the custom Engine
Control Unit software is characterized together with a 0D diagnostic model. Next part discusses specific challenges that still have to be
solved. After that the preliminary test bed results are presented and compared to the 0D simulations. Finally, the summary together with
possible future improvement of both 0D predictive model and test bed capabilities are given.
Key words: opposed-piston, combustion, heat release, 2-stroke
1. Introduction Opposed-piston engines allows achieving high thermo-
dynamic efficiency inter alia due to lack of a cylinder head
and better shape of the combustion chamber [1, 2]. During
PAMAR-4 project it turned out that there are no ready-
made tools which can be used for analyzing the 2-stroke
opposed-piston engine operation, neither in design phase
nor during measurements on the test bed. A set of support-
ive numerical tools has been developed, concerning mainly
modelling 3D scavenging and heat transfer calculations
using CFD. Unfortunately, those tools are very computa-
tionally expensive and not particularly useful for transient
operation simulations or as a part of prediction control
system which could be used for a HCCI control. It has been
assumed that a simple 0D predictive and diagnostic custom
tailored model will address the needs of improving the
efficiency of the future opposed-piston engines and allow
implementing closed-loop control basing on cylinder pres-
sure signal.
2. Opposed-piston engines
2.1. Geometry
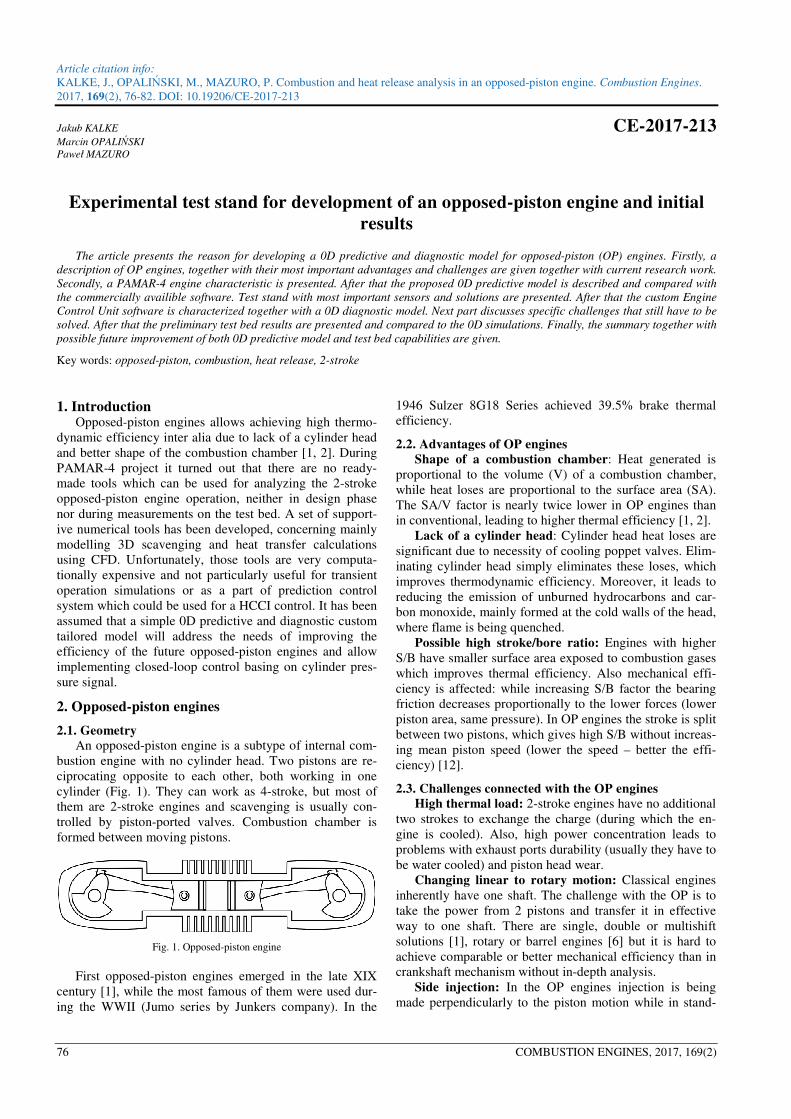
An opposed-piston engine is a subtype of internal com-
bustion engine with no cylinder head. Two pistons are re-
ciprocating opposite to each other, both working in one
cylinder (Fig. 1). They can work as 4-stroke, but most of
them are 2-stroke engines and scavenging is usually con-
trolled by piston-ported valves. Combustion chamber is
formed between moving pistons.
Fig. 1. Opposed-piston engine
First opposed-piston engines emerged in the late XIX
century [1], while the most famous of them were used dur-
ing the WWII (Jumo series by Junkers company). In the
1946 Sulzer 8G18 Series achieved 39.5% brake thermal
efficiency.
2.2. Advantages of OP engines
Shape of a combustion chamber: Heat generated is
proportional to the volume (V) of a combustion chamber,
while heat loses are proportional to the surface area (SA).
The SA/V factor is nearly twice lower in OP engines than
in conventional, leading to higher thermal efficiency [1, 2].
Lack of a cylinder head: Cylinder head heat loses are
significant due to necessity of cooling poppet valves. Elim-
inating cylinder head simply eliminates these loses, which
improves thermodynamic efficiency. Moreover, it leads to
reducing the emission of unburned hydrocarbons and car-
bon monoxide, mainly formed at the cold walls of the head,
where flame is being quenched.
Possible high stroke/bore ratio: Engines with higher
S/B have smaller surface area exposed to combustion gases
which improves thermal efficiency. Also mechanical effi-
ciency is affected: while increasing S/B factor the bearing
friction decreases proportionally to the lower forces (lower
piston area, same pressure). In OP engines the stroke is split
between two pistons, which gives high S/B without increas-
ing mean piston speed (lower the speed – better the effi-
ciency) [12].
2.3. Challenges connected with the OP engines
High thermal load: 2-stroke engines have no additional
two strokes to exchange the charge (during which the en-
gine is cooled). Also, high power concentration leads to
problems with exhaust ports durability (usually they have to
be water cooled) and piston head wear.
Changing linear to rotary motion: Classical engines
inherently have one shaft. The challenge with the OP is to
take the power from 2 pistons and transfer it in effective
way to one shaft. There are single, double or multishift
solutions [1], rotary or barrel engines [6] but it is hard to
achieve comparable or better mechanical efficiency than in
crankshaft mechanism without in-depth analysis.
Side injection: In the OP engines injection is being
made perpendicularly to the piston motion while in stand-
Experimental test stand for development of an opposed-piston engine and initial results
COMBUSTION ENGINES, 2017, 169(2) 77
ard engines injection is parallel and central. Classical injec-
tors have problem with even fuel distribution in a combus-
tion chamber of the OP engines which can lead to an ineffi-
cient combustion. Moreover, there is a risk of cylinder liner
or piston rings fuel impingement – that makes charge non-
uniform and generates local high thermal loads. Fuel im-
pingement can also destroy lubrication film, leading to
increased emission, oil consumption and faster piston-
cylinder wear.
2.4. Current research work in the world
Kharkiv Morozov Machine Building Design Bureau
designed and introduced a 2-stroke, 6-cylinder, liquid-
cooled multi-fuel diesel engine 6TD-2 with horizontal
placement of cylinders and opposed pistons with 882 kW,
being able to use diesel, jet engine fuel, petrol or any mix-
tures of them. This engine is used in T-84 main battle tank
since 1990.
Achates Power is an American company founded in
2004, developing a 2-stroke, 3 cylinder, OP compression
ignition engine (4,9 L, 205 kW power). In 2016 they sur-
passed 7,000 hours of dynamometer testing. They best
brake thermal efficiency point is at the moment is 44% (191
g/kWh) and they are predicting a possibility to achieve 180
g/kWh in production level engine [3] while meeting ex-
haust emissions US2010 EPA requirements using conven-
tional after-treatment system.
EcoMotors is an American company founded in 2008
developing and commercializing an opposed-piston opposed-
cylinder (OPOC) engine. In 2011 they struck a partnership
with Generac (large manufacturer of backup power genera-
tors) and they are developing together a 240 kW power pack.
They created their second R&D center in China (main target
market) to adapt technology and engine to local reality.
Pinnacle Engines is a start-up with an idea of commer-
cializing a 4-stroke, SI, opposed-piston engine. It uses
“Cleeves” cycle [4], changing constant volume combustion
to constant pressure combustion depending on operating
condition. The production of 110 cm3 scooter engines will
be started in 2017 in Asia [5].
2.5. Applications
In authors opinion there are three main reasonable ap-
plications for OP engines utilizing adequate advantages:
– distributed power generation (high fuel efficiency, good
power-to-weight and power-to-bulk ratio),
– military (multifuel potential and high power-to-bulk
ratio),
– automotive, as a range extender for hybrids (high fuel
efficiency and good power-to-weight ratio).
The 2-stroke OP engine could be a worse solution than
normal 4-stroke for direct propulsion of a car as scavenging
process can be only optimized properly for a given load and
rotation speed.
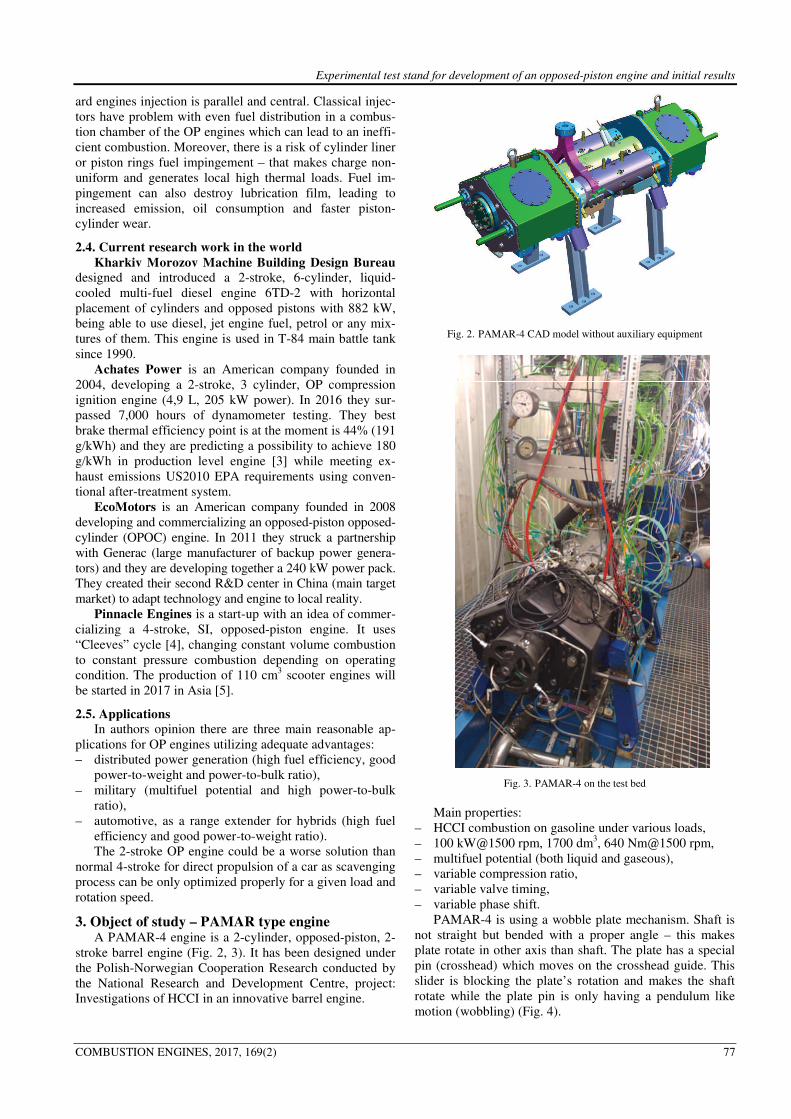
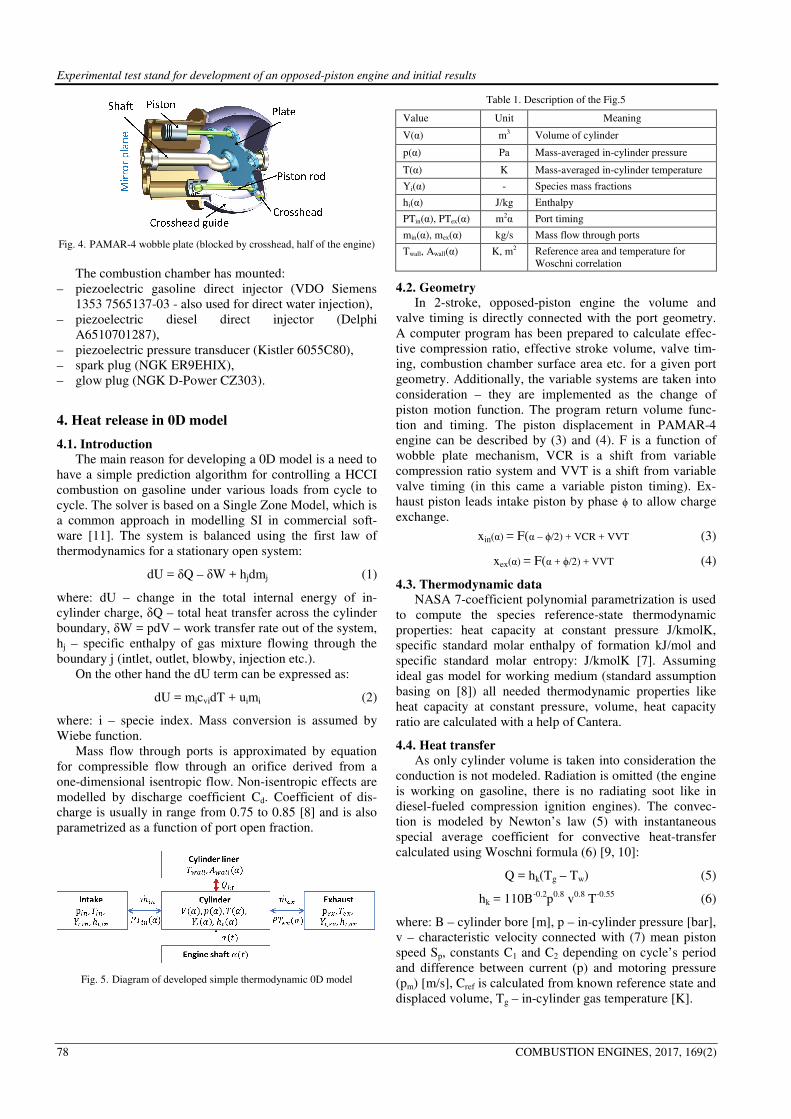
3. Object of study – PAMAR type engine A PAMAR-4 engine is a 2-cylinder, opposed-piston, 2-
stroke barrel engine (Fig. 2, 3). It has been designed under
the Polish-Norwegian Cooperation Research conducted by
the National Research and Development Centre, project:
Investigations of HCCI in an innovative barrel engine.
Fig. 2. PAMAR-4 CAD model without auxiliary equipment
Fig. 3. PAMAR-4 on the test bed
Main properties:
– HCCI combustion on gasoline under various loads,
– 100 kW@1500 rpm, 1700 dm3, 640 Nm@1500 rpm,
– multifuel potential (both liquid and gaseous),
– variable compression ratio,
– variable valve timing,
– variable phase shift.
PAMAR-4 is using a wobble plate mechanism. Shaft is
not straight but bended with a proper angle – this makes
plate rotate in other axis than shaft. The plate has a special
pin (crosshead) which moves on the crosshead guide. This
slider is blocking the plate’s rotation and makes the shaft
rotate while the plate pin is only having a pendulum like
motion (wobbling) (Fig. 4).
Experimental test stand for development of an opposed-piston engine and initial results
78 COMBUSTION ENGINES, 2017, 169(2)
Fig. 4. PAMAR-4 wobble plate (blocked by crosshead, half of the engine)
The combustion chamber has mounted:
– piezoelectric gasoline direct injector (VDO Siemens
1353 7565137-03 - also used for direct water injection),
– piezoelectric diesel direct injector (Delphi
A6510701287),
– piezoelectric pressure transducer (Kistler 6055C80),
– spark plug (NGK ER9EHIX),
– glow plug (NGK D-Power CZ303).
4. Heat release in 0D model
4.1. Introduction
The main reason for developing a 0D model is a need to
have a simple prediction algorithm for controlling a HCCI
combustion on gasoline under various loads from cycle to
cycle. The solver is based on a Single Zone Model, which is
a common approach in modelling SI in commercial soft-
ware [11]. The system is balanced using the first law of
thermodynamics for a stationary open system:
dU = δQ – δW + hjdmj (1)
where: dU – change in the total internal energy of in-
cylinder charge, δQ – total heat transfer across the cylinder
boundary, δW = pdV – work transfer rate out of the system,
hj – specific enthalpy of gas mixture flowing through the
boundary j (intlet, outlet, blowby, injection etc.).
On the other hand the dU term can be expressed as:
dU = micvidT + uimi (2)
where: i – specie index. Mass conversion is assumed by
Wiebe function.
Mass flow through ports is approximated by equation
for compressible flow through an orifice derived from a
one-dimensional isentropic flow. Non-isentropic effects are
modelled by discharge coefficient Cd. Coefficient of dis-
charge is usually in range from 0.75 to 0.85 [8] and is also
parametrized as a function of port open fraction.
Fig. 5. Diagram of developed simple thermodynamic 0D model
Table 1. Description of the Fig.5
Value Unit Meaning
V(α) m3 Volume of cylinder
p(α) Pa Mass-averaged in-cylinder pressure
T(α) K Mass-averaged in-cylinder temperature
Yi(α) - Species mass fractions
hi(α) J/kg Enthalpy
PTin(α), PTex(α) m2α Port timing
min(α), mex(α) kg/s Mass flow through ports
Twall, Awall(α) K, m2 Reference area and temperature for
Woschni correlation
4.2. Geometry
In 2-stroke, opposed-piston engine the volume and
valve timing is directly connected with the port geometry.
A computer program has been prepared to calculate effec-
tive compression ratio, effective stroke volume, valve tim-
ing, combustion chamber surface area etc. for a given port
geometry. Additionally, the variable systems are taken into
consideration – they are implemented as the change of
piston motion function. The program return volume func-
tion and timing. The piston displacement in PAMAR-4
engine can be described by (3) and (4). F is a function of
wobble plate mechanism, VCR is a shift from variable
compression ratio system and VVT is a shift from variable
valve timing (in this came a variable piston timing). Ex-
haust piston leads intake piston by phase ϕ to allow charge
exchange.
xin(α) = F(α – ϕ/2) + VCR + VVT (3)
xex(α) = F(α + ϕ/2) + VVT (4)
4.3. Thermodynamic data
NASA 7-coefficient polynomial parametrization is used
to compute the species reference-state thermodynamic
properties: heat capacity at constant pressure J/kmolK,
specific standard molar enthalpy of formation kJ/mol and
specific standard molar entropy: J/kmolK [7]. Assuming
ideal gas model for working medium (standard assumption
basing on [8]) all needed thermodynamic properties like
heat capacity at constant pressure, volume, heat capacity
ratio are calculated with a help of Cantera.
4.4. Heat transfer
As only cylinder volume is taken into consideration the
conduction is not modeled. Radiation is omitted (the engine
is working on gasoline, there is no radiating soot like in
diesel-fueled compression ignition engines). The convec-
tion is modeled by Newton’s law (5) with instantaneous
special average coefficient for convective heat-transfer
calculated using Woschni formula (6) [9, 10]:
Q = hk(Tg – Tw) (5)
hk = 110B-0.2
p0.8
v0.8
T-0.55
(6)
where: B – cylinder bore [m], p – in-cylinder pressure [bar],
v – characteristic velocity connected with (7) mean piston
speed Sp, constants C1 and C2 depending on cycle’s period
and difference between current (p) and motoring pressure
(pm) [m/s], Cref is calculated from known reference state and
displaced volume, Tg – in-cylinder gas temperature [K].

Experimental test stand for development of an opposed-piston engine and initial results
COMBUSTION ENGINES, 2017, 169(2) 79
v = (C1Sp + CrefC2(p – pm)) (7)
In the 0D model there are four distinguished areas (Fig. 6):
– intake piston area and its reference temperature,
– exhaust piston area and its reference temperature (ex-
haust piston is hotter as intake piston is cooled by fresh
charge),
– combustion chamber area and its reference temperature,
– cylinder liner area vs angle and its reference tempera-
ture.
Fig. 6. Boundary conditions for heat-transfer calculations
4.5. Heat release
Heat release is modelled by S-shaped mass fraction
burned profile described by Wiebe function. Wiebe func-
tion (8) is widely used in engine software packages [11],
e.g. GT Power uses single Wiebe function for SI engine and
multi-Wiebe function for CI engine modelling. AVL Boost
uses single Wiebe function for combustion process and
two-zone Wiebe for NOx calculations. Ricardo Wave has a
SI Wiebe combustion model and CI Wiebe based semi-
predictive model with pilot injection.
xb = 1 – exp(–a((θ – θ0)/Δθ)m+1
) (8)
where: xb – mass fraction burned, θ – current crank angle,
θ0 – start of the combustion (ignition in SI, approximately
injection in CI), Δθ – combustion duration, a, m – adjusta-
ble parameters.
4.6. Calculation solver
Calculation algorithm:
1. If ports are open calculate mass change through the
boundaries (intake/exhaust).
2. Recalculate gas composition Yi change due to mass
flow through the boundaries (using scavenging model).
3. Calculate new gas composition Yi according to Wiebe
function.
4. Update gas properties (new composition).
5. Get current volume V and calculate dV.
6. Calculate components of the equation (1): work, change in
internal energy due to combustion, mass flow through the
boundaries and change in internal energy due to heat trans-
fer through the boundaries using Woschni correlations.
7. Calculate dT and new temperature from equation (2).
8. Calculate pressure from ideal gas law.
8. Proceed to the next time step (time step is 0.1 CAD)
5. Test stand PAMAR-4 engine together with whole dyno is encapsu-
lated in a 40 feet High Cube Pallet Wide marine-type con-
tainer enabling transport.
5.1. Engine indication
Engine crank position is measured by two Heidenhein
ERN 130 3600 HTL quad incremental encoders connected
to NI 9411 module. PXI-7853R FPGA couples encoder
signal with pressure acquisition to precisely gather pressure
vs crank angle characteristic with 0.1 CAD resolution.
In cylinder pressure is measured by piezoelectric Kistler
6055C80 pressure transducer with diaphragm that allows
measurements during engine knocking. Piezoelectric sen-
sors outputs charge, in case of 6055C80 it is –20 pC/bar
(output range is from 0 to 5000 pC as measuring range is 0-
250 bar). Dewetron Charge B charge module is used to read
the charge and convert it to voltage signal (–5 V to 5 V)
which can be further analyzed. It has built-in Bessel or
Butterworth (software programmable) filter and grounds
each engine cycle to help keep data from drifting out of
digitiser range. Charge modules are stored in Dewe-800
mainframe (special model prepared for DAQP isolated
analog input amplifier modules).
Pressure signal is acquired by both Dewetron and Na-
tional Instruments system. Dewetron uses DEWE-ORION-
1616-500 A/D card (with 16 simultaneous sampled single-
ended channels at 500 kSamples/s each), controlled by
DeweSoft which is used for simple in-cylinder pressure and
heat release analysis. National Instruments system uses NI
PXI-7853R LX85 Multifunction RIO (8 analog inputs, 750
kHz, 16-bit) under control of LabView-written custom data
acquisition software, tailored for opposed-piston engines.
5.2. Torque measurement and power absorption
Torque is measured by load cell of Froude Hofmann’s
AG400 eddy current dynamometer with a capacity of 400
kW and 2000 Nm (inertia is 1.107 kg m2). Load cell is
connected to Texcel V4 Controller, measurement accuracy
is 0.25%. The speed is measured by a Hall-effect sensor
counting slopes on a toothed wheel mounted on the shaft
half coupling hub (accuracy is ± 1 rpm). Engine is coupled
to the dynamometer with an Elbe 100 Cardan shaft of 8,200
Nm capacity which has been dynamically balanced.
5.3. Fuel system
Injection system is patent pending solution (P-419918,
“Device for providing and very precise measuring of small
amounts of liquids under high pressure”) which allows
precise measurement of very low flows (even less than
0.001 LPM) under very high pressure (up to 300 bar). The
double acting piston pumps the gasoline out of the hydrau-
lic cylinder under pressure generated by the hydraulic oil.
The piston position is measured using TK LA46K magne-
tostrictive linear encoder thus volumetric flow is known
(Fig. 7). Injectors are controlled by NI 9751 Direct Injector
Fig. 7. PAMAR-4 fuel consumption measurement module
Driver Module, ignition is set by NI 9403 TTL Digital
Input/Output Module.

Experimental test stand for development of an opposed-piston engine and initial results
80 COMBUSTION ENGINES, 2017, 169(2)
5.4. Air charging
Air intake system is 2-stage boosted. 1-st stage is Gar-
rett GT1749V variable nozzle turbocharger, 2-nd stage is
Eaton TVS R410 5th generation mechanical supercharger
powered by an electrical inverter-controlled engine. Air is
water intercooled to improve charging efficiency. Pressure
is regulated by bypasses controlled by throttles.
Air mass flow is measured using Bosch air-mass meter
(0 281 002 802 – a typical automotive measurement, about
3% error) and Rosemount Annubar 3051SFA (industrial
grade flow meter, less than 1% error). Temperatures are
measured using K-type 1.5 mm thermocouples connected to
NI PXIe-4353 32-Ch Thermocouple Input (accuracy 0.3
ºC). Pressure is measured using NXP MPX4250AP (1.5%
accuracy) or NXP MPX5500DP (2.5% accuracy) accord-
ingly to the pressure range.
5.5. Exhaust system
The pressure in exhaust is measured using a fast, water
cooled Kulite EWCTV-312M-25bar A pressure transducer
(range 0-25 bar, accuracy ±0.1% FSO BFSL). The emis-
sions are measured using Bosch BEA 460: CO (0.001% vol
resolution), HC (1 ppm resolution), CO2 (0.01% vol resolu-
tion), NO/NO2 (1 ppm resolution), and O2 (0.01% vol reso-
lution). There is no catalyzer at the moment.
6. Data acquisition system
Dewesoft, supplied with Dewetron charge amplifiers,
has capabilities of measuring in-cylinder data, calculating
simple heat generation and knock detection. Unfortunately,
it’s neither possible to control the engine with it nor to
make more sophisticated thermodynamic calculations. This
forced authors to develop a custom Engine Control Unit in
LabView, which will allow both data acquisition and
closed-loop control.
6.1. Data acquisition system configuration
Data acquisition hardware is based on National Instru-
ments PXI platform with auxiliary units (Fig. 8). System
has:
Fig. 8. Block diagram of data acquisition system
– 96 thermocouple inputs, 64 of them used for measuring
the temperature of the engine parts (Fig. 9),
– 16 fast analog inputs with independent sampling rate up
to 750 kHz, 16-bit,
– 112 analog inputs,
– 22 analog outputs,
– 104 digital in/out channels,
– digital interfaces (CAN Bus, RS-485, TCP/IP, UDP),
– C Series drivers for direct and port injectors, spark
plugs, throttles and encoders.
Fig. 9. 64 thermocouples embedded in PAMAR-4 engines
6.2. Software overview
Application is split between PC, PXI and 2xFPGA (Fig.
10). A communication between PC and PXI is solved by
using Network Streams over the Ethernet. PXI and FPGA
communicates using Direct Memory Access or Front Panel
Communication depending on data. Application consists of
4 main modules:
– PX – user module, which allows results visualization
and control,
– PXI – real time computer which makes the data acquisi-
tion and automatic control by using feedback loops,
– FPGA1/FPGA2 – FPGA matrixes used for fast channel
data acquisition (in-cylinder pressure, Kulite pressure
transducers, vibrations, knock sensor, encoder) and con-
trolling C Series drivers (ignition, injection).
Texcel V4 (dynamometer controller) and Dewetron’s
amplifiers are controlled over RS-485 while Bosch BEA
gas analyzer 460 over RS-232. As engine response is not
known in advance the main role of the ECU is to protect the
prototype engine and not allow user to break it down by
accident. Every command from automatic control (PID-
based) or given by the user is being filtered by so called
Watchdog system. This system verifies if either control
given by user can be executed or system has to be put in a
safe-state (no ignition/injection allowed, engine slowed
down aggressively by the dynamometer). PID controls are
implemented on the real time computer. There is an inde-
pendent loop for every PID-controlled actuator. The PID’s
can be automatically calibrated using Ziegler-Nichols tun-
ing method (heuristic iterative method) or manually by
typing P, I and D values.
6.3. 0D diagnostic model
A Single Zone Model has been assumed for calculating
heat release from the pressure signal. Gas composition,
pressure and temperature is assumed uniform, fuel is evapo-
rated and perfectly mixed. For a diagnostic model the gas
exchange phase is not calculated, heat release calculation
starts at Inlet Valve Closing (IVC) and ends at Exhaust
Valve Opening (EVO). Net heat release rate is calculating
using standard formula (9) as in Heywood [8]:
dQchem/dθ = k/(k–1)PdV/dθ + 1/(k –1)VdP/dθ (9)
The polytropic constant k is calculated from logP–logV
where compression and expansion curves can be approxi-
Experimental test stand for development of an opposed-piston engine and initial results
COMBUSTION ENGINES, 2017, 169(2) 81
mated by linear function. The model calculates work, pow-
er, torque, IMEP, heat release and temperature.
7. Additional remarks and future challenges
7.1. TDC
It is not possible to use a Top Dead Center (TDC) sen-
sor due to combustion chamber construction. A wrongly set
TDC can lead to serious errors (Fig. 10) while calculating
volume-based quantities (dV/dθ). In PAMAR-4 engine the
volume function resulting from piston motion (3), (4) has
inherent ϕ phase, which can be changed during engine op-
eration resulting in Variable Valve Timing. By using 2
encoders, one correlated with intake piston motion and
second one with exhaust piston motion the difference be-
tween their indications allows measuring current ϕ. The
base offset and TDC position is measured with dial gauges
with hand-rotating the shaft. Dewesoft also allows TDC
detection while motoring the shaft (without combustion).
Pegging (referencing the output to absolute pressure) is
currently done by measuring the reference pressure using
additional absolute pressure sensor, but there are many
more possibilities [14].
Fig. 10. Effect of TDC offset on cumulative heat release and IMEP [13]
7.2. Scavenging and trapped mass
Currently there is no equipment available on the test
stand to measure precisely trapping and scavenging effi-
ciency. This makes trapped mass and concentration uncer-
tain and, as it is a 2-stroke, using an oxygen sensor is ques-
tionable (air used for scavenging would disturb it’s indica-
tion) and then AFR ratio is not known precisely.
8. Preliminary test bed results The PAMAR-4 has been preliminarily tested on gaso-
line with direct injection into the combustion chamber with
spark ignition. For initial tests the rotational speed has been
limited to 800 RPM and Eaton was used only to start an
with 20% power, then bypassed. Start of ignition was about
5 deg aTDC and lasted for 40 deg. Maximum pressure was
68 bar with IMEPn 19.2 bar and torque 160 Nm@770 rpm,
work per cycle was 997 J thus engine power was 28
kW@770 rpm.
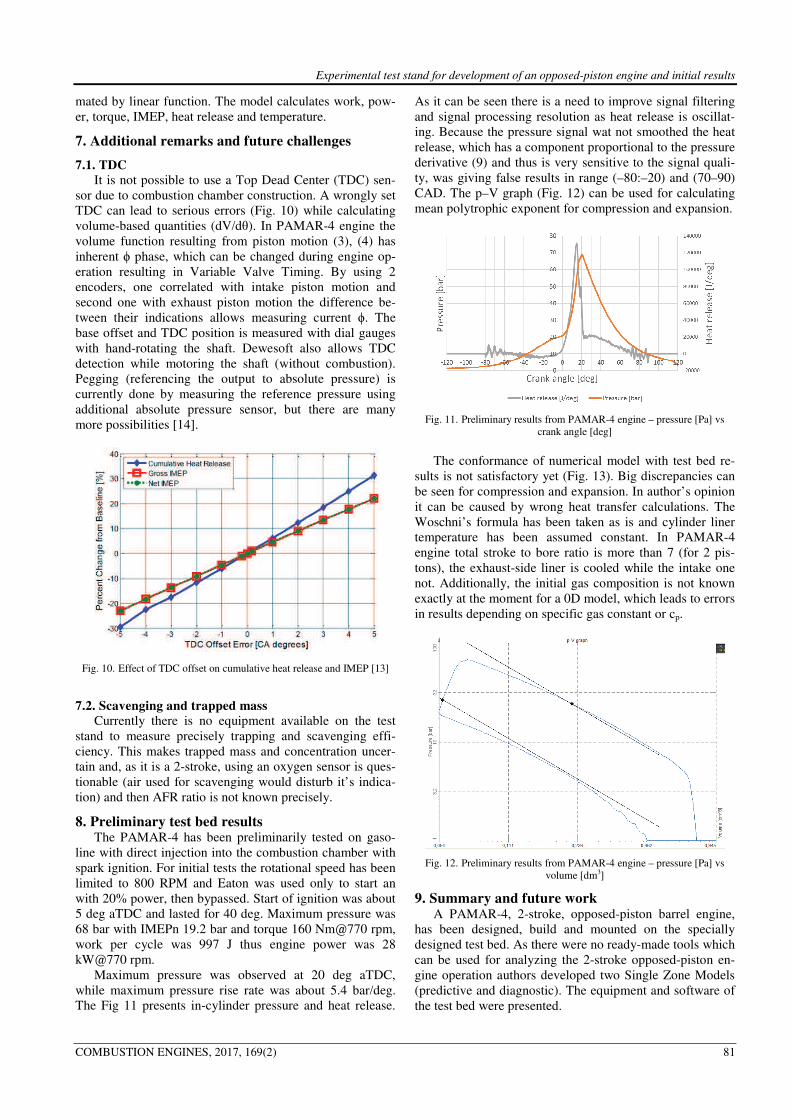
Maximum pressure was observed at 20 deg aTDC,
while maximum pressure rise rate was about 5.4 bar/deg.
The Fig 11 presents in-cylinder pressure and heat release.
As it can be seen there is a need to improve signal filtering
and signal processing resolution as heat release is oscillat-
ing. Because the pressure signal wat not smoothed the heat
release, which has a component proportional to the pressure
derivative (9) and thus is very sensitive to the signal quali-
ty, was giving false results in range (–80:–20) and (70–90)
CAD. The p–V graph (Fig. 12) can be used for calculating
mean polytrophic exponent for compression and expansion.
Fig. 11. Preliminary results from PAMAR-4 engine – pressure [Pa] vs
crank angle [deg]
The conformance of numerical model with test bed re-
sults is not satisfactory yet (Fig. 13). Big discrepancies can
be seen for compression and expansion. In author’s opinion
it can be caused by wrong heat transfer calculations. The
Woschni’s formula has been taken as is and cylinder liner
temperature has been assumed constant. In PAMAR-4
engine total stroke to bore ratio is more than 7 (for 2 pis-
tons), the exhaust-side liner is cooled while the intake one
not. Additionally, the initial gas composition is not known
exactly at the moment for a 0D model, which leads to errors
in results depending on specific gas constant or cp.
Fig. 12. Preliminary results from PAMAR-4 engine – pressure [Pa] vs
volume [dm3]
9. Summary and future work A PAMAR-4, 2-stroke, opposed-piston barrel engine,
has been designed, build and mounted on the specially
designed test bed. As there were no ready-made tools which
can be used for analyzing the 2-stroke opposed-piston en-
gine operation authors developed two Single Zone Models
(predictive and diagnostic). The equipment and software of
the test bed were presented.

Experimental test stand for development of an opposed-piston engine and initial results
82 COMBUSTION ENGINES, 2017, 169(2)
Further work will mainly cover the development of a
predictive model, which will be upgraded, calibrated and
validated with test bed results for various loads and fuels
and finally re-written from Matlab to LabView. It will be
used for implementing a closed-loop predictive control
system basing on cylinder pressure signal. Second model
(diagnostic) will be expanded by taking into account fuel
injection and blow-by loses. Engine injection and ignition
map will be optimized for efficiency.
A test bed should be extended with additional sensors
and equipment to allow gas marking to accurately deter-
mine scavenging efficiency, trapping efficiency and purity
vs delivery ratio for given rotational speed and load. It will
allow determining the in-cylinder gas composition.
The measured torque and IMEPn testify to the possibil-
ity of obtaining a high power-to-volume ratio in the future
while working under the full load. After optimizing the
injection and ignition map there will be a possibility to find
out what is the achievable efficiency.
Fig. 13 Preliminary results from PAMAR-4 engine vs 0D model
Nomenclature
OP opposed-piston
DI direct injection
SI spark ignition
TDC top dead center
FPGA field-programmable gate array
ECU engine control unit
Bibliography
[1] PIRAULT, J.P., FLINT, M. Opposed piston engines: evolu-
tion, use, and future applications. Warrendale: SAE Interna-
tional. 2009.
[2] HEROLD, R.E., WAHL, M.H., REGNER, G. et al. Ther-
modynamic benefits of opposed-piston two-stroke engines.
SAE Technical Paper. 2011, 2011-01–2216.
[3] SHARMA, A., REDON, F. Multi-cylinder opposed-piston
engine results on transient test cycle. SAE Technical Paper.
2016, 2016-01-1019.
[4] Pinnacle Engines, Inc. [Internet]. 2016. Available from:
www.pinnacle-engines.com.
[5] KANELLOS, M. New vehicle engines almost here: this time
for real [Internet]. Available from: www.forbes.com/sites/
michaelkanellos/2015/07/15/new-vehicle-engines-almost-
here-this-time-for-real.
[6] MAZURO, P., Rychter, T., Teodorczyk, A. Piston engines
with cylinder axis parallel to drive shaft axix – classification
and review. Journal of KONES Powertrain and Transport.
2007, 13(3).
[7] GUPTA, R.N., YOS, J.M., THOMPSON, R.A. A review of
reaction rates and thermodynamic and transport properties
for the 11-species air model for chemical and thermal
nonequilibrium calculations to 30000 K. Nasa Technical
Memorandum 1989; Available from: ntrs.nasa.gov/
search.jsp?R=19890011822.
[8] HEYWOOD, J.B. Internal combustion engine fundamentals.
New York, McGraw-Hill. 1988.
[9] WOSCHNI, G. A universally acceptable equation for the
instantaneous heat transfer coefficient in the internal com-
bustion engine. SAE Technical Paper. 1967, 670931.
[10] SIHLING, K., WOSCHNI, G. Experimental investigation of
the instantaneous heat transfer in the cylinder of a high
speed diesel engine. SAE Technical Paper. 1979, 790833.
[11] GHOJEL, J. Review of the development and applications of
the Wiebe function : A tribute to the contribution of Ivan
Wiebe to engine research Review of the development and
applications of the Wiebe function : a tribute to the contribu-
tion of Ivan Wiebe to engine research. International Journal
of Engine Research. 2010, 11(4).
[12] REGNER, G., JOHNSON, D., KOSZEWNIK, J. et al. Modern-
izing the opposed piston, two stroke engine for clean, efficient
transportation. SAE Technical Paper. 2013, 2013-26-0114.
[13] KAUL, B., LAWLER, B., FINNEY, C. et al. Effects of data
quality reduction on feedback metrics for advanced combus-
tion control. SAE Technical Paper. 2014, 2014-01-2707.
[14] RANDOLPH, A. Methods of processing cylinder-pressure
transducer signals to maximize data accuracy. SAE Tech-
nical Paper. 1990, 900170.
Jakub Kalke, MSc. – Faculty of Power and Aeronau-
tical Engineering at Warsaw University of Technol-
ogy.
e-mail: [email protected]
Marcin Opaliński, MSc. – Faculty of Power and
Aeronautical Engineering at Warsaw University of
Technology.
e-mail: [email protected]
Paweł Mazuro, DSc. – Faculty of Power and Aero-
nautical Engineering at Warsaw University of Tech-
nology.
e-mail: [email protected]