experimental study on triangular aperture …
TRANSCRIPT

EXPERIMENTAL STUDY ON TRIANGULAR APERTURE
GEOGRID-REINFORCED BASES OVER WEAK SUBGRADE
UNDER CYCLIC LOADING
By
Yu Qian
Submitted to the graduate degree program in Civil Engineering and the Graduate
Faculty of the University of Kansas School of Engineering in partial fulfillment of the
degree of Master of Science.
Dr. Jie Han, Chairperson
Committee members
Dr. Anil Misra
Dr. Robert L. Parsons
Date defended:

ii
The Thesis Committee for Yu Qian certifies that this is the approved
version of the following thesis:
EXPERIMENTAL STUDY ON TRIANGULAR APERTURE
GEOGRID-REINFORCED BASES OVER WEAK SUBGRADE UNDER CYCLIC
LOADING
Committee:
Dr. Jie Han, Chairperson
Dr. Anil Misra
Dr. Robert L. Parsons
Date approved:

iii
Acknowledgement
I would like express my sincerely appreciation to my advisor Dr. Jie Han for
providing me the great opportunity to work in such an interesting project. Every
progress of this work would not have been possible without his guidance, support and
encouragement. I also wish to thank Dr. Robert L. Parsons and Dr. Anil Misra for
their advice and support.
This research project was financially supported by Tensar International Corporation.
This support is greatly appreciated.
I got great cooperation from Mr. Sanat K. Pokharel, Ph.D. candidate and Mr. Milad
Jowkar, undergraduate student in the Department of Civil, Environmental, and
Architectural Engineering (CEAE) at the University of Kansas (KU) during the entire
process of this study. This project would not have come to this stage without the
great support from our laboratory supervisor Mr. Howard J. Weaver. I express my
special thanks to all of them.
I would like also thank all of my teammates in the KU Geotechnical Society who
always helped and supported me whenever I needed.
Finally, I would like to express my emotional gratitude to my parents, my wife, and
my sister for their understanding, support, and encouragement.
iv
Table of Contents
Abstract vii
List of Figures viii
List of Tables xv
1. Introduction 1
1.1 Background 1
1.2 Problem Statement 1
1.3 Objective 5
1.4 Organization 6
2. Literature Review 8
2.1 Introduction 8
2.2 Geogrid 8
2.3 Functions of Geogrid 9
2.4 Previous Experimental Studies 13
2.5 Design Methods 14
2.5.1 The Barenburg et al. Method 14
2.5.2 The Giroud and Noiray Method 16
2.5.3 The Giroud and Han Method 16
2.6 Summary 20
3. Experimental Study 22
3.1 Test Materials 22
3.1.1 Geogrid 22
3.1.2 Base material 23

v
3.1.3 Subgrade material 23
3.2 Test Equipment 28
3.3 Test Plan 37
3.4 Test Data 39
3.4.1 15 cm thick unreinforced base 39
3.4.2 15 cm thick base reinforced with T1 geogrid 43
3.4.3 15 cm thick base reinforced with T2 geogrid 46
3.4.4 15 cm thick base reinforced with T3 geogrid 48
3.4.5 23 cm thick unreinforced base 51
3.4.6 23 cm thick unreinforced base (higher CBR subgrade) 53
3.4.7 23 cm thick base reinforced with T1 geogrid 56
3.4.8 23 cm thick base reinforced with T1 geogrid (higher CBR subgrade) 58
3.4.9 23 cm thick base reinforced with T2 geogrid 61
3.4.10 23 cm thick base reinforced with T3 geogrid 63
3.4.11 30 cm thick unreinforced base 66
3.4.12 30 cm thick base reinforced with T1 geogrid 68
3.4.13 30 cm thick base reinforced with T2 geogrid 71
3.4.14 30 cm thick base reinforced with T3 geogrid 73
4. Data Analysis 76
4.1 CBR Calculations 76
4.2 Repeatability 76
4.3 Consistency of CBR Profiles 80
4.4 Displacement Analysis 82
4.4.1 Permanent displacement 82
vi
4.4.2 Resilient displacement 86
4.5 Stress Analysis 88
4.5.1 Maximum vertical stress 88
4.5.2 Stress distribution 92
4.5.3 Stress distribution angle 97
4.5.4 Modulus analysis 100
4.5.5 Effect of the properties of base course and subgrade soil on stress distribution 107
4.6 Influence of Stiffness of Base Course on Performance 110
4.7 Influence of Stiffness of Subgrade on Performance 113
5. Conclusion and Recommendation 117
5.1 Summary 117
5.2 Conclusions 118
5.3 Recommendations 119
References 120

vii
Abstract
The objective of this study is to investigate the behavior of triangular aperture
geogrid-reinforced bases over weak subgrade under cyclic loading through laboratory
testing. Behavior of unpaved structures, such as permanent displacement,
percentage of resilient displacement, stress distribution, and modulus variation were
investigated. Nineteen large-scale laboratory cyclic plate loading tests were
conducted on unpaved sections with three different base course thicknesses. Three
types of triangular aperture geogrids were selected to reinforce the bases respectively.
The results indicated that the triangular aperture geogrids effectively reduced
permanent displacement and maximum vertical stress, distributed the load wider and
more uniformly, increased the modulus of the base, and reduced the degradation rate
of the base course. Generally, the performance of the specific geogrids tested in this
study, all of which are from the same family of geogrids, improved as the level of
robustness, unit weight, rib thickness, and mechanical properties increased.
viii
List of Figures
Figure 1.1 Uniaxial geogrid (Tensar Uniaxial Geogrid) 4
Figure 1.2 Biaxial geogrid (Tensar Biaxial Geogrid) 5
Figure 1.3 Triangular aperture geogrid (Tensar Triangular Aperture Geogrid) 5
Figure 2.1 Interlock between geogrid and aggregate (Tensar Triangular Aperture Geogrid)
10
Figure 2.2 Contributions of geosynthetic reinforcement (Maxwell et al. 2005) 11
Figure 2.3 Tensioned membrane effect (Maxwell et al. 2005) 12
Figure 2.4 Rut depth versus subgrade CBR at different load cycles (White et al. 2007)
18
Figure 2.5 Rut depth versus subgrade CBR at different base thicknesses (White et al. 2007)
19
Figure 2.6 Rut depth versus subgrade CBR at different axle loads (White et al. 2007)
19
Figure 3.1 Grain size distribution curves of Kansas River sand (Han et al. 2008) and AB3 aggregate
26
Figure 3.2 Compaction curve of the AB3 26
Figure 3.3 CBR vs. moisture content of the base course 27
Figure 3.4 Compaction curve of the subgrade 27
Figure 3.5 CBR vs. moisture content of the subgrade 28
Figure 3.6 Cyclic loading wave 29
Figure 3.7 Configuration of plate load test 29
Figure 3.8 The test box and cyclic loading system 30
Figure 3.9 Compaction of soil using the vibratory compacter 31
Figure 3.10 A vane shear test 32
Figure 3.11 A dynamic cone penetration (DCP) test 33

ix
Figure 3.12 An earth pressure cell 34
Figure 3.13 A piezometer 35
Figure 3.14 Setup of the displacement gauges 36
Figure 3.15 GeoGauge 37
Figure 3.16 DCP test data for 15 cm thick unreinforced base 40
Figure 3.17 Permanent displacement of the loading plate vs. the number of cycle for 15 cm thick unreinforced base
41
Figure 3.18 Displacement of the loading plate vs. the number of cycle for 15 cm thick unreinforced base
41
Figure 3.19 Maximum vertical stress at the center and the interface between the base course and the subgrade for 15 cm thick unreinforced base
42
Figure 3.20 Surface profiles for 15 cm thick unreinforced base 43
Figure 3.21 DCP test data for the 15 cm thick T1 geogrid-reinforced base 44
Figure 3.22 Permanent displacement of the loading plate versus the number of cycle for the 15 cm thick T1 geogrid-reinforced base
44
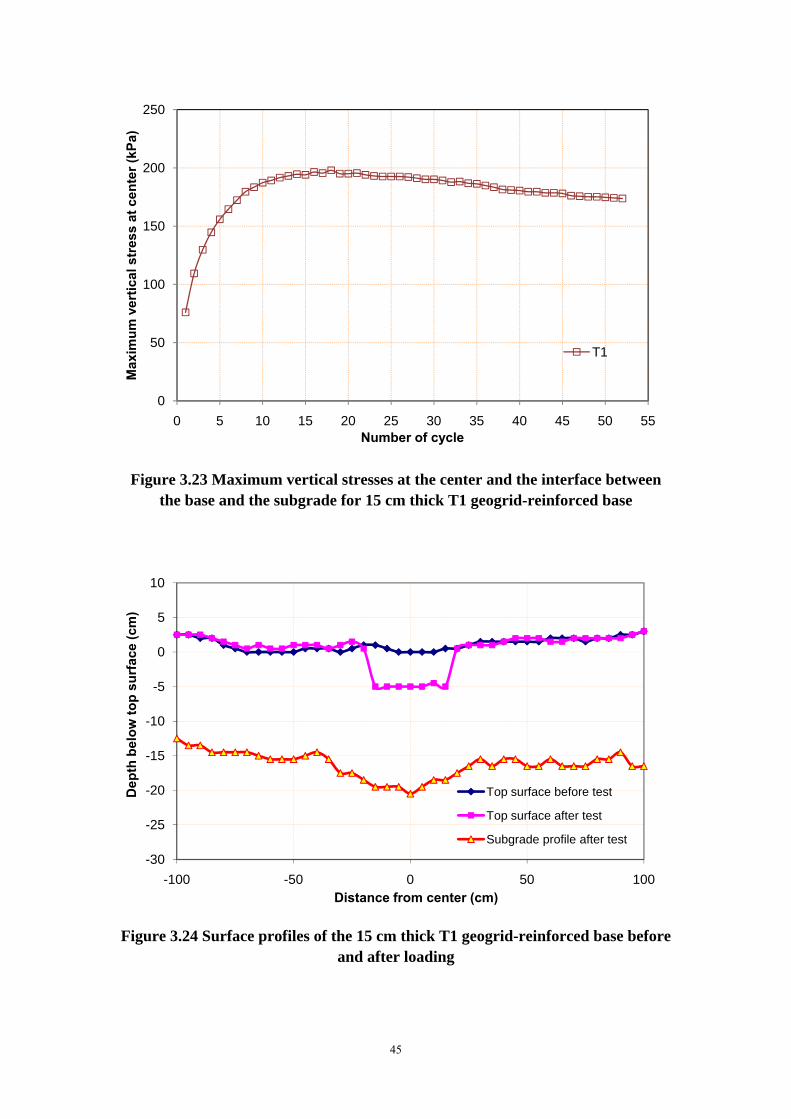
Figure 3.23 Maximum vertical stress at the center and the interface between the base and the subgrade for 15 cm thick T1 geogrid-reinforced base
45
Figure 3.24 Surface profiles of the 15 cm thick T1 geogrid-reinforced base before and after loading
45
Figure 3.25 DCP test data for 15 cm thick T2 geogrid-reinforced base 46
Figure 3.26 Permanent displacement of the loading plate versus the number of cycle for 15 cm thick T2 geogrid-reinforced base
47
Figure 3.27 Maximum vertical stress at the center and the interface between the base and the subgrade for 15 cm thick T2 geogrid-reinforced base
47
Figure 3.28 Surface profiles of 15 cm thick T2 geogrid-reinforced base 48
Figure 3.29 DCP test data for 15 cm thick T3 geogrid-reinforced base 49
Figure 3.30 Permanent displacement of the loading plate versus the number of cycle for 15 cm thick T3 geogrid-reinforced base
49
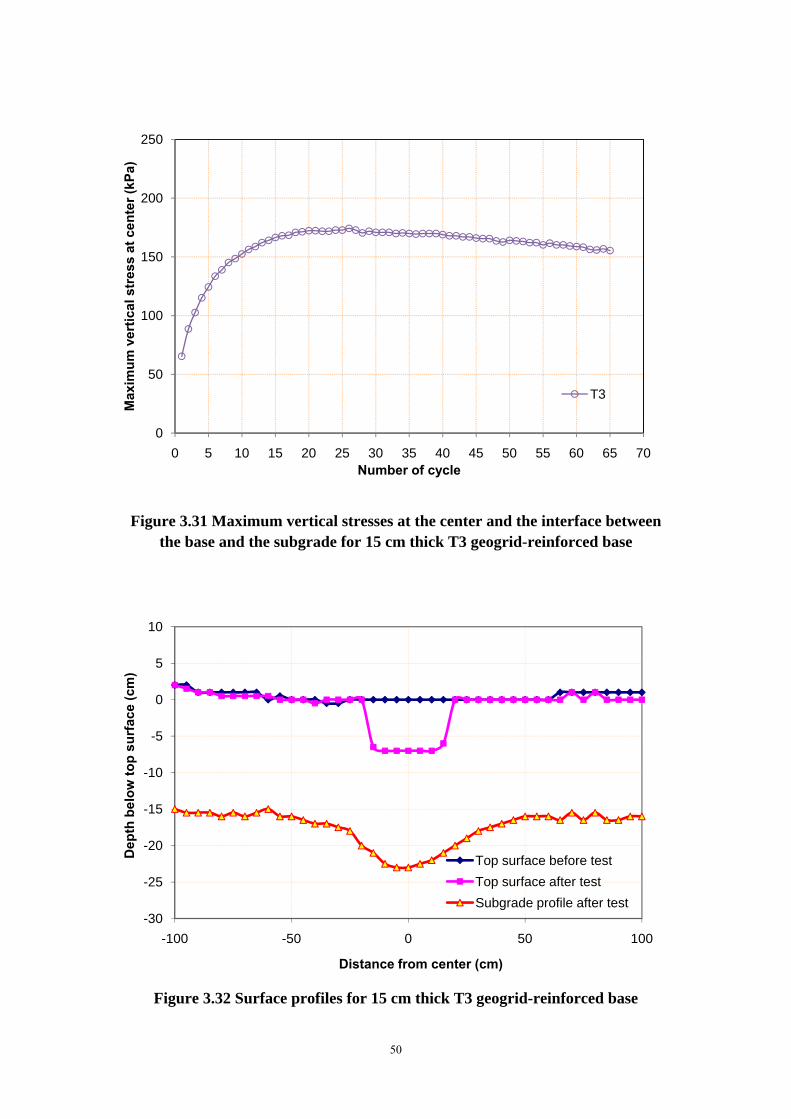
Figure 3.31 Maximum vertical stress at the center and the interface between the base and the subgrade for 15 cm thick T3 geogrid-reinforced base
50

x
Figure 3.32 Surface profiles for 15 cm thick T3 geogrid-reinforced base 50
Figure 3.33 DCP test data for 23 cm thick unreinforced base 51
Figure 3.34 Permanent displacement of the loading plate vs. the number of cycle for 23 cm thick unreinforced base
52
Figure 3.35 Maximum vertical stress at the center and the interface between the base course and the subgrade for 23 cm thick unreinforced base
52
Figure 3.36 Surface profiles for 23 cm thick unreinforced base 53
Figure 3.37 DCP test data for 23 cm thick unreinforced base course (higher CBR subgrade)
54
Figure 3.38 Permanent displacement of the loading plate vs. the number of cycle for 23 cm thick unreinforced base (higher CBR subgrade)
54
Figure 3.39 Maximum vertical stress at the center and the interface between the base and the subgrade for 23 cm thick unreinforced base (higher CBR subgrade )
55
Figure 3.40 Surface profile for 23 cm thick unreinforced base (subgrade CBR=3%)
55
Figure 3.41 DCP test data for 23 cm thick T1 geogrid-reinforced base 56
Figure 3.42 Permanent displacement of the loading plate versus the number of cycle for 23 cm thick T1 geogrid-reinforced base
57
Figure 3.43 Maximum vertical stress at the center and the interface between the base and the subgrade versus the number of cycle for 23 cm thick T1 geogrid-reinforced base
57
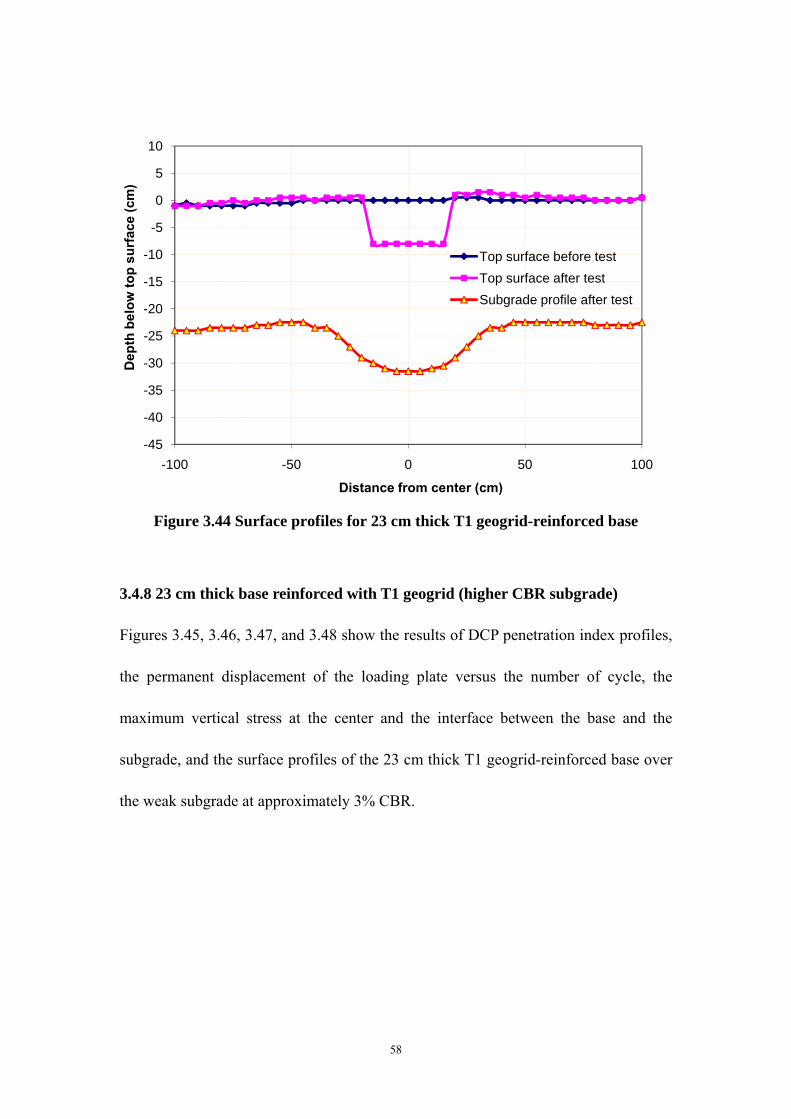
Figure 3.44 Surface profiles for 23 cm thick T1 geogrid-reinforced base 58
Figure 3.45 DCP test data for 23 cm thick T1 geogrid-reinforced base (higher CBR subgrade)
59
Figure 3.46 Permanent displacement of the loading plate versus the number of cycle for 23 cm thick T1 geogrid-reinforced base (higher CBR subgrade)
59
Figure 3.47 Maximum vertical stress at the center and the interface between the base and the subgrade versus the number of cycle for 23 cm thick T1 geogrid-reinforced base (higher CBR subgrade)
60
Figure 3.48 Surface profiles for 23 cm thick T1 geogrid-reinforced base (higher CBR subgrade)
60
Figure 3.49 DCP test data for 23 cm thick T2 geogrid-reinforced base 61
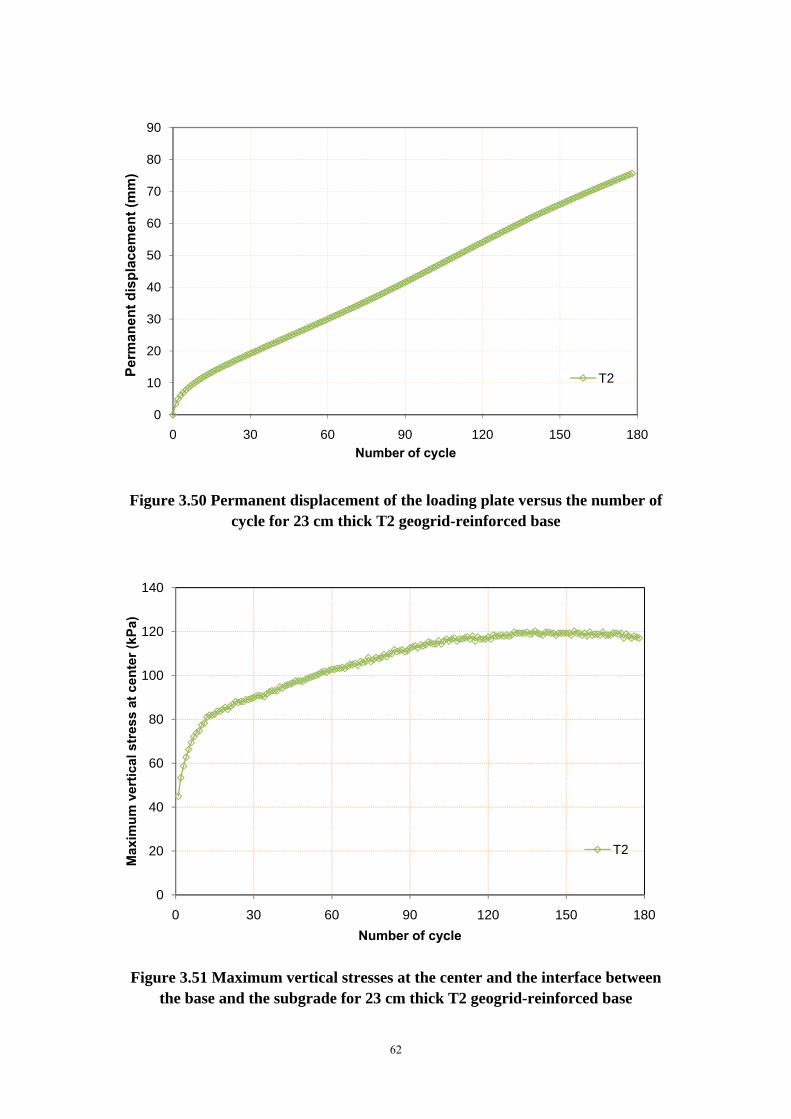
Figure 3.50 Permanent displacement of the loading plate versus the number of cycle for 23 cm thick T2 geogrid-reinforced base
62
xi
Figure 3.51 Maximum vertical stress at the center and the interface between the base and the subgrade for 23 cm thick T2 geogrid-reinforced base
62
Figure 3.52 Surface profiles for 23 cm thick T2 geogrid-reinforced base 63
Figure 3.53 DCP test data for 23 cm thick T3 geogrid-reinforced base 64
Figure 3.54 Permanent displacement of the loading plate versus the number of cycle for 23 cm thick T3 geogrid-reinforced base
64
Figure 3.55 Maximum vertical stress at the center and the interface between the base and the subgrade for 23 cm thick T3 geogrid-reinforced base
65
Figure 3.56 Surface profiles for 23 cm thick T3 geogrid-reinforced base 65
Figure 3.57 DCP test data for 30 cm thick unreinforced base 66
Figure 3.58 Permanent displacement of the loading plate vs. the number of cycle for 30 cm thick unreinforced base
67
Figure 3.59 Maximum vertical stress at the center and the interface between the base course and the subgrade for 30 cm thick unreinforced base
67
Figure 3.60 Surface profiles for 30 cm thick unreinforced base 68
Figure 3.61 DCP test data for 30 cm thick T1 geogrid-reinforced base 69
Figure 3.62 Permanent displacement of the loading plate versus the number of cycle for 30 cm thick T1 geogrid-reinforced base
69
Figure 3.63 Maximum vertical stress at the center and the interface between the base and the subgrade for 30 cm thick T1 geogrid-reinforced base
70
Figure 3.64 Surface profiles for 30 cm thick T1 geogrid-reinforced base 70
Figure 3.65 DCP test data for 30 cm thick T2 geogrid-reinforced base 71
Figure 3.66 Permanent displacement of the loading plate versus the number of cycle for 30 cm thick T2 geogrid-reinforced base
72
Figure 3.67 Maximum vertical stress at the center and the interface between the base and the subgrade for 30 cm thick T2 geogrid-reinforced base
72
Figure 3.68 Surface profile for 30 cm thick T2 geogrid-reinforced base 73

xii
Figure 3.69 DCP test data for 30 cm thick T3 geogrid-reinforced base 74
Figure 3.70 Permanent displacement of the loading plate versus the number of cycle for 30 cm thick T3 geogrid-reinforced base
74
Figure 3.71 Maximum vertical stress at the center and the interface between the base and the subgrade for 30 cm thick T3 geogrid-reinforced base
75
Figure 3.72 Surface profiles for 30 cm thick T3 geogrid-reinforced base 75
Figure 4.1 CBR profiles for 23cm thick T1 geogrid-reinforced base courses 77
Figure 4.2 Permanent displacements of the loading plate versus the number of cycles for 23cm thick T1 geogrid-reinforced base courses
77
Figure 4.3 CBR profile for T1-reinforced base course at 30 cm thickness 78
Figure 4.4 Permanent displacement of the loading plate versus the number of cycles for T2-reinforced 30 cm thick base course
79
Figure 4.5 Maximum vertical stresses at center versus the number of cycles for T2-reinforced 15 cm thick base course
79
Figure 4.6 CBR profiles for 15 cm thick base courses 81
Figure 4.7 CBR profiles for 23 cm thick base courses 81
Figure 4.8 CBR profiles for 30 cm thick base courses 82
Figure 4.9 Permanent displacement of the loading plate versus the number of cycle (base thickness = 15 cm)
83
Figure 4.10 Permanent displacement of the loading plate versus the number of cycle (base thickness = 23 cm)
84
Figure 4.11 Permanent displacement of the loading plate versus the number of cycle (base thickness = 30 cm)
84
Figure 4.12 Percentage of resilient displacement of the loading plate versus the number of cycles (base thickness = 15 cm)
87
Figure 4.13 Percentage of resilient displacement of the loading plate versus the number of cycles (base thickness = 23 cm)
87
Figure 4.14 Percentage of resilient displacement of the loading plate versus the number of cycles (base thickness = 30 cm)
88
Figure 4.15 Maximum vertical stresses at the interface between the base and the subgrade (base thickness = 15 cm)
91
Figure 4.16 Maximum vertical stresses at the interface between the base and the subgrade (base thickness = 23 cm)
91
Figure 4.17 Maximum vertical stresses at the interface between the base and the subgrade (base thickness = 30 cm)
92

xiii
Figure 4.18 Vertical stress distributions at 30th load cycle (base thickness = 15 cm)
93
Figure 4.19 Vertical stress distributions at 60th load cycle (base thickness = 23 cm)
94
Figure 4.20 Vertical stress distributions at 90th load cycle (base thickness = 30 cm)
94
Figure 4.21 Vertical stress distributions at the interface between the base course and the subgrade for 15 cm thick unreinforced base course
96
Figure 4.22 Vertical stress distributions at the interface between the base course and the subgrade for 15 cm thick T1 geogrid-reinforced base course
96
Figure 4.23 Vertical stress distributions at the interface between the base course and the subgrade for 23 cm thick T2 geogrid-reinforced base course
97
Figure 4.24 Vertical stress distributions at the interface between the base course and the subgrade for 23 cm thick T3 geogrid-reinforced base course
97
Figure 4.25 Relationship between the stress distribution angle and the number of cycles (base thickness = 15 cm)
100
Figure 4.26 Relationship between the stress distribution angle and the number of cycles (base thickness = 23 cm)
100
Figure 4.27 Relationship between the stress distribution angle and the number of cycles (base thickness = 30 cm)
101
Figure 4.28 Resilient modulus of the subgrade versus the number of cycles under cyclic loading of 4 kN
104
Figure 4.29 Resilient modulus of the subgrade versus the number of cycles under cyclic loading of 8 kN
104
Figure 4.30 Resilient modulus of the subgrade versus the number of cycles under cyclic loading of 12 kN
105
Figure 4.31 Resilient modulus of the subgrade versus the number of cycles under cyclic loading of 16 kN
105
Figure 4.32 Modulus ratio of the base course over the subgrade versus the number of cycles (base course thickness = 15 cm)
106
Figure 4.33 Modulus ratio of the base course over the subgrade versus the number of cycles (base course thickness = 23 cm)
107
Figure 4.34 Modulus ratio of the base course over the subgrade versus the number of cycles (base course thickness = 30 cm)
107
Figure 4.35 Relationship between the stress distribution angle and the modulus ratio (base course thickness = 15cm)
109
Figure 4.36 Relationship between the stress distribution angle and the modulus ratio (base course thickness = 23cm)
110
Figure 4.37 Relationship between the stress distribution angle and the modulus ratio (base course thickness = 30cm)
110

xiv
Figure 4.38 Permanent displacement of the loading plate versus the number of cycles for 15cm thick base courses with CBR=5% or 20%
111
Figure 4.39 Percentage of resilient displacement of the loading plate versus the number of cycles for 15cm thick base courses with CBR=5% or 20%
112
Figure 4.40 Maximum vertical stress at the interface between the base and the subgrade for 15cm thick base course with CBR=5% or 20%
112
Figure 4.41 CBR profiles for the 23cm thick unreinforced and T1-reinforced base courses over the subgrade of CBR = 2% or 3%
114
Figure 4.42 Permanent displacement of the loading plate versus the number of cycles for the 23cm thick base courses over the subgrade of CBR=2% or 3%
114
Figure 4.43 Percentage of resilient displacement of the loading plate versus the number of cycles for 23cm thick base courses over the subgrade of CBR=2% or 3%
115
Figure 4.44 Maximum vertical stresses at the interface between the base and the subgrade for the 23cm thick base courses over the subgrade of CBR=2% or 3%
115

xv
List of Tables
Table 3.1 Index properties of triangular aperture geogrids 25
Table 3.2 Test plan 38

1
Chapter 1 INTRODUCTION
1.1 Background
Geosynthetics have been successfully used for subgrade improvement and base
reinforcement for unpaved and paved roads in the past several decades. Due to
their successful applications, geosynthetics are available worldwide and their market
is steadily growing. The synthetic nature of the products makes them suitable for
uses in the ground where the soil condition is poor. Geosynthetics are available in a
wide range of forms and manufactured using different materials and processes. They
have been used for a wide range of applications in civil engineering including roads,
airfields, railroads, embankments, earth retaining structures, reservoirs, canals, dams,
and bank and coastal protection. Geosynthetics can be divided into nine main types:
(1) geotextile, (2) geogrid, (3) geonet, (4) geomembrane, (5) geosynthetic clay liner,
(6) geopipe, (7) geofoam, (8) geocell, and (9) geocomposite. Geosynthetics are used
to perform five major functions: (1) separation, (2) reinforcement, (3) drainage, (4)
filtration, and (5) containment.
1.2 Problem Statement
Geosynthetics have been successfully used for subgrade improvement and base
reinforcement for unpaved and paved roads in the past several decades. Research
and field data show that a properly designed and placed geosynthetic does improve
2
the performance of roads. Das et al. (1998) pointed out that the most effective
location of the geosynthetic for subgrade improvement is at the interface between the
selected granular material and the subgrade. At this location the geosynthetic
provides full or partial separation, lateral restraint of the overlying granular material,
and a tensioned membrane effect when deformed extensively. Geotextiles and
geogrids are two main types of geosynthetics used in unpaved roads. However, there
is a significant difference between geotextiles and geogrids. Nonwoven geotextiles
are mainly used for separation, filtration, and drainage; woven geotextiles are used for
separation and reinforcement; and geogrids are typically used for confinement and
reinforcement. The confinement due to the geogrid interlocking with aggregate
minimizes lateral movement of aggregate particles and increases the modulus of the
base course, which leads to a wider vertical stress distribution over the subgrade and
consequently a reduction of vertical subgrade deformation (Love 1984; Haas et al
1988). The effectiveness of interlocking between the geogrid apertures and the
aggregates in the base course depends on the relationship between the aperture size of
the geogrid and the particle size of the aggregate (Giroud and Han 2004a, b). The
reduction in the shear stress at the geogrid-subgrade interface can reduce the
deformation of the subgrade as well (Perkins 1999).
In the past, geogrids were classified as uniaxial and biaxial, as shown in Figures 1.1
and 1.2. As Dong et al. (2010) demonstrated, biaxial geogrids cannot provide
uniform tensile strengths when subjected to tension in different directions. The

3
uniaxial geogrids have tensile strength only in one direction. A new geogrid product
with triangular apertures, as shown in Figure 1.3, was developed to overcome this
limitation and to further advance the technology of mechanical reinforcement of soils.
Since the triangular aperture geogrid has a more stable grid structure, it provides
near-uniform properties in all directions as compared with uniaxial and biaxial
geogrids. Giroud (2009, Geogrid Jubilee Symposium in London) noted that the
triangular structure for a geogrid presents many probable benefits over biaxial
structures including improved interlock, improved stress transfer from soil to geogrid,
and improved distribution of stresses within the geogrid structure. Giroud also
proposed that the mechanisms of interaction between geogrids and soils are (1)
extremely complex and, (2) that highly effective geogrids, when used to reinforce
appropriately selected fill soils, likely create a new, “composite” stabilized layer of
soil and geogrid that can significantly enhance load carrying and load distribution
capabilities and improve ductility and resistance to fatigue than the original
unreinforced or unimproved layer. Due to the extreme complexities of the
mechanisms of interaction between various geogrid types and soil types, and the
likelihood of future new geogrid configurations, Giroud stated that our focus for
research, development, and practical design should shift towards developing better
understandings of the composite materials created by the combination of geogrids and
soils, and move away from studying the potential benefits of one product feature
compared to another product feature. Thus, to develop an effective understanding of
how different geogrids will perform in variations of soils, experiments must be

4
performed wherein the combined materials, or the composite itself, are tested.
The biaxial geogrid structure has been extensively researched since its introduction in
the 1980s. However, due to their relatively recent commercial availability the
performance capabilities of the family of triangular aperture geogrids for reinforced
bases have not been well tested and evaluated outside of the extensive research and
development program undertaken by the manufacturer. As a result, the experiments
performed herein serve to establish a strong initial understanding of the performance
capabilities of this new family of geogrids, and provide the necessary and appropriate
data for use in calibration with existing design methods, and/or development of new
design approaches.
Figure 1.1 Uniaxial geogrid (Tensar Uniaxial Geogrid)

5
Figure 1.2 Biaxial geogrid (Tensar Biaxial Geogrid)
Figure 1.3 Tensar Triangular Aperture Geogrid
1.3 Objective
The objective of this study was to investigate the performance of triangular aperture
geogrid-reinforced bases over weak subgrade under cyclic loading. A series of

6
laboratory tests were conducted to investigate the influence of triangular aperture
geogrids on the reduction in the permanent deformations and the vertical stresses at
the interface between the base and the subgrade as compared with unreinforced bases.
Laboratory tests were prepared in different test conditions in order to evaluate the
performance of triangular aperture geogrids with different base course thickness, base
course stiffness, and subgrade stiffness. Also, repeated tests were conducted to
verify the repeatability of the test method and condition.
1.4 Organization
This thesis contains five chapters. Chapter 1 provides introduction and overview of
this study.
Chapter 2 provides the literature review of the functions and mechanisms associated
with geosynthetics, especially geogrids and previous experimental studies, and
summarizes the current design methods for subgrade improvement of unpaved roads.
Chapter 3 presents the experimental study on geogrid-reinforced bases over weak
subgrade under cyclic loading including the properties of base, subgrade, and geogrid,
test facilities and setup, test procedures, data acquisition system, test plan, and test
results.
Chapter 4 presents the interpretation and analysis of the test data. This chapter

7
examines the effects of base course thickness, base course stiffness, subgrade stiffness,
and type of geogrid on the performance of geogrid-reinforced bases over weak
subgrade under cyclic loading including permanent displacement, percentage of
resilient displacement, maximum vertical stress, stress distribution, and modulus of
the reinforced base course.
Chapter 5 presents the conclusions from this study and the recommendations for
future study.

8
Chapter 2 LITERATURE REVIEW
2.1 Introduction
This chapter provides a brief literature review of geogrid types, functions, previous
experimental studies, and design methods for unpaved roads.
2.2 Geogrid
Geogrid has longitudinal and transverse ribs, which form apertures as showed in
Figures 1.1 and 1.2. Figure 1.3 shows triangular aperture geogrid with ribs in more
directions. The apertures allow soil particles to interact with ribs. The interaction
between the aggregates and the ribs is referred to as interlocking. In the past,
geogrid had two types: uniaxial and biaxial geogrids. Uniaxial geogrid has a tensile
strength in one direction while biaxial geogrid has tensile strengths in two directions.
Uniaxial geogrids are mainly used for slopes, retaining walls, and embankments.
However, biaxial geogrids are commonly used for roadways including unpaved roads,
paved roads, and railroads.
As Dong et al. (2010) demonstrated, biaxial geogrids cannot provide uniform tensile
strengths when subjected to tension in different directions. A new product with
triangular apertures was developed by the manufacturer to overcome this limitation.
Since the triangular aperture geogrid has a more stable grid structure, it is expected to
provide uniform tensile strengths in all directions as compared with uniaxial and

9
biaxial geogrids. However, due to their relatively recent introduction, the effects of
the triangular aperture geogrids on the performance of reinforced bases have not been
well tested and evaluated.
2.3 Functions of Geogrid
Giroud and Noiray (1981) pointed out that geosynthetics, especially geotextiles, can
be placed between an aggregate base and a subgrade soil to perform the following
functions: (1) separation; (2) filtration; (3) drainage; and (4) reinforcement.
Geogrids can provide partial separation, confinement, and reinforcement.
Geogrids can provide confinement and reinforcement to base and subgrade due to
their tensile strength and stiffness. The confinement is developed through the
interlocking between geogrid apertures and granular particles as shown in Figure 2.1.
The degree of interlocking depends on the relationship between geogrid aperture size
and aggregate particle size and the effectiveness of interlocking depends on the
in-plane stiffness of the geogrid and the stability of the geogrid ribs and junctions
(Webster, 1993).

10
Figure 2.1 Interlock between geogrid and aggregate (Tensar triangular aperture
geogrid)
Maxwell et al. (2005) summarized the contributions of geosynthetic reinforcement.
Under traffic loading, the granular base would be pushed down and out laterally if
there is no geogrid, which would induce shear stresses at the interface between the
base and the subgrade. Due to the interlocking between the geogrid and aggregate
particles, these shear stresses are absorbed by the stiffer geosynthetic, thus reducing
lateral strain in the granular layer. Given a proper ratio of geogrid aperture size to
aggregate grain size, geogrids provide lateral confinement to the aggregate base
course through shear resistance and friction between the geogrid and its surrounding
aggregate. The confinement due to the geogrid increases the modulus of the
aggregate, which leads to an improved vertical stress distribution over the subgrade
and consequent reduction of vertical subgrade deformation (Love 1984; Haas et al

11
1988). As shown in Figure 2.2, the shear stress absorbed by the stiff geosynthetic
layer results in less shear stress transferred to the subgrade. As a result of the
contributions by the geosynthetic layer discussed above, the subgrade is subjected to
less vertical and shear stresses, which would increase the bearing capacity and reduce
the deformation of the subgrade.
Figure 2.2 Contributions of geosynthetic reinforcement (Maxwell et al. 2005)
Since a geosynthetic layer is a thin and flexible material, it stretches to form a curved
concave shape as a membrane under a perpendicular load. This geosynthetic layer is
often called a tensioned membrane. As shown in Figure 2.3, under the wheel, the
geosynthetic layer develops tension and reduces the pressure applied on the subgrade
by the wheel. Beyond the wheel, however, the geosynthetic layer counteracts the
heaving of the subgrade under the wheel loading. This counteraction increases the

12
pressure applied on the subgrade beyond the wheel so that it stabilizes the subgrade
and reduces its heave. This effect by the geosynthetic layer is referred to as the
tensioned membrane effect (Giroud and Noiray, 1981). Giroud and Han (2004a)
pointed out that the tensioned membrane effect becomes important only if the traffic
is channelized and the rut depth is large (for example, greater than 100 mm).
.
Figure 2.3 Tensioned membrane effect (Maxwell et al. 2005)
For geogrids, not only the rib strength but also the junction strength is important
because the soil particles striking through and within the apertures bear loads against
the transverse ribs. These loads are transmitted to the longitudinal ribs via the
junctions.
13
2.4 Previous Experimental Studies
Duncan-Williams and Attoh-Okine (2008) conducted an experimental study to
evaluate the effect of geogrid on the strengths of granular bases. In their study,
standard CBR tests were selected. Unreinforced and reinforced samples were
prepared in the CBR molds with the geogrid layer placed at the mid-depth of the
sample. The test results showed that the inclusion of the geogrid increased the
CBR value of the sample.
Both laboratory tests and field full-scale experiments have shown that the inclusion of
a geogrid at the interface between a base curse and a subgrade can improve the
performance of the roadway system (Barksdale et al 1984, Al-Qadi 1994, Perkins
1999, Hufenus et al. 2006, and Al-Qadi et al. 2007). A properly placed geosynthetic
does improve the performance of an unpaved road. Das et al. (1998) pointed out that
the most effective location of the geosynthetic is at the interface of the granular
material and the subgrade surface. In this location the geosynthetic provides
separation, lateral restraint of the upper granular course, and a tensioned membrane
effect when strained extensively.
Plate loading tests were conducted in a large test box at North Carolina State
University to evaluate the performance of biaxial geogrid-reinforced bases (Leng,
2002). The dimension of the test box was 1.5 m x 1.5 m x 1.35 m high. A total of

14
14 cyclic plate loading tests were conducted on granular bases over subgrade. The
test results showed that biaxial geogrids improved the performance of the unpaved
sections under cyclic loading.
2.5 Design Methods
Several design methodologies have emerged since the late 1970s that address
geosynthetic reinforcement for unpaved roads. These methods include: (1)
Barenburg et al. (1975), (2) Giroud and Noiray (1981), and (3) Giroud and Han
(2004). A brief review of these methods is presented below.
2.5.1 The Barenburg et al. Method
Barenburg et al. (1975) proposed a method that utilizes different bearing capacity
factors for unpaved roads with or without a geotextile. “Lateral restraint theory” is
the core of this method. This method assumed soft, cohesive subgrade overlain by a
crushed-rock aggregate base subjected to less than 100 load repetitions. The vertical
stress at the interface between the base and the subgrade was calculated using the
Boussinesq solution based on a circular contact area. Small-scale laboratory tests by
Barenburg et al. (1975) showed that bearing capacity factors (Nc) of 6 and 3.3 were
appropriate for a geotextile-reinforced base and an unreinforced base, respectively.
Currently, the United States Army Corp utilizes the same approach for construction of
low-volume unpaved roads with minor design improvements made by Steward et al.
(1977) and Henry (1999). This design procedure can be summarized as follows:

15
1. Determine an equivalent cohesion (C) for the subgrade soil, often based on
undrained shear strength.
2. Determine a maximum wheel load.
3. Choose the appropriate bearing capacity factor (Nc), where Nc = 6 (with geotextile)
and Nc = 3.3 (without geotextile).
4. Calculate the allowable bearing pressure on the subgrade (pa), where pa = C (Nc) for
the reinforced or unreinforced base.
5. Determine the crushed-rock aggregate thickness for each base utilizing the
corresponding design chart, based on the expected maximum wheel load and the
allowable bearing pressure.
6. Choose a geotextile based on installation and environmental considerations, and
then determine its cost.
7. Evaluate both reinforced and unreinforced bases to determine the economical
solution.
Earlier research by Rodin (1965) indicated that at the onset of localized bearing
failure, Nc = 6.2 for a rigid footing and Nc = 3.1 for a flexible footing. The addition
of the geotextile on the subgrade causes the subgrade to fail in the way similar to the
rigid footing on the subgrade, which is a general bearing failure rather than a local
bearing failure. Steward et al. (1977) extended the Barenburg et al. (1975) method
to address a slightly greater number of load repetitions by further reduction of the
recommended bearing capacity factors. The Barenburg et al. (1975) design method

16
did not take into consideration of geotextile properties, such as its strength and
modulus.
2.5.2 The Giroud and Noiray Method
Giroud and Noiray (1981) considered the effect of the tensile modulus of the
geotextile on the required base thickness using the tensioned membrane theory. In
their study, Giroud and Noiray (1981) assumed a soft, saturated clay subgrade that is
undrained and a granular base that has a California Bearing Ratio (CBR) of at least 80.
In addition, Giroud and Noiray (1981) assumed a rectangular contact area and a fixed
stress distribution angle. A stress distribution method was used to estimate the
vertical stress at the interface of the base and the subgrade. Henry (1999) compared
the Giroud and Noiray method with the Barenburg et al. method and demonstrated
their differences.
2.5.3 The Giroud and Han Method
Giroud and Han (2004) developed a unified equation for determining the required
base course thickness for unreinforced, geotextile-reinforced, and geogrid-reinforced
bases over an undrained, cohesive subgrade. This method considered the type of the
geosynthetic, the aperture stability modulus of the geogrid, the modulus of the base
course, and the modulus of the subgrade in addition to the traffic volume, the wheel
load, the tire pressure, the undrained shear strength of subgrade, and the rut depth as
considered in other design methods. Different bearing capacity factors were
17
suggested for unreinforced, geotextile-reinforced, and geogrid-reinforced bases.
Different from the Giroud and Noiray Method, the Giroud and Han Method assumed
a circular tire contact area and considered the effect of the base course stiffness,
which is empirically correlated to the California Bearing Ratio of the base. This is
an important feature of the Giroud and Han method. This consideration is consistent
with the conclusion by Barber et al. (1978) that the base course CBR value plays an
important role in the number of axle passes an unpaved road could carry. Another
significant difference between the Giroud and Noiray method and the Giroud and Han
method is the consideration of the stress distribution angle. In the Giroud and
Noiray method, the stress distribution angle is fixed while in the Giroud and Han
method, the stress distribution angle changes with the number of passes, the thickness
of the base, the radius of the contact area, and the geosynthetic reinforcement, which
make this design method more realistic.
Giroud and Han (2004a, b) selected the aperture stability modulus (ASM) of a geogrid
as the performance property when they developed the method for geogrid-reinforced
unpaved roads. ASM is an index representing the in-plane stiffness of the geogrid by
measuring the torsional load required to twist the geogrid node to a particular in-plane
angular distortion. This procedure is to quantify the combined effect of the tensile
modulus and the junction strength. Webster (1993) and Kinney (1995) correlated
the performance of geogrid-reinforced bases to ASM. However, there is no
consensus standardized test method for ASM (J) at this time.

18
Iowa State University conducted a series of experiments (White et al. 2007) to
evaluate geogrid-reinforced bases using the Giroud and Han method and the equation
developed by the U.S. Army Corps of Engineers in 1989 for low-volume roads
(Bolander et al.). Figure 2.4 shows the rut development versus the subgrade CBR
value under different loading cycles. Figure 2.5 shows the rut development versus
the subgrade CBR value at different base thicknesses. Figure 2.6 shows the rut
development versus the subgrade CBR value under different axle loads.
Figure 2.4 Rut depth versus subgrade CBR at different load cycles (White et al. 2007)

19
Figure 2.5 Rut depth versus subgrade CBR at different base thicknesses
(White et al. 2007)
Figure 2.6 Rut depth versus subgrade CBR at different axle loads (White et al. 2007)

20
The following paragraph summarizes the findings from the above figures:
1. The measured rut depths are in reasonable agreement with those estimated using
the Giroud and Han method. This comparison indicates that the Giroud and Han
method is applicable for designing granular shoulders. The method proposed by
the U.S. Army Corps of Engineers, however, appears to overestimate the rut
depths.
2. The Giroud and Han method indicates that an increase of the thickness of the
granular layer results in a slight reduction in the rut depth value. This method
considers the CBR of the subgrade as the controlling factor for the rut depth.
The reduction in the rut depth value is more substantial, however, if the U.S.
Army Corps of Engineers’ design method is used.
3. Both methods indicate that rut depth increases considerably with the axle load.
The axle load is therefore an important factor for the rut depth development.
2.6 Summary
Geogrid, a major type of geosynthetics, has been commonly used for soil
reinforcement. Laboratory and field test data have demonstrated the improved
performance of geogrid-reinforced roads. In the past, biaxial geogrids have been
commonly used for unpaved roads. Triangular aperture geogrid is a geogrid recently
introduced in the market, which is expected to have more uniform tensile strength and
stiffness in all directions. Research is needed to evaluate the performance of this
new type of geogrid.

21
Studies have confirmed that geogrids can make the following contributions when they
are placed at the interface of the base and the subgrade: (1) confinement of aggregate
particles, (2) increase of the base modulus, (3) reduction of the shear stress at the
interface, (4) increase of the stress distribution, and (5) tensioned membrane effect.
Laboratory cyclic plate loading tests in a large box have been successfully used by
researchers to evaluate the performance of geogrid-reinforced unpaved road sections.
Different design methods have been developed in the past to estimate the required
base thickness for unreinforced, geotextile-reinforced, and geogrid-reinforced
unpaved road sections. These methods should be verified against the triangular
aperture geogrid.

22
Chapter 3 EXPERIMENTAL STUDY
3.1 Test Materials
3.1.1 Geogrid
Three triangular aperture geogrids (a regular duty grade, T1; a medium duty grade T2;
and a heavy duty grade, T3), made of polypropylene, were used in this experimental
study. Some properties of these geogrids are presented in Table 3.1. For the three
triangular aperture geogrids, all physical properties increase from T1, T2, to T3.
The three geogrids included in this study are all of the same “family” of geogrids, i.e.,
a family of geogrids being defined as having the same manufacturing type (same
manufacturer with identical polymer, process method and equipment), and only
differing in one variable of product design. T1, T2 and T3 differ only in that
different thicknesses of starting sheet are used in manufacturing the three geogrids
and all other chemical and physical parameters that influence end-product
characteristics are the same. For this particular family of products and
manufacturing process (extruded sheet which is then punched and then stretched), the
resulting end products differ essentially in terms of levels of robustness, unit weight,
rib thicknesses, and mechanical properties. By performing tests on representative
product variants from within a given geogrid family and establishing correlations to
performance based on indicative or characteristic properties of the specific geogrid
family tested, reliable predictions of performance can be made for untested geogrids
23
provided they are members of the same family of geogrids. The data from this
particular study, provided it is combined with other results of performance testing
conducted by other researchers using the same family of geogrid, can provide a basis
for the development of a design method for geogrid-reinforced bases for the family of
triangular aperture geogrids.
3.1.2 Base material
AB3 aggregate, commonly used in Kansas, was used as the material for the base
course. This material has the following physical properties: specific gravity (Gs)
=2.69, liquid limit (LL) =20, plastic limit (PL) =13, mean particle size (d50) =7.0 mm,
coefficient of curvature (Cc) =2.25, and coefficient of uniformity (Cu) =133. The
grain size distribution of AB3 is presented in Figure 3.1. Compaction tests were
performed to obtain the compaction curve as shown in Figure 3.2. The maximum
dry density is 2.08 g/cm3, which corresponds to the optimum moisture content of
10.2%. A series of laboratory unsoaked CBR tests (ASTM D 1188) for the subgrade
were performed at different water contents. The CBR vs. moisture content curve is
presented in Figure 3.3. To examine the effect of the base course stiffness, the base
courses were compacted to two California Bearing Ratios (CBR) at approximately 5%
and 20%. The CBR values were mainly estimated by the dynamic cone penetration
(DCP) tests after the preparation of the base course in the large test box.
3.1.3 Subgrade material

24
The weak subgrade was an artificial soil composed of a mixture of 75 percent Kansas
River sand and 25 percent kaolin by weight. The grain size distribution of Kansas
River sand is presented in Figure 3.1. Compaction tests were performed to obtain
the compaction curve as shown in Figure 3.4. The maximum dry density is 2.01
g/cm3, which corresponds to the optimum moisture content of 10.8%. A series of
laboratory unsoaked CBR tests (ASTM D 1188) for the subgrade were performed at
different water contents. The CBR vs. moisture content curve is presented in Figure
3.4. The subgrade soil was compacted at a water content of 11.4% for the box tests
to achieve its CBR at approximately 2%, which was verified by vane shear and DCP
tests. In some tests, however, the subgrade was compacted to achieve its CBR at
approximately 3% to investigate the influence of the subgrade strength on the
performance.

25

26
Figure 3.1 Grain size distribution curves of Kansas River sand (Han et al. 2008)
and AB3 aggregate
Figure 3.2 Compaction curve of the AB3
0
10
20
30
40
50
60
70
80
90
100
0.01 0.1 1 10 100
% p
assi
ng
Particle size (mm)
AB 3
Kansas River sand
1.8
1.9
2.0
2.1
6 8 10 12 14
Dry
den
sity
( g
/cm
3)
Moisture content (%)

27
Figure 3.3 CBR vs. moisture content of the base course
Figure 3.4 Compaction curve of the subgrade
20
30
40
50
60
70
80
6 8 10 12
CB
R (
%)
Moisture content (%)
0.1 in
0.2 in
1.8
1.9
2.0
2.1
8 10 12 14 16
Dry
den
sity
( g
/cm
3)
Moisture content (%)

28
Figure 3.5 CBR vs. moisture content of the subgrade
3.2 Test Equipment
Cyclic plate loading tests were conducted in a large test box system designed and
fabricated for the geotechnical laboratory at the Department of Civil, Environmental,
and Architectural Engineering at the University of Kansas. This system includes a
loading actuator, a data acquisition system, and a steel box (2 m x 2.2 m x 2 m high).
The loading system was an MTS hydraulic loading system. The steel loading plate
had a diameter of 30 cm. For both unreinforced and reinforced tests, cyclic loading
tests were conducted. The cyclic loading waves were generated with a peak force of
40 kN and a trough force of 0.5 kN as shown in Figure 3.6. The frequency of this
wave was 0.77 Hz. The peak load was selected to simulate a single wheel load of 40
0
4
8
12
16
20
8 10 12 14 16
CB
R (
%)
Moisture content (%)
0.1 in
0.2 in
29
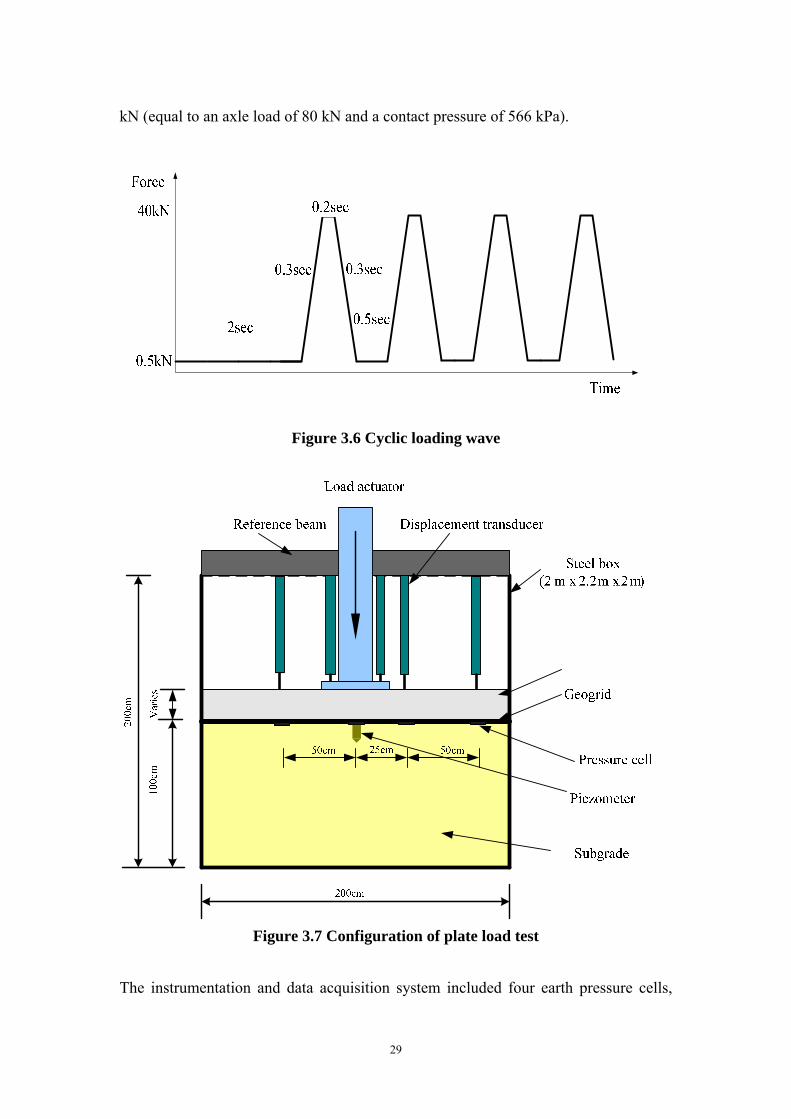
kN (equal to an axle load of 80 kN and a contact pressure of 566 kPa).
Figure 3.6 Cyclic loading wave
Figure 3.7 Configuration of plate load test
The instrumentation and data acquisition system included four earth pressure cells,

30
five displacement transducers, and two piezometers. Details of the test box system
and the reinforced section are illustrated in Figure 3.7 as an example.
The subgrade was placed and compacted in four layers (150 mm thick for each layer)
at the moisture content of 11.4% for the top 600 mm subgrade. The base course was
compacted to a thickness of approximately 150 mm, 230 mm, or 300 mm at the
moisture content of 8.9%. The geogrid was placed at the interface between the
subgrade and the base course in each reinforced test section.
Figure 3.8 shows the actual test box and cyclic loading system in the laboratory.
Figure 3.8 The test box and cyclic loading system

31
Figure 3.9 shows the compaction of the soil using the vibratory compactor. The
level of compaction was controlled by the volume of the soil and the number of
passes.
Figure 3.9 Compaction of soil using the vibratory compacter
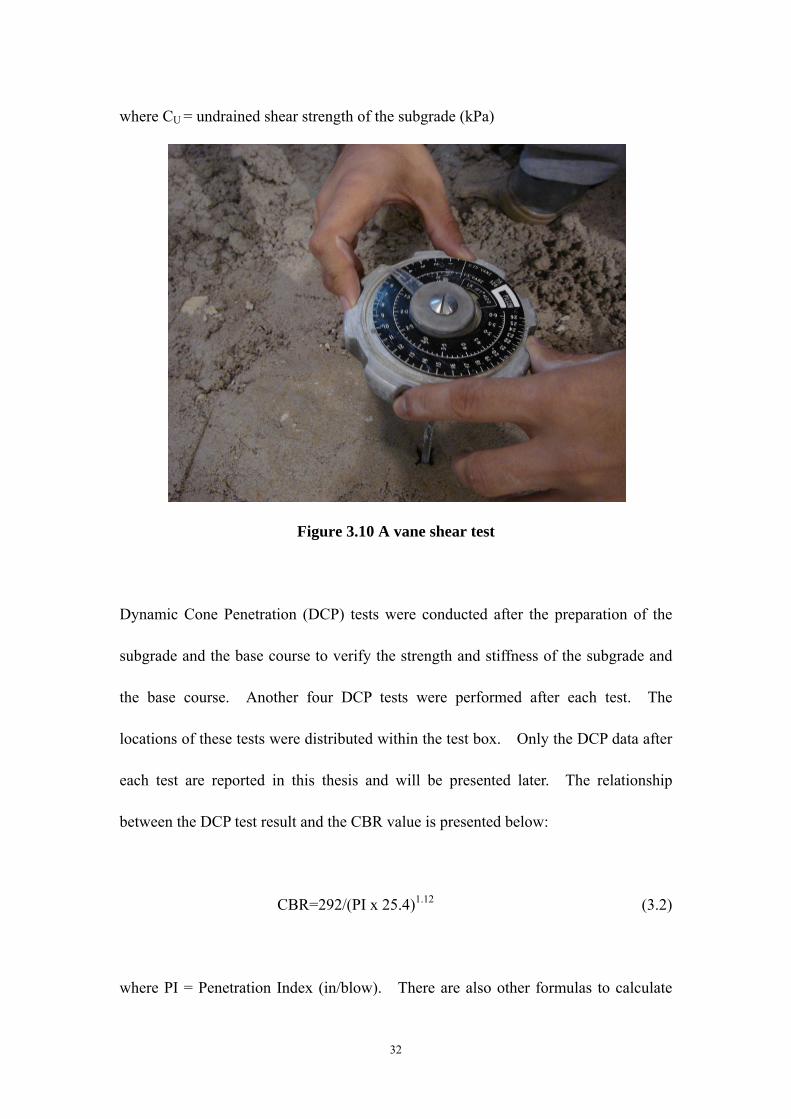
Figure 3.10 shows the hand-operated vane shear test device used to control the CBR
value of the subgrade soil after each lift of compaction. The range of the vane shear
strength of the subgrade was controlled between 36 kPa and 43 kPa, usinging the
correlation obtained in this study as follows:
CBR=CU/20.5 (3.1)
32
where CU = undrained shear strength of the subgrade (kPa)
Figure 3.10 A vane shear test
Dynamic Cone Penetration (DCP) tests were conducted after the preparation of the
subgrade and the base course to verify the strength and stiffness of the subgrade and
the base course. Another four DCP tests were performed after each test. The
locations of these tests were distributed within the test box. Only the DCP data after
each test are reported in this thesis and will be presented later. The relationship
between the DCP test result and the CBR value is presented below:
CBR=292/(PI x 25.4)1.12 (3.2)
where PI = Penetration Index (in/blow). There are also other formulas to calculate

33
the CBR value from the Penetration Index, however, Eq. (3.2) worked well in this
study.
Figure 3.11 A dynamic cone penetration (DCP) test
Figure 3.12 shows an earth pressure cell used in this study. The diameter and
thickness of this pressure cell are 50 mm and 11.3 mm, respectively. However, the
diameter of the sensing area is 46 mm. Four earth pressure cells were used for each
test section. They are strain gauge-type pressure cells, which are suitable for
measuring dynamic earth pressures under cyclic loading.
Figure 3.13 shows a piezometer used to measure pore pressure for a few earlier tests

34
during the cyclic loading. Two piezometers were used in each section of those tests.
They are strain gauge type-sensors. Since there was no noticeable relationship
between the measured pore pressure and the cyclic loading, they were not used in later
tests.
Figure 3.12 An earth pressure cell

35
Figure 3.13 A piezometer
Figure 3.14 shows the setup of the displacement gauges in each test. They are also
strain gauge-type sensors and had two maximum measurement ranges: 10 cm and 5
cm. The displacement gauges with 10 cm measurement range were placed at the top
of the loading plate and at the location 25 cm away from the center. The
displacement gauges with 5 cm measurement length were placed at the locations 50
cm and 75 cm away from the center.

36
Figure 3.14 Setup of the displacement gauges
Figure 3.15 shows the GeoGauge used in this study for a few earlier tests.
GeoGauge was used to measure the stiffness of the base course. Due to the difficulty
in seating this device, the test results were not consistent. Therefore, it was not used
for the later tests.

37
Figure 3.15 GeoGauge
3.3 Test Plan
Table 3.2 presents the test plan implemented in this study. Totally 19 cyclic plate
loading tests were performed, which included 5 unreinforced test sections and 14
geogrid-reinforced test sections. There were three base course thicknesses. Three
repeated tests were done to verify the repeatability of the test method.
Most tests were conducted on the base course at 20% CBR over the subgrade at 2%
CBR unless noted otherwise.

38
Table 3.3 Test plan
Geogrid
Base course thickness
15 cm 23 cm 30 cm
Unreinforced 3#@ 1 1
T1 1 3*# 1
T2 2@ 1 2*
T3 2@ 1 1
* one repeated test
# one test with subgrade CBR=3%
@ one test with base course CBR=5%

39
3.4 Test Data
Significant amounts of test data were generated from 19 cyclic plate loading tests.
The test results are presented for each test section including the DCP test profiles
which were obtained prior to cyclic plate loading test, the permanent displacement at
the center vs. the number of cycle, the maximum vertical stress vs. the number of
cycle, and the surface profiles before and after testing. This section only provides
the reduced test data and the analyses of these data will be provided in Chapter 4.
3.4.1 15 cm thick unreinforced base
Figure 3.16 shows the DCP test profiles for the 15 cm thick unreinforced base over
weak subgrade. DCP tests were conducted at four randomly selected locations.
The average penetration index was calculated at the same depth from the four profiles,
which were used to obtain the CBR value for each test. The conversion from the
DCP penetration index to the CBR value will be presented in Chapter 4. The
average profile is shown in a dash line in Figure 3.16. The same approach was used
to analyze the DCP data for all the other tests.

40
Figure 3.16 DCP test data for 15 cm thick unreinforced base
Figure 3.17 shows the permanent displacement of the loading plate versus the number
of cycle for this test section. The permanent displacement was obtained from the
lowest point of displacement in each cycle. The displacement during each cycle is
shown in Figure 3.18.
0
5
10
15
20
25
30
0 1 2 3 4 5 6D
epth
(in
)
Penetration Index (in/blow)
Test 1
Test 2
Test 3
Test 4
Average

41
Figure 3.17 Permanent displacement of the loading plate vs. the number of cycle for 15 cm thick unreinforced base
Figure 3.18 Displacement of the loading plate vs. the number of cycle for 15 cm thick unreinforced base
0
10
20
30
40
50
60
70
80
90
0 5 10 15 20 25 30 35 40
Per
man
ent
dis
pla
cem
ent
(mm
)
Number of cycle
Unreinforced
0
10
20
30
40
50
60
70
80
90
0 5 10 15 20 25 30 35 40
Dip
lace
men
t (m
m)
Number of cycle
Unreinforced
42
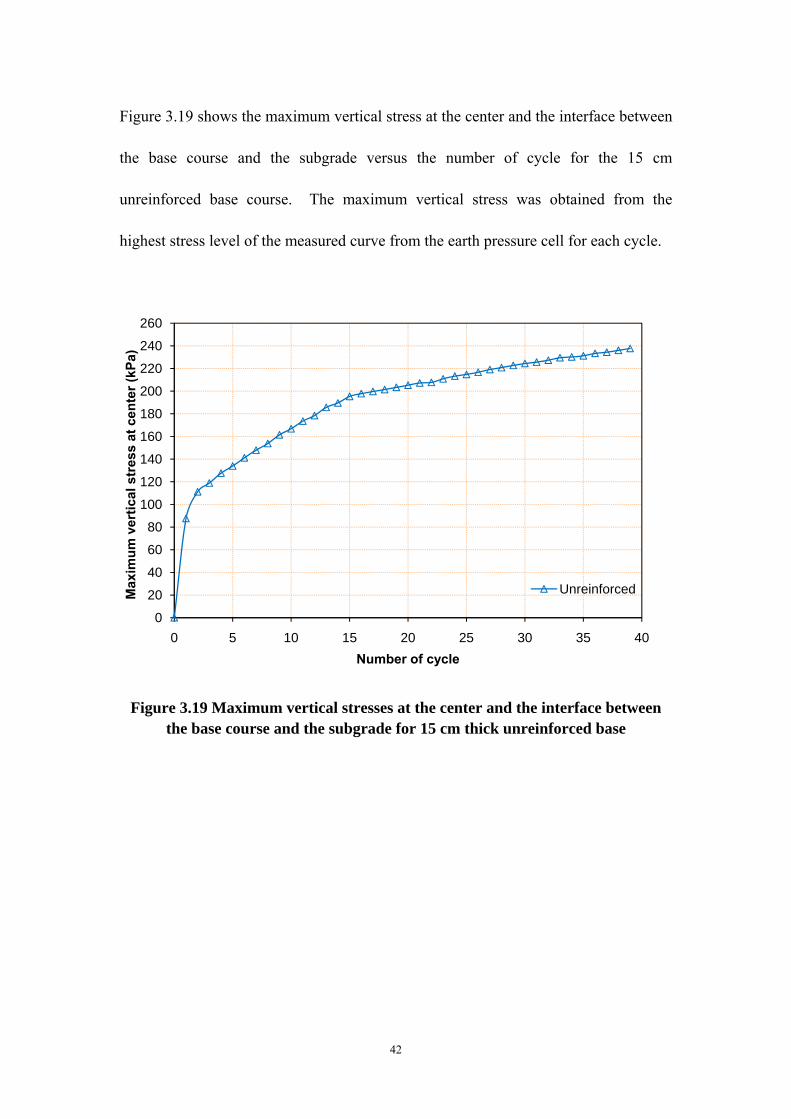
Figure 3.19 shows the maximum vertical stress at the center and the interface between
the base course and the subgrade versus the number of cycle for the 15 cm
unreinforced base course. The maximum vertical stress was obtained from the
highest stress level of the measured curve from the earth pressure cell for each cycle.
Figure 3.19 Maximum vertical stresses at the center and the interface between the base course and the subgrade for 15 cm thick unreinforced base
0
20
40
60
80
100
120
140
160
180
200
220
240
260
0 5 10 15 20 25 30 35 40
Max
imu
m v
erti
cal
stre
ss a
t ce
nte
r (k
Pa)
Number of cycle
Unreinforced
43
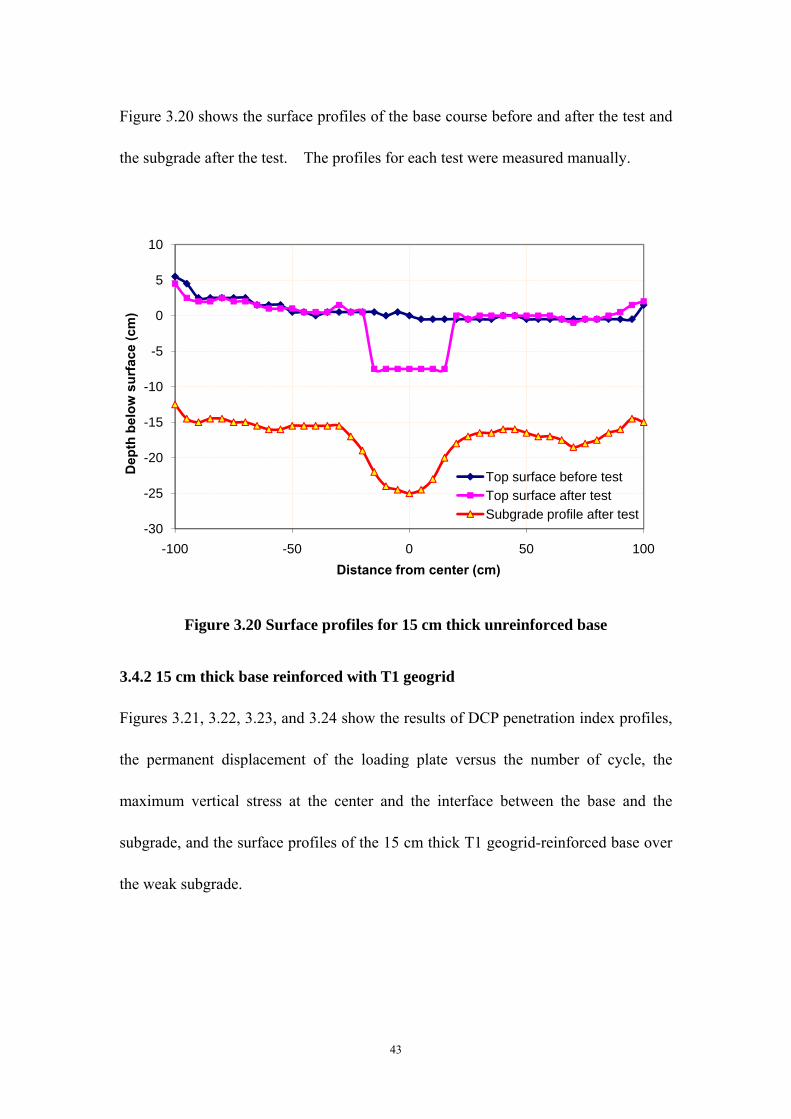
Figure 3.20 shows the surface profiles of the base course before and after the test and
the subgrade after the test. The profiles for each test were measured manually.
Figure 3.20 Surface profiles for 15 cm thick unreinforced base
3.4.2 15 cm thick base reinforced with T1 geogrid
Figures 3.21, 3.22, 3.23, and 3.24 show the results of DCP penetration index profiles,
the permanent displacement of the loading plate versus the number of cycle, the
maximum vertical stress at the center and the interface between the base and the
subgrade, and the surface profiles of the 15 cm thick T1 geogrid-reinforced base over
the weak subgrade.
-30
-25
-20
-15
-10
-5
0
5
10
-100 -50 0 50 100
Dep
th b
elo
w s
urf
ace
(cm
)
Distance from center (cm)
Top surface before test
Top surface after test
Subgrade profile after test

44
Figure 3.21 DCP test data for the 15 cm thick T1 geogrid-reinforced base
Figure 3.22 Permanent displacement of the loading plate versus the number of
cycle for the 15 cm thick T1 geogrid-reinforced base
0
5
10
15
20
25
30
0 1 2 3 4 5 6D
epth
(in
)
Penetration Index (in/blow)
Test 1
Test 2
Test 3
Test 4
Average
0
10
20
30
40
50
60
70
80
90
0 5 10 15 20 25 30 35 40 45 50 55
Per
man
ent
dis
pla
cem
ent
(mm
)
Number of cycle
T1
45
Figure 3.23 Maximum vertical stresses at the center and the interface between the base and the subgrade for 15 cm thick T1 geogrid-reinforced base
Figure 3.24 Surface profiles of the 15 cm thick T1 geogrid-reinforced base before and after loading
0
50
100
150
200
250
0 5 10 15 20 25 30 35 40 45 50 55
Max
imu
m v
erti
cal
stre
ss a
t ce
nte
r (k
Pa)
Number of cycle
T1
-30
-25
-20
-15
-10
-5
0
5
10
-100 -50 0 50 100
Dep
th b
elo
w t
op
su
rfac
e (c
m)
Distance from center (cm)
Top surface before test
Top surface after test
Subgrade profile after test

46
3.4.3 15 cm thick base reinforced with T2 geogrid
Figures 3.25, 3.26, 3.27, and 3.28 show the results of DCP penetration index profiles,
the permanent displacement of the loading plate versus the number of cycle, the
maximum vertical stress at the center and the interface between the base and the
subgrade, and the surface profiles of the 15 cm thick T2 geogrid-reinforced base over
the weak subgrade.
Figure 3.25 DCP test data for 15 cm thick T2 geogrid-reinforced base
0
5
10
15
20
25
30
0 1 2 3 4 5 6 7
Dep
th (
in)
Penetration Index (in/blow)
Test 1
Test 2
Test 3
Test 4
Average

47
Figure 3.26 Permanent displacement of the loading plate versus the number of
cycle for 15 cm thick T2 geogrid-reinforced base
Figure 3.27 Maximum vertical stresses at the center and the interface between
the base and the subgrade for 15 cm thick T2 geogrid-reinforced base
0
10
20
30
40
50
60
70
80
90
0 5 10 15 20 25 30 35 40 45 50 55 60 65 70 75 80
Per
man
ent
dis
pla
cem
ent
(mm
)
Number of cycle
T2
0
50
100
150
200
250
0 5 10 15 20 25 30 35 40 45 50 55 60 65 70 75 80
Max
imu
m v
erti
cal
stre
ss a
t ce
nte
r (k
Pa)
Number of cycle
T2

48
Figure 3.28 Surface profiles of 15 cm thick T2 geogrid-reinforced base
3.4.4 15 cm thick base reinforced with T3 geogrid
Figures 3.29, 3.30, 3.31, and 3.32 show the results of DCP penetration index profiles,
the permanent displacement of the loading plate versus the number of cycle, the
maximum vertical stress at the center and the interface between the base and the
subgrade, and the surface profiles of the 15 cm thick T3 geogrid-reinforced base over
the weak subgrade.
-30
-25
-20
-15
-10
-5
0
5
10
-100 -50 0 50 100
Dep
th b
elo
w t
op
su
rfac
e (c
m)
Distance from center (cm)
Top surface before test
Top surface after test
Subgrade profile after test

49
Figure 3.29 DCP test data for 15 cm thick T3 geogrid-reinforced base
Figure 3.30 Permanent displacement of the loading plate versus the number of
cycle for 15 cm thick T3 geogrid-reinforced base
0
5
10
15
20
25
30
0 1 2 3 4 5D
epth
(in
)Penetration Index (in/blow)
Test 1
Test 2
Test 3
Test 4
Average
0
10
20
30
40
50
60
70
80
90
0 5 10 15 20 25 30 35 40 45 50 55 60 65 70
Per
man
ent
dis
pla
cem
ent
(mm
)
Number of cycle
T3
50
Figure 3.31 Maximum vertical stresses at the center and the interface between
the base and the subgrade for 15 cm thick T3 geogrid-reinforced base
Figure 3.32 Surface profiles for 15 cm thick T3 geogrid-reinforced base
0
50
100
150
200
250
0 5 10 15 20 25 30 35 40 45 50 55 60 65 70
Max
imu
m v
erti
cal
stre
ss a
t ce
nte
r (k
Pa)
Number of cycle
T3
-30
-25
-20
-15
-10
-5
0
5
10
-100 -50 0 50 100
Dep
th b
elo
w t
op
su
rfac
e (c
m)
Distance from center (cm)
Top surface before test
Top surface after test
Subgrade profile after test

51
3.4.5 23 cm thick unreinforced base
Figures 3.33, 3.34, 3.35, and 3.36 show the results of DCP penetration index profiles,
the permanent displacement of the loading plate versus the number of cycle, the
maximum vertical stress at the center and the interface between the base and the
subgrade, and the surface profiles of the 23 cm thick unreinforced base over the weak
subgrade.
Figure 3.33 DCP test data for 23 cm thick unreinforced base
0
5
10
15
20
25
30
0 1 2 3 4 5 6
Dep
th (
in)
Penetration Index (in/blow)
Test 1
Test 2
Test 3
Test 4
Average

52
Figure 3.34 Permanent displacement of the loading plate vs. the number of cycle
for 23 cm thick unreinforced base
Figure 3.35 Maximum vertical stresses at the center and the interface between the base course and the subgrade for 23 cm thick unreinforced base
0
10
20
30
40
50
60
70
80
90
0 10 20 30 40 50 60 70
Per
man
ent
dis
pla
cem
ent
(mm
)
Number of cycle
Unreinforced
0
20
40
60
80
100
120
140
160
180
200
0 10 20 30 40 50 60 70
Max
imu
m v
erti
cal
stre
ss a
t ce
nte
r (k
Pa)
Number of cycle
Unreinforced

53
Figure 3.36 Surface profiles for 23 cm thick unreinforced base
3.4.6 23 cm thick unreinforced base (higher CBR subgrade)
Figures 3.37, 3.38, 3.39, and 3.40 show the results of DCP penetration index profiles,
the permanent displacement of the loading plate versus the number of cycle, the
maximum vertical stress at the center and the interface between the base and the
subgrade, and the surface profiles of the 23 cm thick unreinforced base over the
subgrade at 3% CBR.
-35
-30
-25
-20
-15
-10
-5
0
5
10
-100 -50 0 50 100
Dep
th b
elo
w t
op
su
rfac
e (c
m)
Distance from center (cm)
Top surface before testTop surface after testSubgrade profile after test

54
Figure 3.37DCP test data for 23 cm thick unreinforced base course (higher CBR subgrade)
Figure 3.38 Permanent displacement of the loading plate vs. the number of cycle
for 23 cm thick unreinforced base (higher CBR subgrade)
0
5
10
15
20
25
30
0 0.5 1 1.5 2 2.5 3D
epth
(in
)Penetration Index (in/blow)
Test 1
Test 2
Test 3
Test 4
Average
0
10
20
30
40
50
60
70
80
90
0 10 20 30 40 50 60 70 80 90 100
Per
man
ent
Dis
pla
cem
ent
(mm
)
Number of cycle
Unreinforced

55
Figure 3.39 Maximum vertical stresses at the center and the interface between the base and the subgrade for 23 cm thick unreinforced base (higher CBR
subgrade)
Figure 3.40 Surface profile for 23 cm thick unreinforced base (subgrade
CBR=3%)
0
20
40
60
80
100
120
140
160
180
200
0 10 20 30 40 50 60 70 80 90 100
Max
imu
m v
erti
cal
stre
ss a
t ce
nte
r (k
Pa)
Number of cycle
Unreinforced
-35
-30
-25
-20
-15
-10
-5
0
5
10
-100 -50 0 50 100
Dep
th b
elo
w t
op
su
rfac
e (c
m)
Distance from center (cm)
Top surface before test
Top surface after test
Subgrade profile after test

56
3.4.7 23 cm thick base reinforced with T1 geogrid
Figures 3.41, 3.42, 3.43, and 3.44 show the results of DCP penetration index profiles,
the permanent displacement of the loading plate versus the number of cycle, the
maximum vertical stress at the center and the interface between the base and the
subgrade, and the surface profiles of the 23 cm thick T1 geogrid-reinforced base over
the weak subgrade.
Figure 3.41 DCP test data for 23 cm thick T1 geogrid-reinforced base
0
5
10
15
20
25
30
0 1 2 3 4 5 6 7
Dep
th (
in)
Penetration Index (in/blow)
Test 1
Test 2
Test 3
Test 4
Average

57
Figure 3.42 Permanent displacement of the loading plate versus the number of cycle for 23 cm thick T1 geogrid-reinforced base
Figure 3.43 Maximum vertical stresses at the center and the interface between the base and the subgrade versus the number of cycle for 23 cm thick T1
geogrid-reinforced base
0
10
20
30
40
50
60
70
80
90
0 10 20 30 40 50 60 70 80 90 100
Per
man
ent
dis
pla
cem
ent
(mm
)
Number of cycle
T1
0
20
40
60
80
100
120
140
0 10 20 30 40 50 60 70 80 90 100
Max
imu
m v
erti
cal
stre
ss a
t ce
nte
r (k
Pa)
Number of cycle
T1
58
Figure 3.44 Surface profiles for 23 cm thick T1 geogrid-reinforced base
3.4.8 23 cm thick base reinforced with T1 geogrid (higher CBR subgrade)
Figures 3.45, 3.46, 3.47, and 3.48 show the results of DCP penetration index profiles,
the permanent displacement of the loading plate versus the number of cycle, the
maximum vertical stress at the center and the interface between the base and the
subgrade, and the surface profiles of the 23 cm thick T1 geogrid-reinforced base over
the weak subgrade at approximately 3% CBR.
-45
-40
-35
-30
-25
-20
-15
-10
-5
0
5
10
-100 -50 0 50 100
Dep
th b
elo
w t
op
su
rfac
e (c
m)
Distance from center (cm)
Top surface before test
Top surface after test
Subgrade profile after test

59
Figure 3.45 DCP test data for 23 cm thick T1 geogrid-reinforced base (higher CBR subgrade)
Figure 3.46 Permanent displacement of the loading plate versus the number of cycle for 23 cm thick T1 geogrid-reinforced base (higher CBR subgrade)
0
5
10
15
20
25
30
0 0.5 1 1.5 2 2.5 3 3.5D
epth
(in
)
Penetration Index (in/blow)
Test 1
Test 2
Test 3
Test 4
Average
0
10
20
30
40
50
60
70
80
90
0 50 100 150 200 250
Per
man
ent
Dis
pla
cem
ent
(mm
)
Number of cycle
T1

60
Figure 3.47 Maximum vertical stresses at the center and the interface between
the base and the subgrade versus the number of cycle for 23 cm thick T1 geogrid-reinforced base (higher CBR subgrade)
Figure 3.48 Surface profiles for 23 cm thick T1 geogrid-reinforced base (higher CBR subgrade)
0
20
40
60
80
100
120
140
160
180
0 50 100 150 200 250
Max
imu
m v
erti
cal
stre
ss a
t ce
nte
r (k
Pa)
Number of cycle
T1
-35
-30
-25
-20
-15
-10
-5
0
5
10
-100 -50 0 50 100
Dep
th b
elo
w t
op
su
rfac
e (c
m)
Distance from center (cm)
Top surface before test
Top surface after test
Subgrade profile after test

61
3.4.9 23 cm thick base reinforced with T2 geogrid
Figures 3.49, 3.50, 3.51, and 3.52 show the results of DCP penetration index profiles,
the permanent displacement of the loading plate versus the number of cycle, the
maximum vertical stress at the center and the interface between the base and the
subgrade, and the surface profiles of the 23 cm thick T2 geogrid-reinforced base over
the weak subgrade.
Figure 3.49 DCP test data for 23 cm thick T2 geogrid-reinforced base
0
5
10
15
20
25
30
0 1 2 3 4 5 6 7
Dep
th (
in)
Penetration Index (in/blow)
Test 1
Test 2
Test 3
Test 4
Average
62
Figure 3.50 Permanent displacement of the loading plate versus the number of cycle for 23 cm thick T2 geogrid-reinforced base
Figure 3.51 Maximum vertical stresses at the center and the interface between the base and the subgrade for 23 cm thick T2 geogrid-reinforced base
0
10
20
30
40
50
60
70
80
90
0 30 60 90 120 150 180
Per
man
ent
dis
pla
cem
ent
(mm
)
Number of cycle
T2
0
20
40
60
80
100
120
140
0 30 60 90 120 150 180
Max
imu
m v
erti
cal
stre
ss a
t ce
nte
r (k
Pa)
Number of cycle
T2
63
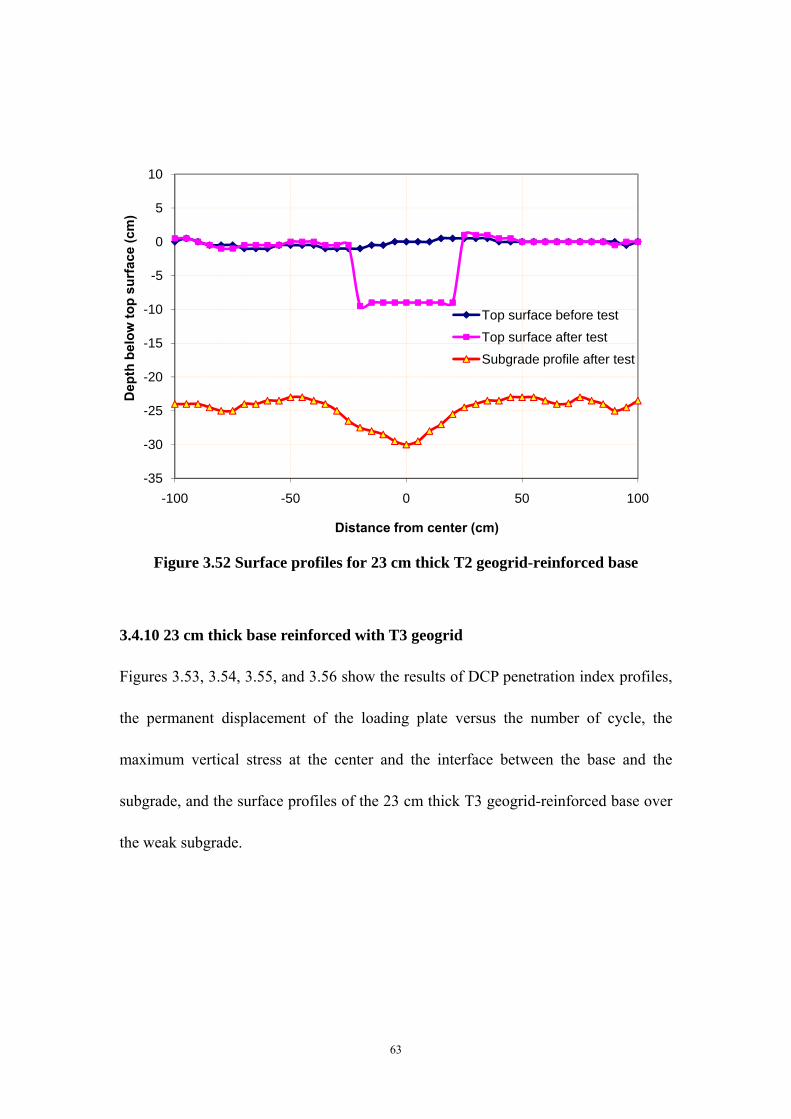
Figure 3.52 Surface profiles for 23 cm thick T2 geogrid-reinforced base
3.4.10 23 cm thick base reinforced with T3 geogrid
Figures 3.53, 3.54, 3.55, and 3.56 show the results of DCP penetration index profiles,
the permanent displacement of the loading plate versus the number of cycle, the
maximum vertical stress at the center and the interface between the base and the
subgrade, and the surface profiles of the 23 cm thick T3 geogrid-reinforced base over
the weak subgrade.
-35
-30
-25
-20
-15
-10
-5
0
5
10
-100 -50 0 50 100
Dep
th b
elo
w t
op
su
rfac
e (c
m)
Distance from center (cm)
Top surface before test
Top surface after test
Subgrade profile after test

64
Figure 3.53 DCP test data for 23 cm thick T3 geogrid-reinforced base
Figure 3.54 Permanent displacement of the loading plate versus the number of cycle for 23 cm thick T3 geogrid-reinforced base
0
5
10
15
20
25
30
0 1 2 3 4 5 6 7D
epth
(in
)Penetration Index (in/blow)
Test 1
Test 2
Test 3
Test 4
Average
0
10
20
30
40
50
60
70
80
90
0 50 100 150 200 250 300 350 400 450
Per
man
ent
dis
pla
cem
ent
(mm
)
Number of cycle
T3

65
Figure 3.55 Maximum vertical stresses at the center and the interface between
the base and the subgrade for 23 cm thick T3 geogrid-reinforced base
Figure 3.56 Surface profiles for 23 cm thick T3 geogrid-reinforced base
0
20
40
60
80
100
120
140
0 100 200 300 400
Max
imu
m v
erti
cal
stre
ss a
t ce
nte
r (k
Pa)
Number of cycle
T3
-35
-30
-25
-20
-15
-10
-5
0
5
10
-100 -50 0 50 100
Dep
th b
elo
w t
op
su
rfac
e (c
m)
Distance from center (cm)
Top surface before test
Top surface after test
Subgrade profile after test

66
3.4.11 30 cm thick unreinforced base
Figures 3.57, 3.58, 3.59, and 3.60 show the results of DCP penetration index profiles,
the permanent displacement of the loading plate versus the number of cycle, the
maximum vertical stress at the center and the interface between the base and the
subgrade, and the surface profiles of the 30 cm thick unreinforced base over the weak
subgrade.
Figure 3.57 DCP test data for 30 cm thick unreinforced base
0
5
10
15
20
25
30
0 1 2 3 4 5 6 7
Dep
th (
in)
Penetration Index (in/blow)
Test 1
Test 2
Test 3
Test 4
Average

67
Figure 3.58 Permanent displacement of the loading plate vs. the number of cycle for 30 cm thick unreinforced base
Figure 3.59 Maximum vertical stresses at the center and the interface between the base course and the subgrade for 30 cm thick unreinforced base
0
10
20
30
40
50
60
70
80
90
0 30 60 90 120 150
Per
man
ent
dis
pla
cem
ent
(mm
)
Number of cycle
Unreinforced
0
20
40
60
80
100
120
0 30 60 90 120 150
Max
imu
m v
erti
cal
stre
ss a
t ce
nte
r (k
Pa)
Number of cycle
Unreinforced

68
Figure 3.60 Surface profiles for 30 cm thick unreinforced base
3.4.12 30 cm thick base reinforced with T1 geogrid
Figures 3.61, 3.62, 3.63, and 3.64 show the results of DCP penetration index profiles,
the permanent displacement of the loading plate versus the number of cycle, the
maximum vertical stress at the center and the interface between the base and the
subgrade, and the surface profiles of the 30 cm thick T1 geogrid-reinforced base over
the weak subgrade.
-45
-40
-35
-30
-25
-20
-15
-10
-5
0
5
10
-100 -50 0 50 100
Dep
th b
elo
w t
op
su
rfac
e (c
m)
Distance from center (cm)
Top surface before test
Top surface after test
Subgrade profile after test

69
Figure 3.61 DCP test data for 30 cm thick T1 geogrid-reinforced base
Figure 3.62 Permanent displacement of the loading plate versus the number of
cycle for 30 cm thick T1 geogrid-reinforced base
0
5
10
15
20
25
30
0 1 2 3 4 5 6 7 8D
epth
(in
)Penetration Index (in/blow)
Test 1
Test 2
Test 3
Test 4
Average
0
10
20
30
40
50
60
70
80
90
0 30 60 90 120 150 180
Per
man
ent
dis
pla
cem
ent
(mm
)
Number of cycle
T1

70
Figure 3.63 Maximum vertical stresses at the center and the interface between the base and the subgrade for 30 cm thick T1 geogrid-reinforced base
Figure 3.64 Surface profiles for 30 cm thick T1 geogrid-reinforced base
0
20
40
60
80
100
120
0 30 60 90 120 150 180
Max
imu
m v
erti
cal
stre
ss a
t ce
nte
r (k
Pa)
Number of cycle
T1
-45
-40
-35
-30
-25
-20
-15
-10
-5
0
5
10
-100 -50 0 50 100
Dep
th b
elo
w t
op
su
rfac
e (c
m)
Distance from center (cm)
Top surface before test
Top surface after test
Subgrade profile after test

71
3.4.13 30 cm thick base reinforced with T2 geogrid
Figures 3.65, 3.66, 3.67, and 3.68 show the results of DCP penetration index profiles,
the permanent displacement of the loading plate versus the number of cycle, the
maximum vertical stress at the center and the interface between the base and the
subgrade, and the surface profiles of the 30 cm thick T2 geogrid-reinforced base over
the weak subgrade.
Figure 3.65 DCP test data for 30 cm thick T2 geogrid-reinforced base
0
5
10
15
20
25
30
0 1 2 3 4 5 6
Dep
th (
in)
Penetration Index (in/blow)
Test 1
Test 2
Test 3
Test 4
Average

72
Figure 3.66 Permanent displacement of the loading plate versus the number of cycle for 30 cm thick T2 geogrid-reinforced base
Figure 3.67 Maximum vertical stresses at the center and the interface between
the base and the subgrade for 30 cm thick T2 geogrid-reinforced base
0
10
20
30
40
50
60
70
80
90
0 50 100 150 200 250 300 350
Per
man
ent
dis
pla
cem
ent
(mm
)
Number of cycle
T2
0
20
40
60
80
100
120
0 50 100 150 200 250 300 350
Max
imu
m v
erti
cal
stre
ss a
t ce
nte
r (k
Pa)
Number of cycle
T2

73
Figure 3.68 Surface profile for 30 cm thick T2 geogrid-reinforced base
3.4.14 30 cm thick base reinforced with T3 geogrid
Figures 3.69, 3.70, 3.71, and 3.72 show the results of DCP penetration index profiles,
the permanent displacement of the loading plate versus the number of cycle, the
maximum vertical stress at the center and the interface between the base and the
subgrade, and the surface profiles of the 30 cm thick T3 geogrid-reinforced base over
the weak subgrade.
-45
-40
-35
-30
-25
-20
-15
-10
-5
0
5
10
-100 -50 0 50 100
Dep
th b
elo
w t
op
su
rfac
e (c
m)
Distance from center (cm)
Top surface before test
Top surface after test
Subgrade profile after test

74
Figure 3.69 DCP test data for 30 cm thick T3 geogrid-reinforced base
Figure 3.70 Permanent displacement of the loading plate versus the number of cycle for 30 cm thick T3 geogrid-reinforced base
0
5
10
15
20
25
30
0 1 2 3 4 5D
epth
(in
)Penetration Index (in/blow)
Test 1
Test 2
Test 3
Test 4
Average
0
10
20
30
40
50
60
70
80
90
0 200 400 600 800 1000 1200 1400 1600 1800
Per
man
ent
dis
pla
cem
ent
(mm
)
Number of cycle
T3

75
Figure 3.71 Maximum vertical stresses at the center and the interface between the base and the subgrade for 30 cm thick T3 geogrid-reinforced base
Figure 3.72 Surface profiles for 30 cm thick T3 geogrid-reinforced base
Test data for other tests will be provided in Chapter 4.
0
10
20
30
40
50
60
70
80
90
100
0 300 600 900 1200 1500 1800
Max
imu
m v
erti
cal
stre
ss a
t ce
nte
r (k
Pa)
Number of cycle
T3
-45
-40
-35
-30
-25
-20
-15
-10
-5
0
5
10
-100 -50 0 50 100
Dep
th b
elo
w t
op
su
rfac
e (c
m)
Distance from center (cm)
Top surface before test
Top surface after test
Subgrade profile after test

76
Chapter 4 DATA ANALYSIS
4.1 CBR Calculations
The California Bearing Ratios (CBR) for the bases and the subgrades in the box tests
were estimated based on the DCP penetration indices using Eq. (3.2)
4.2 Repeatability
In order to verify the repeatability of the test method, three repeated experiments were
conducted for two reinforced sections with T1 and T2 geogrids at 23 cm and 30 cm
thick base courses, respectively. The density and stiffness of base courses and
subgrade were controlled by DCP and vane shear tests. Figures 4.1 and 4.2 show the
comparisons of the CBR profiles and the curves of the permanent displacement vs. the
number of cycle between the original and repeated experiments for 23cm thick T1
geogrid-reinforced bases. Figure 4.1 shows that the CBR values for both sections
are close. The curves of the permanent displacement vs. the number of cycle for
these two sections are also close. In the repeated experiment for 23 cm thick T1
geogrid-reinforced bases, the pressure cell placed at center was broken, so the
comparison between maximum vertical stress vs. the number of cycle for the repeated
test and original test is not possible.

77
Figure 4.1 CBR profiles for 23cm thick T1 geogrid-reinforced base courses
Figure 4.2 Permanent displacements of the loading plate versus the number of
cycles for 23cm thick T1 geogrid-reinforced base courses
0
10
20
30
40
50
60
70
0 5 10 15 20 25 30 35
Dep
th (
cm)
CBR
T1
T1(repeated)
Base
0
10
20
30
40
50
60
70
80
90
0 20 40 60 80 100 120
Per
man
ent
dis
pla
cem
ent
(mm
)
Number of cycle
T1
T1 (repeated)

78
Figures 4.3, 4.4, and 4.5 show the comparisons of the CBR profiles, the curves of the
permanent displacement vs. the number of cycle, and the maximum vertical stresses at
the center between the original and repeated experiments for 30cm thick T1
geogrid-reinforced bases. These figures show that all the test results are close for the
original and repeated experiments.
Figure 4.3 CBR profile for T2-reinforced base course at 30 cm thickness
0
10
20
30
40
50
60
70
0 10 20 30 40 50
Dep
th (
cm)
CBR
T2
T2 (repeated)
Base

79
Figure 4.4 Permanent displacement of the loading plate versus the number of cycles for T2-reinforced 30 cm thick base course
Figure 4.5 Maximum vertical stresses at center versus the number of cycles for T2-reinforced 30 cm thick base course
0
10
20
30
40
50
60
70
80
90
0 50 100 150 200 250 300 350 400
Per
man
ent
dis
pla
cem
ent
at c
ente
r (m
m)
Number of cycle
T2
T2 (repeated)
0
20
40
60
80
100
120
0 100 200 300 400
Max
imu
m v
erti
cal
stre
ss a
t ce
nte
r (k
Pa)
Number of cycle
T2
T2 (repeated)

80
The comparisons of the above two pairs of original and repeated tests demonstrate
that the test method used in this study is appropriate and repeatable. When the CBR
values of the base course and the subgrade for two tests are close, the performance of
these two test sections is similar. The small difference in the permanent
displacement and/or the maximum vertical stress can be explained by the deviation of
the CBR value in the base and/or the subgrade. The base course with a higher CBR
value could sustain more loading cycles and transferred less vertical stress onto the
subgrade as compared with the base course with a lower CBR value.
4.3 Consistency of CBR Profiles
It was designed that the test sections would have a 20% CBR base course over a 2%
CBR subgrade except for those used for investigating the effects of base and subgrade
CBR values. Figures 4.6, 4.7, and 4.8 provide the CBR profiles for those tests
having the same base thickness (15, 23, or 30cm). All three figures show that the
average CBR values for the bases were approximately 20% and those for the
subgrades were approximately 2%. The base materials within 5cm above the top of
the subgrade had lower CBR values because the subgrade was too weak to ensure the
proper compaction within this range.

81
Figure 4.6 CBR profiles for 15 cm thick base courses
Figure 4.7 CBR profiles for 23 cm thick base courses
0
10
20
30
40
50
60
70
0 5 10 15 20 25 30 35 D
epth
(cm
)
CBR
Unreinforced
T1
T2
T3
Base
0
10
20
30
40
50
60
70
0 5 10 15 20 25 30 35
Dep
th (
cm)
CBR
Unreinforced
T1
T2
T3
Base

82
Figure 4.8 CBR profiles for 30 cm thick base courses
4.4 Displacement Analysis
4.4.1 Permanent displacement
A permanent displacement of 75 mm for the loading plate was used as the criterion to
terminate the cyclic loading test. Figures 4.9, 4.10, and 4.11 present the permanent
displacements of the loading plate versus the number of loading cycles for the
unreinforced and reinforced bases by T1, T2, and T3 geogrids at the base course
thickness of 15, 23, and 30 cm, respectively. It is shown that the permanent
displacement increased with the number of cycles. At the same thickness, the
reinforced bases had less permanent deformation than the unreinforced bases at the
0
10
20
30
40
50
60
70
0 10 20 30 40 50 D
epth
(cm
)CBR
Unreinforced
T1
T2
T3
Base

83
same cycle. The permanent deformation increased more slowly for the reinforced
bases than the unreinforced bases. The heavy-duty geogrid, T3, was more effective
in reducing the permanent deformation and the rate of deformation increase than the
medium-duty geogrid, T2, and regular-duty geogrid, T1 geogrid and the unreinforced
bases. It is also shown that the permanent displacements for all the bases are similar
at the initial few cycles because the geogrid was not mobilized at small displacements.
With an increase of the number of loading cycles, the benefit of geogrids became
more obvious.
Figure 4.9 Permanent displacement of the loading plate versus the number of
cycle (base thickness = 15 cm)
0
10
20
30
40
50
60
70
80
90
0 5 10 15 20 25 30 35 40 45 50 55 60 65 70 75 80
Per
man
ent
dis
pla
cem
ent
(mm
)
Number of cycle
Unreinforced
T1
T2
T3

84
Figure 4.10 Permanent displacement of the loading plate versus the number of cycle (base thickness = 23 cm)
Figure 4.11 Permanent displacement of the loading plate versus the number of cycle (base thickness = 30 cm)
0
10
20
30
40
50
60
70
80
90
0 50 100 150 200 250 300 350 400 450
Per
man
ent
dis
pla
cem
ent
(mm
)
Number of cycle
Unreinforced
T1
T2
T3
0
10
20
30
40
50
60
70
80
90
0 200 400 600 800 1000 1200 1400 1600 1800
Per
man
ent
dis
pla
cem
ent
(mm
)
Number of cycles
Unreinforced
T1
T2
T3

85
In order to demonstrate the benefit of the geogrids, an improvement factor is defined
here as the ratio of the number of cycles for the reinforced base over the number of
cycles for the unreinforced base at the same permanent displacement of 75 mm. The
improvement factor can be expressed as below:
N
(4.1)
where = the number of cycles for the reinforced base at the permanent
displacement of 75 mm; = the number of cycles for the unreinforced
base at the permanent displacement of 75 mm.
At 15 cm base thickness, the numbers of cycles for the unreinforced, T1, T2, and T3,
geogrid-reinforced bases at the permanent displacement of 75 mm were 35, 55, 66,
and 78, respectively. Therefore, the improvement factors for the T1, T2, and T3,
geogrids were 1.57, 1.88, and 2.23, respectively.
At 23 cm base thickness, the numbers of cycles for the unreinforced, T1, T2, and T3
geogrid-reinforced bases at the permanent displacement of 75 mm were 57, 85, 176,
and 447, respectively. Therefore, the improvement factors for T1, T2, and T3
geogrids were 1.49, 3.09, and 7.84, respectively.
At 30 cm base thickness, the numbers of cycles for the unreinforced, T1, T2, and T3

86
geogrid-reinforced bases at the permanent displacement of 75 mm were 122, 177, 312,
and 1580, respectively. Therefore, the improvement factors for T1, T2, and T3
geogrids were 1.45, 2.56, and 12.95, respectively.
Overall, T3 geogrid performed the best for all three base thicknesses. The
performance of the geogrids from the best to the least is T3, T2, and T1, which is the
same order as the levels of robustness, unit weight, rib thicknesses, and mechanical
properties of these geogrids, and as expected for this specific family of geogrid
products.
4.4.2 Resilient displacement
Figures 4.12, 4.13, and 4.14 present the percentage of resilient displacement at each
loading cycle for the unreinforced and reinforced bases. The percentage of resilient
displacement was calculated as the rebound divided by the total displacement in each
cycle. Overall, the percentage of resilient displacement increased nonlinearly for
both unreinforced and reinforced bases. For geogrid-reinforced bases, the
percentage of resilient displacement reached as high as 90% to 99% of the total
displacement for each cycle. However, for unreinforced bases, the percentage of
resilient displacement was much lower. Therefore, the geogrids significantly
increased the percentage of resilient displacement as compared with the unreinforced
base. In other words, the reinforced bases are more resilient than the unreinforced
base.

87
Figure 4.12 Percentage of resilient displacement of the loading plate versus the
number of cycles (base thickness = 15 cm)
Figure 4.13 Percentage of resilient displacement of the loading plate versus the number of cycles (base thickness = 23 cm)
0
10
20
30
40
50
60
70
80
90
100
0 5 10 15 20 25 30 35 40 45 50 55 60 65 70 75 80
Per
cen
tag
e o
f re
silli
ent
dis
pla
cem
ent
Number of cycle
Unreinforced
T1
T2
T3
0
10
20
30
40
50
60
70
80
90
100
0 50 100 150 200 250 300 350 400 450
Per
cen
tag
e o
f re
silie
nt
dis
pla
cem
ent
Number of cycle
Unreinforced
T1
T2
T3

88
Figure 4.14 Percentage of resilient displacement of the loading plate versus the number of cycles (base thickness = 30 cm)
4.5 Stress Analysis
4.5.1 Maximum vertical stress
For each test, vertical stresses at the interface between the base course and the
subgrade were measured at four different distances from the center, 0, 25, 50, and 75
cm. Figures 4.15, 4.16, and 4.17 presents the measured maximum vertical stresses
located along the center of the loading plate. It is clear that the initial maximum
vertical stresses for all tests were close to each other. However, the maximum
vertical stresses increased faster for the unreinforced bases than the reinforced bases.
When the more robust, thicker and higher mechanical property geogrid was used, the
maximum vertical stresses increased more slowly than when the less robust, thinner
and lower mechanical property geogrid was used. It should be noted though that
0
10
20
30
40
50
60
70
80
90
100
0 200 400 600 800 1000 1200 1400 1600 1800
Per
cen
tag
e o
f re
silie
nt
dis
pla
cem
ent
Number of cycle
Unreinforced
T1
T2
T3

89
there is likely a point of optimum for all of the various geogrid properties and the
property compatibility between the geogrid and the soil being reinforced is important.
The test results also show that the unreinforced base had the highest maximum
vertical stress at each base thickness. The lower maximum vertical stresses in the
reinforced bases are attributed to the benefit of the geogrids on increasing the stress
distribution angle. The base reinforced by the T3 geogrid had a larger distribution
angle than that reinforced by the T2 geogrid, which had a larger distribution angle
than that reinforced by the T1 geogrid. More discussion on the stress distribution
will be presented later. Figures 4.15, 4.16, and 4.17 also show that the maximum
vertical stresses increased with the number of cycles, which is in good agreement with
the finding by Gabr (2001). The increase in the maximum vertical stress with the
number of cycles was explained by Giroud and Han (2004a) as the reduction of the
stress distribution angle due to the deterioration of the base course.
It is also found in Figure 4.15 that the maximum vertical stresses decreased after
reaching the peak values (around 20 to 30 cycles) for all the reinforced bases. This
reduction may result from the establishment of a stabilized composite between the
geogrid and the base materials. The stabilized composite has improved stiffness and
load spread capabilities, and significantly enhanced ductility which leads to decreased
stress on the subgrade. Another contributing factor may be the tensioned membrane
effect provided by the geogrid alone. However, the tensioned membrane effect only
influences the performance of the reinforced base after large displacements, such as

90
100 mm or more (Giroud and Han, 2004b) and does not govern performance in the
low deformation ranges. However, this effect may play a greater role at a smaller
displacement when the base course is relatively thin. When the base course is
thicker, the influence of the tensioned membrane effect becomes less. Figures 4.16
and 4.17 do not show obvious peaks of the maximum vertical stresses for the
unreinforced and reinforced bases. In other words, when the base course was thicker,
the tensioned membrane effect became less significant to reduce the vertical stress
and the stabilized composite effects dominate.
Figures 4.16 and 4.17 also show that the maximum vertical stresses increased rapidly
after a certain loading cycle. This phenomenon may be because that the base course
deteriorated to a certain stage and the base course itself could not sustain the vertical
stress anymore. After this cycle, the unpaved section approached to the failure
quickly. A further study is needed to verify this phenomenon.

91
Figure 4.15 Maximum vertical stresses at the interface between the base and the subgrade (base thickness = 15 cm)
Figure 4.16 Maximum vertical stresses at the interface between the base and the
subgrade (base thickness = 23 cm)
0
50
100
150
200
250
1 10 100
Max
imu
m v
erti
cal
stre
ss a
t ce
nte
r (k
Pa)
Number of cycle
Unreinforced
T1
T2
T3
0
50
100
150
200
1 10 100 1000
Max
imu
m v
erti
cal
stre
ss a
t ce
nte
r (k
Pa)
Number of cycle
Unreinforced
T1
T2
T3

92
Figure 4.17 Maximum vertical stresses at the interface between the base and the subgrade (base thickness = 30 cm)
4.5.2 Stress distribution
The measured vertical stresses at different distances from the center during cyclic
loading can be plotted to show their distributions. Figures 4.18, 4.19, and 4.20
present the distributions of the vertical stresses at the interface between the base and
the subgrade for the unreinforced and T1, T2, and T3 geogrid-reinforced base courses
at base thicknesses of 15, 23, and 30cm, respectively. It is shown that the geogrids
reduced the maximum vertical stresses at the center and transferred the vertical load to
a wider area as compared with the unreinforced bases.
The test results show that the different grades of geogrids within the triangular
aperture geogrid family affected the stress distribution. The more robust, thicker and
higher mechanical property geogrids helped distribute the stresses more uniformly
0
20
40
60
80
100
120
1 10 100 1000 10000
Max
imu
m v
erti
cal
stre
ss a
t ce
nte
r (k
Pa)
Number of cycle
Unreinforced
T1
T2
T3

93
thus reducing the maximum vertical stresses and resulting in less displacement of the
subgrade.
Stress distribution was also influenced by the properties of the base course. The
stiffer base course (i.e., higher CBR) could distribute the load to a wider area.
Further discussion on the influence of the stiffness of the base course will be
addressed later in this chapter.
Figure 4.18 Vertical stress distributions at 30th load cycle (base thickness = 15 cm)

94
Figure 4.19 Vertical stress distributions at 60th load cycle (base thickness = 23
cm)
Figure 4.20 Vertical stress distributions at 90th load cycle (base thickness = 30
cm)
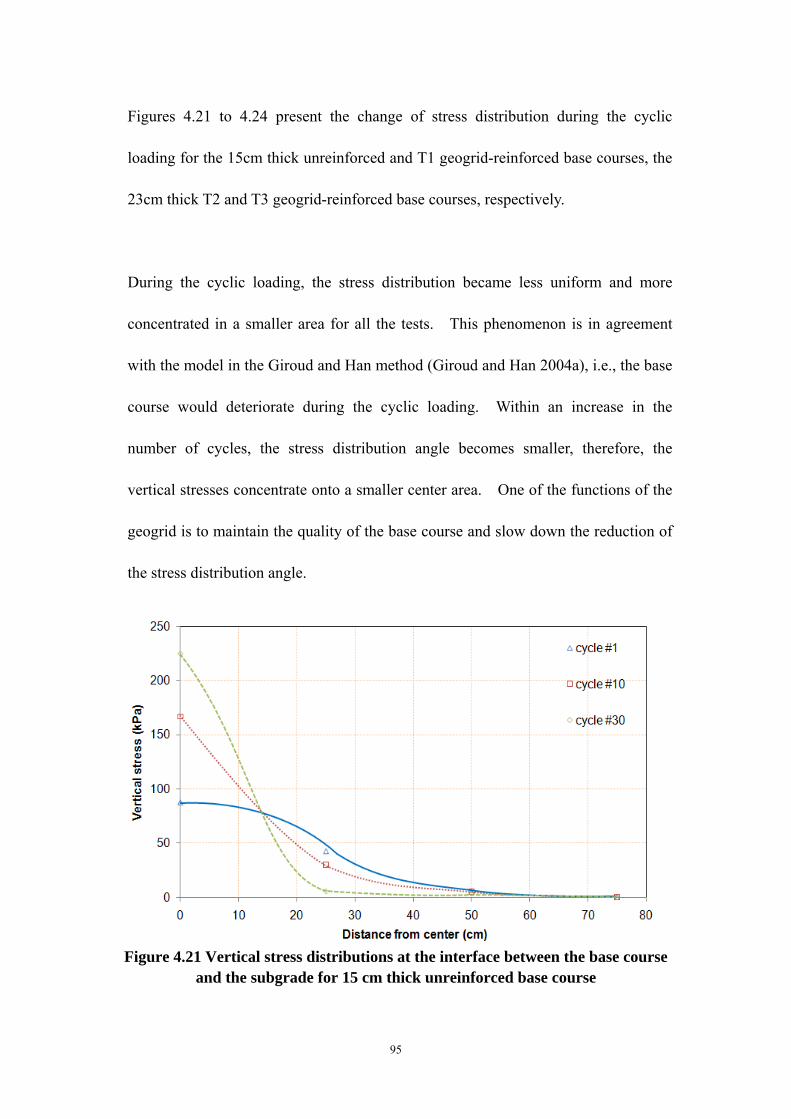
95
Figures 4.21 to 4.24 present the change of stress distribution during the cyclic
loading for the 15cm thick unreinforced and T1 geogrid-reinforced base courses, the
23cm thick T2 and T3 geogrid-reinforced base courses, respectively.
During the cyclic loading, the stress distribution became less uniform and more
concentrated in a smaller area for all the tests. This phenomenon is in agreement
with the model in the Giroud and Han method (Giroud and Han 2004a), i.e., the base
course would deteriorate during the cyclic loading. Within an increase in the
number of cycles, the stress distribution angle becomes smaller, therefore, the
vertical stresses concentrate onto a smaller center area. One of the functions of the
geogrid is to maintain the quality of the base course and slow down the reduction of
the stress distribution angle.
Figure 4.21 Vertical stress distributions at the interface between the base course
and the subgrade for 15 cm thick unreinforced base course
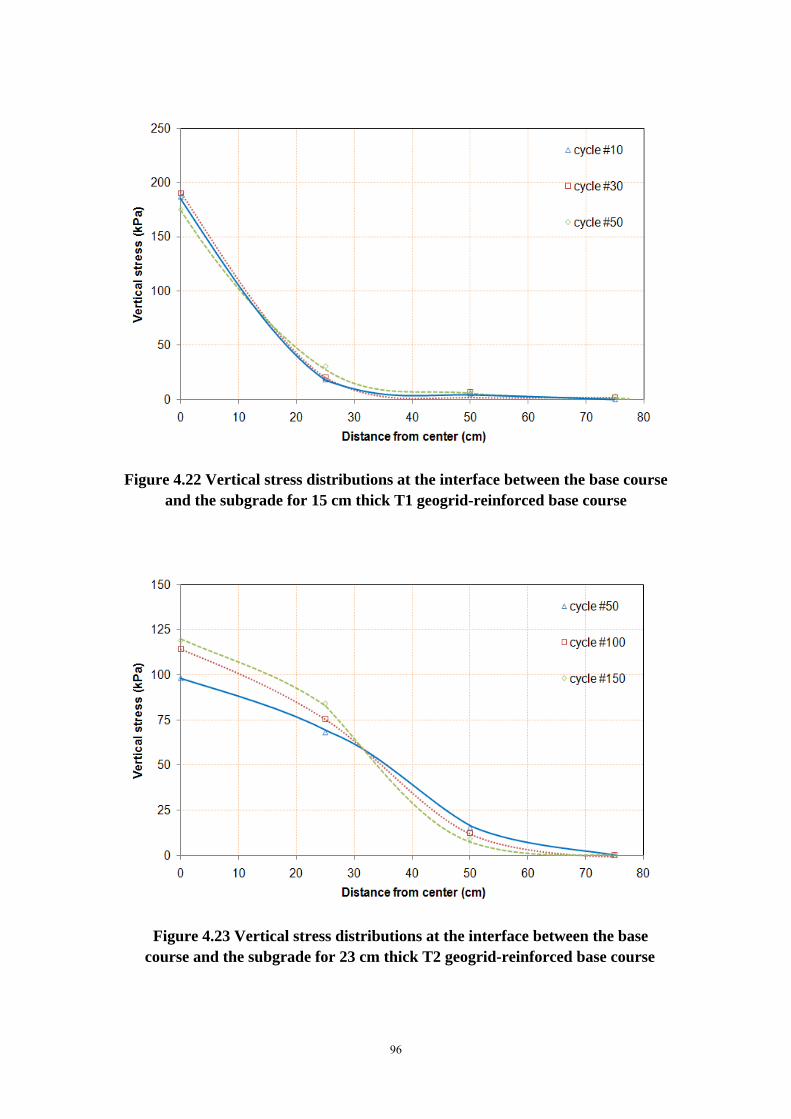
96
Figure 4.22 Vertical stress distributions at the interface between the base course and the subgrade for 15 cm thick T1 geogrid-reinforced base course
Figure 4.23 Vertical stress distributions at the interface between the base course and the subgrade for 23 cm thick T2 geogrid-reinforced base course
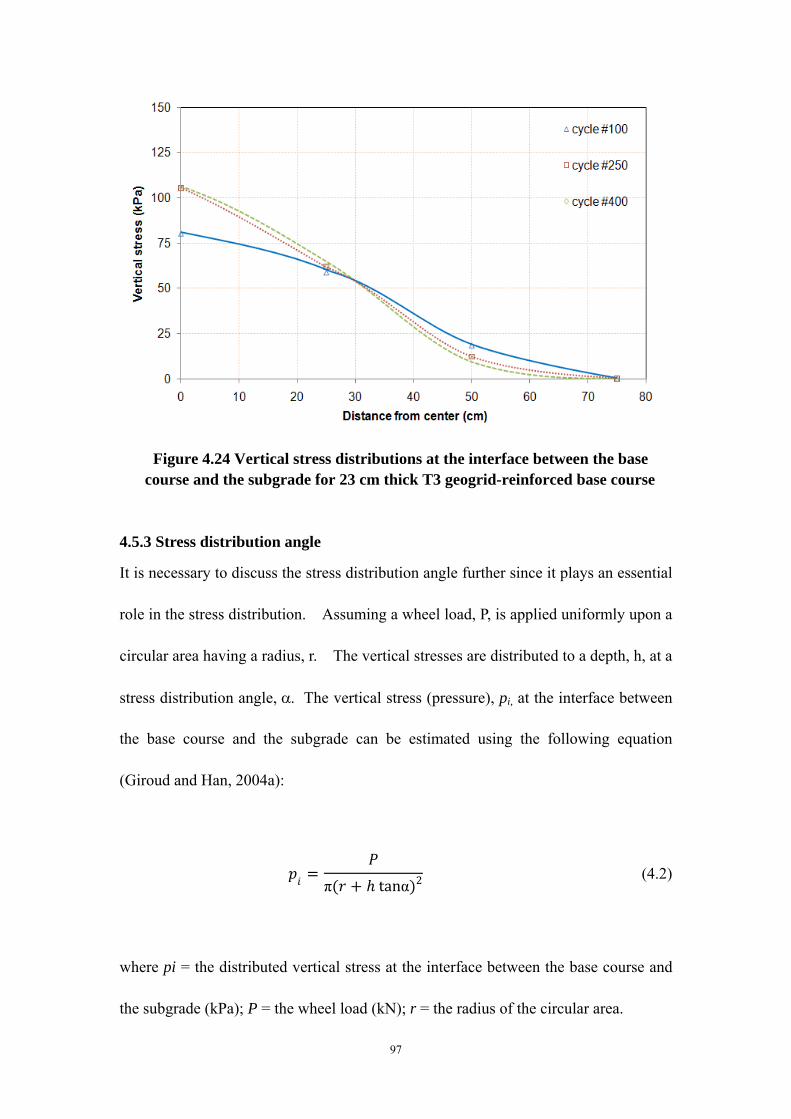
97
Figure 4.24 Vertical stress distributions at the interface between the base course and the subgrade for 23 cm thick T3 geogrid-reinforced base course
4.5.3 Stress distribution angle
It is necessary to discuss the stress distribution angle further since it plays an essential
role in the stress distribution. Assuming a wheel load, P, is applied uniformly upon a
circular area having a radius, r. The vertical stresses are distributed to a depth, h, at a
stress distribution angle, The vertical stress (pressure), pi, at the interface between
the base course and the subgrade can be estimated using the following equation
(Giroud and Han, 2004a):
π tanα 2 (4.2)
where pi = the distributed vertical stress at the interface between the base course and
the subgrade (kPa); P = the wheel load (kN); r = the radius of the circular area.

98
According to the measured maximum vertical stress at the interface, the applied wheel
load, and the plate diameter, the stress distribution angle can be calculated for each
cycle during the cyclic loading tests. Figures 4.25, 4.26, and 4.27 show the
relationships between the reciprocal of the tangential values of the stress distribution
angles and the number of cycles. The initial values of 1/tan (for all the testsare
close to one and increase nearly linearly with the increase of the number of cycles.
The deviation of the initial value of 1/tan (may be caused by the slight difference in
the initial stiffness of the base course and the subgrade. The contribution of the
geogrid to the initial stress distribution angle is minimal because the base course is not
fully engaged within the apertures of the geogrid. These figures show that the base
courses with greater thicknesses had higher initial stress distribution angles. The
unreinforced base course had the similar initial stress distribution angle as the
geogrid-reinforced base courses. However, the stress distribution angles for the
unreinforced bases decreased with the number of cycles faster than those for the
reinforced bases. In this case the vertical stress for the unreinforced base course
was concentrated near the center of the plate, which is consistent with the results
discussed earlier in the stress analysis. In addition, the heavy-duty geogrid T3
reduced the rate of reduction in the stress distribution angle, which led to the slow
increase in the vertical stress at the center. The reduction of the value of 1/tan
(presented in Figure 4.25 can be explained by the mechanically stabilized layer
effect and the tensioned membrane effect as discussed in Section 4.3.1.
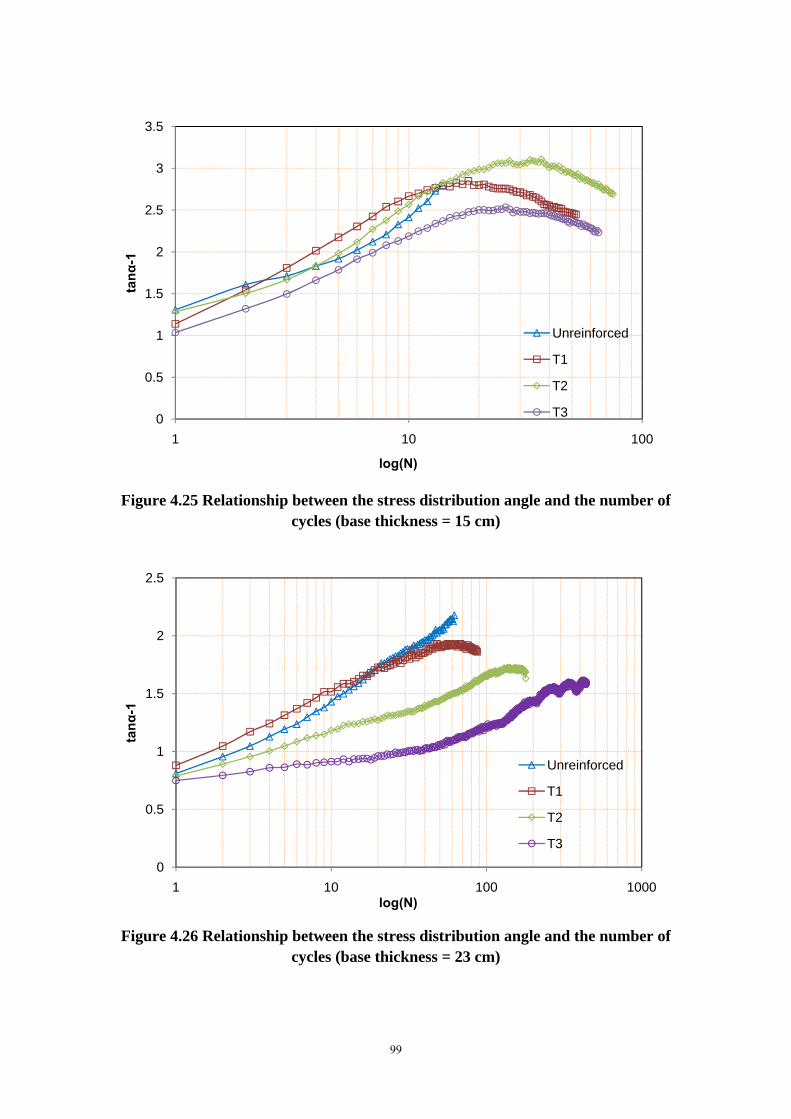
99
Figure 4.25 Relationship between the stress distribution angle and the number of cycles (base thickness = 15 cm)
Figure 4.26 Relationship between the stress distribution angle and the number of
cycles (base thickness = 23 cm)
0
0.5
1
1.5
2
2.5
3
3.5
1 10 100
tanα
-1
log(N)
Unreinforced
T1
T2
T3
0
0.5
1
1.5
2
2.5
1 10 100 1000
tanα
-1
log(N)
Unreinforced
T1
T2
T3

100
Figure 4.27 Relationship between the stress distribution angle and the number of cycles (base thickness = 30 cm)
4.5.4 Modulus analysis
The above analyses show that during the cyclic loading, the quality of the base course
deteriorated thus resulting in a reduction in the stress distribution angle. A further
study on the deterioration of the base course is presented below. Some previous
studies considered the geosynthetic reinforcement being equivalent to the increase in
the thickness of the base course (for example, Giroud and Noiray, 1981). In this
study, however, the benefit from the geosynthetic reinforcement is considered
increasing the modulus of the base course. Before Boussinesq’s solution is used,
Odemark’s method (Ullidtz, 1987) can be employed to transform a two-layer system
(i.e., the base course and the subgrade) into an equivalent homogenous system. From
the following formula, the equivalent thickness can be calculated:
0
0.5
1
1.5
2
1 10 100 1000 10000
tanα
-1
log(N)
Unreinforced
T1
T2
T3

101
11
(4.3)
where, h = the thickness of the base course; he = the equivalent thickness; Ebc = the
elastic modulus of the base course; Esg = the elastic modulus of the subgrade; =
Poisson’s ratio of the base course ( = 0.3 was chosen in this study); and =
Poisson’s ratio of subgrade ( = 0.5 was chosen in this study).
Based on the measured vertical stress at the center and the interface between the base
course and the subgrade, the equivalent thickness of the base course can be calculated
using the following Boussinesq solution and then the modulus of the base course can
be estimated using Eq. (4.3) if the modulus of the subgrade is known.
1.
(4.4)
where, = the vertical stress at the interface between the base course and the
subgrade (kPa); he = the equivalent thickness; = the contact pressure on the the
surface (kPa); and = the radius of the equivalent tire contact area (m).
To obtain the modulus of the subgrade, four cyclic loading tests were conducted with
the same test equipment and material for the subgrade. Figures 4.28 to 4.31 show

102
the test results for these tests. In these cyclic loading tests, there were no base course
and geogrid. The load was applied directly upon the subgrade by the 30cm diameter
rigid plate to investigate the resilient modulus of the subgrade. The resilient
modulus of the subgrade was calculated using the elastic solution presented in Harr
(1966):
1 (4.5)
where, = the elastic displacement, i.e., the rebound in each load cycle (m); =
the vertical stress applied on the subgrade (kPa); = Poisson’s ratio of the subgrade;
B = the diameter of the loading plate (m); I = the displacement influence factor; and
= the resilient modulus of the subgrade.
Each test was cyclically loaded until the modulus reached the constant. According
to all four tests, the average value of the resilient modulus of the subgrade was 37.16
MPa. Since the load was applied by a rigid plate, the resilient modulus under
flexible loading should be multiplied by a factor of 0.79, as indicated by Yoder and
Witczak (1975). Thus, the corrected resilient modulus of the subgrade is 29.36 MPa.

103
Figure 4.28 Resilient modulus of the subgrade versus the number of cycles under cyclic loading of 4 kN
Figure 4.29 Resilient modulus of the subgrade versus the number of cycles under
cyclic loading of 8 kN
0
10
20
30
40
50
60
70
80
90
0 20 40 60 80 100 120
Res
ilen
t m
od
ulu
s (k
Pa)
Number of cycle
0
10
20
30
40
50
60
70
80
90
0 50 100 150 200 250
Res
ilien
t m
od
ulu
s (k
Pa)
Number of cycle

104
Figure 4.30 Resilient modulus of the subgrade versus the number of cycles under cyclic loading of 12 kN
Figure 4.31 Resilient modulus of the subgrade versus the number of cycles under cyclic loading of 16 kN
0
10
20
30
40
50
60
70
80
90
0 100 200 300 400 500 600 700 800
Res
ilien
t m
od
ulu
s (k
Pa)
Number of cycle
0
10
20
30
40
50
60
70
80
90
0 100 200 300 400 500 600 700 800 900
Res
ilien
t m
od
ulu
s (k
Pa)
Number of cycle

105
To use the method of equivalent thickness, the following two requirements should be
met: (1) the upper layer should have a higher modulus than the lower layer. The
modulus ratio of the upper layer to the lower layer is recommend to be larger than 2.
(2) the equivalent thickness is preferred to be greater than the radius of the loading
plate to make the method more accurate (Ullidtz, 1987). The test conditions in this
study meet the preferred requirements for Odemark’s method. The calculated
modulus ratios versus the number of cycles are shown in Figures 4.32, 4.33, and 4.34
for base courses at the thicknesses of 15cm, 23cm, and 30cm, respectively.
Figure 4.32 Modulus ratio of the base course over the subgrade versus the number of cycles (base course thickness = 15 cm)
0
10
20
30
40
50
60
1 10 100
Eb
c/E
sg
Number of cycle
Unreinforced
T1
T2
T3

106
Figure 4.33 Modulus ratio of the base course over the subgrade versus the
number of cycles (base course thickness = 23 cm)
Figure 4.34 Modulus ratio of the base course over the subgrade versus the number of cycles (base course thickness = 30 cm)
0
10
20
30
1 10 100 1000
Eb
c/E
sg
Number of cycle
Unreinforced
T1
T2
T3
0
5
10
15
20
25
1 10 100 1000 10000
Eb
c/E
sg
Number of cycle
Unreinforced
T1
T2
T3

107
4.5.5 Effect of the properties of base course and subgrade soil on stress
distribution
Unpaved roads usually have a base course and a subgrade. The resilient modulus of
the base course is mostly higher than that of the subgrade. As demonstrated by
Burmister (1958) using the theory of elasticity, the vertical stress at the interface of
the base course and the subgrade decreases with the increase of the ratio of modulus
of the base course over the subgrade. In the Giroud and Han method (2004a), the
vertical stress at the interface between base course and subgrade was estimated based
on the Burmister solution for a two-layer system. The vertical stress increases with
the number of loading cycles due to the deterioration of the base course, which leads
to narrowing of the stress distribution area. However, the relationship between the
reduction of the stress distribution angle and the decrease of the modulus of the base
course needs a further investigation especially considering the use of triangular
aperture geogrids.
Figures 4.35, 4.36, and 4.37 present the correlation between the stress distribution
angle ratio and the modulus ratio during the cyclic loading for each test. Using the
statistical method, the influence of the ratio of modulus and the base course thickness,
the following correlation can be obtained:
tan
tan 1ec 1.78RE
0.47RH0.7 (4.6)

108
where tan = the tangential value of the distribution angle in cycle N; tan =
the tangential value of the distribution angle in first cycle; e = the base of
exponential function; c = the compaction influence factor, c ≈ 1 CBR
CBR, CBR =
the CBR value of the base course, CBR the CBR value of the unreinforced base
course; RE EE
, = the resilient modulus of the base course; = the
resilient modulus of the subgrade; RH HH
, = the thickness of the base course;
H = 15 cm. The R square value for Equation (4.6) is 0.94.
Figure 4.35 Relationship between the stress distribution angle and the modulus ratio (base course thickness = 15cm)
0
0.1
0.2
0.3
0.4
0.5
0.6
0.7
0.8
0.9
1
0 10 20 30 40 50
tan
(aN)/
tan
(a1)
RE
Unreinforced
T1
T2
T3
Unrenforced-calculated
T1-calculated
T2-calculated
T3-calculated
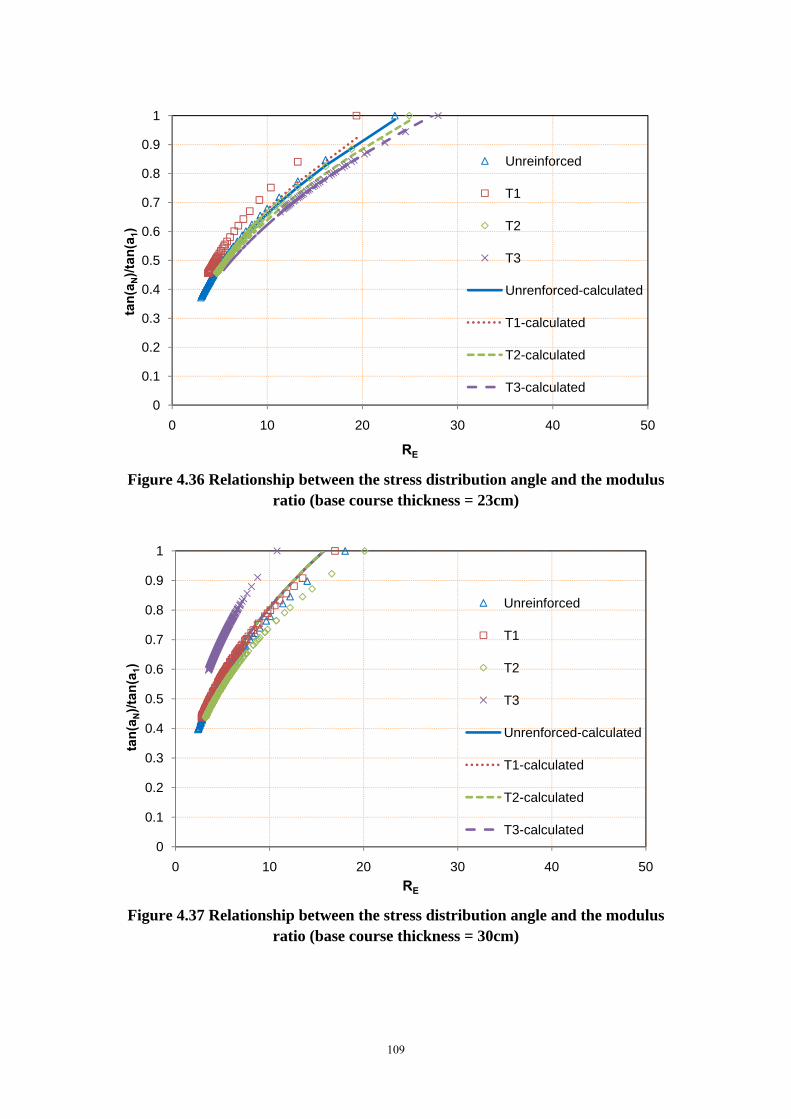
109
Figure 4.36 Relationship between the stress distribution angle and the modulus ratio (base course thickness = 23cm)
Figure 4.37 Relationship between the stress distribution angle and the modulus ratio (base course thickness = 30cm)
0
0.1
0.2
0.3
0.4
0.5
0.6
0.7
0.8
0.9
1
0 10 20 30 40 50
tan
(aN)/
tan
(a1)
RE
Unreinforced
T1
T2
T3
Unrenforced-calculated
T1-calculated
T2-calculated
T3-calculated
0
0.1
0.2
0.3
0.4
0.5
0.6
0.7
0.8
0.9
1
0 10 20 30 40 50
tan
(aN)/
tan
(a1)
RE
Unreinforced
T1
T2
T3
Unrenforced-calculated
T1-calculated
T2-calculated
T3-calculated

110
4.6 Influence of stiffness of base course on performance
In order to investigate the influence of the initial stiffness of the base course on the
performance, three additional tests were conducted for unreinforced, T2, and T3
geogrid-reinforced base courses. The thickness of all these base courses was 15cm.
The main difference between these three tests and other tests was that the base course
in these tests was compacted to approximately 5% CBR value while other tests had 20%
CBR for the base courses. The comparisons of the test results are shown in Figures
4.38, 4.39, and 4.40.
Figure 4.38 Permanent displacement of the loading plate versus the number of cycles for 15cm thick base courses with CBR=5% or 20%
0
10
20
30
40
50
60
70
80
90
0 5 10 15 20 25 30 35 40 45 50 55 60 65 70 75 80
Per
man
ent
dis
pla
cem
ent
(mm
)
Number of cycle
Unreinforced (CBR=5%)
T2 (CBR=5%)
T3 (CBR=5%)
Unreinforced (CBR=20%)
T2 (CBR=20%)
T3 (CBR=20%)

111
Figure 4.39 Percentage of resilient displacement of the loading plate versus the
number of cycles for 15cm thick base courses with CBR=5% or 20%
Figure 4.40 Maximum vertical stress at the interface between the base and the
subgrade for 15cm thick base course with CBR=5% or 20%
0
10
20
30
40
50
60
70
80
90
100
0 5 10 15 20 25 30 35 40 45 50 55 60 65 70 75 80
Per
cen
tag
e o
f re
silie
nt
dis
pla
cem
ent
Number of cycle
Unreinforced (CBR=5%)T2 (CBR=5%)T3 (CBR=5%)Unreinforced (CBR=20%)T2 (CBR=20%)T3 (CBR=20%)
0
50
100
150
200
250
300
350
0 10 20 30 40 50 60 70 80 90 100
Max
imu
m v
erti
cal
stre
ss a
t ce
nte
r (k
Pa)
Number of cycle
Unreinforced (CBR=5%)
T2 (CBR=5%)
T3 (CBR=5%)
Unreinforced (CBR=20%)
T2 (CBR=20%)
T3 (CBR=20%)

112
With an increase in the number of loading cycles, the benefit of geogrids became
more obvious. The tests with 20% CBR base courses resulted in less permanent
displacement, and higher percent of resilient displacement than those with 5% CBR
base courses. The dramatic difference in vertical stress between the 20% and 5%
CBR is due in part to the fact that the 20% CBR base course can better support the
applied loads and are subject to less degradation. However, unlike the control case,
the vertical stress decreases with increasing load cycles for the 20% CBR subgrade
soil. As such, Figure 4.40 demonstrates the potential short and long term benefits
associated with the inclusion of triangular aperture geogrid with aggregate base
courses and soft subgrade soils.
The numbers of cycles for the unreinforced, T2 and T3 geogrid-reinforced bases with
5% CBR at the permanent displacement of 75 mm were 14, 22, and 32, respectively.
Therefore, the improvement factors for T2 and T3 geogrids, defined as the ratio of the
number of cycles for the reinforced base to that for the unreinforced base at the
permanent displacement of 75 mm, were 1.57 and 2.29, respectively. As discussed
in Section 4.4.1, the 15cm thick T2 and T3 geogrid-reinforced base courses with 20%
CBR had the improvement factors of 1.88 and 2.23, respectively. This comparison
indicates that low stiffness or poorly compacted base course did not significantly
reduce the benefit of the triangular aperture geogrids. This result needs to be further
verified in the future study.
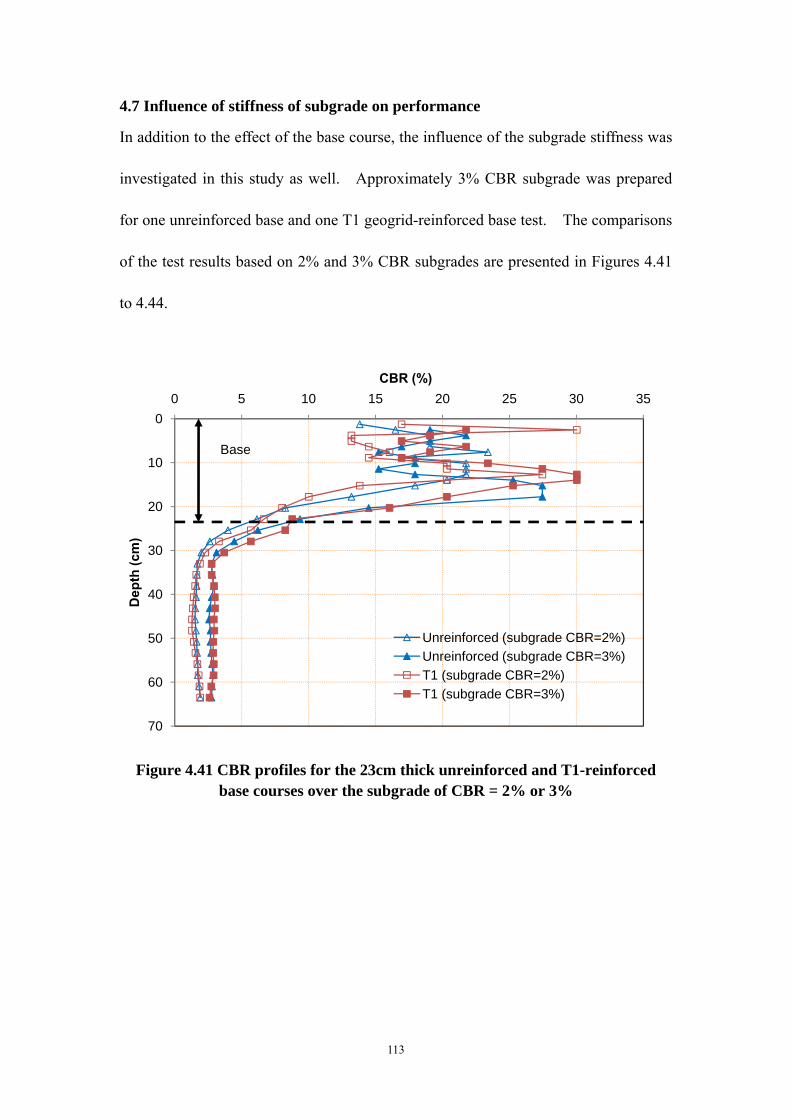
113
4.7 Influence of stiffness of subgrade on performance
In addition to the effect of the base course, the influence of the subgrade stiffness was
investigated in this study as well. Approximately 3% CBR subgrade was prepared
for one unreinforced base and one T1 geogrid-reinforced base test. The comparisons
of the test results based on 2% and 3% CBR subgrades are presented in Figures 4.41
to 4.44.
Figure 4.41 CBR profiles for the 23cm thick unreinforced and T1-reinforced base courses over the subgrade of CBR = 2% or 3%
0
10
20
30
40
50
60
70
0 5 10 15 20 25 30 35
Dep
th (
cm)
CBR (%)
Unreinforced (subgrade CBR=2%)
Unreinforced (subgrade CBR=3%)
T1 (subgrade CBR=2%)
T1 (subgrade CBR=3%)
Base

114
Figure 4.42 Permanent displacement of the loading plate versus the number of cycles for the 23cm thick base courses over the subgrade of CBR=2% or 3%
Figure 4.43 Percentage of resilient displacement of the loading plate versus the number of cycles for 23cm thick base courses over the subgrade of CBR=2% or
3%
0
10
20
30
40
50
60
70
80
90
0 50 100 150 200 250
Per
man
ent
Dis
pla
cem
ent
(mm
)
Number of cycle
Unreinforced (subgrade CBR=2%)
Unreinforced (subgrade CBR=3%)
T1 (subgrade CBR=2%)
T1 (subgrade CBR=3%)
0
20
40
60
80
100
0 50 100 150 200 250
Per
cen
tag
e o
f re
silli
ent
dis
pla
cem
ent
Number of cycle
Unreinforced (subgrade CBR=2%)
Unreinforced (subgrade CBR=3%)
T1 (subgrade CBR=2%)
T1 (subgrade CBR=3%)
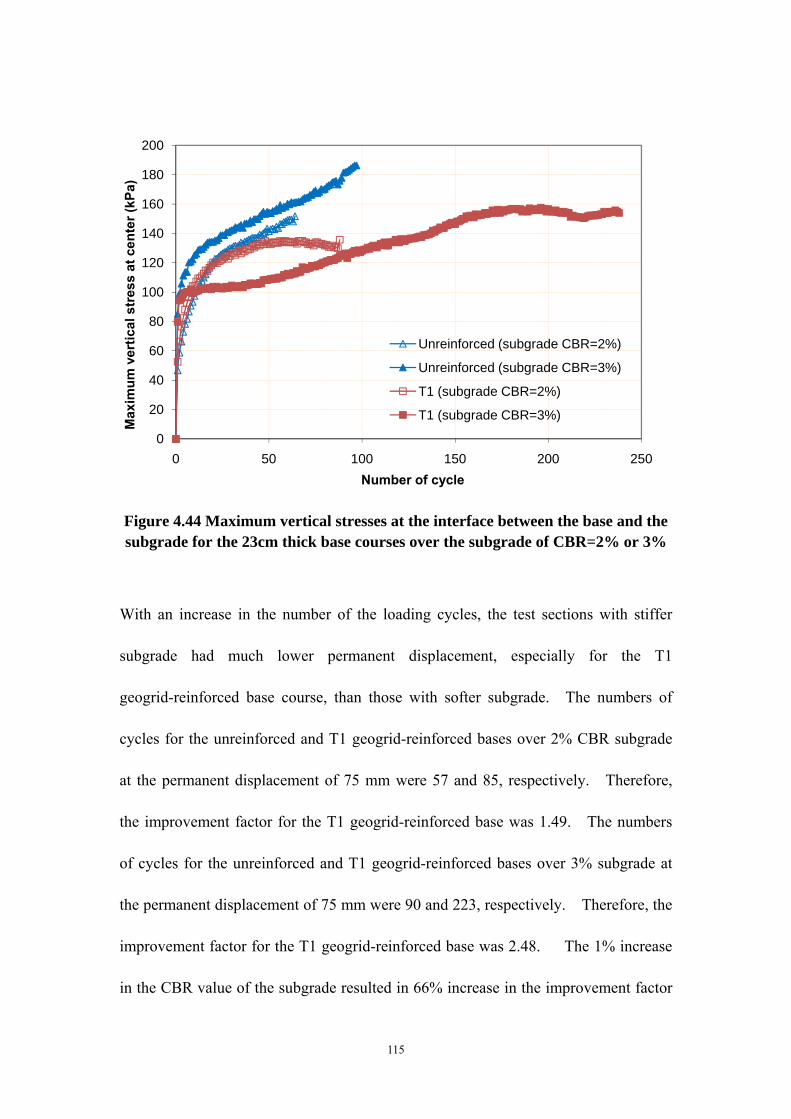
115
Figure 4.44 Maximum vertical stresses at the interface between the base and the subgrade for the 23cm thick base courses over the subgrade of CBR=2% or 3%
With an increase in the number of the loading cycles, the test sections with stiffer
subgrade had much lower permanent displacement, especially for the T1
geogrid-reinforced base course, than those with softer subgrade. The numbers of
cycles for the unreinforced and T1 geogrid-reinforced bases over 2% CBR subgrade
at the permanent displacement of 75 mm were 57 and 85, respectively. Therefore,
the improvement factor for the T1 geogrid-reinforced base was 1.49. The numbers
of cycles for the unreinforced and T1 geogrid-reinforced bases over 3% subgrade at
the permanent displacement of 75 mm were 90 and 223, respectively. Therefore, the
improvement factor for the T1 geogrid-reinforced base was 2.48. The 1% increase
in the CBR value of the subgrade resulted in 66% increase in the improvement factor
0
20
40
60
80
100
120
140
160
180
200
0 50 100 150 200 250
Max
imu
m v
erti
cal
stre
ss a
t ce
nte
r (k
Pa)
Number of cycle
Unreinforced (subgrade CBR=2%)
Unreinforced (subgrade CBR=3%)
T1 (subgrade CBR=2%)
T1 (subgrade CBR=3%)

116
for the T1 geogrid-reinforced bases. The comparison also shows that the stiffer
subgrade (CBR=3%) resulted in larger percentage of resilient displacement as
compared with the softer subgrade (CBR=2%). In other words, the stiffer subgrade
made the unpaved road section more resilient.

117
Chapter 5 CONCLUSION AND RECOMMENDATION
5.1 Summary
Past studies have shown that geogrids are an efficient and economical reinforcement
material for unpaved roads under static or cyclic loading. The main benefits of the
geogrid include base course reinforcement and subgrade stabilization. The
reinforcement effects include: interlock with aggregates, lateral confinement,
reduction of shear stress, tensioned membrane effect, and widened stress distribution.
However, the past studies on the reinforcement of the geogrid have been focused on
uniaxial or biaxial geogrids on weak subgrades. Research is needed on the
performance of triangular aperture geogrids under static and cyclic loadings over
weak subgrade.
This study was concentrated on the triangular aperture geogrid-reinforced unpaved
bases over weak subgrade under cyclic loading through laboratory plate loading
testing. Nineteen large-scale cyclic plate loading tests were conducted on granular
bases over weak subgrade in a large test box. Three types of triangular aperture
geogrids were used in this study for base courses of three different thicknesses. One
layer of geogrid was placed at the interface between the base and the subgrade in each
reinforced test section. Base courses of 5% or 20% CBR and subgrades of 2% or 3%
CBR were investigated. Main test results include the profiles of DCP penetration
index, the permanent displacement versus the number of cycle, the maximum vertical

118
stresses versus the number of cycles, and the surface profiles before and after each test.
Based on the test data, displacement, stress, and modulus analyses were conducted.
The relationship between the stress distribution angle and the ratio of modulus was
established.
5.2 Conclusions
Based on the test results and analyses, the following conclusions can be drawn from
this study:
1. Triangular aperture geogrids improved the performance of the reinforced base
course over the weak subgrade as compared with the unreinforced base.
2. Triangular aperture geogrids increased the percentage of the resilient displacement
of the total displacement.
3. Generally, the measured maximum vertical stresses at the interface between the
base and the subgrade increased with an increase in the number of load cycles.
4. Triangular aperture geogrids significantly reduced the maximum vertical stress at
the center of the plate transferred to the subgrade as compared with the
unreinforced base. This reinforced base resulted in a more uniform stress
distribution.
5. Triangular aperture geogrids increased the ratio of modulus of the base course
over the subgrade. At failure, the modulus ratio of the base course over the
subgrade was approximately 5 for all the tests.The stress distribution angle

119
depended on the modulus ratio, the thickness of the base course, and the
robustness, thickness and mechanical properties of the specific geogrids tested in
this study.
6. Only when the permanent displacement became large as compared to the
thickness of the base course, did the tensioned membrane effect seem to have
benefit. In this study, the tensioned membrane effect was only observed for the
thinnest section (15 cm base) when the permanent deformation was larger than
45mm.
7. The increase in the CBR value of the subgrade from 2% to 3% significantly
enhanced the benefits of the triangular aperture geogrids.
5.3 Recommendations
This study has been focused on the experimental tests on triangular aperture
geogrid-reinforced bases over weak subgrade including obtaining, reducing, and
analyzing the test data. The test data provides the basis for development of a
comprehensive design method for this family of triangular aperture geogrids, and also
serves as data for calibration of the Giroud-Han method. Lastly, this information can
also be used for theoretical analyses including numerical modeling in the future.
120
REFERENCES
Al-Qadi, I.L, Brandon, T.L., Valentine, R.J., Lacina, B.A., and Smith, T.E. (1994).
“Laboratory evaluation of geosynthetic-reinforced pavement sections.”
Transportation Research Record 1439, Washington D.C.: 25-31.
Al-Qadi, Tutumluer, E., Kwon, J., and Dessouky, S.H. (2007). “Accelerated full-scale
testing of geogrid-reinforced flexible pavements.” TRB 2007 Annual Meeting
(CDROM), Transportation Research Board, National Research Council, Washington
D.C.
ASTM (1997). Annual Books of ASTM Standards, Construction: Soil and Rock (I),
Volume 04.08, American Society for Testing and Materials, Philadelphia, PA.
Austin, D.N., Wu, K.J., and White, D.F. (1993). “The Influence of Test Parameters
and Procedures on the Tensile Modulus of Stiff Geogrids.” Geosynthetic soil
Reinforcement Testing Procedures, ASTM STP 1190, S.C., Jonathan Cheng, Ed.,
American Society for Testing and Materials, Philadelphia, PA, 90-110
Barber, V.C., Odom, E.C., and Patrick, R.W. (1978). The Deterioration and Reliability
of Pavements. Technical Report. S-78-8, U.S. Army Engineering Waterways
Experiment Station, Vicksburg, Miss.

121
Barksdale RD, Brown SF, Chan F. (1989). Potential Benefits of Geosynthetics in
Flexible Pavement System. National Cooperative Highway Research Program Report
No 315, Transportation Research Board. Washington DC, USA: National Research
Council; pp. 56
Barenberg, E.J., Dowland, J.H., and Hales, J. II (1975). “Evaluation of soil-aggregate
systems with Mirafi fabric.” Department of Civil Engineering, University of Illinois.
Das, B.M. and Shin, E.C. (1998). “Strip foundation on geogrid-reinforced clay:
behavior under cyclic loading.” Geotextiles and Geomembranes, 13(10), 657-666.
Dong, Y.-L., Han, J., and Bai, X.-H. (2010). “A numerical study on stress-strain
responses of biaxial geogrids under tension at different directions.” Accepted for
publication at ASCE G-I GeoFlorida Conference.
Duncan-Williams, E and Attoh-Okine, N. O., “Effect of geogrid in granular
base-strength-an experimental investigation.” Journal of Construction and Building
Materials, Vol 22, pp 2180-2184, 2008
Gabr, M. (2001). Cyclic Plate Loading Tests on Geogrid Reinforced Roads. Research
Report to Tensar Earth Technologies, Inc., NC State Univ.

122
Giroud, J.P. and Noiray, L. (1981). ‘‘Geotextile-reinforced unpaved road design.’’ J.
Geotech. Eng., 107(9), 1233–1254.
Giroud, J.P. and Han, J. (2004a). ‘‘Design method for geogrid-reinforced unpaved
roads. I: Development of design method.’’ J. Geotech. Geoenviron. Eng., 130(8),
775–786.
Giroud, J.P. and Han, J. (2004b). ‘‘Design method for geogrid-reinforced unpaved
roads. II: Calibration and applications.’’ J. Geotech. Geoenviron. Eng., 130(8),
787–797.
Haas, R., Wall, J., and Carroll, R.G. (1988). “Geogrid reinforcement of granular bases
in flexible pavements.” Transportation Research Record 1188, Washington D.C.,
19-27.
Harr M.E. (1966). Foundations of Theoretical Soil Mechanics, New York:
McGraw-Hill.
Henry, K.S. (1999). “Geotextiles to stabilize unsurfaced roads on thawing,
low-bearing capacity soils: A comparison of two design methods for use by the U.S.
Army U.S.” Army Cold Regions Research and Engineering Laboratory, Special
Report 99−7.

123
Hufenus, R., Rueegger, R., Banjac, R., Major, P., Springman, S.M., and Bronnimann,
R. (2006). “Full-scale field tests on geosynthetic reinforced unpaved roads on soft
subgrade.” Geotextiles and Geomembranes, Vol. 24, 21-37.
Kinney, T.C. and Xiaolin, Y., (1995). “Geogrid reinforcement of granular bases in
flexible pavements.” Transportation Research Record 1188, pp. 19-27.
Love, J.P. (1984). Model Testing of Geogrids in Unpaved Roads. Doctoral
Dissertation, University of Oxford, Oxford, UK.
Maxwell, S., Kim, W., Edil, T. B., and Benson, C.H. (2005). Effectiveness of
Geosynthetics in Stabilizing Soft Subgrades. Report to the Wisconsin Department of
Transportation
Perkins, S.W. (1999). “Mechanical response of geosynthetic- reinforced flexible
pavements.” Geosynthetics International, Vol. 6, No. 5, 347-382.
Rodin, S. (1965). “Ability of a clay fill to support construction plant.” Journal of
Terramchanics, 2, 51-68.
Shukla, S.K. (2002). Geosynthetics and Their Applications (1977). Guidelines for Use

124
of Fabrics in Construction and Maintenance of Low-Volume Roads. USDA, Forest
Service Report PB-276 972, Portland, OR.
Ullidtz P. (1987). Pavement Analysis. Elsevier Science Publisher, New York.
Webster, S.L. (1993). Geogrid Reinforced Base Course for Flexible Pavements for
Light Aircraft, Test Section Construction, Behavior under Traffic, Laboratory Test
Design Criteria. Technical Report GL-93-6, U.S. Army Corps of Engineers,
Waterways Experiment Station, Vicksburg, MS, USA.
White, D.J., Jahren, C.T., and Suleiman, M.T. (2007). Effective Shoulder Design and
Maintenance. Final report, Iowa State University, IA.
Yoder, E.J. and Wwitczak, M.W. (1975), Principles of Pavement Design, Second Edition, John Wwiley & Sons, Inc.