experimental study on flocculation effect of tangential
TRANSCRIPT

separations
Article
Experimental Study on Flocculation Effect of TangentialVelocity in a Cone-Plate Clarifier
Yulong Zhang, Peikun Liu * , Linjing Xiao, Yuekan Zhang , Xinghua Yang and Lanyue Jiang
�����������������
Citation: Zhang, Y.; Liu, P.; Xiao, L.;
Zhang, Y.; Yang, X.; Jiang, L.
Experimental Study on Flocculation
Effect of Tangential Velocity in a
Cone-Plate Clarifier. Separations 2021,
8, 105. https://doi.org/
10.3390/separations8070105
Academic Editor: Nicholas H. Snow
Received: 17 May 2021
Accepted: 18 July 2021
Published: 20 July 2021
Publisher’s Note: MDPI stays neutral
with regard to jurisdictional claims in
published maps and institutional affil-
iations.
Copyright: © 2021 by the authors.
Licensee MDPI, Basel, Switzerland.
This article is an open access article
distributed under the terms and
conditions of the Creative Commons
Attribution (CC BY) license (https://
creativecommons.org/licenses/by/
4.0/).
College of Mechanical and Electronic Engineering, Shandong University of Science and Technology,Qingdao 266590, China; [email protected] (Y.Z.); [email protected] (L.X.);[email protected] (Y.Z.); [email protected] (X.Y.); [email protected] (L.J.)* Correspondence: [email protected]
Abstract: A large number of particles with small size and light density in mine water are difficultto remove by traditional separation equipment. In order to improve the efficiency of mine watertreatment, a cone-plate clarifier is proposed in this paper. The particle size distribution and theirfragmentation fractal dimension were studied in 15 sampling points of the cone-plate clarifier toelucidate the process of floc growth and settling. The influence of the tangential inlet velocitysize distribution characteristics was also studied. The results showed that the cone-plate clarifiercan effectively improve suspended solids and turbidity removal efficiency. The floc growth andsettlement courses are shown in the charts. The cone-plate clarifier was divided into four zones:micro flocculation, floc growing, settlement, and exit pipe. Because the fluid enters the cone-plateclarifier tangentially, the value of the inlet velocity and the tangential velocity are equal at the inletfeed. With the increase in tangential velocity, the flocculation efficiency first increased and thendecreased. Comprehensive analysis of the particle greater than 50 µm in the effluent showed that theoptimal inlet was qual to 1.63 m/s. By fitting the equations, the optimal SS and turbidity removalefficiency reached the maximum values of 92.04% and 80.18% at the inlet velocity of 1.86 m/s and1.77 m/s, respectively.
Keywords: cone-plate clarifier; particle size distribution; fragmentation fractal dimensions; floccula-tion zones; shear rate
1. Introduction
In recent years, the problem of water pollution is becoming more and more serious,which has attracted the attention of many people [1–3]. A large amount of mine water ispumped to the surface in the process of coal mining. In general, the mine water containsa lot of particles such as coal powder, sand, and stone [4,5]. The direct discharge of minewater will cause a waste of water resources and environmental pollution [6,7]. In watertreatment, the aggregation of small particles into large particles is the key to removingsuspended solids (SS), turbidity, and particle number in water treatment works [8,9]. Dueto the small size, light specific gravity, and slow settling speed of particles in mine water, itis difficult to remove them [10]. Therefore, it is very meaningful to study the aggregationand settlement mechanism of particles in mine water.
Particles and natural organic matter in suspension can be effectively removed byflocculation-sedimentation, which is widely used in water treatment engineering [11–13].Magnetic flocculation has high separation efficiency. Magnetic seeds can be recycled, sothe operation cost is low [8,14,15]. Numerous flocculation studies have been carried outin jar tests and these experiments proved that the jar test can predict the behavior ofthe flocculation process in many cases [16–18]. It has been confirmed that the hydraulicconditions have an important influence on the floc characteristics in the flocculation process,and further affect the flocculation effect and purification efficiency [19]. Some experts havestudied the coagulation-flocculation process and the dynamic separator based on swirling
Separations 2021, 8, 105. https://doi.org/10.3390/separations8070105 https://www.mdpi.com/journal/separations
Separations 2021, 8, 105 2 of 15
motion to remove the solid phase in the water phase [20]. The factors affecting the flocproperties include the type and dosage of coagulant, shear rate, concentration, pH value,temperature, etc. [21,22]. The shear rate is one of the most important factors affectingthe collision frequency between particles and flocs. Bamrungsri et al. [23] and Puprasertet al. [24] studied the effect of centrifugal force produced by tangential flow injectionon coagulation-flocculation. The results show that the tangential jet produces a strongvelocity gradient at the pipe wall, which improves the removal efficiency of turbidity andSS, and promotes the coagulation and flocculation phenomenon. The jar test can reflect theflocculation state in many cases, but the jar test method can only reflect the final state offlocs. At present, the flocculation of flocs in the process of cyclone flocculation has beenrarely studied. Becker et al. showed that the flocs produced in the flocculation processcan directly affect the precipitation efficiency [25,26]. Therefore, it is feasible to study thedifferent zones of the cyclone flocculation process to elucidate the evolution of flocs in theprocess of flocculation and sedimentation.
In the flocculation process of water treatment, SS and turbidity are taken as the mainindicators to study [27]. In low turbidity water, turbidity cannot fully represent the numberof particles in water, so it is necessary to directly measure and detect the number of particleswith different sizes [28,29]. Online particle counters can monitor particle size distribution(PSD) and quantify particle number. Yao et al. studied the correlation between particlenumber and water turbidity [30]. Compared with a turbidimeter, a particle counter canprovide better particle characterization information on the micro scale. Because of its highsensitivity to small particles, the measurement results are more accurate. The combinationof particle counter and turbidity meter to monitor the operation of water treatment has beenmore and more widely used in water treatment. However, a large number of experimentshave been carried out to study the final results of the jar test, and few studies have beenmade on the hydrocyclone flocculation process.
In this study, a conical cone-plate clarifier was proposed (Figure 1). It mainly containsa cylindrical body, conical part, cone-plate, feed inlet, underflow, and overflow. Aftermixing with the coagulant aid, magnetic seed, and flocculant, the mine water enters thecone-plate clarifier tangentially to form a swirling flow field. Under the action of centrifugalforce and gravity, particles are collided and gathered. The large flocs moved radially tothe outer wall under centrifugal force and settled to the bottom under gravity. The smallflocs entered the cone-plate with the flow field. At the cone-plate, due to the principle ofshallow pool, some small flocs further aggregated, grew, and settled again. Finally, flocssettled to the underflow and discharged intermittently through the underflow port. Theclean water flowed out through the overflow pipe. Compared with the traditional sewagetreatment equipment, it can improve the efficiency of particle separation. On one hand, thecentrifugal force accelerates the collision rate of flocs; on the other hand, the conical platecan increase the settling area of flocs [31].
In this paper, a series of flocculation and sedimentation experiments were carriedout in a cone-plate clarifier at different inlet velocities to study the effects of PSD andfragmentation fractal dimension (Df) on particle separation efficiency. First, the variationof SS removal efficiency, turbidity removal efficiency, and total particle number at differentpositions in the cone plate clarifier were studied. Next, the growth law of particles withdifferent sizes was studied, and the change of PSD under different inlet velocity wasanalyzed. Furthermore, the relationship between the fragmentation fractal dimensionsof particles and the growth law of particles was discussed [32–37]. Finally, according tothe number of particles with different sizes and fragmentation fractal dimensions, thecone-plate clarifier was divided into four zones. According to the PSD of flocs at the end ofmicro flocculation, sedimentation, and exit pipe (initial floc, growing floc, final floc), andthe percentage of particles greater than 50 µm at the end of micro flocculation, the optimalinlet velocity was discussed.

Separations 2021, 8, 105 3 of 15Separations 2021, 8, x FOR PEER REVIEW 3 of 17
Figure 1. Schematic of the cone-plate clarifier.
In this paper, a series of flocculation and sedimentation experiments were carried out in a cone-plate clarifier at different inlet velocities to study the effects of PSD and frag-mentation fractal dimension (Df) on particle separation efficiency. First, the variation of SS removal efficiency, turbidity removal efficiency, and total particle number at different po-sitions in the cone plate clarifier were studied. Next, the growth law of particles with dif-ferent sizes was studied, and the change of PSD under different inlet velocity was ana-lyzed. Furthermore, the relationship between the fragmentation fractal dimensions of par-ticles and the growth law of particles was discussed [32–37]. Finally, according to the number of particles with different sizes and fragmentation fractal dimensions, the cone-plate clarifier was divided into four zones. According to the PSD of flocs at the end of micro flocculation, sedimentation, and exit pipe (initial floc, growing floc, final floc), and the percentage of particles greater than 50 μm at the end of micro flocculation, the optimal inlet velocity was discussed.
2. Materials and Methods2.1. Materials and Detecting Equipment
The coal mine water used in this research came from a mine in Ningxia, China. The water quality is presented in Table 1. The SS, turbidity, and pH value of the coal mine water was obtained by the detectors SS-1Z, WGZ-1b, and pH meter, respectively. Particle size analyzers are widely used to monitor the evolution of PSD during flocculation pro-cesses, whereas online particle counters have received little use in previous works. Here, a particle counter (2200PCX, HACH, Loveland, USA) was used to measure the number of particles with different particle sizes.
Table 1. Water qualities index of the coal mine water.
Property Indexes SS (mg/L) Turbidity (NTU) Value 300–400 50–100
Three materials were used in this experiment: poly-aluminum chloride (PACl), mag-netic seed (Fe3O4), and polyacrylamide (PAM). The polyaluminum chloride (PACl) was chosen as the coagulant to form colloid aggregates. Stock PACl solutions (1%) were pre-pared by dissolving the reagent in deionized water. Polyacrylamide (PAM) was selected
Figure 1. Schematic of the cone-plate clarifier.
2. Materials and Methods2.1. Materials and Detecting Equipment
The coal mine water used in this research came from a mine in Ningxia, China. Thewater quality is presented in Table 1. The SS, turbidity, and pH value of the coal mine waterwas obtained by the detectors SS-1Z, WGZ-1b, and pH meter, respectively. Particle sizeanalyzers are widely used to monitor the evolution of PSD during flocculation processes,whereas online particle counters have received little use in previous works. Here, a particlecounter (2200PCX, HACH, Loveland, CO, USA) was used to measure the number ofparticles with different particle sizes.
Table 1. Water qualities index of the coal mine water.
Property Indexes SS (mg/L) Turbidity (NTU)
Value 300–400 50–100
Three materials were used in this experiment: poly-aluminum chloride (PACl), mag-netic seed (Fe3O4), and polyacrylamide (PAM). The polyaluminum chloride (PACl) waschosen as the coagulant to form colloid aggregates. Stock PACl solutions (1%) were pre-pared by dissolving the reagent in deionized water. Polyacrylamide (PAM) was selectedas the flocculant. The concentration of the aqueous solution was 3‰, and the molecularweight was 12 million. These solutions were used directly, without further preparation.The Fe3O4 was used as a magnetic seed. The size of magnetic seed was 200 mesh.
In the process of mine water treatment, the addition of chemicals is a very importantlink. The optimal dosage of chemicals can be obtained through the beaker test. The dosageof PACl, magnetic seed, and PAM was 60 mg/L, 40 mg/L, and 6 mg/L, respectively. Theorder of adding the agents was PACl, magnetic seed, and PAM.
2.2. Test System
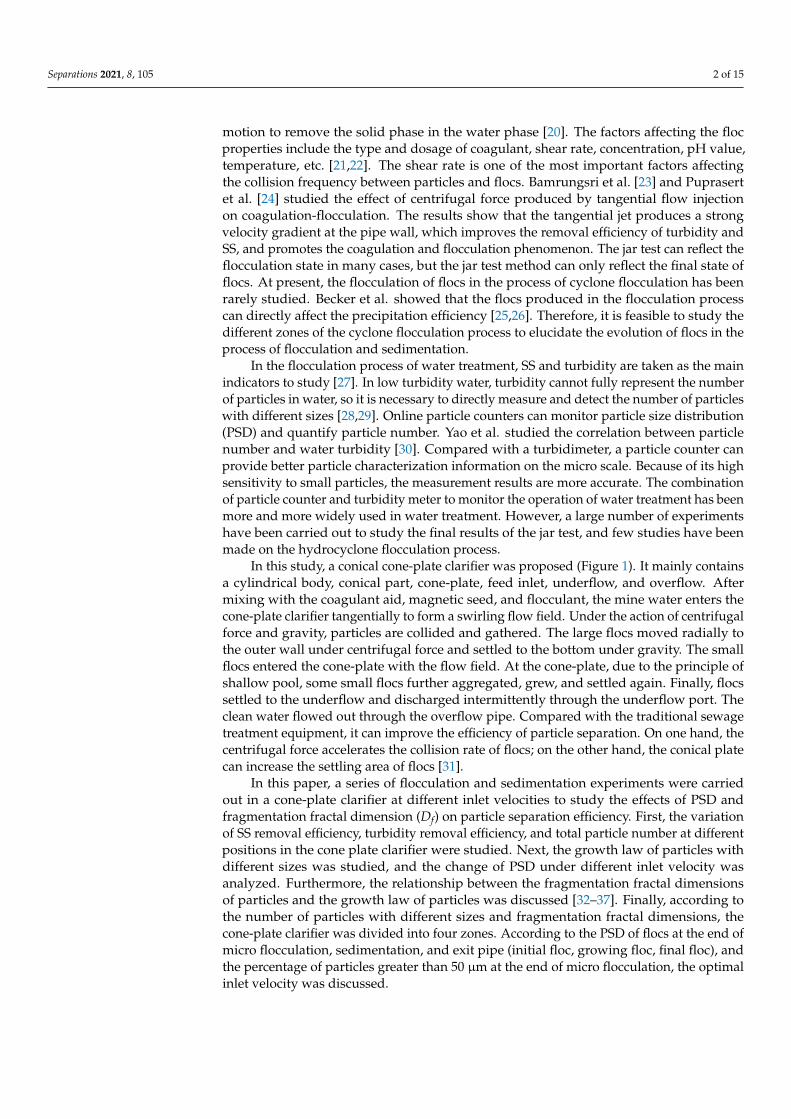
The test system is mainly composed of a submersible pump, peristaltic pump, pipelinemixer, cone-plate clarifier, and other equipment. The flow chart of the test system is shownin Figure 2. Mine water was pumped into the pipe mixer by a submersible pump. Throughthe peristaltic pump, the agent was added into the pipe mixer for mixing and flocculation.The order of adding chemicals was PACl, magnetic seed, and PAM. The flocs are fully mixed
Separations 2021, 8, 105 4 of 15
by the pipe mixer, and then enter the cone-plate clarifier for further growth, separation,and sedimentation.
Separations 2021, 8, x FOR PEER REVIEW 4 of 17
as the flocculant. The concentration of the aqueous solution was 3‰, and the molecular weight was 12 million. These solutions were used directly, without further preparation. The Fe3O4 was used as a magnetic seed. The size of magnetic seed was 200 mesh.
In the process of mine water treatment, the addition of chemicals is a very important link. The optimal dosage of chemicals can be obtained through the beaker test. The dosage of PACl, magnetic seed, and PAM was 60 mg/L, 40 mg/L, and 6 mg/L, respectively. The order of adding the agents was PACl, magnetic seed, and PAM.
2.2. Test System The test system is mainly composed of a submersible pump, peristaltic pump, pipe-
line mixer, cone-plate clarifier, and other equipment. The flow chart of the test system is shown in Figure 2. Mine water was pumped into the pipe mixer by a submersible pump. Through the peristaltic pump, the agent was added into the pipe mixer for mixing and flocculation. The order of adding chemicals was PACl, magnetic seed, and PAM. The flocs are fully mixed by the pipe mixer, and then enter the cone-plate clarifier for further growth, separation, and sedimentation.
Figure 2. Flow chart of the test system diagram.
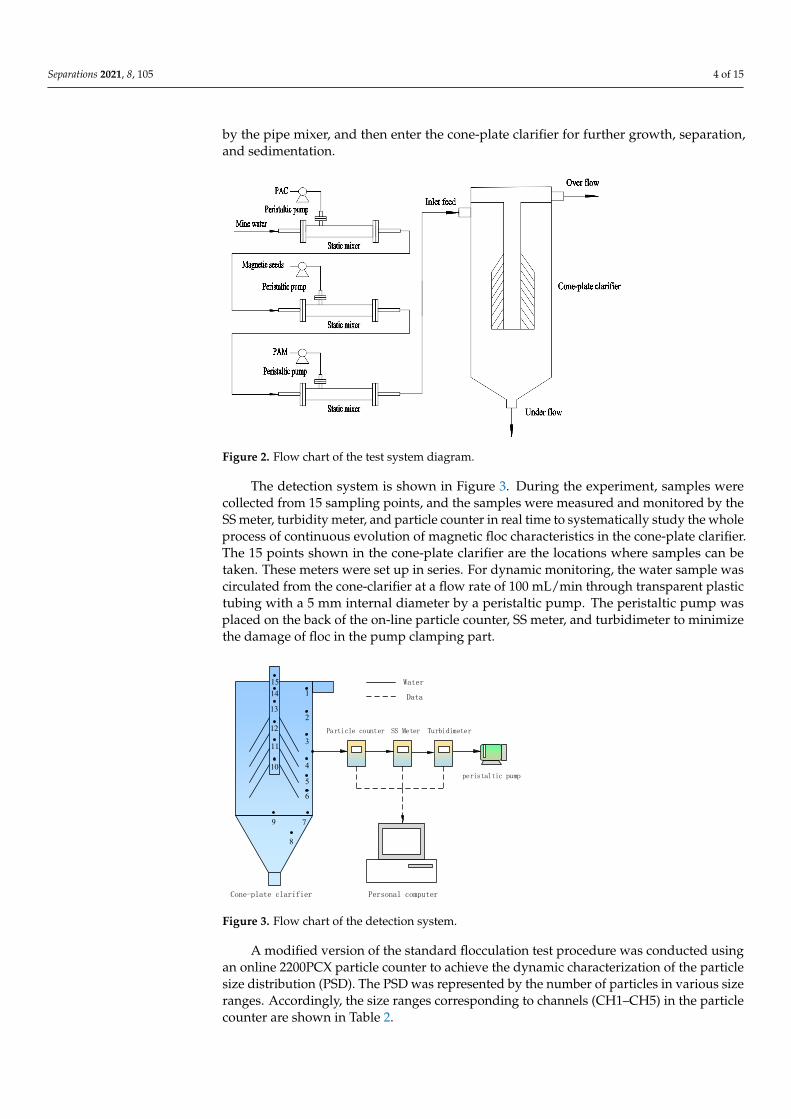
The detection system is shown in Figure 3. During the experiment, samples were col-lected from 15 sampling points, and the samples were measured and monitored by the SS meter, turbidity meter, and particle counter in real time to systematically study the whole process of continuous evolution of magnetic floc characteristics in the cone-plate clarifier. The 15 points shown in the cone-plate clarifier are the locations where samples can be taken. These meters were set up in series. For dynamic monitoring, the water sample was circulated from the cone-clarifier at a flow rate of 100 mL/min through transparent plastic tubing with a 5 mm internal diameter by a peristaltic pump. The peristaltic pump was placed on the back of the on-line particle counter, SS meter, and turbidimeter to minimize the damage of floc in the pump clamping part.
Figure 2. Flow chart of the test system diagram.
The detection system is shown in Figure 3. During the experiment, samples werecollected from 15 sampling points, and the samples were measured and monitored by theSS meter, turbidity meter, and particle counter in real time to systematically study the wholeprocess of continuous evolution of magnetic floc characteristics in the cone-plate clarifier.The 15 points shown in the cone-plate clarifier are the locations where samples can betaken. These meters were set up in series. For dynamic monitoring, the water sample wascirculated from the cone-clarifier at a flow rate of 100 mL/min through transparent plastictubing with a 5 mm internal diameter by a peristaltic pump. The peristaltic pump wasplaced on the back of the on-line particle counter, SS meter, and turbidimeter to minimizethe damage of floc in the pump clamping part.
Separations 2021, 8, x FOR PEER REVIEW 5 of 17
Figure 3. Flow chart of the detection system.
A modified version of the standard flocculation test procedure was conducted using an online 2200PCX particle counter to achieve the dynamic characterization of the particle size distribution (PSD). The PSD was represented by the number of particles in various size ranges. Accordingly, the size ranges corresponding to channels (CH1–CH5) in the particle counter are shown in Table 2.
Table 2. Particle size range setting of the particle counter.
Channel Minimum Size (μm)
Maximum Size (μm)
Maximum Range (Number/mL)
CH1 2 5 17,000CH2 5 10 17,000CH3 10 50 17,000CH4 50 100 17,000CH5 100 500 17,000
2.3. Fragmentation Fractal Dimensions of Particle Size Distribution According to the study of O’Melia [38], the particle distribution can be calculated by
the following formula:
( ) ( )PD
p pp
dNn d dd d
−= ∝ (1)
where dp is the diameter of the flocs; n(dp) is the particle size distribution function; and dN is the number of the flocs for diameters between dp and dp plus d(dp). Dp is the fractal di-mensions.
Taking the natural logarithm for both ends of Equation (1) gives:
( )ln n
lnp
pp
dD
d
− = (2)
Equation (2) has been used to experimentally study the raw water of the Songhua River, the sedimentation tank effluent, and the filter effluent. It was demonstrated that the particle number and the corresponding particle size were approximately linearly related on a double logarithmic coordinate system, and the corresponding β values were meas-ured.
1
2
3
4
5
6
7
8
9
10
1514
13
12
11
Cone-plate clarifier
TurbidimeterParticle counter
peristaltic pump
Water
Data
Personal computer
SS Meter
Figure 3. Flow chart of the detection system.
A modified version of the standard flocculation test procedure was conducted usingan online 2200PCX particle counter to achieve the dynamic characterization of the particlesize distribution (PSD). The PSD was represented by the number of particles in various sizeranges. Accordingly, the size ranges corresponding to channels (CH1–CH5) in the particlecounter are shown in Table 2.

Separations 2021, 8, 105 5 of 15
Table 2. Particle size range setting of the particle counter.
Channel MinimumSize (µm)
MaximumSize (µm)
Maximum Range(Number/mL)
CH1 2 5 17,000CH2 5 10 17,000CH3 10 50 17,000CH4 50 100 17,000CH5 100 500 17,000
2.3. Fragmentation Fractal Dimensions of Particle Size Distribution
According to the study of O’Melia [38], the particle distribution can be calculated bythe following formula:
n(dp)=
dNd(dp) ∝ d−DP
p (1)
where dp is the diameter of the flocs; n(dp) is the particle size distribution function; anddN is the number of the flocs for diameters between dp and dp plus d(dp). Dp is thefractal dimensions.
Taking the natural logarithm for both ends of Equation (1) gives:
Dp =− ln
[n(dp)]
ln dp(2)
Equation (2) has been used to experimentally study the raw water of the SonghuaRiver, the sedimentation tank effluent, and the filter effluent. It was demonstrated that theparticle number and the corresponding particle size were approximately linearly related ona double logarithmic coordinate system, and the corresponding β values were measured.
Most water plants use particle counters to check the particle count. Therefore, thecalculation of the fragmentation fractal dimensions of particle size by particle count caneffectively guide the water treatment in water plants. A particle counter was used tocalculate the fragmentation fractal dimensions of particle size, but it can only measure thenumber of particles located in certain particle size ranges.
According to a study by Nan Jun [30,39], there is no clear linear relationship betweenthe logarithm of the number of flocs in the corresponding particle size range and thelogarithm of the particle size during the coagulation process. Equation (2) is not suitablefor research on the fractal characteristics of PSD in flocculation processes.
Nan Jun [30,39] attempted to introduce fractal theory into the study of floc sizedistribution by using a particle counter to investigate the fractal characteristics of floc sizedistribution in the flocculation process, starting from the size distribution function of flocs.
In order to apply Equation (2) to the coagulation and sedimentation process, thefollowing transformation is required:
p(r) =N(r)
N=
∫ r0 dNN
=
∫ r0 n(dp)d(dp)
N∝
1N
rD f (3)
Equation (3) is taken from the natural logarithm at both ends.
D f =ln p(r)
ln r(4)
where p(r) is the probability density of particle size; r is the diameter of the particle; and Dfis the fragmentation fractal dimensions of particle size distribution. Df has been used toevaluate the dispersion in water [30,39].
The first derivative of Df is the ratio of change of the fractal dimension. The inde-pendent variable is the number of sampling points. The greater the change in the valueof Df, the greater the value of the first derivative of Df. As the value of Df increases, the

Separations 2021, 8, 105 6 of 15
corresponding value of the first derivative of Df is positive. Conversely, when the value ofDf decreases, the corresponding value of the first order derivatives of Df is negative.
3. Results and Discussion3.1. Water Quality Status in Different Flocculation States
In order to study the flocculation, growth, separation, and settling mechanism offlocs, samples were collected from 15 sampling points in the cone-clarifier for analysis.The particles move to the next sampling point with the increase in flocculation time in thecone-plate clarifier, that is, the flocculation time of the measured sample increases with theincrease in sampling point number. The flocculation time of particles at sampling point1 was the shortest, and that of particles at sampling point 15 was the longest. The SS,turbidity, and particle number of each sampling point in the cone-clarifier were studied,and the flocculation mechanism discussed.
As shown in Figure 4, the SS and turbidity removal efficiency first decreased and thenincreased with the increase in sampling point number. In contrast, the number of particlesfirst increased and then decreased. At sampling point 1, the mine water in the pipelinemixer mixed with the reagent and entered the cone-plate clarifier tangentially at a highspeed. At this time, it is in the primary stage of flocculation. The removal efficiency of SSand turbidity were 61% and 20%, respectively, and the particle number was 21,872 mL−1.At sampling points 2 and 3, the shear speed was relatively fast, and a large number ofsmaller particles were generated. At this stage, the flocs grew rapidly. Therefore, theremoval efficiency of SS and turbidity decreased, and the number of particles increased to25,552 mL−1.
Separations 2021, 8, x FOR PEER REVIEW 7 of 17
Figure 4. The dynamic change of PSD at different sampling points.
At sampling points 4–6, the particle size of flocs grew to a larger size, at the same time, the tangential velocity decreased greatly. A smaller shear force can reduce the frag-mentation of the large flocs that have been formed; on the contrary, the large flocs will further grow slowly under the action of lower shear speed. A large number of smaller particles grew into a small number of larger particles. The total number of particles de-creased, and the removal efficiency of SS and turbidity increased. At sampling points 7–9, the mine water was fully flocculated. The floc reached the maximum size and settled rapidly under the action of gravity. Therefore, the removal efficiency of SS and turbidity increased rapidly, and the number of particles decreased. At sampling points 10–15, the removal efficiency of SS and turbidity increased, while the number of particles decreased, which was mainly due to the further flocculation and sedimentation of a large number of particles at the cone-plates. At sampling point 15, the water quality reached the optimal value. The removal efficiency of SS and turbidity reached 92% and 80.1%, respectively, and the number of particles was reduced to 16,445 mL−1.
3.2. Particle Size Distribution in Different Flocculation States In order to further study the mechanism of different flocculation states, the evolution
of different particle sizes was studied. As shown in Figure 5, the total number of particles increased first and then decreased. Finally, the total number of particles at 15 sampling points was the least, which indicates that the flocculation process can effectively remove particles in the water phase.
0
5000
10,000
15,000
20,000
25,000
30,000
0
20
40
60
80
100
1 2 3 4 5 6 7 8 9 10 11 12 13 14 15
Part
icle
num
ber
conc
entr
atio
n (c
m-3 )
perc
enta
ge(%
)
Sampling point
SS removal Turbidity removal Particle number concentration
Figure 4. The dynamic change of PSD at different sampling points.
At sampling points 4–6, the particle size of flocs grew to a larger size, at the sametime, the tangential velocity decreased greatly. A smaller shear force can reduce thefragmentation of the large flocs that have been formed; on the contrary, the large flocs willfurther grow slowly under the action of lower shear speed. A large number of smallerparticles grew into a small number of larger particles. The total number of particlesdecreased, and the removal efficiency of SS and turbidity increased. At sampling points7–9, the mine water was fully flocculated. The floc reached the maximum size and settledrapidly under the action of gravity. Therefore, the removal efficiency of SS and turbidityincreased rapidly, and the number of particles decreased. At sampling points 10–15, theremoval efficiency of SS and turbidity increased, while the number of particles decreased,which was mainly due to the further flocculation and sedimentation of a large number ofparticles at the cone-plates. At sampling point 15, the water quality reached the optimalvalue. The removal efficiency of SS and turbidity reached 92% and 80.1%, respectively, andthe number of particles was reduced to 16,445 mL−1.

Separations 2021, 8, 105 7 of 15
3.2. Particle Size Distribution in Different Flocculation States
In order to further study the mechanism of different flocculation states, the evolutionof different particle sizes was studied. As shown in Figure 5, the total number of particlesincreased first and then decreased. Finally, the total number of particles at 15 samplingpoints was the least, which indicates that the flocculation process can effectively removeparticles in the water phase.
Separations 2021, 8, x FOR PEER REVIEW 8 of 17
Figure 5. Dynamic variation on PSD at different sampling points under different inlet speeds: (a) v = 0.46 m/s; (b) v = 1.63 m/s; (c) v = 3.47 m/s.
At an inlet velocity of 1.63 m/s (Figure 5b), the number of particles in each channel changed sharply in the initial stage of flocculation. At sampling points 1–9, the number of
0
5000
10,000
15,000
20,000
25,000
30,000
0
1000
2000
3000
4000
5000
6000
7000
8000
9000
10,000
1 2 3 4 5 6 7 8 9 10 11 12 13 14 15
Part
icle
num
ber
conc
entr
atio
n (c
m-3 )
Part
icle
num
ber
in e
very
size
(num
ber/
mL)
Sampling point
2-5μm 5-10μm 10-50μm 50-100μm 100-500μm Particle number concentration
0
5000
10,000
15,000
20,000
25,000
30,000
0
1000
2000
3000
4000
5000
6000
7000
8000
9000
10,000
1 2 3 4 5 6 7 8 9 10 11 12 13 14 15
Part
icle
num
ber
conc
entr
atio
n (c
m-3 )
Part
icle
num
ber
in e
very
size
(num
ber/
mL)
Sampling point
2-5μm 5-10μm 10-50μm 50-100μm 100-500μm Particle number concentration
a
b
c
Figure 5. Dynamic variation on PSD at different sampling points under different inlet speeds:(a) v = 0.46 m/s; (b) v = 1.63 m/s; (c) v = 3.47 m/s.

Separations 2021, 8, 105 8 of 15
At an inlet velocity of 1.63 m/s (Figure 5b), the number of particles in each channelchanged sharply in the initial stage of flocculation. At sampling points 1–9, the numberof 2–5 µm particles decreased rapidly, the number of 5–100 µm particles first increasedand then decreased, and the number of 100–500 µm particles increased and then tendedto stabilize. Finally, the number of particles in all channels reached a steady state, whichindicates that the smaller particles grow into larger particles in this period. It should benoted that the variation of particle curves in different size ranges is not synchronous. Thepeak value of the particle number of the small size particles appeared earlier. With theincrease in particle size, the peak of particle number appeared later, which indicates that theprimary particles are prone to form micro-flocs rather than aggregate into large flocs directly.The larger particles were gradually formed by the combination of smaller micro flocs andmonomer particles. At sampling point 10–15, the particles in all channels were reduced,which indicates that the cone-plate can effectively remove particles of various sizes.
Comparing the three images in Figure 5a–c, all the curves in Figure 5a were similar tothose in Figure 5b in shape. The differences were that the peak of all curves at v = 0.46 m/swere delayed compared with that at v = 1.63 m/s because of the low energy input. Whenthe shear velocity was 3.47 m/s, all curves changed rapidly and reached steady stagequickly. Then, the number of particles smaller than 10 µm began to increase, and thenumber of particles larger than 100 µm began to decrease, which indicates that a largenumber of flocs with a larger particle size were broken due to high energy dissipation.
3.3. Evolution of Particle Size Distribution Fragmentation Fractal Dimensions
Fractal theory has been widely used to study the structure and dispersion of flocs inthe flocculation process. In previous study, it has been confirmed that the fragmentationfractal dimensions of particle size distribution (Df) can represent the change in particlesize distribution in water [30]. The higher values of Df reflect there are much largerparticles and flocs in water, and lower values indicate that the small flocs are dominant inwater [40,41]. In addition, the fractal features of particle size distribution can well representthe description details that PSD cannot express. Therefore, Df can be used as a supplementto characterize the particle size growth. In order to study Df better, the first derivative ofDf was used. The rate of change of Df can be expressed by the first derivative of Df. Theinlet speed of 1.63 m/s was chosen as an example to discuss the variation of Df and its firstderivative at different sampling points (shown in Figure 6).
Separations 2021, 8, x FOR PEER REVIEW 9 of 17
2–5 μm particles decreased rapidly, the number of 5–100 μm particles first increased and then decreased, and the number of 100–500 μm particles increased and then tended to stabilize. Finally, the number of particles in all channels reached a steady state, which indicates that the smaller particles grow into larger particles in this period. It should be noted that the variation of particle curves in different size ranges is not synchronous. The peak value of the particle number of the small size particles appeared earlier. With the increase in particle size, the peak of particle number appeared later, which indicates that the primary particles are prone to form micro-flocs rather than aggregate into large flocs directly. The larger particles were gradually formed by the combination of smaller micro flocs and monomer particles. At sampling point 10–15, the particles in all channels were reduced, which indicates that the cone-plate can effectively remove particles of various sizes.
Comparing the three images in Figure 5a–c, all the curves in Figure 5a were similar to those in Figure 5b in shape. The differences were that the peak of all curves at v = 0.46 m/s were delayed compared with that at v = 1.63 m/s because of the low energy input. When the shear velocity was 3.47 m/s, all curves changed rapidly and reached steady stage quickly. Then, the number of particles smaller than 10 μm began to increase, and the num-ber of particles larger than 100 μm began to decrease, which indicates that a large number of flocs with a larger particle size were broken due to high energy dissipation.
3.3. Evolution of Particle Size Distribution Fragmentation Fractal Dimensions Fractal theory has been widely used to study the structure and dispersion of flocs in
the flocculation process. In previous study, it has been confirmed that the fragmentation fractal dimensions of particle size distribution (Df) can represent the change in particle size distribution in water [30]. The higher values of Df reflect there are much larger parti-cles and flocs in water, and lower values indicate that the small flocs are dominant in water [40,41]. In addition, the fractal features of particle size distribution can well repre-sent the description details that PSD cannot express. Therefore, Df can be used as a sup-plement to characterize the particle size growth. In order to study Df better, the first de-rivative of Df was used. The rate of change of Df can be expressed by the first derivative of Df. The inlet speed of 1.63 m/s was chosen as an example to discuss the variation of Df and its first derivative at different sampling points (shown in Figure 6).
Figure 6. Dynamic variation of Df and first derivative of Df at different sampling points.
At the inlet speed of 1.63 m/s, the fragmentation fractal dimensions first increased rapidly to a stable value, and then decreased slightly to a stable value. At the first nine sampling points, the first derivative of Df curves were at a positive value, which increased rapidly between sampling points 1 to 3, then decreased to around zero from point 3 to
-0.03
-0.02
-0.01
0
0.01
0.02
0.03
0.04
0.05
0
0.05
0.1
0.15
0.2
0.25
0.3
0.35
1 2 3 4 5 6 7 8 9 10 11 12 13 14 15
Firs
t der
ivat
ive
of D
f
Frag
men
tatio
n fr
acta
l dim
ensio
ns(D
f)
Sampling point
Value of Df First derivative of DfDf Df
Figure 6. Dynamic variation of Df and first derivative of Df at different sampling points.
At the inlet speed of 1.63 m/s, the fragmentation fractal dimensions first increasedrapidly to a stable value, and then decreased slightly to a stable value. At the first ninesampling points, the first derivative of Df curves were at a positive value, which increasedrapidly between sampling points 1 to 3, then decreased to around zero from point 3 topoint 4, finally fluctuated in a narrow range between sampling points 4 to 9. This indicated

Separations 2021, 8, 105 9 of 15
that the growth rate of Df increased in the early stage, and then the growth rate decreasedto a stable period.
The first derivative of the Df curve were negative at sampling points 9–12. At samplingpoints 9–10, the first derivative of Df decreased rapidly because a large number of particlessettled in the underflow. At sampling points 10–12, the first derivative of Df increasedgradually and remained stable around 0, which was due to the flocculation and adsorptionof flocs by the cone-plate and the further settlement of large particles. Finally, Df fluctuatedin a narrow range around 0 at sampling points 12–15.
At sampling point 3, the first derivative of Df reached the peak value, which indicatedthat the floc growth rate here was the fastest, and a large number of small flocs grewinto larger flocs. At sampling point 10, the first derivative of the fragmentation fractaldimensions reached the minimum value, and the value was negative, which indicates thatthe generated large-particle flocs mainly settle and separate here. Finally, the number ofparticles decreased and the effluent quality improved.
3.4. Segment the Flocculation Process in the Cone-Plate Clarifier
In this section, we analyzed the particle size distribution and Df of 15 samplingpoints in the cone-plate clarifier to study the evolution of flocculation. According to theprogressive shear force, Wang Dongsheng divided the flocculation time into three stages.Particle size distribution and floc structure have a great influence on flocculation effect, butshear velocity alone cannot evaluate the properties of particles. Therefore, the cone-plateclarifier was divided into four zones by the change of PSD and Df to further study theflocculation process. The inlet speed of 1.63 m/s was selected for regional division. Thezone division of the flocculation process is shown in Figure 7.
Separations 2021, 8, x FOR PEER REVIEW 10 of 17
point 4, finally fluctuated in a narrow range between sampling points 4 to 9. This indicated that the growth rate of Df increased in the early stage, and then the growth rate decreased to a stable period.
The first derivative of the Df curve were negative at sampling points 9–12. At sam-pling points 9–10, the first derivative of Df decreased rapidly because a large number of particles settled in the underflow. At sampling points 10–12, the first derivative of Df in-creased gradually and remained stable around 0, which was due to the flocculation and adsorption of flocs by the cone-plate and the further settlement of large particles. Finally, Df fluctuated in a narrow range around 0 at sampling points 12–15.
At sampling point 3, the first derivative of Df reached the peak value, which indicated that the floc growth rate here was the fastest, and a large number of small flocs grew into larger flocs. At sampling point 10, the first derivative of the fragmentation fractal dimen-sions reached the minimum value, and the value was negative, which indicates that the generated large-particle flocs mainly settle and separate here. Finally, the number of par-ticles decreased and the effluent quality improved.
3.4. Segment the Flocculation Process in the Cone-Plate Clarifier In this section, we analyzed the particle size distribution and Df of 15 sampling points
in the cone-plate clarifier to study the evolution of flocculation. According to the progres-sive shear force, Wang Dongsheng divided the flocculation time into three stages. Particle size distribution and floc structure have a great influence on flocculation effect, but shear velocity alone cannot evaluate the properties of particles. Therefore, the cone-plate clari-fier was divided into four zones by the change of PSD and Df to further study the floccu-lation process. The inlet speed of 1.63 m/s was selected for regional division. The zone division of the flocculation process is shown in Figure 7.
Figure 7. The zone division of the flocculation process.
In the pipe mixer, the reagent was mixed rapidly under the action of strong shear force. The particles become unstable due to the change of surface charge. In this zone, the colloidal particles have enough chance to collide with each other under the action of water flow, which provides conditions for the next zone of condensation. Therefore, this zone was called preparation.
In the cone-plate clarifier, the flocs collided and grew rapidly. Sampling point 1 was close to the inlet of cone-plate clarifier. At this sampling point, the number of 2–5 μm particles was the largest, and the larger the diameter of the particles, the fewer the number
0
0.05
0.1
0.15
0.2
0.25
0.3
0.35
0.4
0
1000
2000
3000
4000
5000
6000
7000
8000
9000
10,000
1 2 3 4 5 6 7 8 9 10 11 12 13 14 15
Frag
men
tatio
n fr
acta
l dim
ensio
ns(D
f)
Part
icle
num
ber i
n ev
ery
size(
num
ber/
mL)
Sampling point
2-5μm 5-10μm 10-50μm 50-100μm 100-500μm Df
Floc growingzone
Settlement zone Exit pipe zoneMicro
flocculation zone
Df
Figure 7. The zone division of the flocculation process.
In the pipe mixer, the reagent was mixed rapidly under the action of strong shearforce. The particles become unstable due to the change of surface charge. In this zone, thecolloidal particles have enough chance to collide with each other under the action of waterflow, which provides conditions for the next zone of condensation. Therefore, this zonewas called preparation.
In the cone-plate clarifier, the flocs collided and grew rapidly. Sampling point 1 wasclose to the inlet of cone-plate clarifier. At this sampling point, the number of 2–5 µmparticles was the largest, and the larger the diameter of the particles, the fewer the numberof particles. In this position, small flocs were dominant. From sampling point 1 to 3, withthe increase of flocculation time, the particle size of 2–5 µm decreased rapidly, and theaverage particle size and the fragmentation fractal dimensions increased. At this time, flocs

Separations 2021, 8, 105 10 of 15
were mainly composed of small particles, and the particles grew rapidly, so this zone wascalled micro flocculation.
Between sampling point 4 and sampling point 6, the quantity of flocs with particlesize less than 100 µm decreased slightly and the floc quantity with particle size between100–500 µm still increased rapidly. The fragmentation fractal dimensions increased slowly.At this time, it mainly generated large size particles including flocs larger than 500 µm, sothis zone was called floc growing.
At sampling point 7–9, the particle size of each channel tended to be stable, and thefragmentation fractal dimensions was basically stable. At this position, the flocculationand fragmentation of flocs reached dynamic equilibrium. At this time, the floc particle sizereached the maximum, and it settled to the underflow settlement area under the action ofgravity, so this zone was called settlement.
Between sampling points 10–15, the particles in each channel were further reduceddue to the cone-plate and gravity, especially the large particles. Finally, the particle numberand fragmentation fractal dimensions of all channels fluctuated near the minimum valueand reached a stable state, so this zone was called exit pipe.
During the micro flocculation zone, the number of particles smaller than 100 µmgrew rapidly and the fragmentation fractal dimensions increased rapidly from 0.17 to0.27. During the floc growing zone, the number of particles smaller than 100 µm basicallyreached stability, while the number of particles larger than 100 µm grows faster. Thefragmentation fractal dimensions increased slightly from 0.27 to 0.29. During the settlementzone, the number of particles of all sizes reached equilibrium and the fragmentation fractaldimensions stabilized at around 0.3. During the exit pipe zone, the number of particles ofeach size decreased after the settlement zone, where the larger the particle size, the moreparticles settled, the average particle size in the flow field decreased, and the fragmentationfractal dimensions decreased from 0.3 to about 0.26.
3.5. The Average Size and Fragmentation Fractal Dimensions under Different Speed atDifferent Zones
Initial floc, growing floc, and final floc are the floc at the end of the micro flocculationzone (point 3), floc growing zone (point 6), and exit pipe zone (point 15), respectively.
Figures 8 and 9 show the average size of flocs and fragmentation fractal dimensions un-der different speeds at the end of the micro flocculation zone (initial floc), floc growing zone(growing floc), and exit pipe zone (final floc) at different inlet velocities. Figure 10 showsthe percentage of particles larger than 50 µm in the final floc during the exit pipe zone.
Separations 2021, 8, x FOR PEER REVIEW 12 of 17
Figure 8. The average size under different speeds at different zones.
0
10
20
30
40
50
60
70
80
90
100
0.46 0.93 1.63 2.31 3.47
Ave
rgge
size
(μm
)
Tangential velocity(m/s)
Initial floc Growing floc Final floc
0.1
0.15
0.2
0.25
0.3
0.35
0.46 0.93 1.63 2.31 3.47
Frac
tal d
imen
sion
of p
artic
les(Df)
Tangential velocity(m/s)
Initial floc Growing floc Final floc
Figure 8. The average size under different speeds at different zones.

Separations 2021, 8, 105 11 of 15Separations 2021, 8, x FOR PEER REVIEW 13 of 17
Figure 9. Fragmentation fractal dimensions under different speeds at different zones.
Figure 10. The percentage of particles larger than 50 μm in the final floc.
The average particle size and fragmentation fractal dimensions of the initial floc in-creased with the increase in inlet velocity, and the average particle size of the flocs finally reached 47.5 μm. Because of the small size of the initial floc in the micro flocculation zone, the increase in shear velocity increased the number of particle collisions, which promoted flocculation without shear breakage, so it is easy to promote the growth of flocs. Mean-while, the flocs generated at a faster speed are denser.
When the velocity was less than 1.63 m/s, the average particle size of the growing floc remained unchanged and the fragmentation fractal dimensions increased slightly with the increase in velocity. The effect of shear velocity on particle collision flocculation is greater than that of shear fragmentation at tangential velocities. This showed that with the increase in velocity, the flocs were denser, less likely to break, and more likely to settle with the same average particle size. Therefore, the number of the final floc larger than 50 μm decreased due to the faster settling speed.
When the inlet velocity was faster than 1.63 m/s, the particle size and fragmentation fractal dimensions of the growing floc decreased. At this time, particle shear fragmenta-tion became dominant. The floc size was larger than that of the initial floc in the micro flocculation zone, and too fast a shear speed could cause the shear damage of flocs. There-fore, the number of particles larger than 50 μm reduced because of the fragmentation of particles.
23
24
25
26
27
28
29
30
0.46 0.93 1.63 2.31 3.47
Fina
l flo
c av
erag
e siz
e(μm
)
Tangential velocity(m/s)
Figure 9. Fragmentation fractal dimensions under different speeds at different zones.
Separations 2021, 8, x FOR PEER REVIEW 12 of 17
Figure 8. The average size under different speeds at different zones.
Figure 9. Fragmentation fractal dimensions under different speeds at different zones.
Figure 10. The percentage of particles larger than 50 μm in the final floc.
The average particle size and fragmentation fractal dimensions of the initial floc in-creased with the increase in inlet velocity, and the average particle size of the flocs finally
0
10
20
30
40
50
60
70
80
90
100
0.46 0.93 1.63 2.31 3.47
Ave
rgge
size
(μm
)
Tangential velocity(m/s)
Initial floc Growing floc Final floc
0.1
0.15
0.2
0.25
0.3
0.35
0.46 0.93 1.63 2.31 3.47
Frac
tal d
imen
sion
of p
artic
les(Df)
Tangential velocity(m/s)
Initial floc Growing floc Final floc
23
24
25
26
27
28
29
30
0.46 0.93 1.63 2.31 3.47
Fina
l flo
c av
erag
e siz
e(μm
)
Tangential velocity(m/s)
Figure 10. The percentage of particles larger than 50 µm in the final floc.
The average particle size and fragmentation fractal dimensions of the initial flocincreased with the increase in inlet velocity, and the average particle size of the flocs finallyreached 47.5 µm. Because of the small size of the initial floc in the micro flocculation zone,the increase in shear velocity increased the number of particle collisions, which promotedflocculation without shear breakage, so it is easy to promote the growth of flocs. Meanwhile,the flocs generated at a faster speed are denser.
When the velocity was less than 1.63 m/s, the average particle size of the growingfloc remained unchanged and the fragmentation fractal dimensions increased slightly withthe increase in velocity. The effect of shear velocity on particle collision flocculation isgreater than that of shear fragmentation at tangential velocities. This showed that with theincrease in velocity, the flocs were denser, less likely to break, and more likely to settle withthe same average particle size. Therefore, the number of the final floc larger than 50 µmdecreased due to the faster settling speed.
When the inlet velocity was faster than 1.63 m/s, the particle size and fragmentationfractal dimensions of the growing floc decreased. At this time, particle shear fragmentationbecame dominant. The floc size was larger than that of the initial floc in the micro floccula-tion zone, and too fast a shear speed could cause the shear damage of flocs. Therefore, thenumber of particles larger than 50 µm reduced because of the fragmentation of particles.
The average particle size and the fragmentation fractal dimensions of the final flocdecreased slightly with the increase in velocity, and the number of particles larger than50 µm in Figure 10 decreased. This is mainly due to the fact that particles larger than 50 µmand with fragmentation fractal dimensions greater than 0.27 settled mostly in the settlingzone. At greater than 1.63 m/s, the average particle size and the fragmentation fractal

Separations 2021, 8, 105 12 of 15
dimension decreased. This is mainly due to the fact that the larger shear velocities breakup the larger flocs, resulting in an increase in the number of particles larger than 50 µm. Inall speed ranges, with the increase in velocity, the percentage of particles larger than 50 µmdecreased in the final floc during the exit pipe zone.
3.6. The Optimal Effluent Quality after Flocculation
According to the experiments, the optimal inlet velocity was chosen as 1.63 m/s. Thequality of mine water before and after treatment is shown in Table 3.
Table 3. Comparison of water quality parameters before and after treatment.
Property Indexes Value before Treatment Value after Treatment Removal Efficiency
SS 355.32 mg/L 12.23 mg/L 92.01%Turbidity 61.44 NTU 28.39 NTU 80.09%
As shown in Table 3, at this inlet velocity, SS was reduced from 355.32 mg/L to28.39 mg/L and the SS removal efficiency reached 92.01%. Turbidity was reduced from61.44 NTU to 12.23 NTU, with a efficiency removal efficiency of 80.09%.
The SS and turbidity removal efficiency were experimentally investigated at differenttangential velocities. To further explore the effect of tangential velocity, the fitting equationswere performed at different tangential velocities. The experimental results and the fittingequations are shown in Figure 11.
Separations 2021, 8, x FOR PEER REVIEW 14 of 17
Figure 11. Effect of different tangential velocities on SS and turbidity removal efficiency.
As shown in Figure 11, the removal of SS and turbidity increased first and then de-creased as the tangential velocity increased. The removal efficiency of SS and turbidity at different tangential velocities was investigated by fitting the equations. The correlation coefficients were R = 0.9699 (SS removal efficiency) and R = 0.9968 (turbidity removal ef-ficiency), respectively. These results showed that the equations had a high prediction ac-curacy. Table 4 revealed a good agreement between the values predicted by the equations and the actual experimental results.
Table 4. Values of experimental and predicted SS and turbidity removal efficiency.
Inlet Velocity (m/s)
SS Removal Efficiency (%) Turbidity Removal Efficiency (%) Exp. Pred. Err. Exp. Pred. Err.
0.46 82.85 83.41 0.56 72.74 73.01 0.27 0.93 89.07 88.24 0.83 77.64 77.21 0.43 1.63 92.01 91.81 0.20 80.09 80.09 0.00 2.31 90.46 91.12 0.66 78.77 79.01 0.24 3.47 80.69 80.49 0.20 68.46 68.38 0.08
According to the solution of the equation, the maximum removal efficiency of SS is 92.04% when the tangential velocity is 1.86 m/s, and the maximum removal efficiency of turbidity is 80.18% when the tangential velocity is 1.77 m/s.
4. ConclusionsThe main conclusions of this study are listed as follows:
1. A cone-plate clarifier was proposed to remove the particles with small size and lowdensity in mine water. The particle collision efficiency was improved by the swirlfield combined with gravity field. The larger particles formed by flocculation settledto the underflow under the action of gravity. The small particles that cannot settle tothe underflow can be removed by the cone-plate to improve the particle removal ef-ficiency. This has implications for our efforts to improve the efficiency of mine watertreatment.
2. The number of particles with different sizes at 15 sampling points measured by anon-line particle counter was used to study the growth law of particles in the cone-plate clarifier. In the early stage of flocculation, the particle size was small and thegrowth rate was fast. In the later stage of flocculation, the particle size was large and
y = -4.4277x2 + 16.43x + 76.794R2 = 0.9846
y = -4.123x2 + 14.664x + 67.138R2 = 0.9965
50
60
70
80
90
100
0 0.5 1 1.5 2 2.5 3 3.5 4
perc
enta
ge(%
)
Tangential velocity(m/s)
SS removal efficiency Turbidity removal efficiencyFitting cure of SS removal efficiency Fitting cure of Turbidity removal efficiency
Figure 11. Effect of different tangential velocities on SS and turbidity removal efficiency.
As shown in Figure 11, the removal of SS and turbidity increased first and thendecreased as the tangential velocity increased. The removal efficiency of SS and turbidityat different tangential velocities was investigated by fitting the equations. The correlationcoefficients were R = 0.9699 (SS removal efficiency) and R = 0.9968 (turbidity removalefficiency), respectively. These results showed that the equations had a high predictionaccuracy. Table 4 revealed a good agreement between the values predicted by the equationsand the actual experimental results.

Separations 2021, 8, 105 13 of 15
Table 4. Values of experimental and predicted SS and turbidity removal efficiency.
Inlet Velocity(m/s)
SS Removal Efficiency (%) Turbidity Removal Efficiency (%)
Exp. Pred. Err. Exp. Pred. Err.
0.46 82.85 83.41 0.56 72.74 73.01 0.270.93 89.07 88.24 0.83 77.64 77.21 0.431.63 92.01 91.81 0.20 80.09 80.09 0.002.31 90.46 91.12 0.66 78.77 79.01 0.243.47 80.69 80.49 0.20 68.46 68.38 0.08
According to the solution of the equation, the maximum removal efficiency of SS is92.04% when the tangential velocity is 1.86 m/s, and the maximum removal efficiency ofturbidity is 80.18% when the tangential velocity is 1.77 m/s.
4. Conclusions
The main conclusions of this study are listed as follows:
1. A cone-plate clarifier was proposed to remove the particles with small size and lowdensity in mine water. The particle collision efficiency was improved by the swirlfield combined with gravity field. The larger particles formed by flocculation settledto the underflow under the action of gravity. The small particles that cannot settleto the underflow can be removed by the cone-plate to improve the particle removalefficiency. This has implications for our efforts to improve the efficiency of minewater treatment.
2. The number of particles with different sizes at 15 sampling points measured by anon-line particle counter was used to study the growth law of particles in the cone-plateclarifier. In the early stage of flocculation, the particle size was small and the growthrate was fast. In the later stage of flocculation, the particle size was large and thegrowth rate was slow. Larger particles were gradually formed by the combination ofsmaller micro flocs and monomer particles, rather than directly aggregated into largeflocs. This conclusion is consistent with Nanjun’s research [30,39].
3. The particle size distribution of different sampling points was characterized by thefragmentation fractal dimensions. In this study, the first derivative of Df was used asan effective method to analyze PSD and Df. At sampling point 3, the first derivativevalue of Df was the largest, which means that the growth rate was the fastest. Atsampling point 10, the first derivative value of Df was the lowest and negative, whichindicated that the particle sedimentation rate was the fastest at this point.
4. The number and fragmentation fractal dimensions of particles with different sizeswere dynamically analyzed by the on-line particle counter. Based on the variationof PSD and Df at different sampling points, the cone-plate clarifier was divided intofour zones: micro flocculation, floc growing, settlement, and exit pipe. The change inparticle characteristics in each zone can be detected in real time by using the Df value.
5. The average size, fragmentation fractal dimensions of particles in different zonesand the particle number of the final floc size larger than 50 µm at different speedswere studied. The optimal inlet velocity of the cone-plate clarifier was 1.63 m/s. Theremoval efficiency of SS and turbidity reached 92.01% and 80.0.9%, respectively. Theparticle number was reduced to 16,445 mL−1.
6. The fitting equations of SS and turbidity removal efficiency were performed at differenttangential velocities. According to the solution of the equation, the maximum removalrate of ss was 92.04% when the tangential velocity was 1.86 m/s, and the maximumremoval rate of turbidity was 80.18% when the tangential velocity was 1.77 m/s.
7. Most water plants use particle counters to check the particle count. Therefore, mea-suring the number of particles and fragmentation fractal dimensions by means of aparticle counter allows for the water quality to be checked in real time and effectivelyguides the water treatment in water plants.

Separations 2021, 8, 105 14 of 15
Author Contributions: Conceptualization, Y.Z. (Yulong Zhang) and P.L.; methodology, L.X. andY.Z. (Yulong Zhang); software, Y.Z. (Yuekan Zhang); validation, Y.Z. (Yuekan Zhang), X.Y. and L.X.;formal analysis, Y.Z. (Yulong Zhang); investigation, L.J.; resources, P.L.; data curation, Y.Z. (YuekanZhang); writing—original draft preparation, Y.Z. (Yulong Zhang); writing—review and editing, L.X.;visualization, X.Y.; supervision, X.Y.; project administration, L.X.; funding acquisition, P.L. All authorshave read and agreed to the published version of the manuscript.
Funding: This research was funded by the Natural Science Foundation of Shandong Province,China (grant numbers: ZR2020EEM105), Shandong Provincial Key Research and DevelopmentProgram, China (grant number: 2019GSF109030) and Qingdao Science and Technology Program,China (grant numbers: 21-1-4-sf-10-nsh).
Institutional Review Board Statement: Not applicable.
Informed Consent Statement: Not applicable.
Data Availability Statement: Not applicable.
Conflicts of Interest: The authors declare no conflict of interest.
References1. Oh, C.; Bok, S.; Yim, G.; Cheong, Y.; Ji, S. An investigation into precipitate behaviour for effective operation of settling tanks
through selective precipitation. Water Environ. J. 2018, 32, 527–536. [CrossRef]2. Kefeni, K.K.; Msagati, T.A.M.; Mamba, B.B. Acid mine drainage: Prevention, treatment options, and resource recovery: A review.
J. Clean. Prod. 2017, 151, 475–493. [CrossRef]3. Zhao, C.L.; Zhou, J.Y.; Yan, Y.; Yang, L.W.; Xing, G.H.; Li, H.Y.; Wu, P.; Wang, M.Y.; Zheng, H.L. Application of coagula-
tion/flocculation in oily wastewater treatment: A review. Sci. Total Environ. 2021, 765, 142795. [CrossRef]4. Gao, L.; Hou, C.H.; Chen, Y.; Barrett, D.; Mallants, D.; Li, W.G.; Liu, R. Potential for mine water sharing to reduce unregulated
discharge. J. Clean. Prod. 2016, 131, 133–144. [CrossRef]5. Shadrunova, I.V.; Orekhova, N.N. A Process for Advanced Recycling of Water Originating from Mining Operations, with Metal
Recovery. Mine Water Environ. 2015, 34, 478–484. [CrossRef]6. Spellman, C.D.; Tasker, T.L.; Strosnider, W.H.J.; Goodwill, J.E. Abatement of circumneutral mine drainage by Co-treatment with
secondary municipal wastewater. J. Environ. Manag. 2020, 271, 110982. [CrossRef]7. Jiao, H.Z.; Wang, S.F.; Yang, Y.X.; Chen, X.M. Water recovery improvement by shearing of gravity-thickened tailings for cemented
paste backfill. J. Clean. Prod. 2020, 245, 118882.8. Liang, L.; Peng, Y.L.; Tan, J.K.; Xie, G.Y. A review of the modern characterization techniques for flocs in mineral processing. Miner.
Eng. 2015, 84, 130–144. [CrossRef]9. Luo, L.; Nguyen, A.V. A review of principles and applications of magnetic flocculation to separate ultrafine magnetic particles.
Sep. Purif. Technol. 2017, 172, 85–99. [CrossRef]10. Jang, M.; Lee, H.J.; Shim, Y. Rapid removal of fine particles from mine water using sequential processes of coagulation and
flocculation. Environ. Technol. 2010, 31, 423–432. [CrossRef]11. Faustino, L.M.; Braga, A.S.; Sacchi, G.D.; Whitaker, W.; Reali, M.A.P.; Leal, L.S.; Daniel, L.A. Removal of iron ore slimes from a
highly turbid water by DAF. Environ. Technol. 2019, 40, 3444–3455. [CrossRef] [PubMed]12. Arjmand, R.; Massinaei, M.; Behnamfard, A. Improving flocculation and dewatering performance of iron tailings thickeners.
J. Water Process. Eng. 2019, 31, 100873. [CrossRef]13. Lu, Q.Y.; Yan, B.; Xie, L.; Huang, J.; Liu, Y.; Zeng, H.B. A two-step flocculation process on oil sands tailings treatment using
oppositely charged polymer flocculants. Sci. Total Environ. 2016, 565, 369–375. [CrossRef]14. Bai, S.J.; Li, C.L.; Fu, X.Y.; Wu, M.; Wen, S.M. Beneficiation of micro-fine magnetic minerals from reductive iron ore with ultrafine
grinding-magnetic flocculation separation. Sep. Sci. Technol. 2018, 53, 136–145. [CrossRef]15. Zhang, X.; He, X.; Wei, M.; Li, F.; Hou, P.; Zhang, C. Magnetic Flocculation Treatment of Coal Mine Water and a Comparison of
Water Quality Prediction Algorithms. Mine Water Environ. 2019, 38, 391–401. [CrossRef]16. Li, R.H.; Gao, B.Y.; Huang, X.; Dong, H.Y.; Li, X.C.; Yue, Q.Y.; Wang, Y.; Li, Q. Compound bioflocculant and polyaluminum
chloride in kaolin-humic acid coagulation: Factors influencing coagulation performance and floc characteristics. Bioresour. Technol.2014, 172, 8–15. [CrossRef]
17. Yang, Z.; Wu, H.; Yuan, B.; Huang, M.; Yang, H.; Li, A.M.; Bai, J.F.; Cheng, R.S. Synthesis of amphoteric starch-based graftingflocculants for flocculation of both positively and negatively, charged colloidal contaminants from water. Chem. Eng. J. 2014, 244,209–217. [CrossRef]
18. Yu, W.Z.; Gregory, J.; Campos, L.C. Breakage and re-growth of flocs: Effect of additional doses of coagulant species. Water Res.2011, 45, 6718–6724. [CrossRef]
19. Nan, J.; He, W. Characteristic analysis on morphological evolution of suspended particles in water during dynamic flocculationprocess. Desalin. Water Treat. 2012, 41, 35–44. [CrossRef]
Separations 2021, 8, 105 15 of 15
20. Menezes, F.M.; Amal, R.; Luketina, D. Removal of particles using coagulation and flocculation in a dynamic separator. PowderTechnol. 1996, 88, 27–31. [CrossRef]
21. Li, S.; Wang, X.M.; Zhang, Q.L. Dynamic experiments on flocculation and sedimentation of argillized ultrafine tailings usingfly-ash-based magnetic coagulant. Trans. Nonferrous Met. Soc. China 2016, 26, 1975–1984. [CrossRef]
22. Liang, C.-Z.; Sun, S.-P.; Li, F.-Y.; Ong, Y.-K.; Chung, T.-S. Treatment of highly concentrated wastewater containing multiplesynthetic dyes by a combined process of coagulation/flocculation and nanofiltration. J. Membr. Sci. 2014, 469, 306–315. [CrossRef]
23. Bamrungsri, P.; Puprasert, C.; Guigui, C.; Marteil, P.; Bréant, P.; Hébrard, G. Development of a simple experimental method forthe determination of the liquid field velocity in conical and cylindrical hydrocyclones. Chem. Eng. Res. Des. 2008, 86, 1263–1270.[CrossRef]
24. Puprasert, C.; Siangsanung, V.; Guigui, C.; Levecq, C.; Hebrard, G. Hybrid hydrocyclone process operating with natural water.Chem. Eng. Process. 2012, 61, 8–15. [CrossRef]
25. Becker, V.; Schlauch, E.; Behr, M.; Briesen, H. Restructuring of colloidal aggregates in shear flows and limitations of thefree-draining approximation. J. Colloid Interface Sci. 2009, 339, 362–372. [CrossRef]
26. Ren, P.F.; Nan, J.; Zhang, X.R.; Zheng, K. Analysis of floc morphology in a continuous-flow flocculation and sedimentation reactor.J. Environ. Sci. 2017, 52, 268–275. [CrossRef]
27. Nasrabadi, T.; Ruegner, H.; Sirdari, Z.Z.; Schwientek, M.; Grathwohl, P. Using total suspended solids (TSS) and turbidity asproxies for evaluation of metal transport in river water. Appl. Geochem. 2016, 68, 1–9. [CrossRef]
28. Srivastava, R.M. Effect of sequence of measurement on particle count and size measurements using a light blockage (hiac) particlecounter. Water Res. 1993, 27, 939–942. [CrossRef]
29. He, W.; Nan, J. Study on the impact of particle size distribution on turbidity in water. Desalin. Water Treat. Sci. Eng. 2012, 41,26–34. [CrossRef]
30. Yao, M.; Nan, J.; Chen, T. Effect of particle size distribution on turbidity under various water quality levels during flocculationprocesses. Desalination 2014, 354, 116–124. [CrossRef]
31. Yang, X.H.; Liu, P.K.; Zhang, Y.K.; Jiang, L.Y. Numerical simulation and experimental study on a cone-plate clarifier. Adv. Mech.Eng. 2019, 11. [CrossRef]
32. Wan, Y.S.; Liu, J.; Shih, W.H.; Aksay, I.A. Aggregation of colloidal particles with a finite interparticle attraction energy. J. Stat.Phys. 1991, 62, 961–984.
33. Guhra, T.; Ritschel, T.; Kai, U.T. The mechanisms of gravity-constrained aggregation in natural colloidal suspensions. J. ColloidInterface Sci. 2021, 597, 126–136. [CrossRef] [PubMed]
34. Lerh, Y.V.; Zhukovsky, T.M.; Zhukovsky, M.S. Informational approach to self-assembling aggregation of colloidal nanoparticles.Mater. Sci. Eng. C 2009, 29, 884–888.
35. Vahedi, A.; Gorczyca, B. Predicting the settling velocity of flocs formed in water treatment using multiple fractal dimensions.Water Res. 2012, 46, 4188–4194. [CrossRef] [PubMed]
36. Valadez-Pérez, N.; Liu, Y.; Castaneda-Priego, R. Cluster morphology of colloidal systems with competing interactions. Front.Phys. 2021, 9, 88. [CrossRef]
37. Chang, Y.; Liu, Q.J.; Zhang, J.S. Flocculation control study based on fractal theory. J. Zhejiang Univ. Sci. Life Sci. 2005, 6, 1038–1044.[CrossRef] [PubMed]
38. O’Melia, C.R. ES Features: Aquasols: The behavior of small particles in aquatic systems. Environ. Sci. Technol. 1980, 14, 1052–1060.[CrossRef]
39. Wang, Z.; Nan, J.; Ji, X.; Yang, Y. Effect of the micro-flocculation stage on the flocculation/sedimentation process: The role ofshear rate. Sci. Total Environ. 2018, 633, 1183–1191. [CrossRef]
40. Yao, M.; Nan, J.; Chen, T.; Zhan, D.; Li, Q.; Wang, Z.; Li, H. Influence of flocs breakage process on membrane fouling incoagulation/ultrafiltration process—Effect of additional coagulant of poly-aluminum chloride and polyacrylamide. J. Membr. Sci.2015, 491, 63–72. [CrossRef]
41. Yao, M.; Nan, J.; Li, Q.; Zhan, D.; Chen, T.; Wang, Z.; Li, H. Effect of under-dosing coagulant on coagulation–ultrafiltration processfor treatment of humic-rich water with divalent calcium ion. J. Membr. Sci. 2015, 495, 37–47. [CrossRef]