experimental study of partially grouted...
TRANSCRIPT

10th Canadian Masonry Symposium, Banff, Alberta, June 8 – 12, 2005
EXPERIMENTAL STUDY OF PARTIALLY GROUTED CONCRETE MASONRY WALLS WITH OPENINGS
K.C. Voon1 and J.M. Ingham2 1PhD student, Dept of Civil and Environmental Engineering, University of Auckland, Private Bag 92019, Auckland,
New Zealand, [email protected] 2Senior Lecturer, Dept of Civil and Environmental Engineering, University of Auckland, [email protected] ABSTRACT Masonry shear walls have attracted the attention of many researchers because of their role as lateral force resisting elements. However, most of this research was carried out to study the behaviour of solid masonry shear walls, despite the fact that masonry walls are commonly constructed with openings. Consequently, eight partially grout-filled nominally reinforced concrete masonry walls with openings were tested under cyclic lateral loading at the University of Auckland. These walls had variations in lintel reinforcement detailing, and a range of opening geometries. The objectives of this research were to study the performance of concrete masonry walls with openings under seismic loading conditions and to validate the adequacy of NZS 4229:1999 in addressing the bracing capacity of these types of masonry walls. It was shown that NZS 4229:1999 unsafely over-predicts the strength capacity of concrete masonry wall with small opening. However, the conservatism of NZS 4229:1999 was shown to increase when the depth of openings increased. Furthermore, an analysis method based on strut-and-tie models was shown to be viable for the design of nominally reinforced masonry walls with openings. KEYWORDS: concrete masonry, reinforced, partially-grouted, openings, cyclic loading INTRODUCTION For many decades, masonry has been used as a common structural material in a large proportion of New Zealand building projects. However, the poor performance of unreinforced masonry in the magnitude 7.8 1931 Hawke’s Bay Earthquake [1, 2] subsequently led to the development of conservative concrete masonry design provisions in New Zealand. Consequently, a typical detail was the use of ∅ 12 mm grade 300 MPa reinforcement at 400 mm centres, both vertically and horizontally, in fully-grouted concrete masonry walls. The recent promulgation of alternative construction forms has resulted in the perception within New Zealand that reinforced concrete masonry is an expensive form of construction when compared with competing products and systems. Consequently, a decision was made by the New Zealand concrete masonry industry to develop a non-specific design standard NZS 4229:1999 [3] which, whilst retaining suitable conservatism, was more realistic in its treatment of measured experimental response. In particular, attention was given to permit the use of partially grout-filled nominally reinforced concrete masonry in the most seismically active regions of New Zealand. Furthermore, efforts
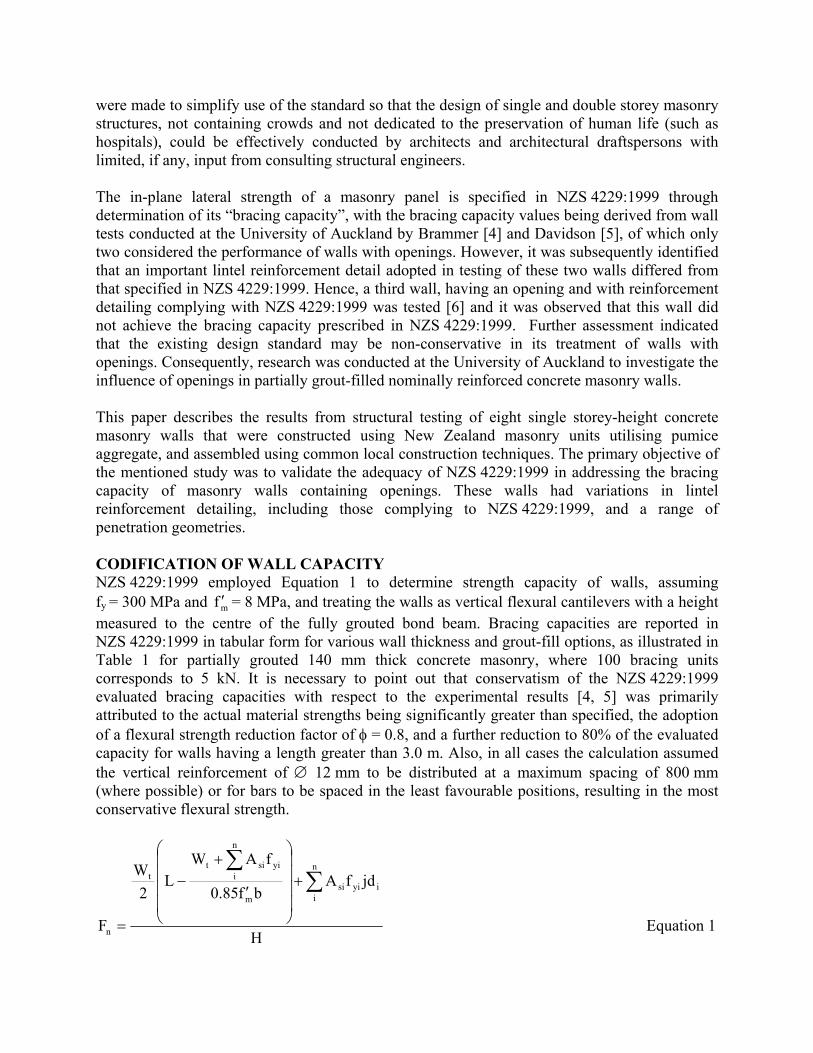
were made to simplify use of the standard so that the design of single and double storey masonry structures, not containing crowds and not dedicated to the preservation of human life (such as hospitals), could be effectively conducted by architects and architectural draftspersons with limited, if any, input from consulting structural engineers. The in-plane lateral strength of a masonry panel is specified in NZS 4229:1999 through determination of its “bracing capacity”, with the bracing capacity values being derived from wall tests conducted at the University of Auckland by Brammer [4] and Davidson [5], of which only two considered the performance of walls with openings. However, it was subsequently identified that an important lintel reinforcement detail adopted in testing of these two walls differed from that specified in NZS 4229:1999. Hence, a third wall, having an opening and with reinforcement detailing complying with NZS 4229:1999 was tested [6] and it was observed that this wall did not achieve the bracing capacity prescribed in NZS 4229:1999. Further assessment indicated that the existing design standard may be non-conservative in its treatment of walls with openings. Consequently, research was conducted at the University of Auckland to investigate the influence of openings in partially grout-filled nominally reinforced concrete masonry walls. This paper describes the results from structural testing of eight single storey-height concrete masonry walls that were constructed using New Zealand masonry units utilising pumice aggregate, and assembled using common local construction techniques. The primary objective of the mentioned study was to validate the adequacy of NZS 4229:1999 in addressing the bracing capacity of masonry walls containing openings. These walls had variations in lintel reinforcement detailing, including those complying to NZS 4229:1999, and a range of penetration geometries. CODIFICATION OF WALL CAPACITY NZS 4229:1999 employed Equation 1 to determine strength capacity of walls, assuming fy = 300 MPa and mf ′ = 8 MPa, and treating the walls as vertical flexural cantilevers with a height measured to the centre of the fully grouted bond beam. Bracing capacities are reported in NZS 4229:1999 in tabular form for various wall thickness and grout-fill options, as illustrated in Table 1 for partially grouted 140 mm thick concrete masonry, where 100 bracing units corresponds to 5 kN. It is necessary to point out that conservatism of the NZS 4229:1999 evaluated bracing capacities with respect to the experimental results [4, 5] was primarily attributed to the actual material strengths being significantly greater than specified, the adoption of a flexural strength reduction factor of φ = 0.8, and a further reduction to 80% of the evaluated capacity for walls having a length greater than 3.0 m. Also, in all cases the calculation assumed the vertical reinforcement of ∅ 12 mm to be distributed at a maximum spacing of 800 mm (where possible) or for bars to be spaced in the least favourable positions, resulting in the most conservative flexural strength.
H
jdfAbf85.0
fAWL
2W
F
n
iiyisi
m
n
iyisit
t
n
∑∑
+
′
+−
= Equation 1

Table 1 – Bracing Capacities* for 140 mm Partially Grouted Concrete Masonry Panel Length (m) Panel
Height (m) 0.8 1.2 1.6 2.0 2.8 3.6 4.4 5.2 6.0 0.8 385 650 1005 1425 2505 3110 4455 6040 7870 1.2 275 470 730 1035 1825 2265 3250 4415 5750 2.0 180 305 480 680 1205 1500 2155 2930 3825 3.0 125 215 340 490 870 1085 1560 2125 2780
* 100 Bracing Units corresponds to 5 kN EXPERIMENTAL PROGRAMME The eight test specimens, shown in Figure 1, were single-storey walls having variations in lintel reinforcement detailing, including those complying to NZS 4229:1999, and with a range of penetration geometries. Although single-storey walls do not have the complexity of a multi-storey structure, they are advantageous to consider due to the ease of data interpretation. All eight walls were partially grout-filled, where only those cells containing reinforcement were grouted, and were constructed to a common height of 2400 mm. None of the eight walls had applied axial compression load. The tests were performed in order to validate the NZS 4229:1999 prescribed bracing capacities for concrete masonry walls constructed with openings.
(d) Wall 4
(c) Wall 3
2000
(h) Wall 8(g) Wall 7
(b) Wall 2
1200
600
(a) Wall 1
800
(f) Wall 6(e) Wall 5
4200
D16 Bond BeamR6 str @ 600mm c/c
Lintel R6 str @ 100mm c/c
2600
600
D12 @ 800mm c/c
D16 600
D16
D12 @ 800mm c/c
2600
Lintel R6 str @ 100mm c/c D16 Bond BeamR6 str @ 600mm c/c
D12 @ 800mm c/c
D16 Bond BeamR6 str @ 600mm c/c
2600
Lintel R6 str @ 100mm c/c
D16 Bond BeamR6 str @ 600mm c/c
Lintel R6 str @ 100mm c/c
D12 @ 800mm c/c
D16
2600
600
1200
D16 Bond BeamR6 str @ 600mm c/c
D16
D12 @ 800mm c/c
2600
Lintel R6 str @ 100mm c/c
1200
600
Lintel R6 str @ 100mm c/c
600
1200
1200
600
D16 Bond BeamR6 str @ 600mm c/c
D16
D12 @ 800mm c/c
1200
600
Lintel R6 str @ 100mm c/c
600
2000
Lintel R6 str @ 100mm c/c D16 Bond BeamR6 str @ 600mm c/c
D12 @ 800mm c/c
D16
600
1200
2000
600
4200 4200
Figure 1 – Reinforcing Details and Dimensions of Test Specimens
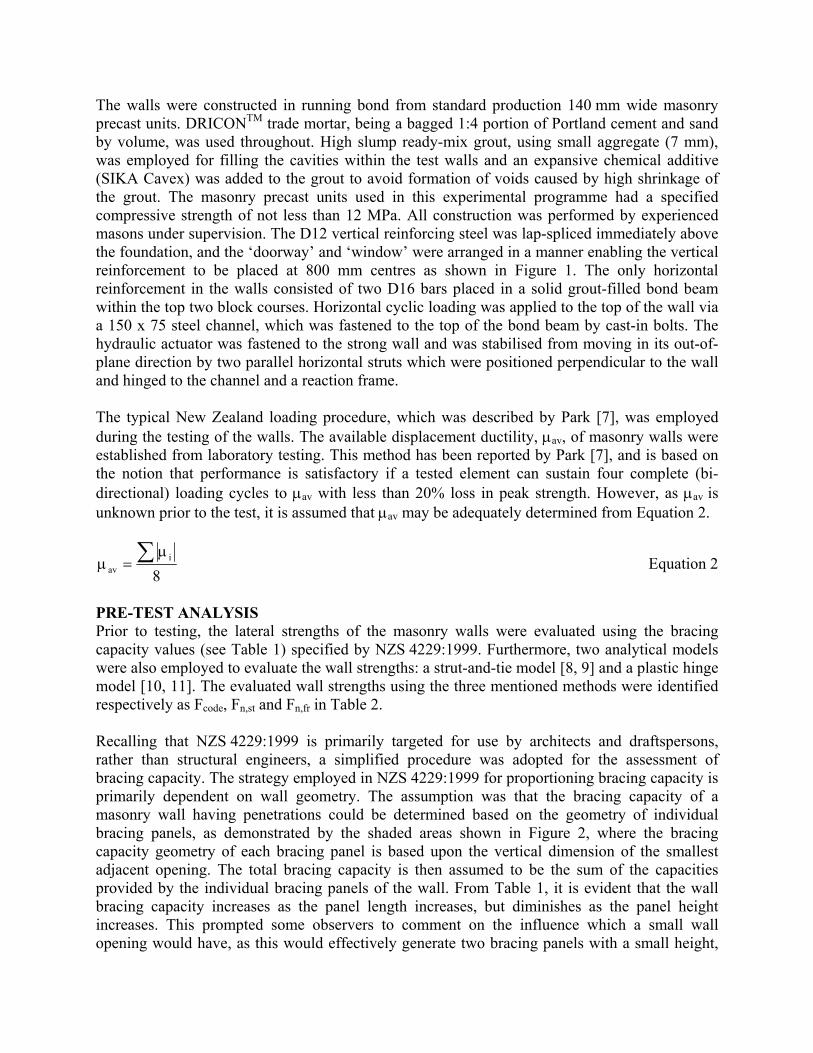
The walls were constructed in running bond from standard production 140 mm wide masonry precast units. DRICONTM trade mortar, being a bagged 1:4 portion of Portland cement and sand by volume, was used throughout. High slump ready-mix grout, using small aggregate (7 mm), was employed for filling the cavities within the test walls and an expansive chemical additive (SIKA Cavex) was added to the grout to avoid formation of voids caused by high shrinkage of the grout. The masonry precast units used in this experimental programme had a specified compressive strength of not less than 12 MPa. All construction was performed by experienced masons under supervision. The D12 vertical reinforcing steel was lap-spliced immediately above the foundation, and the ‘doorway’ and ‘window’ were arranged in a manner enabling the vertical reinforcement to be placed at 800 mm centres as shown in Figure 1. The only horizontal reinforcement in the walls consisted of two D16 bars placed in a solid grout-filled bond beam within the top two block courses. Horizontal cyclic loading was applied to the top of the wall via a 150 x 75 steel channel, which was fastened to the top of the bond beam by cast-in bolts. The hydraulic actuator was fastened to the strong wall and was stabilised from moving in its out-of-plane direction by two parallel horizontal struts which were positioned perpendicular to the wall and hinged to the channel and a reaction frame. The typical New Zealand loading procedure, which was described by Park [7], was employed during the testing of the walls. The available displacement ductility, µav, of masonry walls were established from laboratory testing. This method has been reported by Park [7], and is based on the notion that performance is satisfactory if a tested element can sustain four complete (bi-directional) loading cycles to µav with less than 20% loss in peak strength. However, as µav is unknown prior to the test, it is assumed that µav may be adequately determined from Equation 2.
8i
av∑ µ
=µ Equation 2
PRE-TEST ANALYSIS Prior to testing, the lateral strengths of the masonry walls were evaluated using the bracing capacity values (see Table 1) specified by NZS 4229:1999. Furthermore, two analytical models were also employed to evaluate the wall strengths: a strut-and-tie model [8, 9] and a plastic hinge model [10, 11]. The evaluated wall strengths using the three mentioned methods were identified respectively as Fcode, Fn,st and Fn,fr in Table 2. Recalling that NZS 4229:1999 is primarily targeted for use by architects and draftspersons, rather than structural engineers, a simplified procedure was adopted for the assessment of bracing capacity. The strategy employed in NZS 4229:1999 for proportioning bracing capacity is primarily dependent on wall geometry. The assumption was that the bracing capacity of a masonry wall having penetrations could be determined based on the geometry of individual bracing panels, as demonstrated by the shaded areas shown in Figure 2, where the bracing capacity geometry of each bracing panel is based upon the vertical dimension of the smallest adjacent opening. The total bracing capacity is then assumed to be the sum of the capacities provided by the individual bracing panels of the wall. From Table 1, it is evident that the wall bracing capacity increases as the panel length increases, but diminishes as the panel height increases. This prompted some observers to comment on the influence which a small wall opening would have, as this would effectively generate two bracing panels with a small height,

rather than a single panel that is taller and longer, such that it is conceivable that the addition of a small wall opening might result in the evaluated capacity of the wall to increase.
(d) Wall 6
800
(a) Wall 1
1200
(b) Walls 2, 4 & 5
(e) Walls 7 & 8
2000
(c) Wall 3
1000 1000 10001000 10001000
1000 1000 1000 100010001000
2000
1200
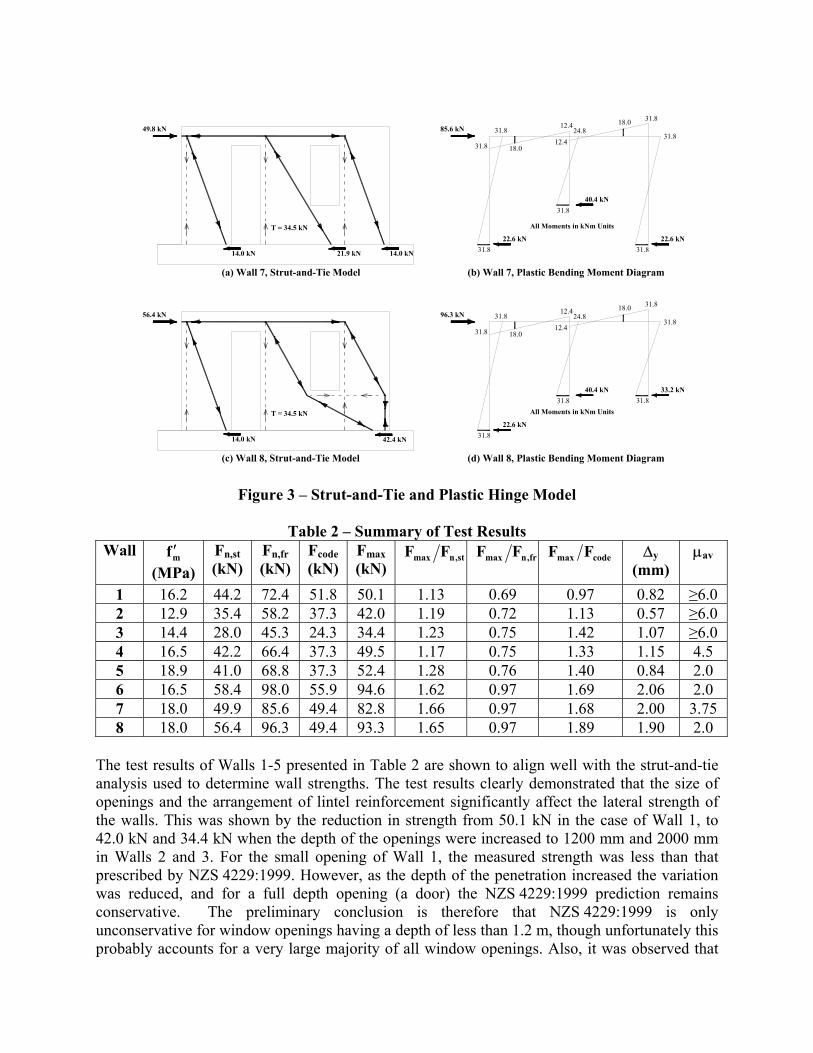
1200
Figure 2 – Identification of Bracing Panels Due to the presence of openings in the test specimens, Equation 1 was deemed to be inappropriate for evaluating the nominal lateral strength of the test specimens. Consequently, a strut-and-tie model and a plastic hinge model were employed to evaluate the wall strengths. A simple illustration of these two models for Walls 7 and 8 are shown diagrammatically in Figure 3. For the strut-and-tie model, it was assumed that all panels were pinned at the bond beam centre. The resultant strut-and-tie analyses are presented in Figures 3a and 3c, where the struts are indicated by a broader element thickness. It is also illustrated in Figure 3c that the introduction of extended lintel reinforcement beneath the window in Wall 8 would result in an increase in wall strength, due to change of slope of the strut component in the right hand side panel. Please note that the model shown in Figure 3c would not be applicable when the force was reversed because the lintel reinforcement below the window was not extended to the door. As for the plastic hinge model, the wall was treated as a frame comprising of three vertical piers in order to develop the plastic bending moment diagram shown in Figures 3b and 3d. By conducting a push-over or plastic collapse analysis, it was found that the flexural strength at the base of each pier was developed, but that the moments at the top of the frame were largely governed by the lintel strength. EXPERIMENTAL RESULTS This section reports the experimental results of the eight concrete masonry walls detailed in Figure 1. Particular attention was given to maximum strengths, stiffness, ductility, modes of failure, force-displacement characteristics, and also the shear and flexural components of displacement. The maximum lateral force recorded during the test Fmax and the experimentally determined bilinear yield (or ductility 1) displacement ∆y are reported in Table 2. The bilinear yield displacement was evaluated by extrapolating (x 4/3) the measured displacement at ±0.75Fn.
31.8 31.8
31.8
18.0 31.8
31.812.4
12.424.8
18.031.8
31.8
All Moments in kNm Units
(a) Wall 7, Strut-and-Tie Model (b) Wall 7, Plastic Bending Moment Diagram
49.8 kN
14.0 kN 21.9 kN 14.0 kN
T = 34.5 kN
85.6 kN
22.6 kN
40.4 kN
22.6 kN
22.6 kN
40.4 kN 33.2 kN
96.3 kN
T = 34.5 kN
42.4 kN14.0 kN
56.4 kN
(d) Wall 8, Plastic Bending Moment Diagram(c) Wall 8, Strut-and-Tie Model
All Moments in kNm Units
31.8
31.8 18.0
24.812.4
12.431.8
31.818.0
31.8 31.8
31.8
Figure 3 – Strut-and-Tie and Plastic Hinge Model
Table 2 – Summary of Test Results
Wall mf ′ (MPa)
Fn,st (kN)
Fn,fr (kN)
Fcode (kN)
Fmax (kN)
st,nmax FF
fr,nmax FF
codemax FF
∆y (mm)
µav
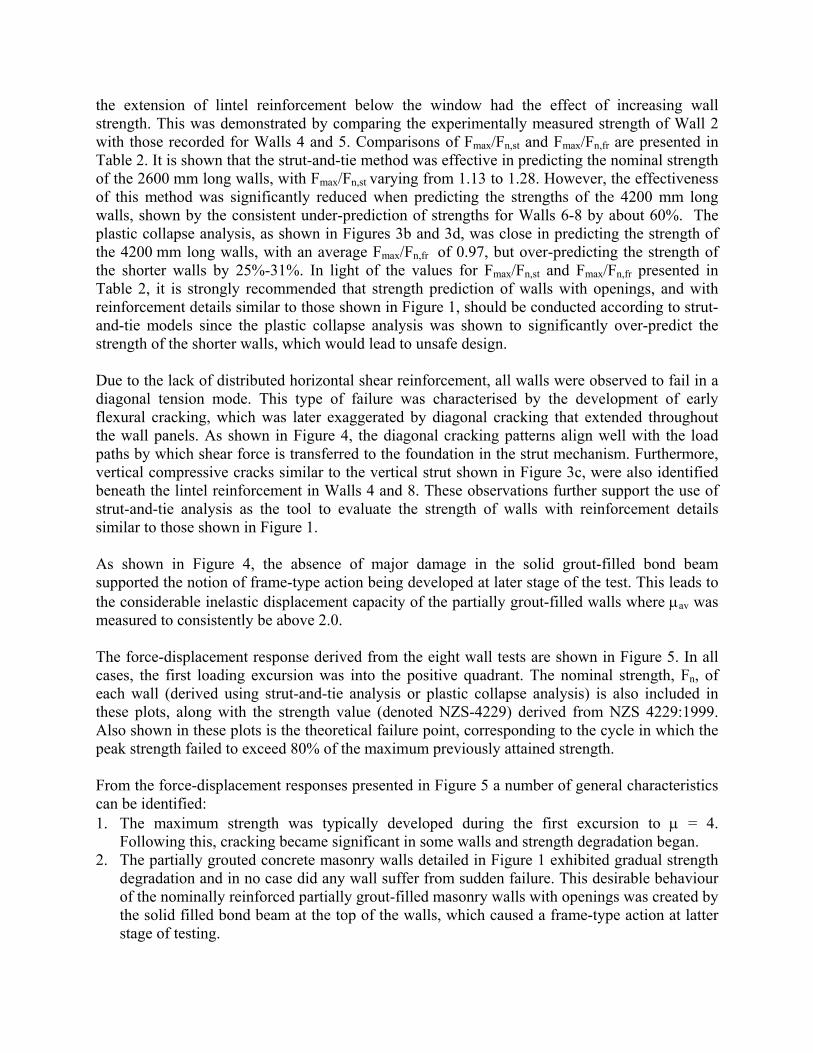
1 16.2 44.2 72.4 51.8 50.1 1.13 0.69 0.97 0.82 ≥6.0 2 12.9 35.4 58.2 37.3 42.0 1.19 0.72 1.13 0.57 ≥6.0 3 14.4 28.0 45.3 24.3 34.4 1.23 0.75 1.42 1.07 ≥6.0 4 16.5 42.2 66.4 37.3 49.5 1.17 0.75 1.33 1.15 4.5 5 18.9 41.0 68.8 37.3 52.4 1.28 0.76 1.40 0.84 2.0 6 16.5 58.4 98.0 55.9 94.6 1.62 0.97 1.69 2.06 2.0 7 18.0 49.9 85.6 49.4 82.8 1.66 0.97 1.68 2.00 3.75 8 18.0 56.4 96.3 49.4 93.3 1.65 0.97 1.89 1.90 2.0
The test results of Walls 1-5 presented in Table 2 are shown to align well with the strut-and-tie analysis used to determine wall strengths. The test results clearly demonstrated that the size of openings and the arrangement of lintel reinforcement significantly affect the lateral strength of the walls. This was shown by the reduction in strength from 50.1 kN in the case of Wall 1, to 42.0 kN and 34.4 kN when the depth of the openings were increased to 1200 mm and 2000 mm in Walls 2 and 3. For the small opening of Wall 1, the measured strength was less than that prescribed by NZS 4229:1999. However, as the depth of the penetration increased the variation was reduced, and for a full depth opening (a door) the NZS 4229:1999 prediction remains conservative. The preliminary conclusion is therefore that NZS 4229:1999 is only unconservative for window openings having a depth of less than 1.2 m, though unfortunately this probably accounts for a very large majority of all window openings. Also, it was observed that
the extension of lintel reinforcement below the window had the effect of increasing wall strength. This was demonstrated by comparing the experimentally measured strength of Wall 2 with those recorded for Walls 4 and 5. Comparisons of Fmax/Fn,st and Fmax/Fn,fr are presented in Table 2. It is shown that the strut-and-tie method was effective in predicting the nominal strength of the 2600 mm long walls, with Fmax/Fn,st varying from 1.13 to 1.28. However, the effectiveness of this method was significantly reduced when predicting the strengths of the 4200 mm long walls, shown by the consistent under-prediction of strengths for Walls 6-8 by about 60%. The plastic collapse analysis, as shown in Figures 3b and 3d, was close in predicting the strength of the 4200 mm long walls, with an average Fmax/Fn,fr of 0.97, but over-predicting the strength of the shorter walls by 25%-31%. In light of the values for Fmax/Fn,st and Fmax/Fn,fr presented in Table 2, it is strongly recommended that strength prediction of walls with openings, and with reinforcement details similar to those shown in Figure 1, should be conducted according to strut-and-tie models since the plastic collapse analysis was shown to significantly over-predict the strength of the shorter walls, which would lead to unsafe design. Due to the lack of distributed horizontal shear reinforcement, all walls were observed to fail in a diagonal tension mode. This type of failure was characterised by the development of early flexural cracking, which was later exaggerated by diagonal cracking that extended throughout the wall panels. As shown in Figure 4, the diagonal cracking patterns align well with the load paths by which shear force is transferred to the foundation in the strut mechanism. Furthermore, vertical compressive cracks similar to the vertical strut shown in Figure 3c, were also identified beneath the lintel reinforcement in Walls 4 and 8. These observations further support the use of strut-and-tie analysis as the tool to evaluate the strength of walls with reinforcement details similar to those shown in Figure 1. As shown in Figure 4, the absence of major damage in the solid grout-filled bond beam supported the notion of frame-type action being developed at later stage of the test. This leads to the considerable inelastic displacement capacity of the partially grout-filled walls where µav was measured to consistently be above 2.0. The force-displacement response derived from the eight wall tests are shown in Figure 5. In all cases, the first loading excursion was into the positive quadrant. The nominal strength, Fn, of each wall (derived using strut-and-tie analysis or plastic collapse analysis) is also included in these plots, along with the strength value (denoted NZS-4229) derived from NZS 4229:1999. Also shown in these plots is the theoretical failure point, corresponding to the cycle in which the peak strength failed to exceed 80% of the maximum previously attained strength. From the force-displacement responses presented in Figure 5 a number of general characteristics can be identified: 1. The maximum strength was typically developed during the first excursion to µ = 4.
Following this, cracking became significant in some walls and strength degradation began. 2. The partially grouted concrete masonry walls detailed in Figure 1 exhibited gradual strength
degradation and in no case did any wall suffer from sudden failure. This desirable behaviour of the nominally reinforced partially grout-filled masonry walls with openings was created by the solid filled bond beam at the top of the walls, which caused a frame-type action at latter stage of testing.
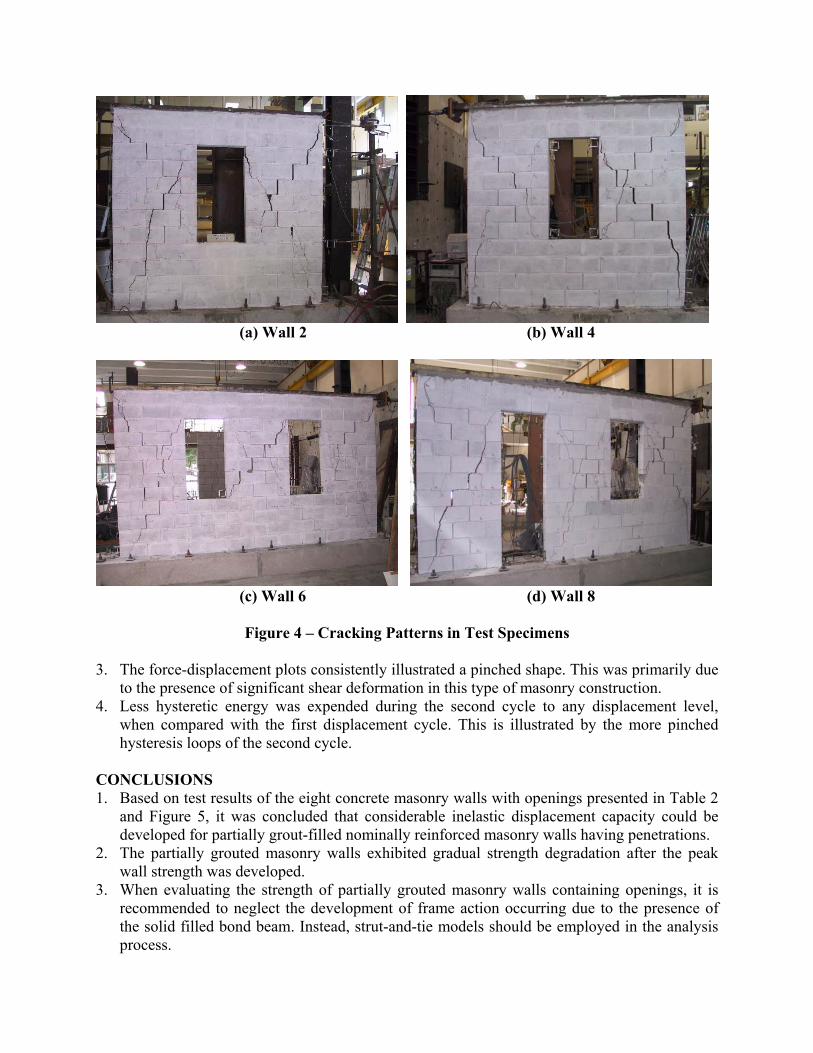
(a) Wall 2 (b) Wall 4
(c) Wall 6 (d) Wall 8
Figure 4 – Cracking Patterns in Test Specimens
3. The force-displacement plots consistently illustrated a pinched shape. This was primarily due
to the presence of significant shear deformation in this type of masonry construction. 4. Less hysteretic energy was expended during the second cycle to any displacement level,
when compared with the first displacement cycle. This is illustrated by the more pinched hysteresis loops of the second cycle.
CONCLUSIONS 1. Based on test results of the eight concrete masonry walls with openings presented in Table 2
and Figure 5, it was concluded that considerable inelastic displacement capacity could be developed for partially grout-filled nominally reinforced masonry walls having penetrations.
2. The partially grouted masonry walls exhibited gradual strength degradation after the peak wall strength was developed.
3. When evaluating the strength of partially grouted masonry walls containing openings, it is recommended to neglect the development of frame action occurring due to the presence of the solid filled bond beam. Instead, strut-and-tie models should be employed in the analysis process.

NZS-4229
NZS-4229
Fn,st
Fn,st
-60-50-40-30-20-10
0102030405060
-20.0 -16.0 -12.0 -8.0 -4.0 0.0 4.0 8.0 12.0 16.0 20.0
Leteral Displacement, mm
Late
ral S
treng
th (k
N)
Before FailureAfter Failure
NZS 4229
NZS 4229
Fn,st
Fn,st
-50
-40
-30
-20
-10
0
10
20
30
40
50
-10.0 -8.0 -6.0 -4.0 -2.0 0.0 2.0 4.0 6.0 8.0 10.0
Lateral Displacement, mm
Late
ral S
treng
th (k
N)
Before FailureAfter Failure
(a) Wall 1 (b) Wall 2
NZS-4229
NZS-4229
Fn,st
Fn,st
-40
-30
-20
-10
0
10
20
30
40
-16.0 -12.0 -8.0 -4.0 0.0 4.0 8.0 12.0 16.0
Lateral Displacement, mm
Late
ral S
treng
th (k
N)
BeforeFailureAfter Failure
NZS-4229
NZS-4229
Fn,st
Fn,st
-60-50-40-30
-20-10
0
1020
3040
5060
-16.0 -12.0 -8.0 -4.0 0.0 4.0 8.0 12.0 16.0
Lateral Displacement, mm
Late
ral S
treng
th (k
N)
Before FailureAfter Failure
(c) Wall 3 (d) Wall 4
NZS-4229
NZS-4229
Fn,st
Fn,st
-60
-50
-40
-30
-20
-10
0
10
20
30
40
50
60
-16.0 -12.0 -8.0 -4.0 0.0 4.0 8.0 12.0 16.0
Lateral Displacement, mm
Late
ral S
treng
th (k
N)
Before FailureAfter Failure
NZS-4229
NZS-4229
Fn,fr
Fn,fr
-120
-100
-80
-60
-40
-20
0
20
40
60
80
100
120
-30.0 -25.0 -20.0 -15.0 -10.0 -5.0 0.0 5.0 10.0 15.0 20.0 25.0 30.0
Lateral Displacement, mm
Late
ral S
treng
th (k
N)
Before FailureAfter Failure
(e) Wall 5 (f) Wall 6
NZS-4229
NZS-4229
Fn,fr
Fn,fr
-100
-80
-60
-40
-20
0
20
40
60
80
100
-30.0 -25.0 -20.0 -15.0 -10.0 -5.0 0.0 5.0 10.0 15.0 20.0 25.0 30.0
Lateral Displacement, mm
Late
ral S
treng
th (k
N)
Before FailureAfter Failure
NZS-4229
NZS-4229
Fn,fr
Fn,fr
-100
-80
-60
-40
-20
0
20
40
60
80
100
-20.0 -16.0 -12.0 -8.0 -4.0 0.0 4.0 8.0 12.0 16.0 20.0Lateral Displacement, mm
Late
ral S
treng
th (k
N)
Before FailureAfter Failure
(g) Wall 7 (h) Wall 8 Figure 5 – Force-Displacement Response of Masonry Walls

4. The diagonal cracking patterns align well with the load paths by which shear force is assumed to be transferred to the foundation in the strut mechanism. This observation supported use of strut-and-tie analysis as the tool to evaluate the strength of nominally reinforced masonry walls with openings.
5. NZS 4229:1999 was found to over-predict the strength capacity of the wall containing a small opening. The conservatism of NZS 4229 would increase when the depth of opening is increased or the length of lintel reinforcement is extended below an opening.
ACKNOWLEDGEMENTS The study presented in this paper was sponsored by the New Zealand Earthquake Commission Research Foundation, Firth Industries Ltd., W. Stevenson and Sons Ltd., and Ready Mix Concrete Ltd. The authors also wish to acknowledge contributions by Hank Mooy, Tony Daligan and Chris Mancini who were responsible for the practical aspects in relation to testing of the wall specimens in the Civil Test Hall. REFERENCES 1. Dowrick, D.J. Damage and Intensities in the Magnitude 7.8 1931 Hawke’s Bay, New
Zealand, Earthquake. Bulletin of NZSEE, Vol. 30, No. 2. 1998. 2. Scott, E.F. A Report on the Relief Organisation in Hastings Arising out of the [Magnitude
7.8] Earthquake in Hawke’s Bay [New Zealand] on February 3, 1931. Bulletin of NZSEE, Vol. 32, No. 4. 1999.
3. NZS 4229:1999. Concrete Masonry Buildings Not Requiring Specific Engineering Design. Standards Association of New Zealand. Wellington.
4. Brammer, D.R. The Lateral Force-Deflection Behaviour of Nominally Reinforced Masonry Walls. ME Thesis. Department of Civil and Resource Engineering. University of Auckland. 1995.
5. Davidson, B.J. In-Plane Cyclic Loading of Nominally Reinforced Masonry Walls with Openings. New Zealand Concrete Society Conference. Wairakei. New Zealand. 1996.
6. Ingham, J.M., Davidson, B.J., Brammer, D.R., and Voon, K.C. Testing and Codification of Partially Grout-filled Nominally-reinforced Concrete Masonry Subjected to In-plane Cyclic Loads. The Masonry Society Journal, Vol. 19, No. 1. 2001.
7. Park, R. Evaluation of Ductility of Structures and Structural Assemblages for Laboratory Testing. Bulletin of the NZSEE, Vol. 22, No. 3. 1989.
8. Yanez, F.V., Park, R., and Paulay, T. Seismic Behaviour of Reinforced Concrete Structural Walls with Irregular Openings. Pacific Conference on Earthquake Engineering. New Zealand. 1991.
9. Wu, H., and Li, B. Investigating the Load Paths of RC Shear Wall with Openings under Reversed Cyclic Loadings. Pacific Conference on Earthquake Engineering. New Zealand. 2003.
10. Leiva, G., Merryman, M. and Klingner, R.E. Design Philosophies for Two-Storey Concrete Masonry Walls with Door and Window Openings. Fifth North American Masonry Conference. University of Illinois. Urbana-Champagne. 1990.
11. Elshafie, H., Hamid, A., and Nasr, E. Strength and Stiffness of Masonry Shear Walls with Openings. The Masonry Society Journal. 2002.