experimental studies and modeling of surface bubble
TRANSCRIPT

Accepted Manuscript
Title: Experimental studies and modeling of surface bubblebehaviour in froth flotation
Author: Hangil Park Liguang Wang
PII: S0263-8762(15)00135-5DOI: http://dx.doi.org/doi:10.1016/j.cherd.2015.04.021Reference: CHERD 1850
To appear in:
Received date: 6-2-2015Revised date: 22-4-2015Accepted date: 23-4-2015
Please cite this article as: Park, H., Wang, L.,Experimental studies and modeling ofsurface bubble behaviour in froth flotation, Chemical Engineering Research and Design(2015), http://dx.doi.org/10.1016/j.cherd.2015.04.021
This is a PDF file of an unedited manuscript that has been accepted for publication.As a service to our customers we are providing this early version of the manuscript.The manuscript will undergo copyediting, typesetting, and review of the resulting proofbefore it is published in its final form. Please note that during the production processerrors may be discovered which could affect the content, and all legal disclaimers thatapply to the journal pertain.
Page 1 of 18
Accep
ted
Man
uscr
ipt
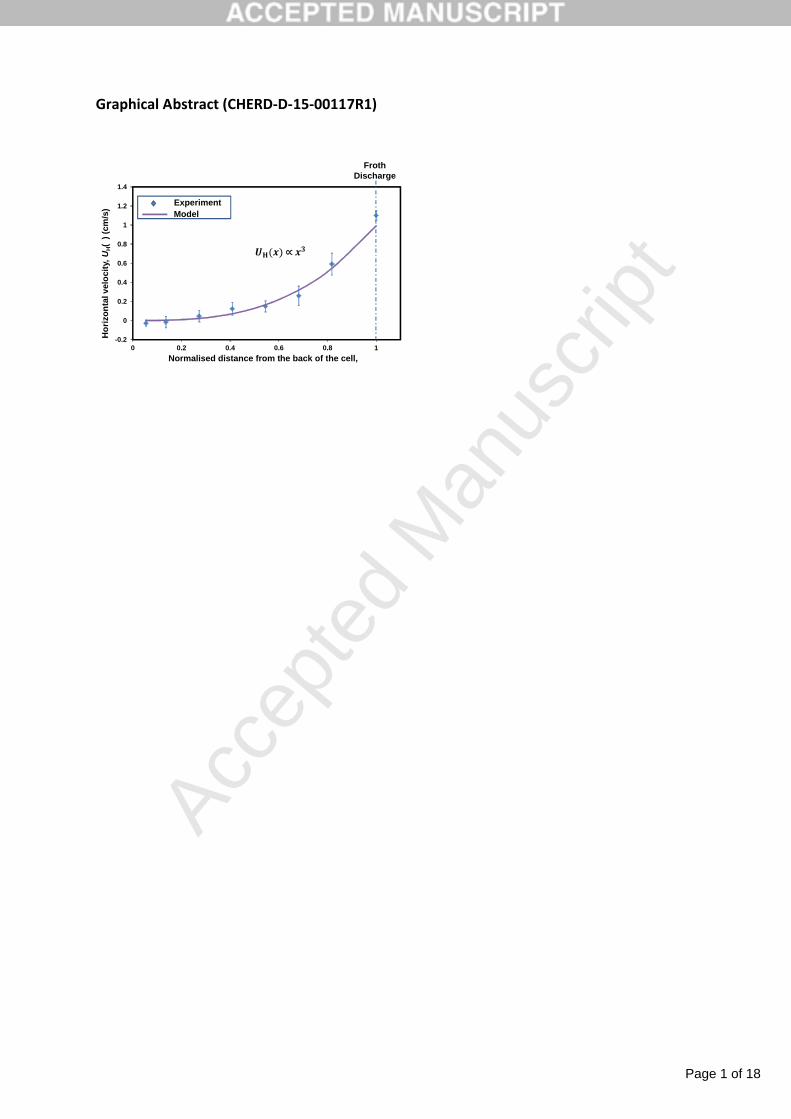
Graphical Abstract (CHERD-D-15-00117R1)
-0.2
0
0.2
0.4
0.6
0.8
1
1.2
1.4
0 0.2 0.4 0.6 0.8 1
Ho
rizo
nta
l vel
oci
ty,
UH(
) (c
m/s
)
Normalised distance from the back of the cell,
ExperimentModel
Froth Discharge
Page 2 of 18
Accep
ted
Man
uscr
ipt
Highlights
The horizontal velocity profile of the froth phase in coal flotation was measured
Comparisons between experiment and model were made
Six cumulative air recovery functions in the froth transport model were assessed
The cumulative air recovery function expressed in a power-law was the most suitable

Page 3 of 18
Accep
ted
Man
uscr
ipt
Experimental studies and modeling of surface bubble behaviour in froth flotationHangil Park and Liguang Wang*
The University of Queensland, School of Chemical Engineering, Brisbane, Qld 4072
Corresponding author: [email protected]; phone number +61 7 3365 7942
AbstractFroth flotation is a versatile, widely used beneficiation technique employing air bubbles to selectively pick up certain particles in aqueous medium. The performance of the flotation process is significantly affected by froth stability and mobility, posing the need for precise control of the froth phase. The present paper aims to understand the motion of bubbles entering the froth phase from the pulp phase at different locations. The horizontal velocities of air bubbles across the top surface of the froth containing fine coal particles were measured. The results showed that at the region farthest from the froth discharge lip, no horizontal movement of the surface bubbles could be observed, and when approaching the lip there would be an increase in the horizontal velocity. The measured velocity profile was fitted to a froth model that considers the cumulative air recovery as a function of location. Six different types of cumulative air recovery functions were tested. The coefficient of determination (R2) and the Akaike information criterion were applied to select the cumulative air recovery function with best fit to describe the horizontal velocity profile. The selected cumulative air recovery function was in a simple power-law form.
Keywords: Froth stability; Coal flotation; Transport model; Air recovery; Froth velocity
1 IntroductionFroth flotation is one of the most widely used particle separation techniques important to mineral and coal processing, waste paper recycling, and water treatment. In mineral industry, froth flotation is used to separate valuable fine mineral particles from the gangue. The flotation employs small air bubbles to selectively pick up the hydrophobic particles dispersed in water. The particle and air bubble aggregates in the pulp phase rise up andenter the froth phase where there are a number of sub-processes such as particle attachment, detachment, reattachment, liquid drainage, and bubble coalescence and bursting. The residence time of the aggregates in froth phase is considered an important factor affecting the flotation performance. Since the residence time is influenced by the behaviour of bubbles in the froth phase, it is essential to understand the motion of bubbles inside the froth phase.
Recent research progress found that flotation performance could have a strong correlation with air recovery, which is the fraction of air entering a flotation cell that overflows the froth discharge lip as unburst bubbles. For instance, Hadler et al. (2012) and Smith et al. (2010a, b) showed that peak air recovery (PAR) could indicate optimal flotation performance.

Page 4 of 18
Accep
ted
Man
uscr
ipt
However, air recovery gives little information on the motion of bubbles entering the froth phase from the pulp phase at different locations, from which the bubbles would have different residence times in the froth phase.
Some models have been developed to estimate the motion of the bubbles inside the froth phase based on measurable variables (Moys, 1979; Zheng et al., 2004; Zheng and Knopjes,2004; Contreras et al., 2013 ). Moys (1979) described the bubble motion inside the froth phase using the Laplace equation. Murphy et al. (1996) and Cilliers and co-workers (Neethling and Cilliers, 2003; Birito-Parada and Cillier, 2012; Cole et al., 2012) also used the Laplace equation to model the froth phase. However, the computational cost for solving the Laplace equation is relatively high. Moys (1979) also developed a simple transportation model based on mass balance equations. Similar approach was adopted by Zheng et al. (2004), Zheng and Knopjes (2004), and Contreras et al. (2013).
The aforementioned models corroborated well with the experimental results but many of them were only validated in two-phase foam systems (in the absence of solid particles). The solid particles can significantly affect froth stability and mobility by increasing the viscosity of the froth (Hunter et al., 2008) and the rigidity of the lamellae (Johansson and Pugh, 1992). Consequently, it is expected that the motion and velocity distribution of bubbles in the froth phase in the presence of particles is different from that in the absence of particles. Although Zheng et al. (2004), Zheng and Knopjes (2004), and Contreras et al. (2013) attempted to validate their transportation models using three-phase froth systems, the velocity measurements were carried out at only one or few positions across the froth surface.
In the present paper, we report the measured horizontal velocities of air bubbles across the froth surface of a laboratory-scale mechanical flotation cell fed with an aqueous suspension of fine coal particles. The experimental data were fitted to a froth model on the basis of the work of Contreras et al. (2013), incorporating a cumulative air recovery function. Two statistical methods were jointly used to select the best cumulative air recovery function to describe the surface velocity profile of the coal-laden froth. The implications of the present study for flotation cell design and operation are discussed.
2 Froth phase modelling 2.1 Model descriptionThe main frame work of this study was based on the froth transportation model of Contreras et al. (2013). Briefly, the model has the following major assumptions:
i. The bubbles enter evenly (at a fixed flux) across the froth phase from the pulp phase;
ii. The velocity profile of the froth is determined by the motion of air bubbles in the froth phase;
iii. The gas holdup is constant throughout the froth phase;
iv. The thickness of the froth phase is constant;

Page 5 of 18
Accep
ted
Man
uscr
ipt
Figure 1 shows that the froth phase is divided into vertical and mixed transportation zones. In the vertical transportation zone, the bubbles (or froth) rise up vertically in plug-flow mode. Once the bubbles reach the level of the froth discharge lip, they enter the mixed transportation zone and start to move horizontally. A bubble sitting on the top surface of the mixed transportation zone can either burst or remain intact. The chance for a bubble to be recovered to the concentrate stream unburst would be related to the location of the bubble entering the pulp/froth interface, because a bubble rising closer to the lip is expected to have a higher chance to be recovered into the product froth.
L
x
hf
Hf
Hout(X)Hin
Vin(X)
Vout(X)
Lip
FrothPulp
Figure 1. (L.H.S) Schematic drawing of the froth transportation zone. (R.H.S) Mass balance across the mixed transportation zone (Contreras et al., 2013).
The spatial horizontal velocity distribution can be obtained using a mass balance analysis for the mixed transportation zone (Fig.1, R.H.S).
[1]
where is the flow rate of air arriving at the mixed transportation zone from the vertical transportation zone between 0 and (normalised position, ), is the air flow leaving the mixed transportation zone by bubble bursting, is the horizontal flow rate of air entering the mixed transportation zone, and is the horizontal flow rate of air leaving the mixed transportation zone.
can be expressed using and the cumulative air recovery function, :
[2]

Page 6 of 18
Accep
ted
Man
uscr
ipt
where represents the fraction of the air entering between 0 to that is recovered as unburst bubbles in the concentrate. The cumulative air recovery function is defined as the integral of a specific air recovery function, over from 0 to . The physical meaning of the specific air recovery is the probability of a bubble entering at position that is recovered as unburst bubble at the discharging lip. Table 1 gives six different expressions for and the corresponding .
It was reported by Levia (2011) that on the basis of the experimental work for a two-phase foam system, the cumulative air recovery function follows an ‘S-Shaped‘ curve . In the present work, however, six different functions were tested (see Table 1). Thesecumulative air recovery function have two constraints: and . This means that at the back wall of the cell ( ), the cumulative air recovery must be 0, and at the froth discharge lip ( ), it should be equal to the overall air recovery, , which is measurable. The overall air recovery was determined using the following formula (Moys, 1984):
[3]
where is the total volumetric flow rate of air that enters the froth phase, is the gas hold up, is the velocity of the overflowing froth, is the height of the overflowing frothover the lip, (shown in Fig.2) is the length of the overflowing froth. Following Qu et al. (2013), when determining , the apparent flow rate of air ,which was 3 L/min at 200 kPa gauge pressure, was converted to those at ambient pressure.
With = ·Jg/ , , and , the horizontal velocity distribution, , of the mixed transportation zone can be obtained by combining Eqs. [1] and [2].
[4]
where is the superficial gas velocity (Qin divided by the cross section area of the flotation cell).
Table 1. Different types of and .
Expression Description Constraints of adjustable
parameters**
No. of adjustable
parametersof
1 Linear 02 Quadratic 1
3 Power law 1
4 Sinusoidal 0

Page 7 of 18
Accep
ted
Man
uscr
ipt
5* S-shape
where
A = 2 where
A =
6 Piecewise linear
, if
, if
where s is the size of the stagnant zone (see Section 4.1)
1
if , ;
if ,
*Expression 5 is the cumulative air recovery function that was proposed by Contreras et al. (2013). **The constraints of the fitting parameters are discussed in Section 4.2.
2.2 Model fitting to experimental dataEquation [4] comprising one of these six different cumulative air recovery functions, , as shown in Table 1, was fitted to the experimentally obtained froth surface horizontal velocity distribution using the method of least squares. The fitting was evaluated using twocriteria: the coefficient of the determination (R2) and the Akaike information criterion (AIC).
The AIC was used to evaluate and select the most suitable expression from the candidate expressions. It attains the trade-off between goodness of fitting and complexity of the model. Therefore, it helps to select the most suitable expressions in a given data set.According to Burnham and Anderson (2002), the AIC value can be calculated using Eq.[5], if the residual errors follow` constant variance and normal distribution.
[5]
where is the number of samples and is the total number of parameters in the model(e.g., for Expression 1 in Table 1, K = 1).
Note, however, that the AIC does not have ability to test a null hypothesis because it only measures relative qualities of candidate models to describe a given data set. Therefore, if all candidate models fit the data set poorly, the obtained AIC value does not provide any useful information. To prevent this situation, the widely used coefficient of determination (R2) was also used in the present work.

Page 8 of 18
Accep
ted
Man
uscr
ipt
3 Materials and Experimental Methods 3.1 MaterialsMethyl isobutyl carbinol (MIBC,98% purity) and diesel were purchased from Sigma Aldrich and Caltex, respectively. A coking coal sample with P80 = 220 μm and ash content of approximately 17% was obtained from a flotation feed stream in a coal preparation plant in Queensland, Australia. Brisbane tap water was used throughout the flotation experiment.
3.2 Experimental Procedure of Coal Flotation A 1.5-L bottom driven mechanical flotation cell (L = 110 mm, W = 112 mm, H = 148 mm) fed with a suspension of fine coal (1.2 L slurry, 5 wt. % solid) was used. Figure 2 shows a schematic drawing of the flotation cell. Since the rotor (impeller) was placed at the bottom of the cell, its interference with froth phase behaviour was considered minimal.
A
loverflow
Schematic drawing of flotation cell
C B
D
Side view
Top view without slurry
Top view with slurry
Figure 2: The Photo and schematic of the bottom-driven coal flotation cell, comprising cell (A), rotor (B), stator(C), and froth discharge lip (D)
A video camera (S3300, Nikon, Japan) and a laser distance meter (LDM-100, CEM, China) were placed above the cell lip to measure the horizontal velocity distribution and the height of the overflowing froth ( ) over the lip. Off-line image analysis (Tracker 4.80, OpenSourcePhysics, North Carolina, USA) was carried out to determine the speed of the froth movement at eight different positions across the froth surface.
The dosage of MIBC and diesel was 25 ppm and 50 ppm (on a slurry basis), respectively. The agitation speed was set as 800 rpm, and the air flow rate was 3L/min. After 1 min of

Page 9 of 18
Accep
ted
Man
uscr
ipt
conditioning time, the air was supplied. Immediately after the flotation froth started to overflow, the top froth layer was scraped once to remove the top froth layer heavily loaded with solid particles. In doing so, one can produce consistent experimental results with good repeatability. All the values shown in this paper were the average of three independent runs and the error bar represents the standard error.
3.3 Verification of Pseudo-Steady State The transportation model presented in Section 2 is based on the assumption that the frothflotation is at steady state. Ideally, the models are to be validated using the experimental results obtained either at laboratory scale in continuous mode or at industrial scale. In batch mode, the solid and frother concentrations in the pulp and froth phase will change overtime, which makes it difficult to evaluate the transportation models. Fortunately, however, a pseudo-steady state can be reached with using a laboratory scale flotation cell running in batch mode. Figure 3 shows the variation of the measured overall air recovery ( ) with time. In determining the air recovery, for simplicity, the gas holdup, , was assumed constant (= 0.9). The value has no influence on UH at x = 1 and negligible effect on UH at x < 1. Also plotted in Fig.3 are the measured overflowing froth height ( ) and length ( ) as a function of time. It was found that the air recovery, overflowing froth length and height would become stable within 10-30 s. At 40 s, the experimentally obtained air recovery had a large error bar, indicating rather poor reproducibility. The pseudo-steady state was, therefore, considered achievable within 10-30 s.
0
2
4
6
8
10
12
14
0
10
20
30
40
50
60
70
80
90
100
0 5 10 15 20 25 30 35 40
Air r
ecov
ery,α
(%)
time(sec)
l ove
rflo
wan
d h
f(c
m)
0
2
4
6
8
10
12
14
0
10
20
30
40
50
60
70
80
90
100
0 5 10 15 20 25 30 35 40
Air
reco
very
,α(%
)
time(sec)
air recovery
overflowing length
overflowing height
loverflow
Air recovery
hf
Figure 3. Typical froth parameters measured at different times.

Page 10 of 18
Accep
ted
Man
uscr
ipt
Figure 4 shows the time-dependent variation of the froth velocity distribution. Similar tooverall air recovery, the horizontal velocities obtained between 10-30 s had smaller error bars compared with those obtained at 40 s. Therefore, in the present work, the experimental data obtained within 10-30 s were used to assess the froth transportation model.
-0.4
-0.2
0
0.2
0.4
0.6
0.8
1
1.2
1.4
1.6
0 0.2 0.4 0.6 0.8 1
Hor
izon
tal V
eloc
ity(c
m/s
)
Normalised distance from the back of the cell,
0sec
10-30sec
40 sec
Figure 4.Typical surface velocity distributions measured at different times.
4 Results and Discussion4.1 Horizontal velocity of surface bubbles
-0.2
0
0.2
0.4
0.6
0.8
1
1.2
1.4
0 0.2 0.4 0.6 0.8 1
Hor
izon
tal V
eloc
ity(c
m/s
)
Normalised distance from the back of the cell,
Expression 1: = 0.920;
Expression 2: = 0.980; = 0.375
Expression 3: = 0.980; = 1.97
Expression 4: = 0.763;
Expression 5: = 0.972; = - 3.48 = - 1.00
Expression 6: = 0.971; s = 0.351
Experimental data
4
1
2 35
6

Page 11 of 18
Accep
ted
Man
uscr
ipt
Figure 5.Experimentally obtained horizontal velocity distribution . The lines represent Eq.[4] with different cumulative air recovery functions, listed in Table 1. The values of R2 and adjustable parameters are shown in the legend. Error bars represent standard error of mean values of three independent experiments.
Figure 5 shows the measured horizontal velocity, , of surface bubbles in coal flotation. At the back of the cell surface horizontal velocity was close to 0, indicating the presence of a stagnant zone. The horizontal froth velocity started to increase gradually from = 0.3 before increasing rapidly from = 0.7. Similar observation was made by Ross (1990) who measured the surface froth velocities in large-scale pyrite flotation cells with uneven air velocity distribution over the pulp-froth interface.
Also plotted in Fig.5 are the fitted lines representing Eq.[4] with L = 11.0 cm, Jg =0.71 cm/s, α= 0.388, hf =3.4 cm and different cumulative air recovery functions (see Table 1). As shown, Expressions 2 and 3 had a higher R2 (= 0.980) than others. Moreover, Expression 3 led to the highest value of the Akaike weight (see Table 2), suggesting that Expression 3 should be the most probable for describing the cumulative air recovery function than other expressions tested in the present work. Compared with Expressions 2 and 3, the lower Akaike weightgiven by Expression 5 could be due to the higher complexity of Expression 5 (S-shaped).
Table 2: Calculated AICc value and Akaike weights for model evaluation against horizontal velocity.Expression AICc ΔAICc * Akaike weights, Wi **
1*** -208.3 9.7 02 -217.7 0.3 0.333 -218.0 0.0 0.404*** -184.5 33.5 05 -215.6 2.4 0.126 -216.1 1.9 0.15* ΔAICc is the difference between maximum AICc value at given data set and individual AICc value. **Probability that an expression is the best in a given set of data candidate models***Assumption about constant variance of residual was not met in case of Expression 1 and 4 as the residual error showed a distinctive trend.

Page 12 of 18
Accep
ted
Man
uscr
ipt
4.2 Cumulative air recovery function and specific air recovery function
0
0.05
0.1
0.15
0.2
0.25
0.3
0.35
0.4
0.45
0 0.2 0.4 0.6 0.8 1
Normalised distance from the back of the cell,
Air recovery dataExpression 1
Expression 2Expression 3Expression 4Expression 5Expression 6
1
2 3
4
56
()
Figure 6. Cumulative air recovery functions, , with parameters being determined by fitting the experimental data to Eq.[4]. The measured air recovery, , was 0.388.
Figure 6 shows the cumulative air recovery functions with best fit to the experimental shown in Fig.5. The different shapes and slopes of these cumulative air recovery
functions imply different bubble bursting rate at a given position. As noted before, the specific air recovery function, which is shown in Table 1, represents the probability of bubbles entering at positions that is recovered as unburst bubble at discharging lip.
Figure 7 shows experimentally determined specific air recovery profile of coal-laden bubbles whose motion and fate were tracked by video recording and off-line image analysis to seewhether a given bubble remained intact until it overflowed. The measurement started immediately after scraping the top froth layer once as the bubble had a little (or no) horizontal movement at the starting time. When measuring , it was assumed that the bubbles within the mixed transportation zone would move vertically without horizontal motion. The results show that the specific air recovery was zero at the farthest region from the froth discharge lip and the probability of bubble discharge at the lip started increasing rapidly as the bubble was closer to the lip. This trend implies that a bubble entering the region near the lip would have a higher chance to survive as it had a shorter residence time in the froth phase owing to higher horizontal speed and shorter distance to travel at the froth surface.
Also plotted in Fig.7 are lines representing with the same parameters and values as shown in Fig.5. The AIC (shown in Table 4) and R2 values were used to examine the fitting of the specific air recovery functions to the experimentally obtained specific air recovery profile. Among all the expressions for , Expression 3 gave the highest R2 and Akaike weight, so Expression 3 was considered the most suitable for describing the measured

Page 13 of 18
Accep
ted
Man
uscr
ipt
specific air recovery profile. Expression 2 also had a linear incremental of specific airrecovery versus position, matching the experimentally observed increasing trend. Expression 5 showed ‘S-shaped’ increasing trend. Despite equal R2 values of the fitting by these three different expressions, the Akaike weights of Expressions 2 and 5 were lower than that of Expression 3. Expressions 1, 4, and 6 cannot be fitted satisfactorily to the measured specific air recovery, suggesting that neither linear nor sinusoidal incremental of the cumulative air recovery function was applicable here.
Regardless of the bubble entering position, the appropriate specific air recovery function should have an increasing trend and its magnitude must fall between 0 to 1. As a result, the constraints for the fitting parameters shown in Table 1 can be explained as follows. The value of fitting parameter, , of the Expression 2 should be greater than 0 so as to allow the specific air recovery function to have an increasing trend. Moreover, it must be smaller than
; otherwise, at the back of the cell ( = 0), the magnitude of the specific air recovery could become negative. In Expression 3, should be larger than 1 to allow the specific air recovery to have a positive gradient and less than to prevent the specific air recovery from becoming larger than 1 at the froth discharge lip ( =1). As for Expression 5, the value of the fitting parameter (which governs the location of the inflection point of the S-shape curve)must be smaller than -1, otherwise the magnitude of the specific air recovery would decrease when passing the inflection point, in contradiction with the experimental observation.
Table 3: Calculated AICc value and Akaike weights for model evaluation against bubble discharge probability.Expression AICc Akaike weights, Wi R2
1* -53.6 0.00 02 -80.3 0.41 0.793 -80.4 0.43 0.794* -30.2 0.00 05 -78.4 0.16 0.796 -64.5 0.00 0.48*Assumption about normal distribution of residuals was not met.

Page 14 of 18
Accep
ted
Man
uscr
ipt
0
0.1
0.2
0.3
0.4
0.5
0.6
0.7
0.8
0.9
1
0 0.2 0.4 0.6 0.8 1
Normalised distance from the back of the cell,
()Specific gas recoveryExpression 1 Expression 2Expression 3Expression 4Expression 5Expression 6
4
1
2 35
6
Figure 7. Specific air recovery versus position. The lines represent the predictions with parameter values being the same as in Fig.5. The symbols represent the experimental data.
Specific air recovery in other systems was studied by Rojas et al.(2014) and Cutting (1986). Rojas et al. investigated the probability of bubble transportation by tracking the bubbles in two-phase foam system (in the absence of solid particles). It was found that a rapid increase in the probability of bubble discharge without bursting occurred at positions far from the lip when the superficial gas velocity was increased or the depth of froth was decreased. Cutting obtained the probability of discharge profile at different stages of pyrite flotation and observed that the rougher, second cleaner, and final cleaner cells had different discharge probability profiles. It appears, therefore, that the probability of discharge is not only a function of intrinsic properties of flotation such as mineral types, chemical dosage, and solid percentage of froth, but also operating conditions such as the superficial gas velocity and the froth depth.
4.3 Implications for Flotation Cell Design and OperationsThe results presented until now suggest that Expression 3 (power law) is the best cumulative air recovery function for describing the froth behaviour in coal flotation. Using Expression 3, one can then estimate the residence time of a bubble entering the froth phase at position x:
τ(x) = τV(x) + τH(x) [6]
where
τV(x) ≡ Hf·λ/Jg [7]
Page 15 of 18
Accep
ted
Man
uscr
ipt
represents the residence time of the bubble rising up from the pulp-froth interface to the level of the froth discharge lip, and
τH(x) = [8]
represents the time for the bubble to be transported from position x to the froth discharge lip (x = 1). Substituting in Eq. [8] with Expression 3, one can obtain:
τ(x) = [9]
According to Qu et al. (2013), in coal flotation, increasing Jg would increase α. Equation [9] suggests, therefore, that an increase in Jg would be associated with a decrease in the bubble residence time in the froth phase. Increasing or would increase the bubble residence time. Note that Eq.[9] does not explicitly comprise the parameter L, suggesting that equipment designed with longer or lower froth transport distances while keeping other design and operative parameters the same should have similar bubble residence time distribution in the froth phase.
1
10
100
1000
10000
0 0.2 0.4 0.6 0.8 1
Resi
denc
e tim
e (s
)
Normalised distance from the back of the cell,
a = 1.0
a = 1.5
a = 2.0
a = 2.5
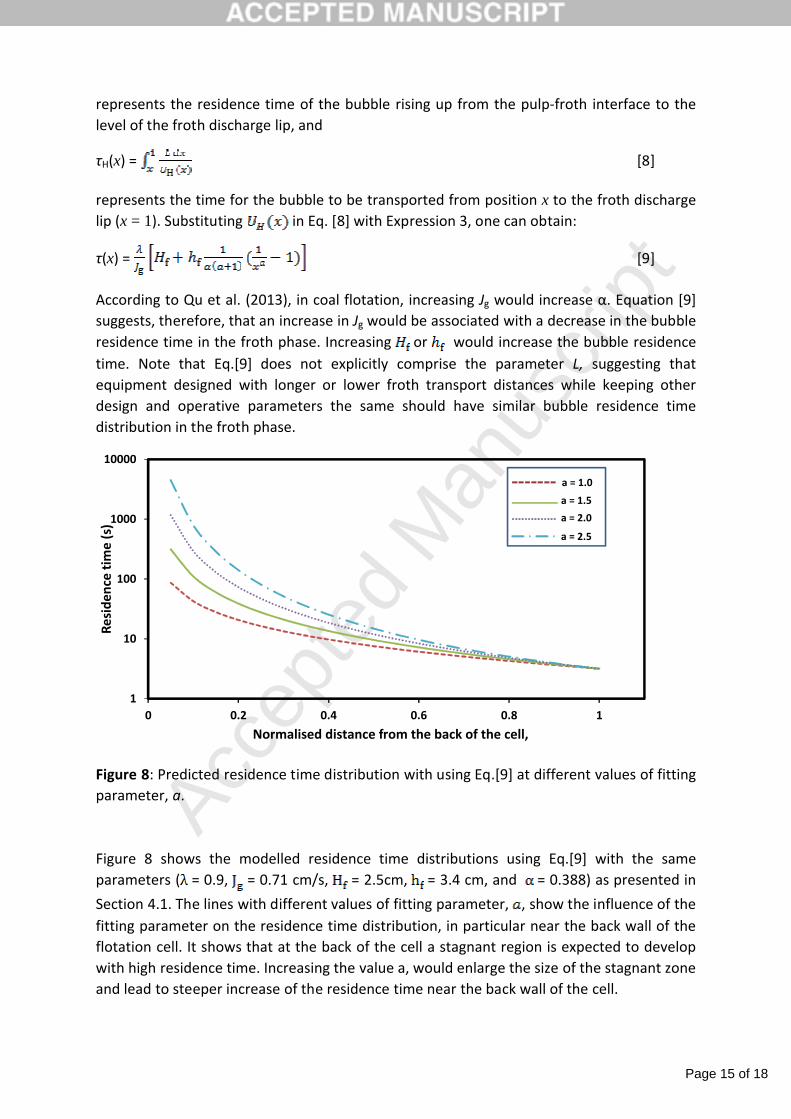
Figure 8: Predicted residence time distribution with using Eq.[9] at different values of fitting parameter, a.
Figure 8 shows the modelled residence time distributions using Eq.[9] with the sameparameters ( = 0.9, = 0.71 cm/s, = 2.5cm, = 3.4 cm, and = 0.388) as presented in Section 4.1. The lines with different values of fitting parameter, , show the influence of the fitting parameter on the residence time distribution, in particular near the back wall of the flotation cell. It shows that at the back of the cell a stagnant region is expected to develop with high residence time. Increasing the value a, would enlarge the size of the stagnant zone and lead to steeper increase of the residence time near the back wall of the cell.
Page 16 of 18
Accep
ted
Man
uscr
ipt
It has been reported that the stagnant zone tends to develop at the back of the cell in case of rectangular flotation cell with single discharge and at the centre of the cell in case of cylindrical flotation cell. The stagnant zone is considered a waste of the cell volume since it does not contribute to the particle separation. Hence, estimating the size of the stagnant zone is crucial to enhance the design of the coal flotation cells and improve their efficiency.
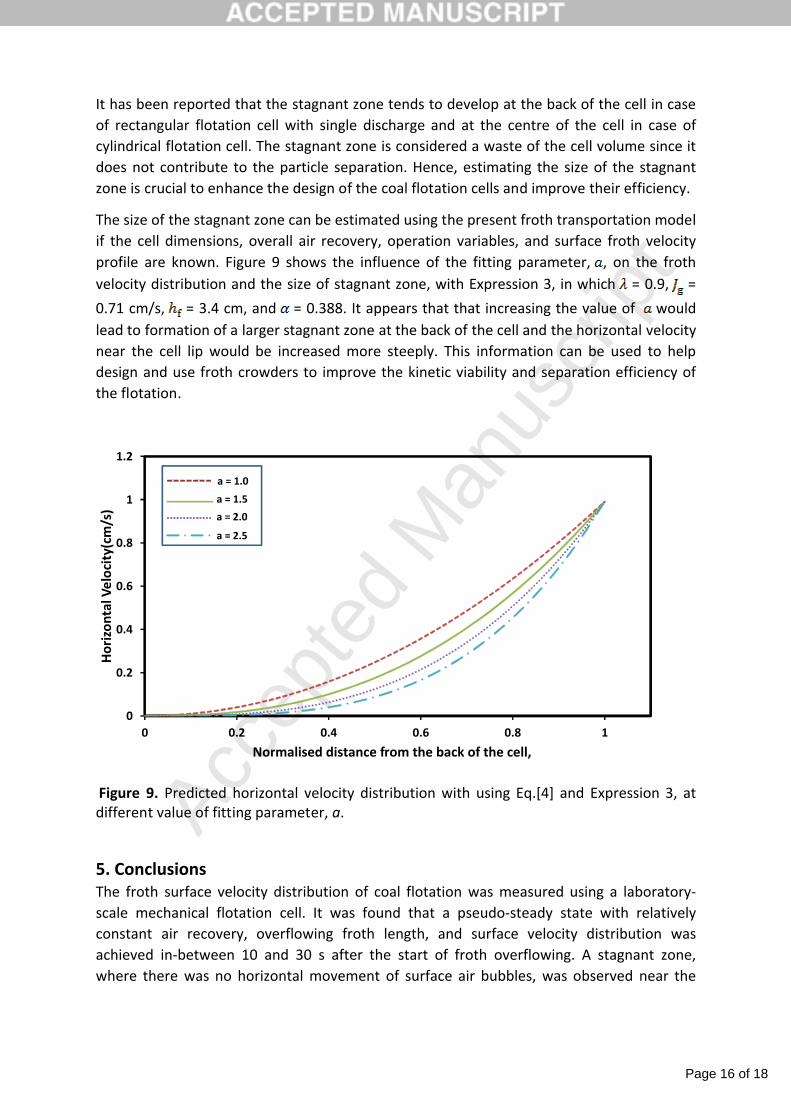
The size of the stagnant zone can be estimated using the present froth transportation model if the cell dimensions, overall air recovery, operation variables, and surface froth velocityprofile are known. Figure 9 shows the influence of the fitting parameter, , on the frothvelocity distribution and the size of stagnant zone, with Expression 3, in which = 0.9, = 0.71 cm/s, = 3.4 cm, and = 0.388. It appears that that increasing the value of would lead to formation of a larger stagnant zone at the back of the cell and the horizontal velocity near the cell lip would be increased more steeply. This information can be used to help design and use froth crowders to improve the kinetic viability and separation efficiency of the flotation.
0
0.2
0.4
0.6
0.8
1
1.2
0 0.2 0.4 0.6 0.8 1
Hor
izon
tal V
eloc
ity(c
m/s
)
Normalised distance from the back of the cell,
a = 1.0
a = 1.5
a = 2.0
a = 2.5
Figure 9. Predicted horizontal velocity distribution with using Eq.[4] and Expression 3, at different value of fitting parameter, a.
5. Conclusions The froth surface velocity distribution of coal flotation was measured using a laboratory-scale mechanical flotation cell. It was found that a pseudo-steady state with relatively constant air recovery, overflowing froth length, and surface velocity distribution was achieved in-between 10 and 30 s after the start of froth overflowing. A stagnant zone, where there was no horizontal movement of surface air bubbles, was observed near the

Page 17 of 18
Accep
ted
Man
uscr
ipt
back wall of the flotation cell, farthest from the froth discharge lip, and the bubble velocity increased with decreasing the distance to the lip.
A froth phase transportation model comprising different types of cumulative air recovery functions with best fit to the measured surface velocity distribution in coal flotation was evaluated using the Akaike information criteria and the coefficients of determination, R2. It was found that the cumulative air recovery function expressed in power-law form was the best to describe the motion of the coal-laden froth.
The specific air recovery functions obtained by differentiating the cumulative air recoveryfunctions were fitted to the measured probability of a bubble entering at position that is recovered unburst at the froth discharge lip. It was also found that the cumulative air recovery function expressed in power-law form was the best to describe the probability of bubble discharge without bursting in coal flotation. The probability increased as the distance to the froth discharge lip decreased.
6. AcknowledgementsThe authors gratefully acknowledge the financial support from The Australian Coal Association Research Program. The authors express sincere gratitude to Dr. Tony Howes for suggesting the AIC method for model evaluation. HP gratefully acknowledges The University of Queensland International Scholarship.
ReferencesBrito-Parada P. R. and Cilliers J. J., Experimental and numerical studies of launder configurations in a two-phase flotation system, Miner. Eng., 36: 119 (2012)
Burnham, K. P. and Anderson, D. R., Model Selection and Multimodel Inference: A Practical Information-Theoretic Approach, Springer, 2002, pp. 60-80
Cole K. E., Brito-Parada P. R., Xu C., Neethling S. J. and Cilliers J. J., Experimental studies and numerical model validation of overflowing 2D foam to test flotation cell crowder designs, Chem. Eng. Res. Des., 90(12): 2196 (2012)
Contreras F., Yianatos J. and Vinnett L., On the froth transport modelling in industrial flotation cells, Miner. Eng., 41: 17 (2013)
Cutting G.W., Barber S.P., Newton S., Effects of froth structure and mobility on the performance and simulation of continuously operated flotation cells, Int. J. Miner. Process., 16(1-2): 43 (1986)
Hadler K., Greyling M., Plint N. and Cilliers, J. J., The effect of froth depth on air recovery and flotation performance, Miner. Eng., 36: 248 (2012)
Hunter T. N., Pugh, R. J., Franks G. V., and Jameson, G. J., The role of particles in stabilising foams and emulsions, Adv. Colloid. Interfac., 137(2): 57 (2008)
Johansson G. and Pugh R. J., The influence of particle size and hydrophobicity on the stability of mineralized froths, Int. J. Miner. Process., 34(1): 1 (1992)
Page 18 of 18
Accep
ted
Man
uscr
ipt
Leiva J., Caracterización de la Superficie de Espumas de Flotación Industrial, Master Thesis, Santa María University, Chile (2011)
Moolman D. W, Aldrich C., Van Deventer J. S. J., and Bradshaw, D. J., The interpretation of flotation froth surfaces by using digital image analysis and neural networks, Chem. Eng. Sci., 50(22): 3501 (1995).
Moys M. H., A study of processes occurring in flotation froths, PhD Thesis, University of KwaZulu-Natal, South Africa (1979)
Moys M.H., Residence time distributions and mass transport in the froth phase of the flotation process. Int. J. Miner. Process., 13: 117-142 (1984).
Murphy D. G., Zimmerman W. and Woodburn E. T., Kinematic model of bubble motion in a flotation froth, Powder Technol., 87(1): 3 (1996)
Neethling S. J. and Cilliers J. J., Modelling flotation froths, Int. J. Miner. Process., 72(1): 267 (2003)
Qu, X., Wang, L. and Nguyen, A.V., Correlation of air recovery with froth stability and separation efficiency in coal flotation, Miner. Eng., 41: 25 (2013)
Rojas I., Vinnett L., Yianatos J. and Iriarte, V., Froth transport characterization in a two-dimensional flotation cell, Miner. Eng., 66-68:40(2014)
Ross V.E., A study of the froth phase in large-scale pyrite flotation cells, Int. J. Miner. Process., 30(1-2): 143(1990)
Smith C. D., Hadler K. and Cilliers J. J. Flotation bank air addition and distribution for optimal performance, Miner. Eng., 23(11): 1023 (2010)
Smith C. D., Hadler K. and Cilliers J. J., The total air addition and air profile for a flotation bank, Can. Metall. Quart., 49(4): 331 (2010)
Woodburn E. T., Austin L. G. and Stockton J. B., A froth based flotation kinetic model, Chem. Eng. Res. Des., 72(2): 211 (1994)
Zheng X., Franzidis J. P. and Manlapig E., (2004). Modelling of froth transportation in industrial flotation cells: Part I. Development of froth transportation models for attached particles, Miner. Eng., 17(9): 981 (2004)
Zheng X. and Knopjes L., Modelling of froth transportation in industrial flotation cells: Part II. Modelling of froth transportation in an Outokumpu tank flotation cell at the Anglo Platinum Bafokeng–Rasimone Platinum Mine (BRPM) concentrator, Miner. Eng., 17(9): 989 (2004)