experimental shear testing of unreinforced masonry … yang qiu.pdf · experimental shear testing...
TRANSCRIPT
Experimental shear testing of unreinforced masonry
wall panels
2016 NZSEE Conference
H. Qiu, R. Chin, J. Ingham, and D. Dizhur
The University of Auckland, Auckland, New Zealand
ABSTRACT: An experimental program was undertaken with the principal aim of
determining the transition point between the stair-step failure mode and diagonal tension
failure mode of eight 1200 mm x 1200 mm URM wall panels when subjected to
simulated earthquake lateral loads. Preparations included the formulation of mortar
compositions and then subsequent pairing with bricks of varying strengths to replicate the
range of material characteristics of existing URM structures found throughout New
Zealand. Diagonal shear tests were conducted with experimental results indicating two
distinct failure mechanisms. It was concluded that the transition between failure modes
occurs when the mortar to brick compressive strength ratio is approximately 0.4. In
addition, following the failure of the wall panels, three panels were repaired using 8 mm
steel wire rope placed in differing orientations and quantities in order to investigate the
feasibility and performance of this repair technique. Steel wire rope proved to be a simple
and cost effective remediation method with improvements in diagonal shear strength and
displacement capacity of up to double and fifty times respectively that of the as-built
counterparts.
1 INTRODUCTION
According to Magenes and Calvi (1997) the in-plane failure modes of unreinforced masonry (URM)
piers can be categorised as either: rocking, diagonal shear, or bed joint sliding. Rocking and bed joint
sliding types of failure modes typically allow for the dispersion of energy in cycles through
displacement. Comparatively, diagonal shear failures are typically more critical and may be relatively
more brittle in nature. Diagonal shear failure may develop as one of two failure mechanisms (see
Figure 1), as cracks may either develop through both brick units and mortar joints or through the
mortar joints alone in a stepping pattern depending on the ratio between mortar and brick strengths
(Dizhur & Ingham, 2013).
Failure through both brick units and mortar joints is recognised as being relatively brittle in nature, as
the shear strength capacity of the wall deteriorates heavily after the maximum shear stress has been
achieved. In the NZSEE (2015) assessment guidelines, URM pier diagonal tension failure modes that
are dominated by brick splitting correspond to a force reduction factor, KR of 1.0. In contrast, stair-
stepped failure though the mortar bed and head joints creates multiple sliding planes analogous to the
bed joint shear sliding failure mode, where additional energy from seismic forces can be subsequently
dispersed through sliding. In the NZSEE (2015) assessment guidelines, the stair-step failure mode in
URM piers corresponds to a force reduction factor, KR of 3.0. When calculating the URM spandrel
capacity in Section 10.8.6.3 (NZSEE, 2015), it is also important to be able to distinguish between
stair-step failure modes and diagonal tension failure modes that are dominated by brick splitting, see
Figure 1. Consequently, determining the transition point between the two mechanisms of diagonal
shear failure is paramount for understanding the behaviour of URM piers and spandrels subjected to
in-plane loading.
Currently limited guidance is provided in the NZSEE (2015) document on distinguishing the
occurrence of the two failure mechanisms. This information would allow engineers to more accurately
assess the seismic vulnerability and shear capacity URM buildings. The experimental program
reported herein was undertaken to address and attempt to provide such valuable information for
inclusion in a future revision of the NZSEE (2015) document.
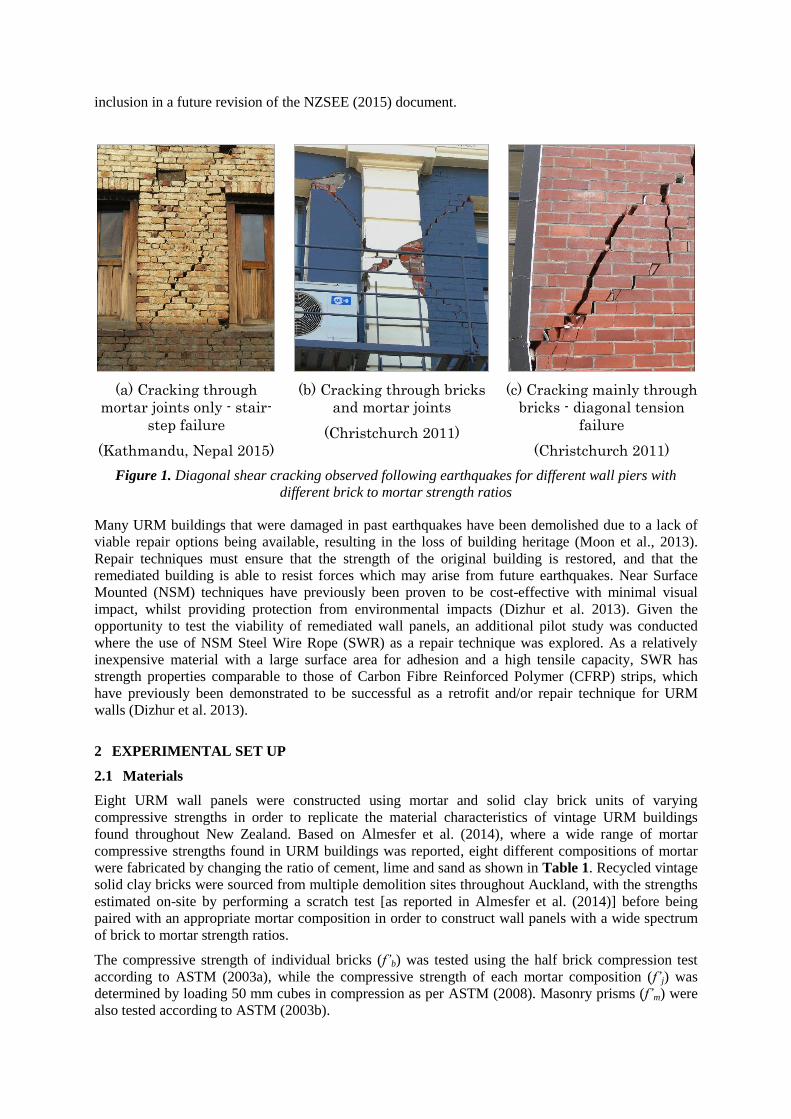
(a) Cracking through
mortar joints only - stair-
step failure
(Kathmandu, Nepal 2015)
(b) Cracking through bricks
and mortar joints
(Christchurch 2011)
(c) Cracking mainly through
bricks - diagonal tension
failure
(Christchurch 2011)
Figure 1. Diagonal shear cracking observed following earthquakes for different wall piers with
different brick to mortar strength ratios
Many URM buildings that were damaged in past earthquakes have been demolished due to a lack of
viable repair options being available, resulting in the loss of building heritage (Moon et al., 2013).
Repair techniques must ensure that the strength of the original building is restored, and that the
remediated building is able to resist forces which may arise from future earthquakes. Near Surface
Mounted (NSM) techniques have previously been proven to be cost-effective with minimal visual
impact, whilst providing protection from environmental impacts (Dizhur et al. 2013). Given the
opportunity to test the viability of remediated wall panels, an additional pilot study was conducted
where the use of NSM Steel Wire Rope (SWR) as a repair technique was explored. As a relatively
inexpensive material with a large surface area for adhesion and a high tensile capacity, SWR has
strength properties comparable to those of Carbon Fibre Reinforced Polymer (CFRP) strips, which
have previously been demonstrated to be successful as a retrofit and/or repair technique for URM
walls (Dizhur et al. 2013).
2 EXPERIMENTAL SET UP
2.1 Materials
Eight URM wall panels were constructed using mortar and solid clay brick units of varying
compressive strengths in order to replicate the material characteristics of vintage URM buildings
found throughout New Zealand. Based on Almesfer et al. (2014), where a wide range of mortar
compressive strengths found in URM buildings was reported, eight different compositions of mortar
were fabricated by changing the ratio of cement, lime and sand as shown in Table 1. Recycled vintage
solid clay bricks were sourced from multiple demolition sites throughout Auckland, with the strengths
estimated on-site by performing a scratch test [as reported in Almesfer et al. (2014)] before being
paired with an appropriate mortar composition in order to construct wall panels with a wide spectrum
of brick to mortar strength ratios.
The compressive strength of individual bricks (f’b) was tested using the half brick compression test
according to ASTM (2003a), while the compressive strength of each mortar composition (f’j) was
determined by loading 50 mm cubes in compression as per ASTM (2008). Masonry prisms (f’m) were
also tested according to ASTM (2003b).
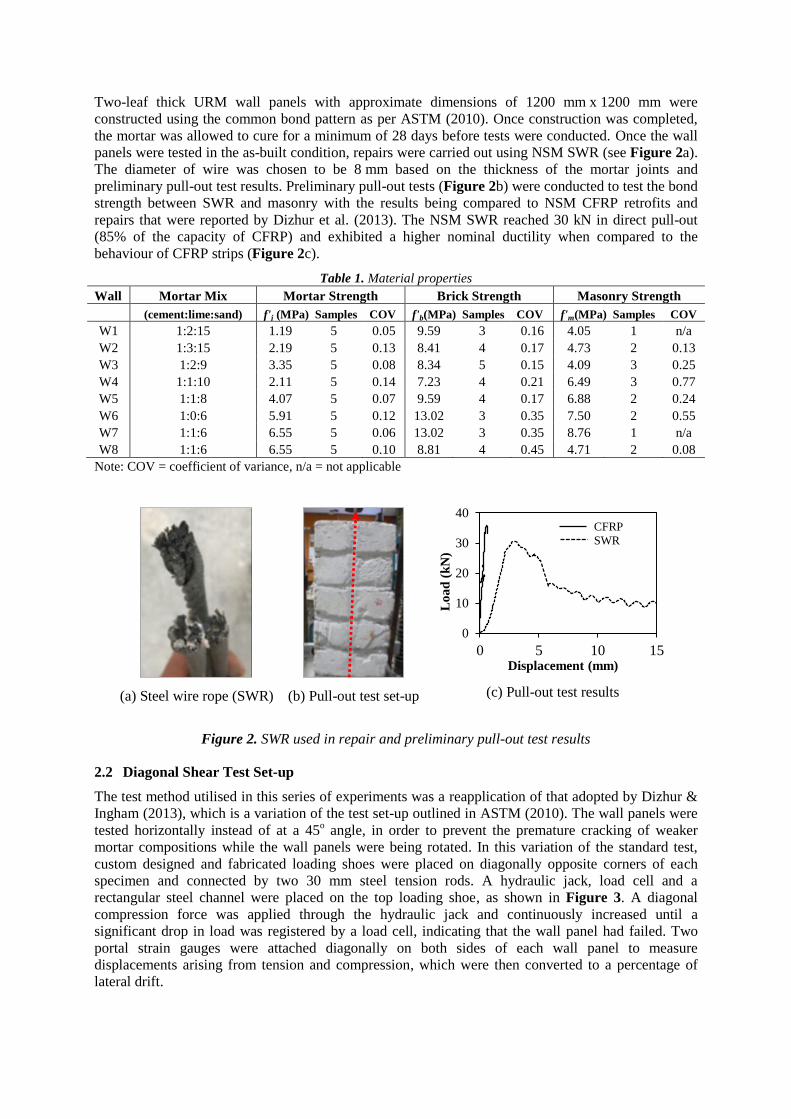
Two-leaf thick URM wall panels with approximate dimensions of 1200 mm x 1200 mm were
constructed using the common bond pattern as per ASTM (2010). Once construction was completed,
the mortar was allowed to cure for a minimum of 28 days before tests were conducted. Once the wall
panels were tested in the as-built condition, repairs were carried out using NSM SWR (see Figure 2a).
The diameter of wire was chosen to be 8 mm based on the thickness of the mortar joints and
preliminary pull-out test results. Preliminary pull-out tests (Figure 2b) were conducted to test the bond
strength between SWR and masonry with the results being compared to NSM CFRP retrofits and
repairs that were reported by Dizhur et al. (2013). The NSM SWR reached 30 kN in direct pull-out
(85% of the capacity of CFRP) and exhibited a higher nominal ductility when compared to the
behaviour of CFRP strips (Figure 2c).
Table 1. Material properties
Wall Mortar Mix Mortar Strength Brick Strength Masonry Strength
(cement:lime:sand) f'j (MPa) Samples COV f'b(MPa) Samples COV f'm(MPa) Samples COV
W1 1:2:15 1.19 5 0.05 9.59 3 0.16 4.05 1 n/a
W2 1:3:15 2.19 5 0.13 8.41 4 0.17 4.73 2 0.13
W3 1:2:9 3.35 5 0.08 8.34 5 0.15 4.09 3 0.25
W4 1:1:10 2.11 5 0.14 7.23 4 0.21 6.49 3 0.77
W5 1:1:8 4.07 5 0.07 9.59 4 0.17 6.88 2 0.24
W6 1:0:6 5.91 5 0.12 13.02 3 0.35 7.50 2 0.55
W7 1:1:6 6.55 5 0.06 13.02 3 0.35 8.76 1 n/a
W8 1:1:6 6.55 5 0.10 8.81 4 0.45 4.71 2 0.08
Note: COV = coefficient of variance, n/a = not applicable
(a) Steel wire rope (SWR)
(b) Pull-out test set-up
(c) Pull-out test results
Figure 2. SWR used in repair and preliminary pull-out test results
2.2 Diagonal Shear Test Set-up
The test method utilised in this series of experiments was a reapplication of that adopted by Dizhur &
Ingham (2013), which is a variation of the test set-up outlined in ASTM (2010). The wall panels were
tested horizontally instead of at a 45o angle, in order to prevent the premature cracking of weaker
mortar compositions while the wall panels were being rotated. In this variation of the standard test,
custom designed and fabricated loading shoes were placed on diagonally opposite corners of each
specimen and connected by two 30 mm steel tension rods. A hydraulic jack, load cell and a
rectangular steel channel were placed on the top loading shoe, as shown in Figure 3. A diagonal
compression force was applied through the hydraulic jack and continuously increased until a
significant drop in load was registered by a load cell, indicating that the wall panel had failed. Two
portal strain gauges were attached diagonally on both sides of each wall panel to measure
displacements arising from tension and compression, which were then converted to a percentage of
lateral drift.
0
10
20
30
40
0 5 10 15
Lo
ad
(k
N)
Displacement (mm)
CFRP
SWR
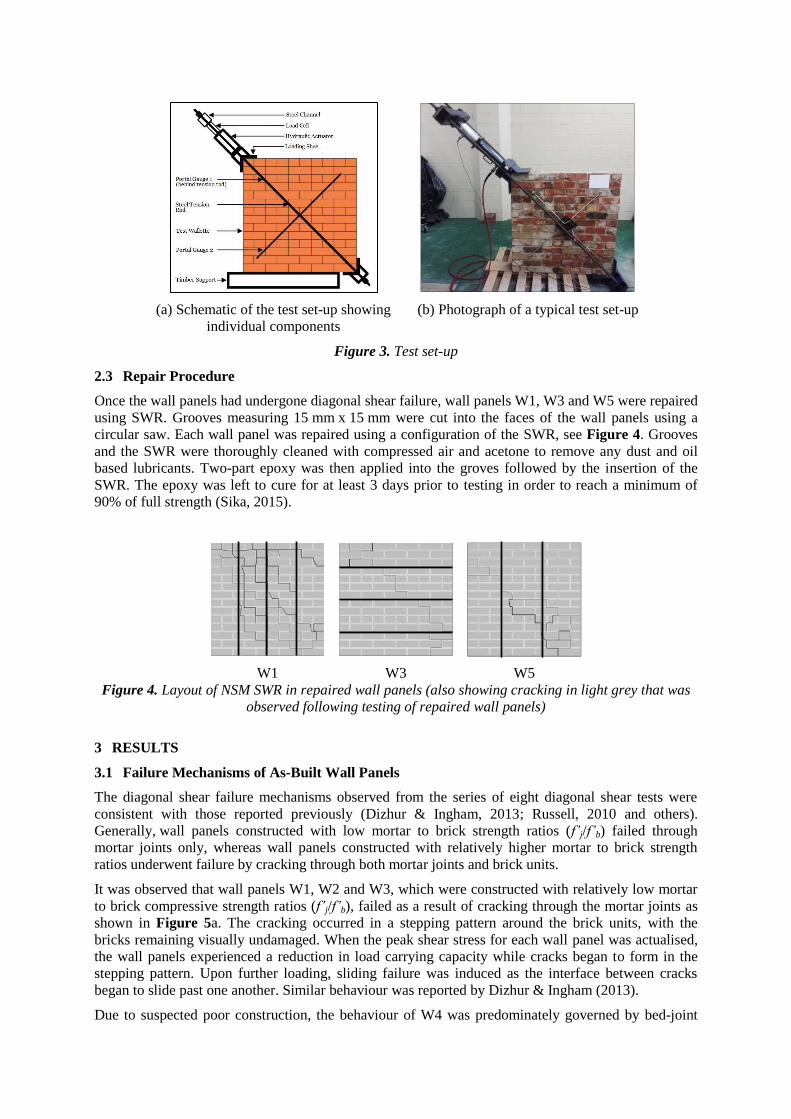
(a) Schematic of the test set-up showing
individual components
(b) Photograph of a typical test set-up
Figure 3. Test set-up
2.3 Repair Procedure
Once the wall panels had undergone diagonal shear failure, wall panels W1, W3 and W5 were repaired
using SWR. Grooves measuring 15 mm x 15 mm were cut into the faces of the wall panels using a
circular saw. Each wall panel was repaired using a configuration of the SWR, see Figure 4. Grooves
and the SWR were thoroughly cleaned with compressed air and acetone to remove any dust and oil
based lubricants. Two-part epoxy was then applied into the groves followed by the insertion of the
SWR. The epoxy was left to cure for at least 3 days prior to testing in order to reach a minimum of
90% of full strength (Sika, 2015).
W1
W3
W5
Figure 4. Layout of NSM SWR in repaired wall panels (also showing cracking in light grey that was
observed following testing of repaired wall panels)
3 RESULTS
3.1 Failure Mechanisms of As-Built Wall Panels
The diagonal shear failure mechanisms observed from the series of eight diagonal shear tests were
consistent with those reported previously (Dizhur & Ingham, 2013; Russell, 2010 and others).
Generally, wall panels constructed with low mortar to brick strength ratios (f’j/f’b) failed through
mortar joints only, whereas wall panels constructed with relatively higher mortar to brick strength
ratios underwent failure by cracking through both mortar joints and brick units.
It was observed that wall panels W1, W2 and W3, which were constructed with relatively low mortar
to brick compressive strength ratios (f’j/f’b), failed as a result of cracking through the mortar joints as
shown in Figure 5a. The cracking occurred in a stepping pattern around the brick units, with the
bricks remaining visually undamaged. When the peak shear stress for each wall panel was actualised,
the wall panels experienced a reduction in load carrying capacity while cracks began to form in the
stepping pattern. Upon further loading, sliding failure was induced as the interface between cracks
began to slide past one another. Similar behaviour was reported by Dizhur & Ingham (2013).
Due to suspected poor construction, the behaviour of W4 was predominately governed by bed-joint
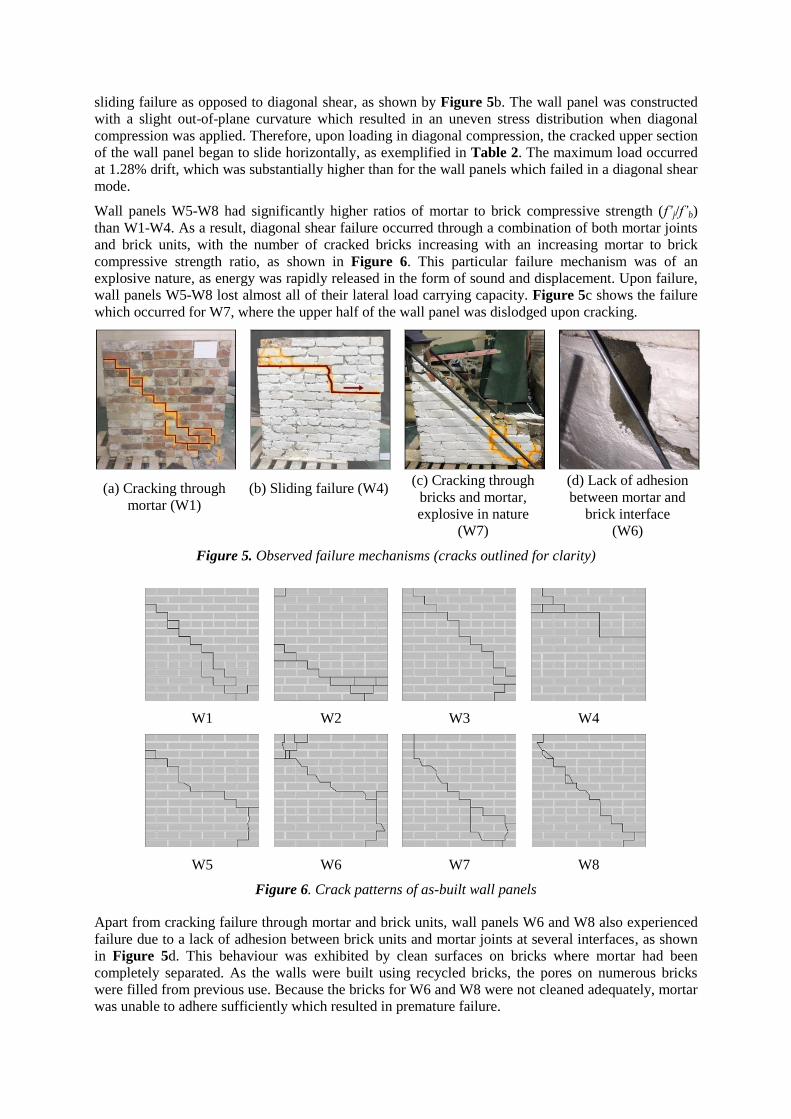
sliding failure as opposed to diagonal shear, as shown by Figure 5b. The wall panel was constructed
with a slight out-of-plane curvature which resulted in an uneven stress distribution when diagonal
compression was applied. Therefore, upon loading in diagonal compression, the cracked upper section
of the wall panel began to slide horizontally, as exemplified in Table 2. The maximum load occurred
at 1.28% drift, which was substantially higher than for the wall panels which failed in a diagonal shear
mode.
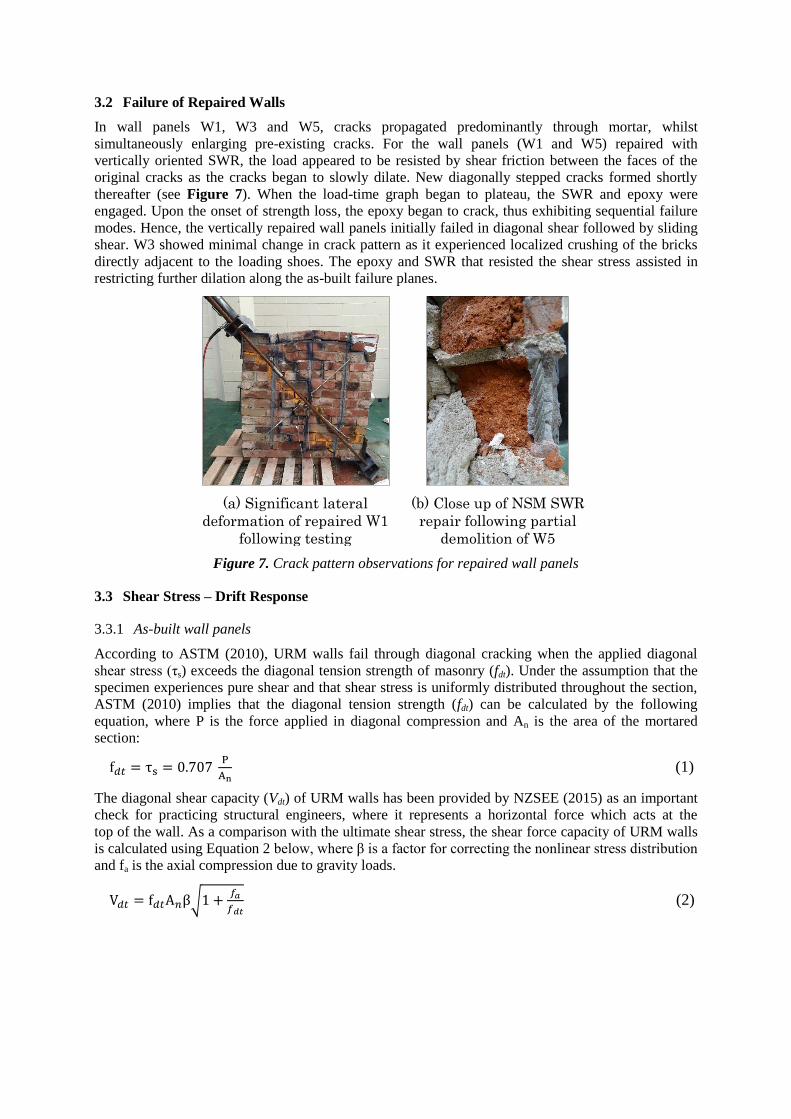
Wall panels W5-W8 had significantly higher ratios of mortar to brick compressive strength (f’j/f’b)
than W1-W4. As a result, diagonal shear failure occurred through a combination of both mortar joints
and brick units, with the number of cracked bricks increasing with an increasing mortar to brick
compressive strength ratio, as shown in Figure 6. This particular failure mechanism was of an
explosive nature, as energy was rapidly released in the form of sound and displacement. Upon failure,
wall panels W5-W8 lost almost all of their lateral load carrying capacity. Figure 5c shows the failure
which occurred for W7, where the upper half of the wall panel was dislodged upon cracking.
(a) Cracking through
mortar (W1)
(b) Sliding failure (W4)
(c) Cracking through
bricks and mortar,
explosive in nature
(W7)
(d) Lack of adhesion
between mortar and
brick interface
(W6)
Figure 5. Observed failure mechanisms (cracks outlined for clarity)
W1
W2
W3
W4
W5
W6
W7
W8
Figure 6. Crack patterns of as-built wall panels
Apart from cracking failure through mortar and brick units, wall panels W6 and W8 also experienced
failure due to a lack of adhesion between brick units and mortar joints at several interfaces, as shown
in Figure 5d. This behaviour was exhibited by clean surfaces on bricks where mortar had been
completely separated. As the walls were built using recycled bricks, the pores on numerous bricks
were filled from previous use. Because the bricks for W6 and W8 were not cleaned adequately, mortar
was unable to adhere sufficiently which resulted in premature failure.
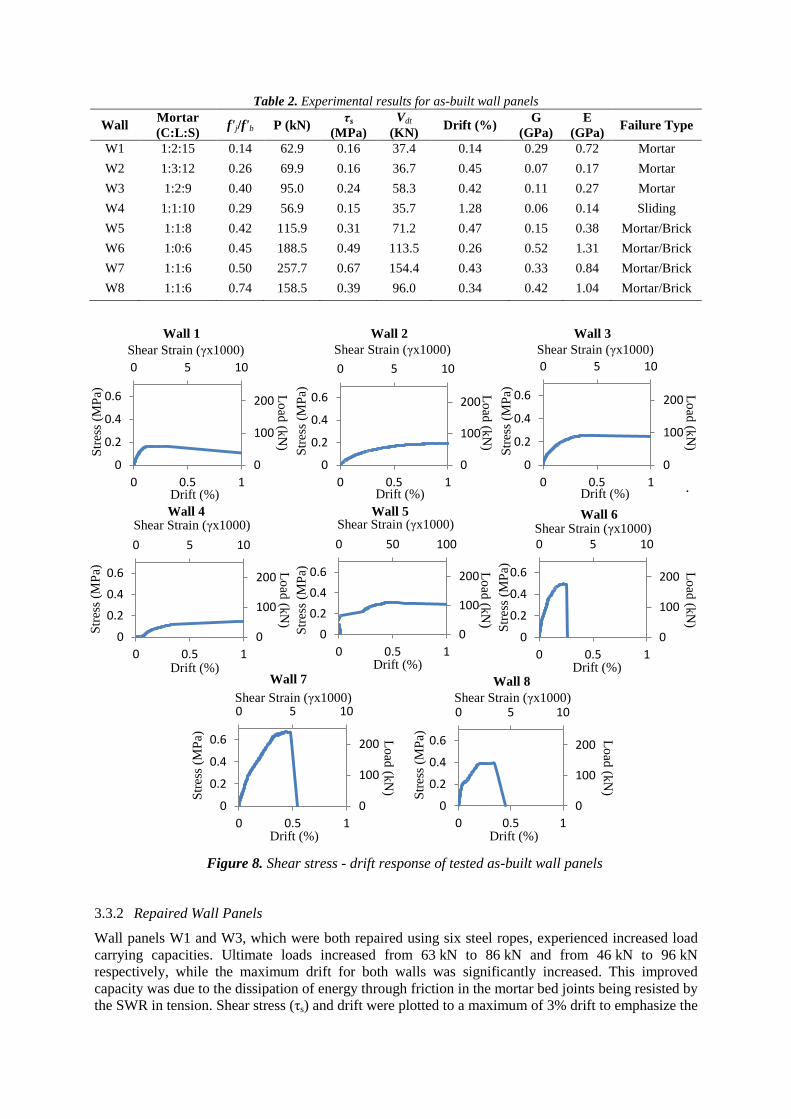
3.2 Failure of Repaired Walls
In wall panels W1, W3 and W5, cracks propagated predominantly through mortar, whilst
simultaneously enlarging pre-existing cracks. For the wall panels (W1 and W5) repaired with
vertically oriented SWR, the load appeared to be resisted by shear friction between the faces of the
original cracks as the cracks began to slowly dilate. New diagonally stepped cracks formed shortly
thereafter (see Figure 7). When the load-time graph began to plateau, the SWR and epoxy were
engaged. Upon the onset of strength loss, the epoxy began to crack, thus exhibiting sequential failure
modes. Hence, the vertically repaired wall panels initially failed in diagonal shear followed by sliding
shear. W3 showed minimal change in crack pattern as it experienced localized crushing of the bricks
directly adjacent to the loading shoes. The epoxy and SWR that resisted the shear stress assisted in
restricting further dilation along the as-built failure planes.
(a) Significant lateral
deformation of repaired W1
following testing
(b) Close up of NSM SWR
repair following partial
demolition of W5
Figure 7. Crack pattern observations for repaired wall panels
3.3 Shear Stress – Drift Response
3.3.1 As-built wall panels
According to ASTM (2010), URM walls fail through diagonal cracking when the applied diagonal
shear stress (τs) exceeds the diagonal tension strength of masonry (fdt). Under the assumption that the
specimen experiences pure shear and that shear stress is uniformly distributed throughout the section,
ASTM (2010) implies that the diagonal tension strength (fdt) can be calculated by the following
equation, where P is the force applied in diagonal compression and An is the area of the mortared
section:
(1)
The diagonal shear capacity (Vdt) of URM walls has been provided by NZSEE (2015) as an important
check for practicing structural engineers, where it represents a horizontal force which acts at the
top of the wall. As a comparison with the ultimate shear stress, the shear force capacity of URM walls
is calculated using Equation 2 below, where β is a factor for correcting the nonlinear stress distribution
and fa is the axial compression due to gravity loads.
√
(2)
0 50 100
0
100
200
0
0.2
0.4
0.6
0 0.5 1
0 5 10
0
100
200
0
0.2
0.4
0.6
0 0.5 1
0 5 10
0
100
200
0
0.2
0.4
0.6
0 0.5 1
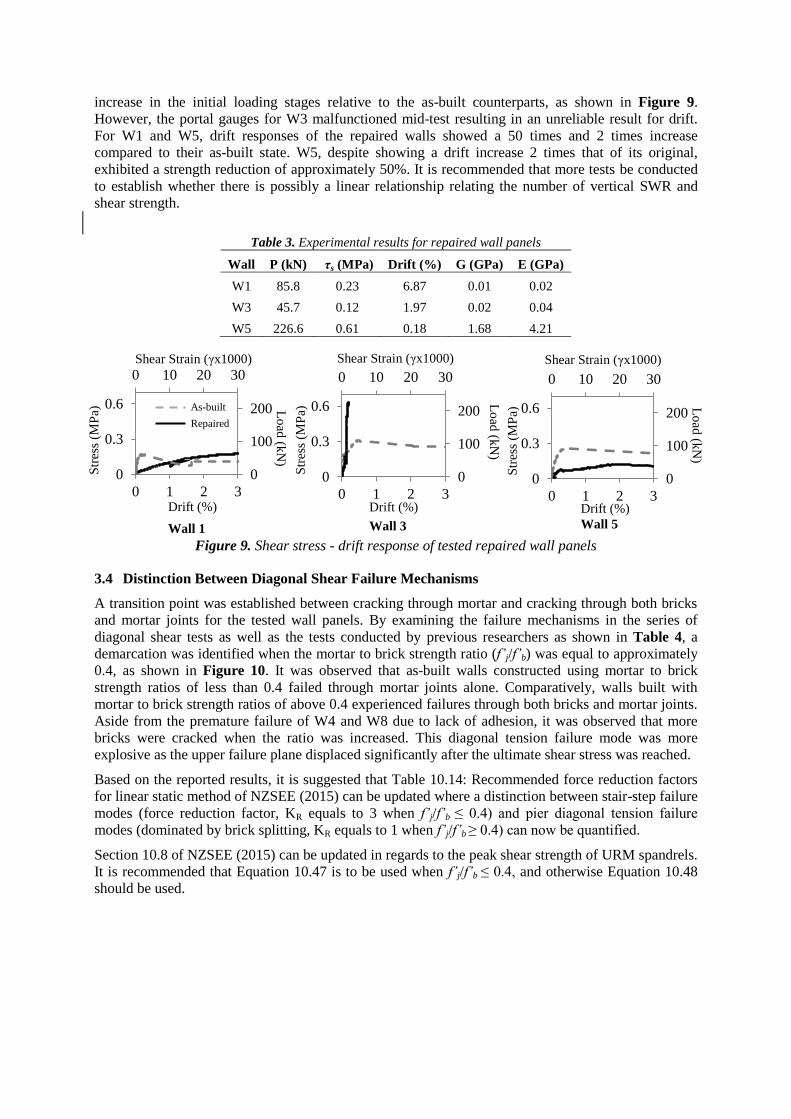
Table 2. Experimental results for as-built wall panels
Wall Mortar
(C:L:S) f'j/f'b P (kN)
τs
(MPa)
Vdt
(KN) Drift (%)
G
(GPa)
E
(GPa) Failure Type
W1 1:2:15 0.14 62.9 0.16 37.4 0.14 0.29 0.72 Mortar
W2 1:3:12 0.26 69.9 0.16 36.7 0.45 0.07 0.17 Mortar
W3 1:2:9 0.40 95.0 0.24 58.3 0.42 0.11 0.27 Mortar
W4 1:1:10 0.29 56.9 0.15 35.7 1.28 0.06 0.14 Sliding
W5 1:1:8 0.42 115.9 0.31 71.2 0.47 0.15 0.38 Mortar/Brick
W6 1:0:6 0.45 188.5 0.49 113.5 0.26 0.52 1.31 Mortar/Brick
W7 1:1:6 0.50 257.7 0.67 154.4 0.43 0.33 0.84 Mortar/Brick
W8 1:1:6 0.74 158.5 0.39 96.0 0.34 0.42 1.04 Mortar/Brick
.
3.3.2 Repaired Wall Panels
Wall panels W1 and W3, which were both repaired using six steel ropes, experienced increased load
carrying capacities. Ultimate loads increased from 63 kN to 86 kN and from 46 kN to 96 kN
respectively, while the maximum drift for both walls was significantly increased. This improved
capacity was due to the dissipation of energy through friction in the mortar bed joints being resisted by
the SWR in tension. Shear stress (τs) and drift were plotted to a maximum of 3% drift to emphasize the
0 5 10
0
100
200
0
0.2
0.4
0.6
0 0.5 1
0 5 10
0
100
200
0
0.2
0.4
0.6
0 0.5 1
0 5 10
0
100
200
0
0.2
0.4
0.6
0 0.5 1
0 5 10
0
100
200
0
0.2
0.4
0.6
0 0.5 1
0 5 10
0
100
200
0
0.2
0.4
0.6
0 0.5 1
Figure 8. Shear stress - drift response of tested as-built wall panels
Wall 1
Shear Strain (γx1000)
Str
ess
(MP
a)
Lo
ad (k
N)
Drift (%)
Wall 2
Shear Strain (γx1000)
Str
ess
(MP
a)
Lo
ad (k
N)
Drift (%)
Wall 3
Shear Strain (γx1000)
Str
ess
(MP
a)
Lo
ad (k
N)
Drift (%)
Wall 5
Str
ess
(MP
a)
Lo
ad (k
N)
Drift (%)
Shear Strain (γx1000) Wall 4
Str
ess
(MP
a)
Lo
ad (k
N)
Drift (%)
Shear Strain (γx1000) Wall 6
Shear Strain (γx1000)
Str
ess
(MP
a)
Lo
ad (k
N)
Drift (%) Wall 7
Shear Strain (γx1000)
Str
ess
(MP
a)
Lo
ad (k
N)
Drift (%)
Wall 8
Str
ess
(MP
a)
Lo
ad (k
N)
Drift (%)
Shear Strain (γx1000)
increase in the initial loading stages relative to the as-built counterparts, as shown in Figure 9.
However, the portal gauges for W3 malfunctioned mid-test resulting in an unreliable result for drift.
For W1 and W5, drift responses of the repaired walls showed a 50 times and 2 times increase
compared to their as-built state. W5, despite showing a drift increase 2 times that of its original,
exhibited a strength reduction of approximately 50%. It is recommended that more tests be conducted
to establish whether there is possibly a linear relationship relating the number of vertical SWR and
shear strength.
Table 3. Experimental results for repaired wall panels
Wall P (kN) τs (MPa) Drift (%) G (GPa) E (GPa)
W1 85.8 0.23 6.87 0.01 0.02
W3 45.7 0.12 1.97 0.02 0.04
W5 226.6 0.61 0.18 1.68 4.21
Figure 9. Shear stress - drift response of tested repaired wall panels
3.4 Distinction Between Diagonal Shear Failure Mechanisms
A transition point was established between cracking through mortar and cracking through both bricks
and mortar joints for the tested wall panels. By examining the failure mechanisms in the series of
diagonal shear tests as well as the tests conducted by previous researchers as shown in Table 4, a
demarcation was identified when the mortar to brick strength ratio (f’j/f’b) was equal to approximately
0.4, as shown in Figure 10. It was observed that as-built walls constructed using mortar to brick
strength ratios of less than 0.4 failed through mortar joints alone. Comparatively, walls built with
mortar to brick strength ratios of above 0.4 experienced failures through both bricks and mortar joints.
Aside from the premature failure of W4 and W8 due to lack of adhesion, it was observed that more
bricks were cracked when the ratio was increased. This diagonal tension failure mode was more
explosive as the upper failure plane displaced significantly after the ultimate shear stress was reached.
Based on the reported results, it is suggested that Table 10.14: Recommended force reduction factors
for linear static method of NZSEE (2015) can be updated where a distinction between stair-step failure
modes (force reduction factor, KR equals to 3 when f’j/f’b ≤ 0.4) and pier diagonal tension failure
modes (dominated by brick splitting, KR equals to 1 when f’j/f’b ≥ 0.4) can now be quantified.
Section 10.8 of NZSEE (2015) can be updated in regards to the peak shear strength of URM spandrels.
It is recommended that Equation 10.47 is to be used when f’j/f’b ≤ 0.4, and otherwise Equation 10.48
should be used.
0 10 20 30
0
100
200
0
0.3
0.6
0 1 2 3
0 10 20 30
0
100
200
0
0.3
0.6
0 1 2 3
As-built
Repaired
Wall 1
Shear Strain (γx1000)
Str
ess
(MP
a) L
oad
(kN
) Drift (%)
Wall 3
Shear Strain (γx1000)
Str
ess
(MP
a) L
oad
(kN
)
Drift (%)
Wall 5
Shear Strain (γx1000)
Str
ess
(MP
a) L
oad
(kN
)
Drift (%)
0 10 20 30
0
100
200
0
0.3
0.6
0 1 2 3
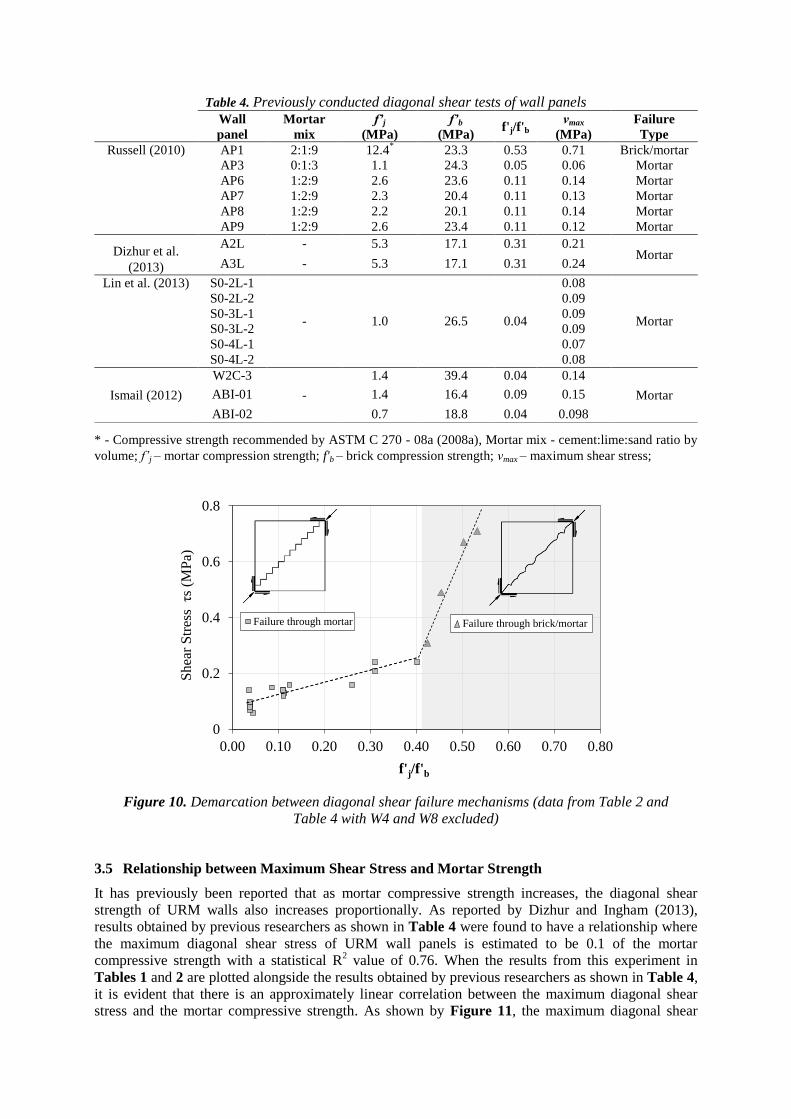
Table 4. Previously conducted diagonal shear tests of wall panels
* - Compressive strength recommended by ASTM C 270 - 08a (2008a), Mortar mix - cement:lime:sand ratio by
volume; f’j – mortar compression strength; f'b – brick compression strength; νmax – maximum shear stress;
Figure 10. Demarcation between diagonal shear failure mechanisms (data from Table 2 and
Table 4 with W4 and W8 excluded)
3.5 Relationship between Maximum Shear Stress and Mortar Strength
It has previously been reported that as mortar compressive strength increases, the diagonal shear
strength of URM walls also increases proportionally. As reported by Dizhur and Ingham (2013),
results obtained by previous researchers as shown in Table 4 were found to have a relationship where
the maximum diagonal shear stress of URM wall panels is estimated to be 0.1 of the mortar
compressive strength with a statistical R2 value of 0.76. When the results from this experiment in
Tables 1 and 2 are plotted alongside the results obtained by previous researchers as shown in Table 4,
it is evident that there is an approximately linear correlation between the maximum diagonal shear
stress and the mortar compressive strength. As shown by Figure 11, the maximum diagonal shear
0
0.2
0.4
0.6
0.8
0.00 0.10 0.20 0.30 0.40 0.50 0.60 0.70 0.80
Shea
r S
tres
s τ
s (M
Pa)
f'j/f'b
Failure through mortar Failure through brick/mortar
Wall
panel
Mortar
mix
f’j
(MPa)
f’b
(MPa) f'j/f'b
νmax
(MPa)
Failure
Type
Russell (2010) AP1 2:1:9 12.4* 23.3 0.53 0.71 Brick/mortar
AP3 0:1:3 1.1 24.3 0.05 0.06 Mortar
AP6 1:2:9 2.6 23.6 0.11 0.14 Mortar
AP7 1:2:9 2.3 20.4 0.11 0.13 Mortar
AP8 1:2:9 2.2 20.1 0.11 0.14 Mortar
AP9 1:2:9 2.6 23.4 0.11 0.12 Mortar
Dizhur et al.
(2013)
A2L - 5.3 17.1 0.31 0.21 Mortar
A3L - 5.3 17.1 0.31 0.24
Lin et al. (2013) S0-2L-1
- 1.0 26.5
0.04
0.08
Mortar
S0-2L-2 0.09
S0-3L-1 0.09
S0-3L-2 0.09
S0-4L-1 0.07
S0-4L-2 0.08
Ismail (2012)
W2C-3
-
1.4 39.4 0.04 0.14
Mortar ABI-01 1.4 16.4 0.09 0.15
ABI-02 0.7 18.8 0.04 0.098
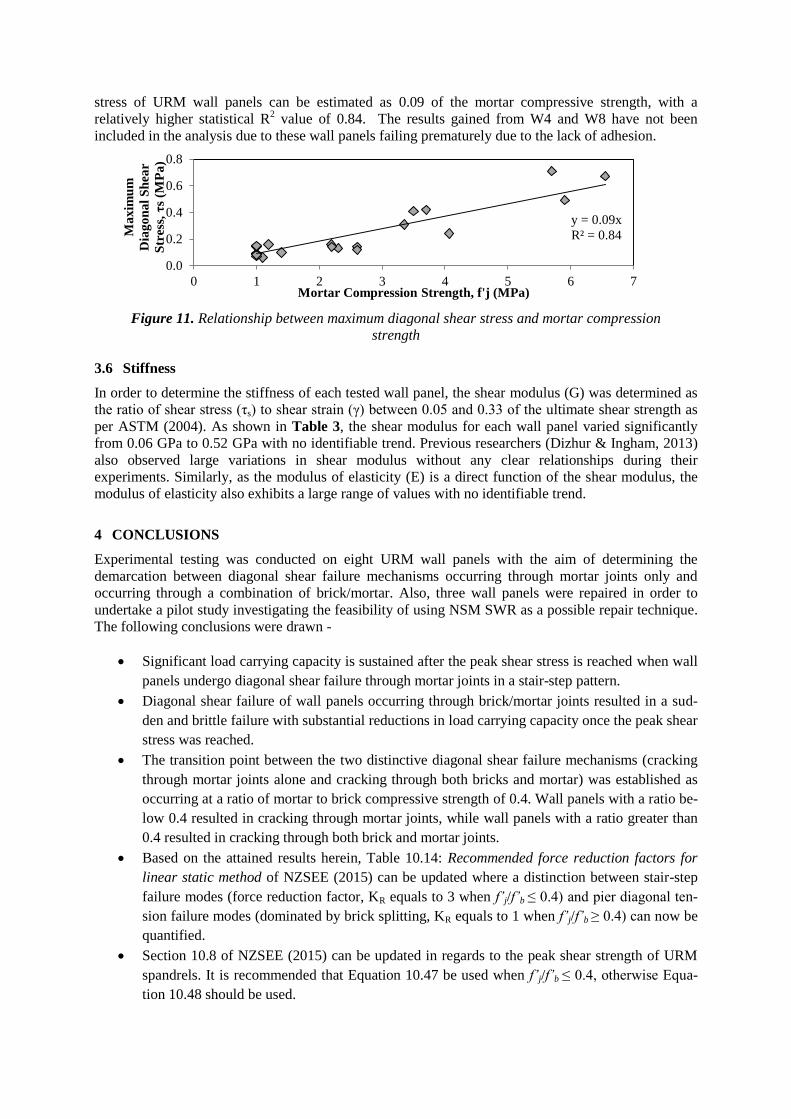
stress of URM wall panels can be estimated as 0.09 of the mortar compressive strength, with a
relatively higher statistical R2 value of 0.84. The results gained from W4 and W8 have not been
included in the analysis due to these wall panels failing prematurely due to the lack of adhesion.
Figure 11. Relationship between maximum diagonal shear stress and mortar compression
strength
3.6 Stiffness
In order to determine the stiffness of each tested wall panel, the shear modulus (G) was determined as
the ratio of shear stress (τs) to shear strain (γ) between 0.05 and 0.33 of the ultimate shear strength as
per ASTM (2004). As shown in Table 3, the shear modulus for each wall panel varied significantly
from 0.06 GPa to 0.52 GPa with no identifiable trend. Previous researchers (Dizhur & Ingham, 2013)
also observed large variations in shear modulus without any clear relationships during their
experiments. Similarly, as the modulus of elasticity (E) is a direct function of the shear modulus, the
modulus of elasticity also exhibits a large range of values with no identifiable trend.
4 CONCLUSIONS
Experimental testing was conducted on eight URM wall panels with the aim of determining the
demarcation between diagonal shear failure mechanisms occurring through mortar joints only and
occurring through a combination of brick/mortar. Also, three wall panels were repaired in order to
undertake a pilot study investigating the feasibility of using NSM SWR as a possible repair technique.
The following conclusions were drawn -
Significant load carrying capacity is sustained after the peak shear stress is reached when wall
panels undergo diagonal shear failure through mortar joints in a stair-step pattern.
Diagonal shear failure of wall panels occurring through brick/mortar joints resulted in a sud-
den and brittle failure with substantial reductions in load carrying capacity once the peak shear
stress was reached.
The transition point between the two distinctive diagonal shear failure mechanisms (cracking
through mortar joints alone and cracking through both bricks and mortar) was established as
occurring at a ratio of mortar to brick compressive strength of 0.4. Wall panels with a ratio be-
low 0.4 resulted in cracking through mortar joints, while wall panels with a ratio greater than
0.4 resulted in cracking through both brick and mortar joints.
Based on the attained results herein, Table 10.14: Recommended force reduction factors for
linear static method of NZSEE (2015) can be updated where a distinction between stair-step
failure modes (force reduction factor, KR equals to 3 when f’j/f’b ≤ 0.4) and pier diagonal ten-
sion failure modes (dominated by brick splitting, KR equals to 1 when f’j/f’b ≥ 0.4) can now be
quantified.
Section 10.8 of NZSEE (2015) can be updated in regards to the peak shear strength of URM
spandrels. It is recommended that Equation 10.47 be used when f’j/f’b ≤ 0.4, otherwise Equa-
tion 10.48 should be used.
y = 0.09x
R² = 0.84
0.0
0.2
0.4
0.6
0.8
0 1 2 3 4 5 6 7
Ma
xim
um
Dia
go
na
l S
hea
r
Str
ess,
τs
(MP
a)
Mortar Compression Strength, f'j (MPa)
The maximum diagonal shear stress of URM wall panels is able to be estimated as 0.09 of the
mortar compression strength.
Wall panels W1 and W3 which were repaired using SWR had increases in both load carrying
capacity and maximum drift compared to their as-built counterparts. Further experimentation
is required in order to assess effectiveness of this repair/retrofit technique.
5 ACKNOWLEDGEMENTS
The authors would like to thank Marta Giaretton, Peter Inman, Melissa Brisacque and the engineering
lab technicians at the University of Auckland. The authors would also like to acknowledge our
sponsors Sika Ltd. and D. M. Standen for supplying materials for this experiment.
6 REFERENCES
Almesfer, N., Dizhur, D. Y., Lumantarna, R., & Ingham, J. M. (2014). Material properties of existing unreinforced clay brick
masonry buildings in New Zealand. Bulletin of the New Zealand Society for Earthquake Engineering, 47(2), 75-96.
ASTM. (2003a). Standard test methods for sampling and testing brick and structural clay tile. C 67 - 03a, ASTM Interna-
tional, Pennsylvania, United States
ASTM. (2003b). Standard test method for compressive strength of masonry prisms. C 1314-03b, ASTM International, Penn-
sylvania, United States
ASTM. (2004). Standard test method for young’s modulus, tangent modulus, and chord modulus. E 111/E111 - 04, ASTM
International, Pennsylvania, United States
ASTM. (2008). Standard test method for compressive strength of hydraulic cement mortars. C109/C109M–08, ASTM
International, Pennsylvania, United States
ASTM. (2010). Standard test method for diagonal tension (shear) in masonry assemblages. E 519-10, ASTM International,
Pennsylvania, United States
Dizhur, D., & Ingham, J. M. (2013). Diagonal tension strength of vintage unreinforced clay brick masonry wall panels.
Construction and Building Materials, 43, 418-427.
Moon, L., Dizhur, D., Senaldi, I., Derakhshan, H., Griffith, M., Magenes, G., Ingham, J. M. ‘The demise of the URM
building stock in Christchurch during the 2010/2011 Canterbury earthquake sequence’, Earthquake Spectra, 30, 1, 253-
276.
Dizhur, D., Griffith, M., & Ingham, J. (2013). In-plane shear improvement of unreinforced masonry wall panels using NSM
CFRP strips. Journal of Composites for Construction, 17(6), 04013010
Griffith, M., & Ingham, J. (2011). Performance of unreinforced masonry buildings during the 2010 Darfield (Christchurch,
NZ) earthquake, Australian Journal of Structural Engineering, 11, 3, 207-224.
Ismail N. (2012). Selected strengthening techniques for the seismic retrofit of unreinforced masonry buildings. Doctoral
Dissertation. The University of Auckland.
Lin Y, Wotherspoon L, Scott A, Ingham JM. (2013). In-plane strengthening of clay brick unreinforced masonry wallettes
using ECC shotcrete. ASCE Journal of Structural Engineering, 140, 11, 04014081
Magenes, G., & Calvi, G. M. (1997). In-plane seismic response of brick masonry walls. Earthquake Engineering & Structural
Dynamics, 26(11), 1091-1112.
NZSEE (2015). Assessment and improvement of the structural performance of buildings in earthquakes. New Zealand Socie-
ty for Earthquake Engineering, Wellington, New Zealand
Russell, A. P. (2010). Characterisation and seismic assessment of unreinforced masonry buildings. Doctoral dissertation. The
University of Auckland.
Sika (2015). Sikadur 30 Product Data Sheet. Edition 9.23.2014