experimental investigation of nozzle shape effect on wall ... · a round orifice perforated either...
TRANSCRIPT

Abstract— This paper reports on measurements of velocities and
wall shear rates for an impinging round jet. The test parameter that
we consider is the nozzle shape. The Particle Image Velocimetry
(PIV) was used to measure the axial and radial velocity components.
The limitations of the PIV technique in the vicinity of the target wall
are addressed by using the electrodiffusion technique to achieve wall
shear rate distribution. A round orifice perforated either on a flat
plate (RO/P) or on a hemispherical surface (RO/H), is compared to a
reference convergent nozzle (CONV). All the nozzles have the same
exit diameter D. The exit volumetric flow rate was also conserved
and led to the same Reynolds number based on the exit bulk-velocity,
Re0 = 5290. The nozzle-to-wall distance was constant and equal to
2D. The whole velocity field and wall shear rates in the three
impinging round jets having different features are compared. This has
improved the understanding of the jet/wall interaction. The wall
shear rate is in a close relationship with the near field flow features,
themselves affected by nozzle geometry. The orifice nozzles generate
narrower exit profiles compared to the convergent nozzle. The vena
contracta effect in orifice jets, more intense with RO/P than with
RO/H, generates an increase of the exit centerline velocity. The
hemispherical surface of RO/H nozzle leads to a venna-stretching
attenuating somewhat the venna contracta effect at the jet exit. The
instantaneous PIV fields indicated the formation of secondary
vortices in the region where a secondary peak in the mean and rms
distributions of wall shear rate emerged.
Keywords—Electrodiffusion, hemispherical nozzle, impinging
round jet, PIV, wall shear rate.
I. INTRODUCTION
thorough research, beginning with Gardon et al.
contributions [1-3], concerned the heat/mass transfer in
impinging jets, and an early observation has been made in
[2] about the importance of jet turbulence in heat transfer
processes. It was shown that some seemingly anomalous heat-
transfer phenomena can be explained as effects of the
turbulence occurring in jets. Turbulence is generated by the jet
itself and by external disturbances and varies significantly with
the nozzle shape, upstream conditions and position within the
jet. One decade after the observation of Gardon and Akrifat
[2], Popiel and Boguslawski [4] claimed that nozzle exit
configuration is the most important factor affecting the
heat/mass transfer. Despite these first very significant
indications, there are only a few studies dedicated to heat/mass
transfer dependency of nozzle geometry.
Lee et al. [5] compared three round orifice nozzles with an exit
jet Reynolds numbers Re0 in a range of 10000–30000 and
nozzle-to-plate spacing H in a range 2D–10D, where D is the
exit nozzle diameter. The orifices were square-edged,
standard-edged and sharp-edged, respectively. The square-
edged orifice is straight hole with straight-through edges (90°
corners at the hole). The standard edged orifice has square
edged corners at the entrance, and a bevel edges at the outlet.
The sharp-edged orifice is beveled through the entire thickness
of the hole (with an angle of 45° relative to the axis normal to
the orifice plate). In the stagnation region, the sharp-edged
orifice jet yields significantly higher heat transfer rates than
either the standard-edged orifice jet or square-edged orifice
jet. The effect of nozzle exit configuration on the stagnation
point heat transfer is more sensible at shorter nozzle-to-plate
spacing.
The literature reveals that for high Reynolds numbers and low
nozzle-to-wall distances, two peaks are present on the radial
distributions of local Nusselt number, produced by circular
impinging jets. The first peak corresponds to the maximum of
heat transfer rate and occurs approximately at the nozzle
radius. In some investigations [5-8], the location of the first
peak is observed from r = 0.5D to r = 0.7D for H< 4D. This
peak is attributed to the high turbulence intensity at the nozzle
edge and to the direct impingement of large toroïdal Kelvin-
Helmholtz (K–H) vortices originated in the mixing region. The
secondary peak occurs at the radial distance from the
stagnation point ranging from 1.2D to 2.5D [5, 7-9]. The
second peak is either attributed to the transition from laminar
to turbulent boundary layer in the wall jet region [3] or to the
unsteady separation of the induced secondary vortices that
form near the wall under primary K–H vortices [10]. With the
increasing Reynolds number, the location of the secondary
peak moves outwards from the stagnation point and the peak
height increases [5].
Whereas numerous papers were published on the Nusselt
number (Nu) distributions generated by impinging jets, only a
few studies have been dedicated to the analysis of the
corresponding wall shear rate ( ) distributions [6, 11-13].
Available data of Nu and are compared and reveals
similarities in their distributions, on the number of peaks and
their radial locations. For high Reynolds number (Re0 = 41600)
Experimental investigation of nozzle shape
effect on wall shear stress beneath impinging
round jet
B. Montagné, K. Sodjavi, P. Bragança, A. Meslem and M. Kristiawan
A
Proceedings of the 2014 International Conference on Mechanics, Fluid Mechanics, Heat and Mass Transfer
ISBN: 978-1-61804-220-0 60

and H< 4D, two peaks are evident in (or in wall shear stress
= . ) distribution [12]. Similarly to Nu -distribution [5-8],
the first peak in - distribution appears at the distance from the
stagnation point ranging from r = 0.56D to r = 0.74D, while
the second peak is located at r = 1.9D [12, 14] . The fact that
peak-locations in - distribution are closely matching with
those of Nu - distribution, suggests that the wall shear stress
and the local heat/mass transfer are closely linked. Also, the
connection of the heat/mass transfer phenomena with the large-
scale structures which develop in the free jet region or with the
subsequent flow dynamics in the stagnation and wall jet
regions is now recognized [7, 10, 15, 16]. Therefore, the
control of large-scale structures in impinging jets is a key
element in the strategy of heat/mass transfer optimization and
control. The passive control based on nozzle geometry
modifications is particularly attractive because of easy
implementation in industrial applications.
The present article is in continuation of our previous study in
which a round plate orifice jet is compared to a reference
convergent nozzle jet in terms of wall shear rate and local
mass transfer at a very low Reynolds number, Re0 = 1360
[17]. It was concluded that the orifice jet enhances
significantly transfer phenomenon compared to the reference
convergent jet. The orifice jet flow generates larger in size,
well-defined and vigorous primary K–H structures with
comparison to the convergent nozzle jet. These differences
were associated with differences in initial velocity profiles and
the resulting flow development. The vena contracta in the
orifice jet generates a thinner shear layer and an increase of the
exit mean velocity relative to exit bulk-velocity.
We consider herein a turbulent case with a Reynolds number
Re0 = 5290. We also extend the analysis to an innovative
geometry of the nozzle, i.e., a round orifice perforated on a
hemispherical surface. The hemispherical nozzle has never
been used in the literature for jet generation. The
hemispherical surface which is supporting the round orifice
considered in the present study is intended to increase the
stretching of the shear-layer at the jet exit, supposing to
generate a more efficient jet dynamics for wall skin friction
enhancement. Contrary to previous investigation where the
nozzle-to-wall distance was varied in the range 2D – 5D, this
distance is now kept constant, i. e. H = 2D (with D = 7.8 mm
for each nozzle). This particular distance was selected by
considering that it corresponds approximately to the first half
of the potential core length of a round free jet [18], where the
K–H toroïdal vortices are well formed and are still well
defined at the target placed at this distance.
Wall shear stress distribution on the target plate is measured
using the electrodiffusion method (ED), the same method as
we have used before in [17, 19]. Phares et al. [13] made a
critical survey of different techniques used for the
measurements of wall shear stress and concluded that the ED
method provides the greatest accuracy of any indirect method.
To our knowledge, Kataoka et al. [6] have been the first to
introduce this technique for the measurement of wall skin
friction generated by an impinging jet. This method provides
information on the wall shear rates and the velocity field is
captured using Particle Image Velocimetry (PIV). Both
techniques (ED and PIV) are complementary as the PIV fails
at the vicinity of the wall due to the laser scattering by the
solid surface.
The paper is structured within two main Sections. In the
Section II we outlined the employed experimental procedures
and the Section III is dedicated to results analysis.
II. EXPERIMENTAL PROCEDURES
A. Experimental setup and geometry of nozzles
The experiments are conducted in a liquid-liquid jet
impinging orthogonally onto a wall. A schematic diagram of
its generation in a reservoir is shown in Figure 1. A gear pump
(Ismatec with a GJ-N23 head) draws the liquid from a
reservoir and delivers it to a nozzle. The liquid jet issued from
the nozzle impinges a circular target disc provided with six
electrodes (Figure 2) which serve as the probes for
electrodiffusion measurements. The temperature of liquid is
controlled by a cooling coil within 0.2°C. The nozzle is
screwed to a 200 mm length stainless steel tube with inner and
outer diameters of 15 and 20 mm, respectively. A honeycomb
manufactured of a 7 mm thick disc by drilling 17 holes with a
diameter of 2 mm was fitted in the tube inlet. The nozzle
assembly was located in a support which allowed vertical
movement for accurate alignment of the nozzle axis with the
electrodes centre. The reservoir was placed on a sliding
compound table (Proxxon KT 150) which allowed movement
in the axial and transverse direction relative to the nozzle with
a precision of 0.05 mm.
Figure 1: Diagram of apparatus: 1 target disc with electrodes,
2 tube with nozzle and honeycomb, 3 pump, 4 reservoir, 5
compound table, 6 nozzle holder, 7 cooling coil
The target (Figure 2) was manufactured of a Poly(methyl
methacrylate) disc with a diameter of 100 mm and a thickness
of 17 mm by first drilling holes to insert the electrodes. The
platinum foil with a diameter of 50 mm and a thickness of 50
µm was assembled centrally with the disc using Neoprene
glue. Holes with a diameter 0.7 mm were drilled through the
platinum foil as a continuation of the holes in the disc. The
electrodes were manufactured of a 0.5 mm platinum wire
1 2 3
4
5
6
7
Proceedings of the 2014 International Conference on Mechanics, Fluid Mechanics, Heat and Mass Transfer
ISBN: 978-1-61804-220-0 61

which was coated electrophoretically using a deposit of a
polymeric paint. After soldering connecting cables, the
electrodes were glued with an epoxy resin into the disc, so that
the tops of the platinum wires just projected above the
platinum foil. The wires were then rubbed down flush with the
surface of the platinum foil using progressively finer grades of
emery paper. The last emery paper had a grit size of 10 µm.
The whole surface was then polished using a fine dental paste.
The resulting surface roughness was about 0.11 µm which is
much less than the Nernst diffusion layer thickness estimated
at 10 µm.
Figure 2: Target disc with electrodes row: 1-6 electrodes
0.5mm. Ap and Bp are the limits of stagnation point
displacement
In this study, three round nozzles (Figure 3) having the same
exit diameter D = 7.8mm are compared: a convergent nozzle
(CONV in Figure 3 a), a round orifice on a flat plate (RO/P in
Figure 3 b) and a round orifice on a hemisphere (RO/H in
Figure 3 c). A convergent nozzle had a conical shape with an
area contraction 4:1 on a length of 17 mm. The flat surface
orifice nozzle (RO/P) is drilled in a metal plate with a
thickness of 0.5 mm, while the curve surface orifice nozzle
(RO/H) is made in a hollow sphere with an internal radius of
7.6 mm and a thickness of 1 mm.
The Reynolds number based on the diameter D and the jet
bulk-velocity Wb (Wb = 4Q0/D2
= 0.72m/s) was Reb = 5290.
The distance H between the jet exit and the target wall was
kept constant, H = 2D, for all the measurements. The
coordinate system (r,Y,Z) attached to the nozzle is shown in
Figure 4. As sketched in this figure, the flow field may be
divided into several regions. In the neighborhood of the
stagnation point S, the flow spreads in radial directions parallel
to the wall. The development of the impinging jet flow field
near the wall is typically divided in two regions: the stagnation
region associated with the turning of the mean flow, r/D <1,
and the radial wall jet region, r/D >1.
Table 1: Initial conditions of the three studied flows
Nozzle
(m/s)
(m/s)
CONV
0.72
5290
0.82 1.14 0.99
RO / H 1.07 1.49 1.29
RO / P 1.21 1.68 1.44
Figure 3: Sketch of nozzles: (a) 1 – Convergent nozzle (CONV), 2 – tube; (b) 1– Round
Orifice on Plate (RO / H), 2 – tube, 3 – sleeve nut; (c) Round Orifice on Hemisphere (RO / H)
26 15
7.8
30 17
2
1
7.8
26 15 21
1.6 0.5
5
17
1
2
3
(a)
(b)
(c)
7.8
15.2 19.4 22.4
CONV
RO / P
RO / H
Figure 3: Sketch of nozzles: (a) 1 – Convergent nozzle
(CONV), 2 – tube; (b) 1– Round Orifice on Plate (RO/P), 2 –
tube, 3 – sleeve nut; (c) Round Orifice on Hemisphere (RO/H)
– a plane orifice of D = 7.8mm is projected onto a spherical
surface
B. PIV measurements
Flow analysis has been carried out using PIV measurements.
The PIV system includes a Quantel BigSky 200 mJ dual Yag
laser and a FlowSense EO (CCD) camera of 2048×2048 pixels
resolution with pixel size of 7.4×7.4 μm2. The total view field
is about 2D×6D to cover free and wall jet regions (Figure 4
and Figure 5). The light sheet optics produces a laser sheet of
less than 1 mm in thickness. The maximum acquisition
frequency of the PIV system is 15 Hz. For each experiment,
500 couples of images are acquired. The recordings are
analyzed through two different windows. Firstly, the velocity
distribution in the total field of view (2D×6D) is calculated
using an adaptive multi-grid correlation algorithm handling the
window distortion and sub-pixel window displacement
b
0
W
W
DW
Re
b
b
b
Peakmax
W
U0WbW
2 3 4 5 6
Platinum anode 50
3.4 3.9 5 5 5
6 platinum insulated electrodes 0.5
3.4
1
5 10
Ap Bp r
Proceedings of the 2014 International Conference on Mechanics, Fluid Mechanics, Heat and Mass Transfer
ISBN: 978-1-61804-220-0 62
(128×128, 64×64, and 32×32 pixels) and 50% overlapping.
Secondly, to get a better resolution of velocity vectors in the
radial wall jet region (Figure 4) the same algorithm is used
with a final grid composed of 8×64 pixels interrogation
windows and 50 % overlapping. The prediction-correction
validation method of multi-grid algorithm identified on
average less than 1% erroneous velocity vectors, which are
replaced using a bilinear interpolation scheme. For all the
experiments, the uncertainty of the measurement due to the
displacement error was estimated to be in the range of 1 to 3 %
outside the boundary layer.
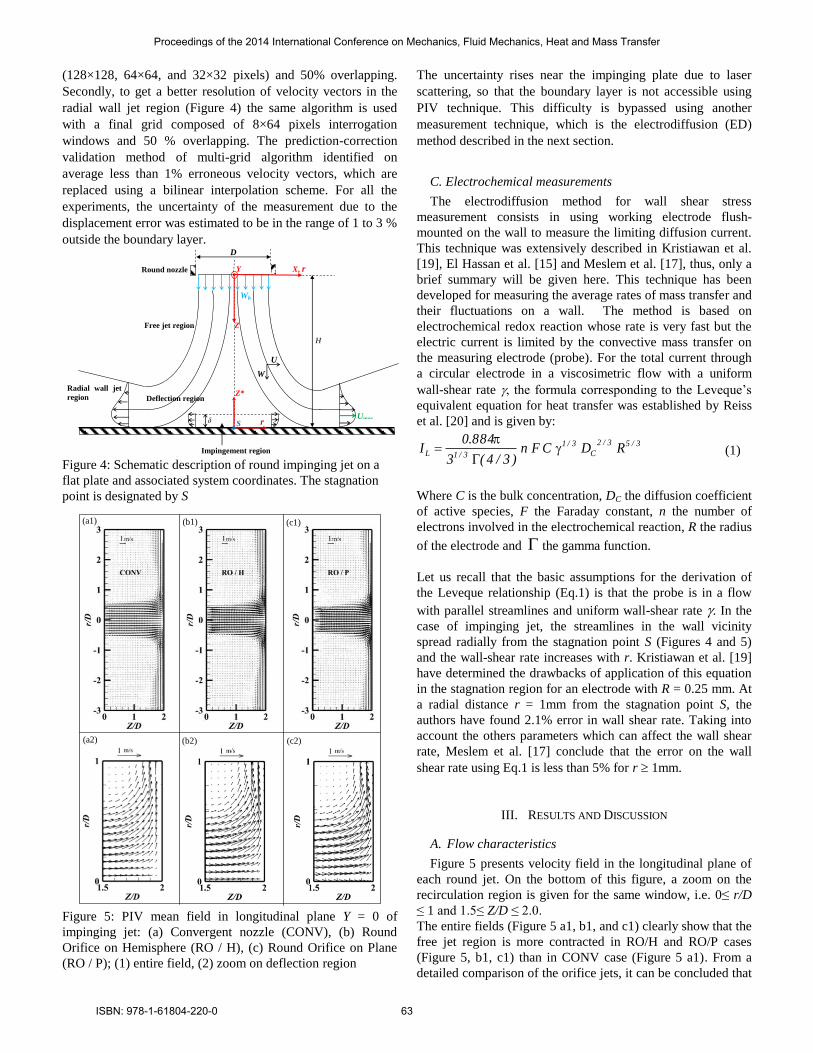
Figure 4: Schematic description of round impinging jet on a flat plate and associated
system coordinates. The stagnation point is designated by S
Impingement region
S
X, r
W
U
Z*
r u
Z
Y Round nozzle
Free jet region
Radial wall jet
region
D
Deflection region
δ
h
H
Umax S
Wb
Figure 4: Schematic description of round impinging jet on a
flat plate and associated system coordinates. The stagnation
point is designated by S
Figure 5: PIV field in longitudinal plane Y = 0 of impinging jet: (a) Convergent nozzle
(CONV), (b) Round Orifice on Hemisphere (RO / H), (c) Round Orifice on Plane (RO / P);
(1) entire field, (2) zoom on impinging region
(a1) (b1) (c1)
(a2) (b2) (c2)
Figure 5: PIV mean field in longitudinal plane Y = 0 of
impinging jet: (a) Convergent nozzle (CONV), (b) Round
Orifice on Hemisphere (RO / H), (c) Round Orifice on Plane
(RO / P); (1) entire field, (2) zoom on deflection region
The uncertainty rises near the impinging plate due to laser
scattering, so that the boundary layer is not accessible using
PIV technique. This difficulty is bypassed using another
measurement technique, which is the electrodiffusion (ED)
method described in the next section.
C. Electrochemical measurements
The electrodiffusion method for wall shear stress
measurement consists in using working electrode flush-
mounted on the wall to measure the limiting diffusion current.
This technique was extensively described in Kristiawan et al.
[19], El Hassan et al. [15] and Meslem et al. [17], thus, only a
brief summary will be given here. This technique has been
developed for measuring the average rates of mass transfer and
their fluctuations on a wall. The method is based on
electrochemical redox reaction whose rate is very fast but the
electric current is limited by the convective mass transfer on
the measuring electrode (probe). For the total current through
a circular electrode in a viscosimetric flow with a uniform
wall-shear rate , the formula corresponding to the Leveque’s
equivalent equation for heat transfer was established by Reiss
et al. [20] and is given by:
3/53/2
C
3/1
3/1L RDCFn)3/4(3
884.0I
(1)
Where C is the bulk concentration, DC the diffusion coefficient
of active species, F the Faraday constant, n the number of
electrons involved in the electrochemical reaction, R the radius
of the electrode and the gamma function.
Let us recall that the basic assumptions for the derivation of
the Leveque relationship (Eq.1) is that the probe is in a flow
with parallel streamlines and uniform wall-shear rate . In the
case of impinging jet, the streamlines in the wall vicinity
spread radially from the stagnation point S (Figures 4 and 5)
and the wall-shear rate increases with r. Kristiawan et al. [19]
have determined the drawbacks of application of this equation
in the stagnation region for an electrode with R = 0.25 mm. At
a radial distance r = 1mm from the stagnation point S, the
authors have found 2.1% error in wall shear rate. Taking into
account the others parameters which can affect the wall shear
rate, Meslem et al. [17] conclude that the error on the wall
shear rate using Eq.1 is less than 5% for r 1mm.
III. RESULTS AND DISCUSSION
A. Flow characteristics
Figure 5 presents velocity field in the longitudinal plane of
each round jet. On the bottom of this figure, a zoom on the
recirculation region is given for the same window, i.e. 0≤ r/D
≤ 1 and 1.5≤ Z/D ≤ 2.0.
The entire fields (Figure 5 a1, b1, and c1) clearly show that the
free jet region is more contracted in RO/H and RO/P cases
(Figure 5, b1, c1) than in CONV case (Figure 5 a1). From a
detailed comparison of the orifice jets, it can be concluded that
Proceedings of the 2014 International Conference on Mechanics, Fluid Mechanics, Heat and Mass Transfer
ISBN: 978-1-61804-220-0 63

the RO/P orifice nozzle generates greater contraction than
RO/H orifice nozzle. As shown in Figure 5 a2, b2 and c2, the
contracted free jet region leads to a contracted deflection
region.
For an axial position Z, the extent of the radial jet expansion in
the free jet region is defined by the jet thickness r0.1, which is
the radial position in the jet where the axial velocity W takes
the value 0.1Wc ; Wc is the centerline velocity at the same axial
position Z. The streamwise evolution of normalized jet
thickness, r0.1/D, is plotted in Figure 6 for each jet. As
expected, the convergent jet is more expanded than the orifice
jets. Comparison of the two orifice jets, confirms that the
RO/H nozzle attenuates the vena contracta effect, which
characterizes orifice jets.
0.4
0.5
0.6
0.7
0.8
0.9
1
1.1
0 0.5 1 1.5 2
CONV
RO/H
RO/P
D/Z
D/
r1.
0
Figure 6: Growth of jet thicknesses in the free jet region
The differences in jet contraction are visible also on the
streamwise velocity profiles (Figure 7 a and b), and on
transverse velocity profiles as well (Figure 7 c).
In the free jet region, at Z = 1.7D (Figure 7 b), axial velocity
profile exhibits an “M shape”, whereas at Z = 0.5D (Figure 7
a) the profile is flat. Hence, flow acceleration in the outer edge
of the shear layer is a result of jet/wall interaction. Before
impinging the wall, the jet accelerates in the outer edge (Figure
7 b) and decelerates on the axis, as visible on streamwise
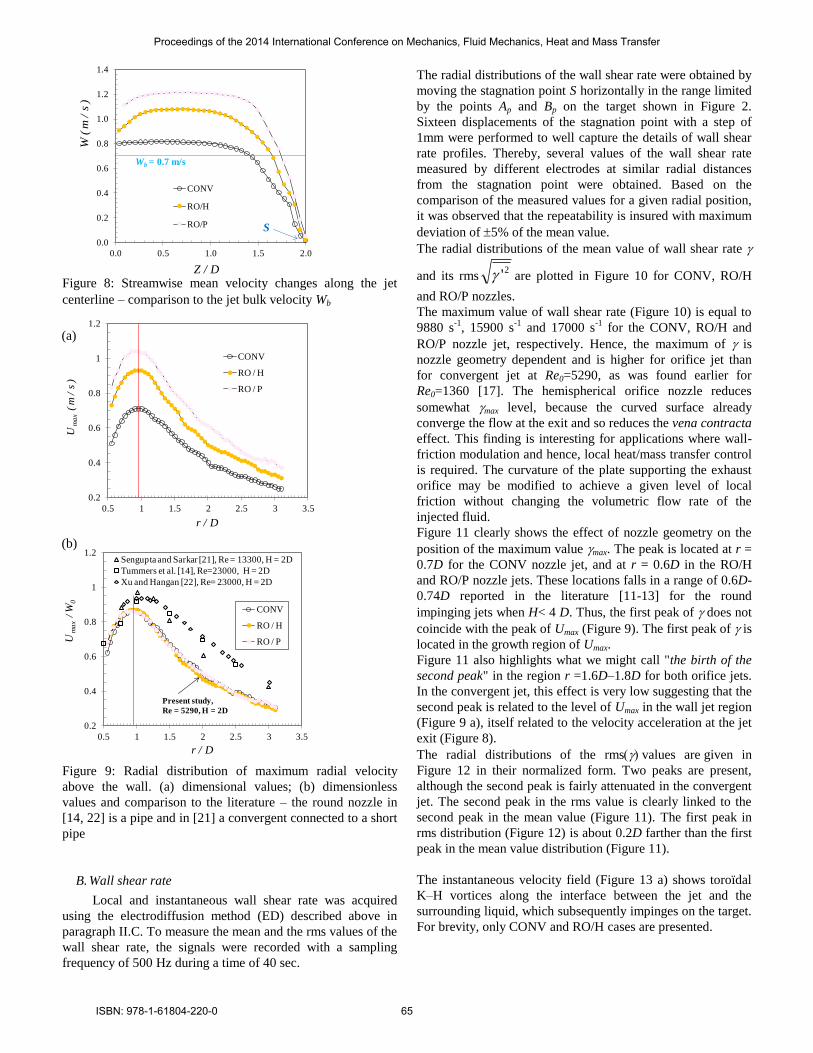
velocity changes along the jet centerline given in Figure 8. As
evidenced by this figure, the axial velocity achieves zero at the
stagnation point S. The value of jet bulk velocity Wb reported
in this figure highlights when compared to the maximum
centerline velocity W0, the level of flow acceleration as a
function of nozzle geometry. The most accelerated flow is
given by RO/P nozzle, followed by RO/H nozzle and then
CONV nozzle (see also Table 1 where the values of W0/Wb are
provided). The same trend is found in the wall jet region when
one compares the changes of maximum velocity Umax along the
wall (Figure 9a). Indeed, the peak level of Umax is linked to the
jet acceleration level (see Table 1). However, the curves have
similar shapes and the position of the peak of Umax, r = 0.95D,
seems, to be unsensitive to the contraction level of the jet flow
(Figure 9a). When Umax is normalized by W0 (Figure 9b),
radial distributions of maximum velocity in the wall jet region
are self-similar. The comparison of dimensionless distributions
to those of the literature [14, 21, 22] of round jets at the same
normalized nozzle-to-plate distance, H/D = 2, suggests a
possible effect of jet exit Reynolds number Re0 on the level of
Umax/W0. However, the radial position of the peak value
remains almost unchanged with different Re0 and different
round nozzle geometries. In fact, the round nozzle in [14, 22]
is a long pipe and a convergent nozzle connected to a short
pipe in [21].
-0.2
0
0.2
0.4
0.6
0.8
1
1.2
1.4
-0.8 -0.4 0.0 0.4 0.8
CONV
RO / H
RO / P
D/r
Z = 0.5 D
)s
/m
(W
0
0.2
0.4
0.6
0.8
1
-1.2 -0.8 -0.4 0 0.4 0.8 1.2
CONV
RO / H
RO / P
D/r D/r
Z = 1.7 D
)s
/m
(W
-0.4
-0.2
0
0.2
0.4
-1.2 -0.8 -0.4 0 0.4 0.8 1.2
CONV
RO / H
RO / P
D/r D/r
Z = 1.7 D
)s
/m
(U
Figure 7: Steamwise velocity (a,b) and transverse velocity (c)
profiles in the free jet region
(a)
(c)
(b)
Proceedings of the 2014 International Conference on Mechanics, Fluid Mechanics, Heat and Mass Transfer
ISBN: 978-1-61804-220-0 64
0.0
0.2
0.4
0.6
0.8
1.0
1.2
1.4
0.0 0.5 1.0 1.5 2.0
CONV
RO/H
RO/P
D/Z
)s
/m
(W
S
Wb = 0.7 m/s
Figure 8: Streamwise mean velocity changes along the jet
centerline – comparison to the jet bulk velocity Wb
0.2
0.4
0.6
0.8
1
1.2
0.5 1 1.5 2 2.5 3 3.5
CONV
RO / H
RO / P
D/r
)s
/m
(U
ma
x
0.2
0.4
0.6
0.8
1
1.2
0.5 1 1.5 2 2.5 3 3.5
Sengupta and Sarkar [21], Re = 13300, H = 2D
Tummers et al. [14], Re=23000, H = 2D
Xu and Hangan [22], Re= 23000, H = 2D
D/r
0m
ax
W/
U
Present study,
Re = 5290, H = 2D
0.2
0.4
0.6
0.8
1
1.2
0.5 1 1.5 2 2.5 3 3.5
CONV
RO / H
RO / P
D/r
)s
/m
(U
ma
x
Figure 9: Radial distribution of maximum radial velocity
above the wall. (a) dimensional values; (b) dimensionless
values and comparison to the literature – the round nozzle in
[14, 22] is a pipe and in [21] a convergent connected to a short
pipe
B. Wall shear rate
Local and instantaneous wall shear rate was acquired
using the electrodiffusion method (ED) described above in
paragraph II.C. To measure the mean and the rms values of the
wall shear rate, the signals were recorded with a sampling
frequency of 500 Hz during a time of 40 sec.
The radial distributions of the wall shear rate were obtained by
moving the stagnation point S horizontally in the range limited
by the points Ap and Bp on the target shown in Figure 2.
Sixteen displacements of the stagnation point with a step of
1mm were performed to well capture the details of wall shear
rate profiles. Thereby, several values of the wall shear rate
measured by different electrodes at similar radial distances
from the stagnation point were obtained. Based on the
comparison of the measured values for a given radial position,
it was observed that the repeatability is insured with maximum
deviation of 5% of the mean value.
The radial distributions of the mean value of wall shear rate
and its rms2' are plotted in Figure 10 for CONV, RO/H
and RO/P nozzles.
The maximum value of wall shear rate (Figure 10) is equal to
9880 s-1
, 15900 s-1
and 17000 s-1
for the CONV, RO/H and
RO/P nozzle jet, respectively. Hence, the maximum of is
nozzle geometry dependent and is higher for orifice jet than
for convergent jet at Re0=5290, as was found earlier for
Re0=1360 [17]. The hemispherical orifice nozzle reduces
somewhat max level, because the curved surface already
converge the flow at the exit and so reduces the vena contracta
effect. This finding is interesting for applications where wall-
friction modulation and hence, local heat/mass transfer control
is required. The curvature of the plate supporting the exhaust
orifice may be modified to achieve a given level of local
friction without changing the volumetric flow rate of the
injected fluid.
Figure 11 clearly shows the effect of nozzle geometry on the
position of the maximum value max. The peak is located at r =
0.7D for the CONV nozzle jet, and at r = 0.6D in the RO/H
and RO/P nozzle jets. These locations falls in a range of 0.6D-
0.74D reported in the literature [11-13] for the round
impinging jets when H< 4 D. Thus, the first peak of does not
coincide with the peak of Umax (Figure 9). The first peak of is
located in the growth region of Umax.
Figure 11 also highlights what we might call "the birth of the
second peak" in the region r =1.6D–1.8D for both orifice jets.
In the convergent jet, this effect is very low suggesting that the
second peak is related to the level of Umax in the wall jet region
(Figure 9 a), itself related to the velocity acceleration at the jet
exit (Figure 8).
The radial distributions of the rmsvalues aregiven in
Figure 12 in their normalized form. Two peaks are present,
although the second peak is fairly attenuated in the convergent
jet. The second peak in the rms value is clearly linked to the
second peak in the mean value (Figure 11). The first peak in
rms distribution (Figure 12) is about 0.2D farther than the first
peak in the mean value distribution (Figure 11).
The instantaneous velocity field (Figure 13 a) shows toroïdal
K–H vortices along the interface between the jet and the
surrounding liquid, which subsequently impinges on the target.
For brevity, only CONV and RO/H cases are presented.
(a)
(b)
Proceedings of the 2014 International Conference on Mechanics, Fluid Mechanics, Heat and Mass Transfer
ISBN: 978-1-61804-220-0 65

0
400
800
1200
1600
2000
0
2000
4000
6000
8000
10000
0 0.5 1 1.5 2 2.5 3
)s
(1
)s
('
12
CONV
D/r
0
400
800
1200
1600
2000
2400
2800
3200
0
2000
4000
6000
8000
10000
12000
14000
16000
18000
0 0.5 1 1.5 2 2.5 3
RO / H)
s('
12
)s(
1
D/r
0
400
800
1200
1600
2000
2400
2800
3200
0
2000
4000
6000
8000
10000
12000
14000
16000
18000
0 0.5 1 1.5 2 2.5 3
RO / P
)s(
1
)s(
'1
2
D/r Figure 10: Wall shear rate and its rms values as a function of
normalized radial distance from the stagnation point S
0.0
0.2
0.4
0.6
0.8
1.0
1.2
0 0.5 1 1.5 2 2.5 3
CONV
D/r
RO / H
RO / Pmax
Figure 11: Comparison of normalized wall-shear rate
0.0
0.2
0.4
0.6
0.8
1.0
1.2
0 0.5 1 1.5 2 2.5 3
CONV
RO / H
D/r
RO / P
max
2
2
'
'
Figure 12: Comparison of normalized values of the rms of
wall-shear rate
( I )
( II )
01
0
1
2
3
(b)
(c)
01
0
1
2
3
(b)
(c)
(a)
(a)
Figure 13: (I) CONV nozzle jet, (II) RO/H nozzle jet: (a)
Instantaneous vorticity fieldX
W
Z
UY
- Sticks indicate the
position of max and arrows indicate secondary vortices on the
target; (b) max/ ; (c) max
22 '/'
Proceedings of the 2014 International Conference on Mechanics, Fluid Mechanics, Heat and Mass Transfer
ISBN: 978-1-61804-220-0 66

The first peak in the distribution of the mean value (Figure 13
b) and in the distribution of the rms value (Figure 13 c),
appears in the region where the K-H vortices strike the target
(Figure 13 a). The second peak (in and in its rms
distribution) emerges at the position where appear secondary
counter-rotating vortices, designated by an arrow in Figure 13
a. The secondary structures are present in both convergent jet
(Figure 13, I) and orifice jet (Figure 13, II).
If we advance once again the similarity between the second
peak of and the second peak of Nu, the observation made
above is consistent with that of Hadziabdic and Hanjalic [10].
From their LES simulation of a round impinging jet, the
authors observed that the second peak in Nu, (pertinent only
for small H/D and high Reynolds Re0 numbers) is caused by
reattachment of the recirculation bubble and associated
turbulence production, as well as subsequent strong advection.
IV. Conclusion
Three round impinging jets with a Reynolds number of 5290
and a nozzle-to-wall distance of 2D, have been compared in
the present study. A round orifice perforated either on a flat
plate (RO/P) or on a hemispherical surface (RO/H), is
compared to a reference convergent nozzle (CONV). In each
jet, Particle Image velocimetry (PIV) and Electrodiffusion
technique (ED) were used to produce a data set on the flow
field and the wall shear rate, respectively.
The instantaneous velocity fields indicated that the formation
of small secondary vortices above the impingement plate,
under primary Kelvin-Helmholtz, occur in the region r =1.6D–
1.8D. In the same region, mean and rms values of the wall
shear rate exhibited a secondary peak in their radial
distributions. The appearance of the secondary peak depends
on the level of the maximum radial velocity in the wall-jet
region. The level of maximum velocity in the wall jet region is
as high as the flow is accelerated at the jet exit. The jet
acceleration was shown to be more intensive in the orifice jets
than in the convergent jet due to the vena contracta effect.
However, the curved surface supporting the orifice stretches
the flow at the exit, and reduces the vena contracta effect. This
leads to a lower wall-friction than in the case of the flat orifice.
This finding is interesting for applications where wall-friction
modulation and hence, local heat/mass transfer control, is
required without changing the volumetric flow rate of the
injected fluid.
ACKNOWLEDGMENT
This work was supported by the Grants of the French National
Agency of Research, project “FLUBAT”, ANR-12-VBDU-
0010 and the Grants of the PRES Limousin Poitou-Charentes
REFERENCES
1. Gardon, R., Heat Transfer Between a Flat Plate and Jets of Air
Impinging on It. Int. Dev. Heat Transfer (ASME), 1962: p. 454-
460.
2. Gardon, R. and J.C. Akfirat, The role of turbulence in determining
the heat-transfer characteristics of impinging jets. international
Journal of Heat and Mass Transfer, 1965. 8: p. 1261-1272.
3. Gardon, R. and J.C. Akfirat, Heat Transfer Characteristics of
Impinging Two-Dimensional Air Jets. Journal of Heat Transfer,
1966. 88(1): p. 101-107.
4. Popiel, C.O. and Boguslawski, L. Effect of Flow Structure on the
heat or mass transfer on a Flat plate in Impinging Round jet. in
2nd UK National Conf. on Heat Transfer. 1988.
5. Lee, J. and S.J. Lee, The effect of nozzle configuration on
stagnation region heat transfer enhancement of axisymmetric jet
impingement. international Journal of Heat and Mass Transfer,
2000. 43: p. 3497-3509.
6. Kataoka, K. and Mizushina, T. Local enhancement of the rate of
heat-transfer in an impinging round jet by free-stream turbulence.
in Heat transfer 1974; Proceedings of the Fifth International
Conference, Tokyo, Volume 2. 1974. Tokyo.
7. Violato, D., et al., Three-dimensional vortex dynamics and
convective heat transfer in circular and chevron impinging jets.
International Journal of Heat and Fluid Flow, 2012. 37: p. 22–36.
8. Roux, S., et al., Experimental investigation of the flow and heat
transfer of an impinging jet under acoustic excitation.
international Journal of Heat and Mass Transfer, 2011. 54: p.
3277–3290.
9. Lytle, D. and B.W. Webb, Air jet impingement heat transfer at
low nozzle-plate spacings. international Journal of Heat and Mass
Transfer, 1994. 37(12): p. 1687-1697.
10. Hadziabdic, M. and K. Hanjalic, Vortical structures and heat
transfer in a round impinging jet. Journal of Fluid Mechanics,
2008. 596: p. 221-260.
11. Kataoka, K., et al., Mass transfer between a plane surface and an
impinging turbulent jet: the influence of surface-pressure
fluctuations. Journal of Fluid Mechanics, 1982. 119: p. 91-105.
12. Alekseenko, S.V. and D.M. Markovich, Electrodiffusion
diagnostics of wall shear stresses in impinging jet. Journal of
Applied Electrochemistry, 1994. 24: p. 626-631.
13. Phares, D.J., G.T. Smedley, and R.C. Flagan, The wall shear stress
produced by the normal impingement of a jet on a flat surface.
Journal of Fluid Mechanics, 2000. 418: p. 351-375.
14. Tummers, M.J., J. Jacobse, and S.G.J. Voorbrood, Turbulent flow
in the near field of a round impinging jet. international Journal of
Heat and Mass Transfer, 2011. 54: p. 4939–4948.
15. El-Hassan, M., et al., Experimental investigation of the wall shear
stress and the vortex dynamics in a circular impinging jet.
Experiments in Fluids, 2012. 52(6): p. 1475-1489.
16. Hall, J.W. and D. Ewing, On the dynamics of the large-scale
structures in round impinging jets. Journal of Fluid Mechanics,
2006. 555: p. 439-458.
17. Meslem, A., et al., Flow dynamics and mass transfer in impinging
circular jet at low Reynolds number. Comparison of convergent
and orifice nozzles. international Journal of Heat and Mass
Transfer, 2013. 67(0): p. 25-45.
18. Rajaratnam, N., Turbulent jets. 1976, Amsterdam, Netherlands:
Elsevier Scientific Publishing Company.
19. Kristiawan, M., et al., Wall shear rates and mass transfer in
impinging jets: Comparison of circular convergent and cross-
shaped orifice nozzles. international Journal of Heat and Mass
Transfer, 2012. 55: p. 282–293.
20. Reiss, L.P. and T.J. Hanratty, Measurement of instantaneous rates
of mass transfer to a small sink on a wall. AIChE Journal, 1962.
8(2): p. 245-247.
21. Sengupta, A. and P.P. Sarkar, Experimental measurement and
numerical simulation of an impinging jet with application to
thunderstorm microburst winds. Journal of Wind Engineering and
Industrial Aerodynamics, 2008. 96(3): p. 345-365.
22. Xu, Z. and H. Hangan, Scale, boundary and inlet condition effects
on impinging jets. Journal of Wind Engineering and Industrial
Aerodynamics, 2008. 96(12): p. 2383-2402.
Proceedings of the 2014 International Conference on Mechanics, Fluid Mechanics, Heat and Mass Transfer
ISBN: 978-1-61804-220-0 67