experimental investigation of electrothermal anti … word - ijsr123.pdf · experimental...
TRANSCRIPT

Indian J.Sci.Res.1(2) : 900-908, 2014
ISSN:2250-0138(Online)
ISSN : 0976-2876 (Print)
__________________________________ 1Corresponding author
EXPERIMENTAL INVESTIGATION OF ELECTROTHERMAL ANTI-ICING SYSTEM IN THE
GAS TURBINE AIR INLET SYSTEM
REZA TIRGAR
a, MOHSEN KHOSHBAYANI
b1, MOHSEN MOTAHARI NEZHAD
c
aDepartment of Mechanical engineering, Kashan branch, Islamic Azad University, Kashan, Iran.
bDepartment of Mechanical Engineering, Kashan branch, Islamic Azad University, Kashan, Iran.
cIran University of Science and Technology, Tehran, Iran.
ABSTRACT
In this study, a new method has been proposed for anti-icing of gas turbine inlet system. This method was examined by laboratory and
numerical study. In experimental study a device was designed and fabricated after sample replacement of an electro-thermal
system.Finally,usingFluent software, anumericalstudyhas been conductedonthe flow behavior. According to the results, the anti-icing system
presented by electrothermal method is efficient for anti-icing at the entrance of air inlet of gas turbines of gas compressor stations.
KEYWORDS: Anti-icing, Electrothermal method,Gas turbine, Numerical solution,Experimental study
Turbine performance and component service life
greatly depends on the ability of an air inlet system to reduce
or eliminate contaminants entering the system. If these
contaminants are not effectively removed, then fouling,
erosion, corrosion and compressor blades damage will be the
result (Goulding et al., 1990). Snow and ice crystals
agglomerate quickly in an intake and cause blockage of the
intake. The particle size in arctic environment varies from 0,01
µm to 10 µm(HILL, 2002). The ice on the blades can
deteriorate air aerodynamic in the passages. So it is possible to
experience an axial compressor flow stall and surge (Chappell
and Grabe, 1974). The ice accretion can also cause mechanical
damage to the compressor blades as a result of blades
vibrations. In extreme cases, ice can shed due to vibratory
and/or aerodynamic forces and the resulting impact of these
pieces of ice are the hazardous foreign object damage (FOD)
(Bagshaw, 1976).The primary aim for an icing protection
system is to prevent or limit ice accretion within the gas
turbine intake system. The complexities of inlet system for
stationary gas turbine applications often limit the possibility of
guaranteeing free icing inlet system. Electrothermal system
consists of resistance wires are imbedded in rubber pads which
are mounted on the icing surface which has to be protected
(Chappell et al., 1974). This systems advantage is that it only
heats the icing points (Chappell et al., 1974). However, it
requires the exact critical points where ice can form. Since the
ice forming process is very complex, it is difficult to
determine these critical points. Therefore more than one
electrical heater can be used to cover up all these points. B.F.
Goodrich has developed an electrothermal system for the rotor
blades of the Army Apache AH-64 helicopter. Electrothermal
system consists of a source of electrically generated heat and a
control system. The system pulverizes ice into small particles
and removes layers of ice as thin as frost or as thick as an inch
of glaze ice.Hongchang Electric Heater Products Factory,
which has established in 1996, introduced heating components
which are made of metal electrothermal film (Hamilton
Sundstrand.,2006).In this research, we have studied changes in
air temperature after entrance the channel and tried to reach to
the ideal temperature for entering to axial compressor in a
range of (5°c -10°c). the aim of this research is to study
experimentally the anti-icing system by electrothermal method
at the channel inlet air.
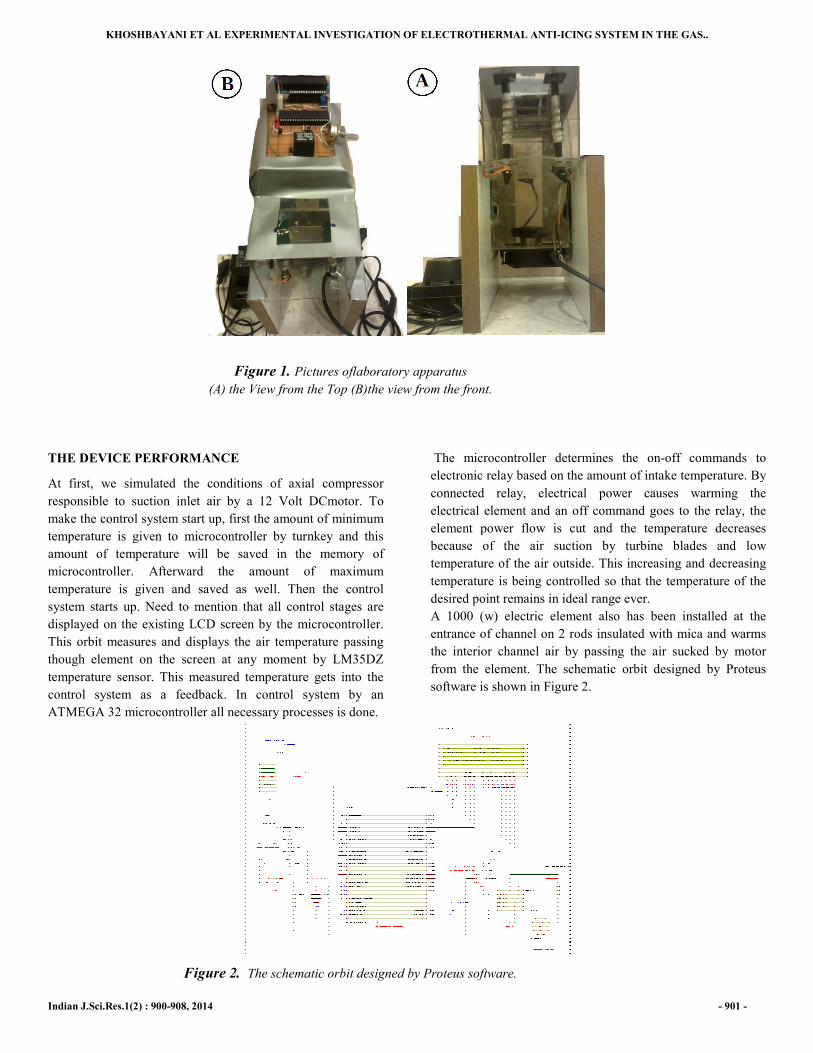
EXPERIMENTAL SETUP
We used three sciences, mechanical engineering,
materials engineering and electrical engineering in
construction of the device. In this device, the temperature of
the desired location is measured by temperature sensors and
then a switching command goes to electronic relay by a
microcontroller. Connecting the relay the power reaches to
electric element practically and turns it on and warms the
channel interior environment. Next, whenever the temperature
of the location increases to an especial point, a power cut
command goes to the relay. There are some pictures of this
device in Figure 1.
In general, with this system, the temperature of the desired
area can be controlled and fixed between desired minimum
temperature and desired maximum temperature. This will
include the following results:
a) Prevents practically of freezing air molecules inside
the channel and before the turbine blades.
b) The temperature of desired area can be controlled and
stabilized.
c) If the turbine has the best performance for a certain
amount of inlet temperature, that temperature is achievable
under control.
KHOSHBAYANI ET AL EXPERIMENTAL INVESTIGATION OF ELECTROTHERMAL ANTI
Indian J.Sci.Res.1(2) : 900-908, 2014
Figure 1. Pictures oflaboratory apparatus
(A) the View from the Top (B)the view from
THE DEVICE PERFORMANCE
At first, we simulated the conditions of axial compressor
responsible to suction inlet air by a 12 Volt DC
make the control system start up, first the amount of minimum
temperature is given to microcontroller by turnkey and this
amount of temperature will be saved in the memory of
microcontroller. Afterward the amount of maximum
temperature is given and saved as well. Then the control
system starts up. Need to mention that all control s
displayed on the existing LCD screen by the microcontroller.
This orbit measures and displays the air temperature passing
though element on the screen at any moment by LM35DZ
temperature sensor. This measured temperature gets into the
control system as a feedback. In control system by an
ATMEGA 32 microcontroller all necessary processes
Figure 2. The schematic orbit designed by Proteus software.
EXPERIMENTAL INVESTIGATION OF ELECTROTHERMAL ANTI-ICING SYSTEM IN THE GAS..
Pictures oflaboratory apparatus
the View from the Top (B)the view from the front.
At first, we simulated the conditions of axial compressor
olt DCmotor. To
make the control system start up, first the amount of minimum
given to microcontroller by turnkey and this
amount of temperature will be saved in the memory of
microcontroller. Afterward the amount of maximum
temperature is given and saved as well. Then the control
system starts up. Need to mention that all control stages are
displayed on the existing LCD screen by the microcontroller.
This orbit measures and displays the air temperature passing
though element on the screen at any moment by LM35DZ
temperature sensor. This measured temperature gets into the
tem as a feedback. In control system by an
ATMEGA 32 microcontroller all necessary processes is done.
The microcontroller determines the on
electronic relay based on the amount of intake temperature. By
connected relay, electrical power ca
electrical element and an off command goes to the relay, the
element power flow is cut and the temperature decreases
because of the air suction by turbine blades and low
temperature of the air outside. This increasing and decreasing
temperature is being controlled so that the temperature of the
desired point remains in ideal range ever.
A 1000 (w) electric element also has been installed at the
entrance of channel on 2 rods insulated with mica and warms
the interior channel air by passing t
from the element. The schematic orbit designed by Proteus
software is shown in Figure 2.
The schematic orbit designed by Proteus software.
ICING SYSTEM IN THE GAS..
- 901 -
The microcontroller determines the on-off commands to
electronic relay based on the amount of intake temperature. By
connected relay, electrical power causes warming the
electrical element and an off command goes to the relay, the
element power flow is cut and the temperature decreases
because of the air suction by turbine blades and low
This increasing and decreasing
ature is being controlled so that the temperature of the
desired point remains in ideal range ever.
electric element also has been installed at the
entrance of channel on 2 rods insulated with mica and warms
the interior channel air by passing the air sucked by motor
from the element. The schematic orbit designed by Proteus

KHOSHBAYANI ET AL EXPERIMENTAL INVESTIGATION OF ELECTROTHERMAL ANTI-ICING SYSTEM IN THE GAS..
Indian J.Sci.Res.1(2) : 900-908, 2014 - 902 -
TECHNICAL NOTES OF THE ORBIT
a) The bobbin of electronical relay used in this orbit is induced
with 5 volt and is able to connect or disconnect 240 volts AC
up to 7 amper. To setup the relay, we used a NPN transistor as
stream buffer since the micro is unable to transmit the power
flow. If the micro commands connection, the interface
transistor is responsible to delivering the power flow to the
bobbin of the relay and makes the relay actuated to pass the
electricity to electrical element. Since bobbin of the relay is a
salafi load, so a reverse parallel diode has been used to avoid
flow impact. The following orbit has been used to setup bobbin via microcontroller (Fig.3).
Figure 3. Relay driver circuit microcontroller
b) LCD is connected to PORTC and various control stages are
displayed.
c) LM35DZ thermal sensor has incremental coefficient of 10 (
mv
c°) (10 millivolts per degree rise).
d) The amount of analog voltage resulting from thermal sensor
LM35DZ enters into the micro by PORTA and turns to
comprehensible digital content for microcontroller with the
help of a 10 bit ADC converter.
e) The software CodeVision AVR has been used to
programming the microcontroller and Proteus software for
simulating the desired schematic orbit.
Study the Experimental Results
In this section we are going to compare the results of
experimental testings with the results of Matlab and Fluent
softwares. In experimental conditions we can get the function
curve by checking and recording the machine output data
visible on the monitor, and also recording the related times.
Based on Matlab outputs, the system function graph and based
on Fluent outputs, the contour and the temperature graph are
achievable. Characteristics required for study are given in
Table 1.
Table 1. Characteristics required for study
Character Amount
Ain 25(cm) ×25(cm)
Lenght 50(cm)
Vin 7(m/s)
Pin 101325(pa)
Tin -4(G c)
ρair 1.225(kg/m3)
Inlet air with (-4°c)
In this section, using various recorded temperatures and the
related times,we can draw the air heating curve that enters
anti-icing system with -4 (°c) temperature. As shown in the
Figure 4, due to heat transfer from the elements to inlet air,
during 83 seconds the temperature reaches to +5(°c) and after
184 seconds will reaches to +10(°c). now the heating source
turns off temperature decreases to -4(°c) after 440(s).

KHOSHBAYANI ET AL EXPERIMENTAL INVESTIGATION OF ELECTROTHERMAL ANTI
Indian J.Sci.Res.1(2) : 900-908, 2014
Figure 4.
According to the Figure 5 and the results of the code writing in
Matlab, the sensor of the entrance channel of the turbine
shows -4(°c) temperature on the monitor. As a result, the
heating source turns on and starts to warming the cold inlet
air.After about 90(s) the temperature reaches to +5
color of the graph changes from blue to red so that shows
warming the air (as shown in Fig. 4). After 170
temperature reaches to +10(°c) that according to the study of
gas turbines used in pressure boosting station, including
Ziemence turbine, the ideal temperature for entering to the
Figure 5. The variation of inlet
0; -4
-6
-4
-2
0
2
4
6
8
10
12
0
Temperature(C)
0 50 100 150 200-4
-2
0
2
4
6
8
10
Temprature
( C)
Time(second)
Anti-Icing System
T( ) 4
57.228 (1 e )
t = − −
EXPERIMENTAL INVESTIGATION OF ELECTROTHERMAL ANTI-ICING SYSTEM IN THE GAS..
- c)
igure 5 and the results of the code writing in
Matlab, the sensor of the entrance channel of the turbine
temperature on the monitor. As a result, the
eating source turns on and starts to warming the cold inlet
the temperature reaches to +5(°c) and
color of the graph changes from blue to red so that shows
). After 170(s) the
that according to the study of
gas turbines used in pressure boosting station, including
Ziemence turbine, the ideal temperature for entering to the
axial compressor is also +10(°c). Thus the heating source turns
off by the microcontroller order an
again. During 270(s) the temperature again reaches to
+5(°c)After reaching a temperature of zero degrees Celsius,
heating elements turn on and cycle back to previous steps.
The following equation has been used to coding Matlab
software and then we attained different
temperature (°c) versus time (seconds) in static heat transfer
condition.
The variation of inlet - c)
83; 5
184, 10
261, 5
335; 0
440, -4
100 200 300 400 500
Time(second)
(1)4.575t
57.228
1000T( ) 4
57.228 (1 e )× −
ICING SYSTEM IN THE GAS..
- 903 -
. Thus the heating source turns
off by the microcontroller order and the temperature decreases
the temperature again reaches to
After reaching a temperature of zero degrees Celsius,
heating elements turn on and cycle back to previous steps.
The following equation has been used to coding Matlab
and then we attained different diagram of
temperature (°c) versus time (seconds) in static heat transfer
(1)

KHOSHBAYANI ET AL EXPERIMENTAL INVESTIGATION OF ELECTROTHERMAL ANTI-ICING SYSTEM IN THE GAS..
Indian J.Sci.Res.1(2) : 900-908, 2014 - 904 -
( ) ( )0
∂ ∂∂+ + =
∂ ∂ ∂
ρu ρvρ
t x y
Equations of Fluid flow
1.1. Mass conservation
The first law governing the fluid particle is Mass Conservation Law. Considering the mass balance for a fluid element, this law can
be explained so that the net rate of inlet mass flow to the fluid element should be equal to the rate of mass increasing in the fluid
element. It means with considering a fluid element we can write:
In the above equation, U is speed vector, u and v are components of speed vector and ρ is fluid density.
1.2. Momentum Equation
Newton’s second law expresses that the rate of momentum change of a fluid particle is equal to the resultant exerted forces.
Considering a fluid particle, the momentum equations can be shown like this.
( ) ∂∂ − += + +
∂ ∂yxxx
Mx
Du
Dt
τp τρ S
x y
( )
∂ − + ∂= + +
∂ ∂yy xy
My
Dv
Dt
p τ τρ S
y x In the above equations, p is pressure, ��� is body forces , and ��� is viscosity.
1.3. Energy Equation
The energy equation comes from the first thermodynamic law,
expresses that the rate of fluid particle energy changings is
equal to the sum of the heattransfer rate applied to the fluid
particle and the rate of work done on the fluid particle. This
equation is being presented as follow:
( ) ( ) ( ) ( ) ( )( )( ).
∂ ∂ ∂∂=− + + + + + +
∂ ∂ ∂ ∂yx xy yyxx
E
DE
Dt
uτ vτ vτuτρ div pU div k grad T S
x y x y
( )2 21
2= + +E i u v
The term SE defined as gravitational potential source and i as
internal energy.
1.4. Modeling Turbulence
In all applied streams of engineering, in low Reynolds
numbers, the stream is like layers and turns to turbulent mode
from quiet mode by transition from a specific Reynolds
number. In turbulent mode, each optional parameter φ can be
considered as a combination of permanent mean values φ and
fluctuant component φG.
a. Continuity equation
( ) 0∂
+ =∂ρdiv ρU
t
( ) 0∂
+ =∂
ρdiv ρU
t
(2)
(3)
(4)
(5)
(6)
(7)
(8)

KHOSHBAYANI ET AL EXPERIMENTAL INVESTIGATION OF ELECTROTHERMAL ANTI-ICING SYSTEM IN THE GAS..
Indian J.Sci.Res.1(2) : 900-908, 2014 - 905 -
b. Reynold transport equation
( ) ( ) ( )( )( ) ( )'2 ' '
.
∂ ∂∂ ∂ + = − + + − − + ∂ ∂ ∂ ∂
Mx
ρu ρuvρu pdiv ρuU div µ grad u S
t x x y
( ) ( ) ( )( )( ) ( )'2 ' '
. ∂ ∂∂ ∂
+ = − + + − − +∂ ∂ ∂ ∂
My
ρv ρu vρv pdiv ρvU div µ grad v S
t x y x
c. Scalar transport equation
( ) ( ) ( )( )( ) ( )' ' ' '
. ∂ ∂∂
+ = + − − +∂ ∂ ∂
Φ Φ
Φ ΦΦΦ Γ Φ
ρu ρvρdiv ρ U div grad S
t x y
d. Selecting model k-ω
RANS equations show the transfer just only for streams
quantities with all irregular flows scales. the method RAN has
been applied in most CFD calculations to calculate the
turbulent models like the standard k-ω model and its variants ,
the standard k- ε and its variants, and Reynolds stress model
(RSM) .
The standard k-ω model is based on transfer equations for the
kinetic energy (k) and irregular frequnce(ω) (Wilcox, 1988).
The most important weak of the k–ω model is its high
sensitivity to free flow conditions (Stamou and Katsiris, 2006).
SST model merges k–ε and k–ω models by using a synthesizer
(combiner)function (Menter, 1994). SST model activates the
k–ω model in the region close to the wall and k–ε model for
the rest of the flow. By this method, interesting near the wall
performance of k–ω model is used without its probability of
error due to its sensitivity to free flow. In recent assessment,
SST k–ω model has been used to simulate the temperature
inside the channel.
1.5. The geometry and boundary conditions
the geometry and boundary conditions of the question as
shown in figure 6, we installed six element 1000 Watt in the
channel opening to create a geometry similar to geometry of
the real system. 7803 cells have been created in the mesh
networks of this geometry. We considered the length and
width of the entrance that has square cross section and selected
the channel length of 50 (cm).
Figure 6. Mesh geometry
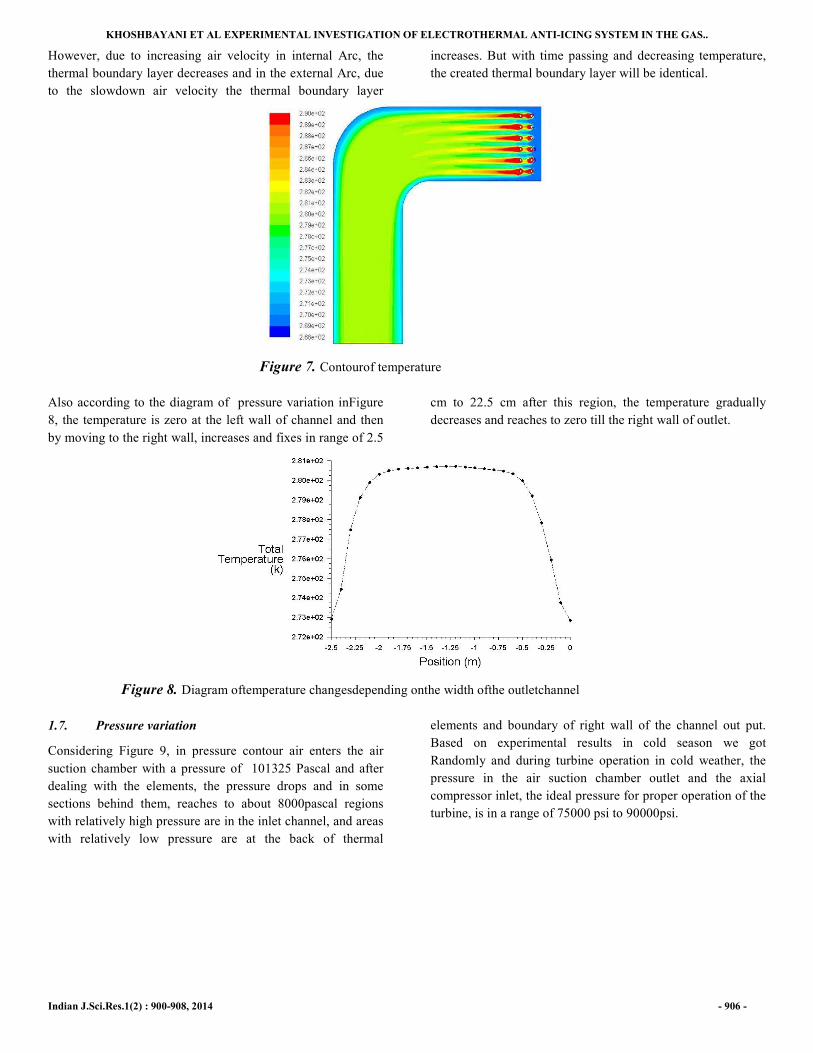
1.6. Temperature variation
According to Figure7, cold air containing ice crystal particles,
enters to the air suction chamber with 7 (m/s) speed and
269(k) temperature and after the crossing the power flow from
the elements reaches to its highest temperature of 290(k) equal
to 17(Gc). With time passing and getting the power flow away
from the elements air temperature will gradually warm,
decrease and stand in range of 278(k) to 284(k). After flowing
through the gooseneck and exit channel and reach the axial
compressor , the temperature reaches to almost constant
amount of 280(k). that is very close to the outlet air
temperature of the simulated system in previous section the
outlet air temperature of the simulated system in previous
section and is the ideal temperature. Significant note in this
contour is forming boundary layer in the inner wall of the
channel due to temperature gradients from heat exchange
process between the fluid and the wall. Speed is zero at the
wall and the heat transfer into the fluid occurs by conduction.
(9)
(10)
(11)
KHOSHBAYANI ET AL EXPERIMENTAL INVESTIGATION OF ELECTROTHERMAL ANTI-ICING SYSTEM IN THE GAS..
Indian J.Sci.Res.1(2) : 900-908, 2014 - 906 -
However, due to increasing air velocity in internal Arc, the
thermal boundary layer decreases and in the external Arc, due
to the slowdown air velocity the thermal boundary layer
increases. But with time passing and decreasing temperature,
the created thermal boundary layer will be identical.
Figure 7. Contourof temperature
Also according to the diagram of pressure variation inFigure
8, the temperature is zero at the left wall of channel and then
by moving to the right wall, increases and fixes in range of 2.5
cm to 22.5 cm after this region, the temperature gradually
decreases and reaches to zero till the right wall of outlet.
Figure 8. Diagram oftemperature changesdepending onthe width ofthe outletchannel
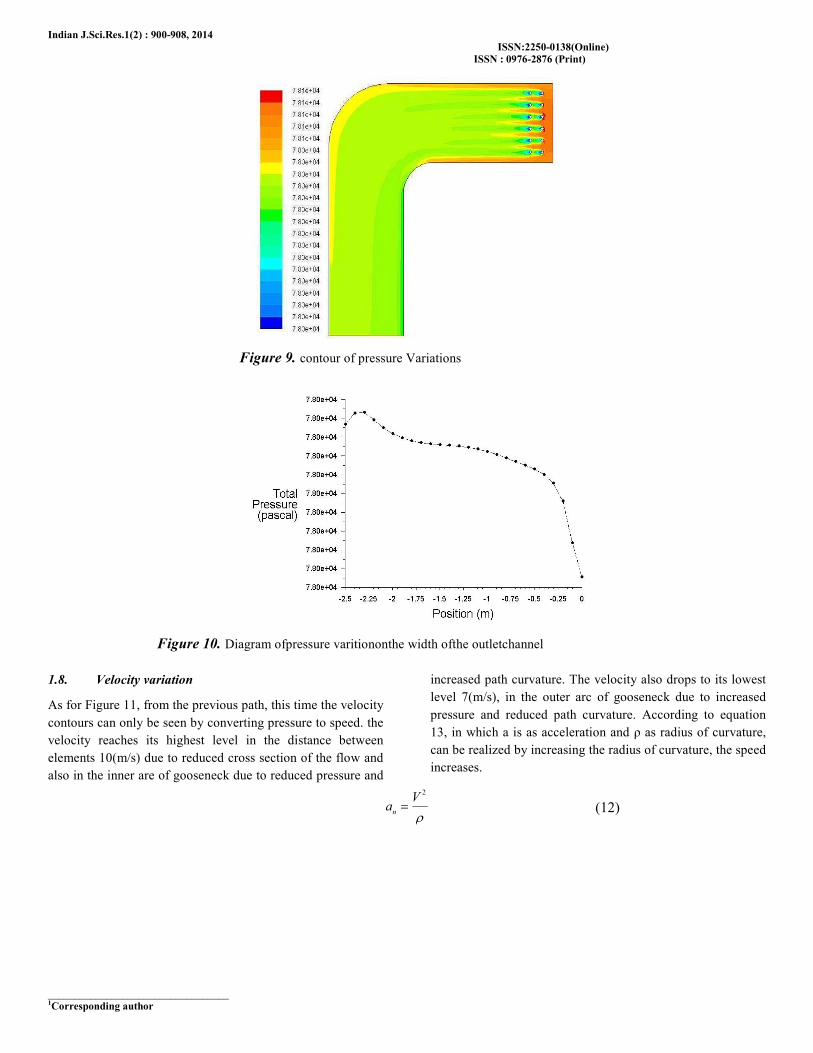
1.7. Pressure variation
Considering Figure 9, in pressure contour air enters the air
suction chamber with a pressure of 101325 Pascal and after
dealing with the elements, the pressure drops and in some
sections behind them, reaches to about 8000pascal regions
with relatively high pressure are in the inlet channel, and areas
with relatively low pressure are at the back of thermal
elements and boundary of right wall of the channel out put.
Based on experimental results in cold season we got
Randomly and during turbine operation in cold weather, the
pressure in the air suction chamber outlet and the axial
compressor inlet, the ideal pressure for proper operation of the
turbine, is in a range of 75000 psi to 90000psi.
Indian J.Sci.Res.1(2) : 900-908, 2014
ISSN:2250-0138(Online)
ISSN : 0976-2876 (Print)
__________________________________ 1Corresponding author
Figure 9. contour of pressure Variations
Figure 10. Diagram ofpressure varitiononthe width ofthe outletchannel
1.8. Velocity variation
As for Figure 11, from the previous path, this time the velocity
contours can only be seen by converting pressure to speed. the
velocity reaches its highest level in the distance between
elements 10(m/s) due to reduced cross section of the flow and
also in the inner are of gooseneck due to reduced pressure and
increased path curvature. The velocity also drops to its lowest
level 7(m/s), in the outer arc of gooseneck due to increased
pressure and reduced path curvature. According to equation
13, in which a is as acceleration and ρ as radius of curvature,
can be realized by increasing the radius of curvature, the speed
increases.
2
n
Va
ρ=
(12)

KHOSHBAYANI ET AL EXPERIMENTAL INVESTIGATION OF ELECTROTHERMAL ANTI
Indian J.Sci.Res.1(2) : 900-908, 2014
Figure 11.
Figure 12, shows the changes of air velocity vector inside the channel. As shown , the air velocity
amount in the outer are of the channel and the maximum amount in the inner arc of the channel.
Figure 12.
In Figure 13, the air velocity is zero in right and left walls of the channel outlet and in the middle of that, the
constant.
EXPERIMENTAL INVESTIGATION OF ELECTROTHERMAL ANTI-ICING SYSTEM IN THE GAS..
Contour of velocity variation
Figure 12, shows the changes of air velocity vector inside the channel. As shown , the air velocity vector has the minimum (smallest)
amount in the outer are of the channel and the maximum amount in the inner arc of the channel.
Contour of velocity variation
igure 13, the air velocity is zero in right and left walls of the channel outlet and in the middle of that, the
ICING SYSTEM IN THE GAS..
- 908 -
vector has the minimum (smallest)
igure 13, the air velocity is zero in right and left walls of the channel outlet and in the middle of that, the velocity is relatively

KHOSHBAYANI ET AL EXPERIMENTAL INVESTIGATION OF ELECTROTHERMAL ANTI-ICING SYSTEM IN THE GAS..
Indian J.Sci.Res.1(2) : 900-908, 2014 - 909 -
Figure 13. Diagram ofvelocity variation onthe width Ofthe outletchannel
CONCLUSIONS AND SUMMARY
In this study, a new method presented for anti-icing the
incoming cold air into air suction chamber of Gas turbines.
According to the novelty of the idea and absence of a similar
system for studying, we built up a laboratory simulation
system for experimental study and numerical solution. Based
on the results, this method is efficient for defrost cold air
entering the suction chamber of Gas turbines and suggested as
an appropriate method. However, to achieve optimal
arrangement of elements needs more study.
ACKNOWLEDGMENT
The authors consider the necessity to gratitude of Islamic
Azad University of kashan and also the national Iranian
Gas company due to their support and assistance in
carrying out this research.
REFERENCES
Goulding,C.H., Rasmussen, M.G., Fritz, F.M.; 1990.
Technical and Other Considerations for the Selection of Inlet
Air Filtration Systems for High-Efficiency Industrial
Combustion Turbines, ASME, 90-GT-176, Presented at the
Gas Turbine and Aeroengine Congress and Exposition.
HILL, D.G.T.; 2002. Gas Turbine Intake Systems in Unusual
Environments, ASME, 73-GT-38.
Chappell,M.S., Grabe,W.; 1974. Icing Problems on Stationary
Gas Turbine Powerplants, ASME.
Bagshaw, K.w.; 1976. Icing Problems-Review of Simulated
Ice Ingestion Tests, ASME, n76-GT-128.
Chappell, M. S. &Grabe, W.; 1974. Icing Problems on
Stationary Gas Turbine Powerplants, ASME.
Hamilton Sundstrand.; 2006. Ice Protection Control Systems,
A United Technologies Company, Dynamic Controls.
Wilcox DC.; 1988. Reassessment of the scale determining
equation for advanced turbulence models. AIAA Journal
26(11):1299–311.
Stamou, A., & Katsiris, I.; 2006. Verification of a CFD model
for indoor airflow and heat transfer. Building and
environment, 41(9): 1171-1181.
Menter, F. R.; 1994. Two-equation eddy-viscosity turbulence
models for engineering applications. AIAA journal, 32(8),
1598-1605.