experimental evaluation of compost leachates · experimental evaluation of ... each new storm...
TRANSCRIPT

September 2015Markus Flury Jessica M. Mullane Maninder K. Chahal Craig G. Cogger
WA-RD 848.1
Office of Research & Library Services
WSDOT Research Report
Experimental Evaluation of Compost Leachates
Experimental Evaluation of
Compost Leachates
---
Markus Flury, Jessica M. Mullane, Maninder K. Chahal, Craig G. Cogger
Department of Crop and Soil Sciences Washington State University
2606 W Pioneer Puyallup, WA, 98371
Report prepared for the Washington State Department of Transportation
Lynn Peterson, Secretary
September 25, 2015

TECHNICAL REPORT STANDARD TITLE PAGE 1. REPORT NO. 2. GOVERNMENT ACCESSION NO. 3. RECIPIENTS CATALOG NO
WA-RD 848.1
4. TITLE AND SUBTILLE 5. REPORT DATE Experimental Evaluation of Compost Leachates September 25, 2015
6. PERFORMING ORGANIZATION CODE
7. AUTHOR(S) 8. PERFORMING ORGANIZATION REPORT NO. Markus Flury, Jessica Mullane, Maninder Chahal, Craig Cogger
9. PERFORMING ORGANIZATION NAME AND ADDRESS 10. WORK UNIT NO. Department of Crop and Soil Sciences Washington State University Puyallup, WA 98371
11. CONTRACT OR GRANT NO.
T1462-03 12. SPONSORING AGENCY NAME AND ADDRESS 13. TYPE OF REPORT AND PERIOD COVERED Washington State Department of Transportation Research Office PO Box 47372 Olympia WA 98504-7372
14. SPONSORING AGENCY CODE
15. SUPPLEMENTARY NOTES This study was conducted in cooperation with the U.S. Department of Transportation, Federal Highway Administration. 16. ABSTRACT Compost is often used in raingardens, roadsides, and bioretention systems, not only because of its beneficial properties on soil quality, but also because compost improves water infiltration and retains stormwater contaminants. However, when compost is freshly applied, materials from compost can leach out when rain or stormwater seep through compost or compost-amended bioretention media. The goal of this research project was to experimentally evaluate and characterize leachates from compost. We quantified and characterized the leachate composition of compost following intermittent, simulated storm events. We used municipal compost of different ages and different source materials. Compost was filled into columns and then irrigated with deionized water and stormwater. Stormwater was spiked with copper to increase copper concentrations. Six-month, 24-hour rain storms were applied every two weeks for a total of up to 18 rain storms. Outflow was analyzed for pH, electrical conductivity (EC), particulate concentration, surface tension, dissolved organic carbon (DOC), nitrogen, phosphorus, and copper. Particulate and dissolved organic matter was further characterized for molecular structure by Nuclear Magnetic Resonance (NMR) and Fourier-Transformed Infrared (FTIR) Spectroscopy. Our results showed that concentrations of dissolved and particulate organic carbon and electrical conductivity in the leachate where high at the onset of each storm, but decreased as the storm progressed. However, each new storm released another peak of constituents. Leaching from mature compost was less a function of age and type, but more a function of number and frequency of storms and leaching history. Concentrations of nitrogen, phosphorus, and copper
were high in the initial few storms, and then decreased. Only a small fraction (3%) of the copper present in the compost leached out, but nonetheless, the copper concentrations in the leachate remained above the regulatory waste discharge standards. NMR and FTIR analyses revealed that dissolved organic carbon consisted mainly of aliphatic and aromatic components typical of fulvic and humic acids. Our results show that municipal compost can serve as a sustained source of leaching of nutrients and metals, regardless of compost age and source. However, the copper concentrations observed in our experiment are likely not toxic due to the presence of elevated DOC, as DOC readily forms complexes with dissolved copper thereby reducing its toxicity to aquatic organisms. The DOC plays a dual role in terms of copper fate and transport: DOC can enhance leaching of copper by forming aqueous complexes, but at the same time, reduces toxicity of copper because copper-DOC complexes are less bioavailable. 17. KEY WORDS 18. DISTRIBUTION STATEMENT Compost, leaching, nitrate, phosphorus, copper 19. SECURITY CLASSIF. (of this report) 20. SECURITY CLASSIF. (of this page) 21. NO. OF PAGES 22. PRICE None None
ii
Disclaimer The contents of this report reflect the views of the authors, who are responsible for the facts
and the accuracy of the data presented herein. The contents do not necessarily reflect the
official views or policies of the Washington State Department of Transportation. This report
does not constitute a standard, specification or regulation.
Note The content of this report is part of the MS thesis of Jessica Mullane (WSU 2015) and the
PhD dissertation of Maninder Chahal (WSU 2015). Parts of the material in this report have
been published as a scientific paper [Mullane et al., 2015], and other parts are being prepared
for publication as a scientific paper.
Contents
List of Tables vi
List of Figures vii
Executive Summary 1
1 Introduction 3
1.1 Background . . . . . . . . . . . . . . . . . . . . . . . . . . . . . . . . . . . 3
1.2 Objectives . . . . . . . . . . . . . . . . . . . . . . . . . . . . . . . . . . . . 5
2 Review of Previous Work 6
3 Research Approach/Procedures 7
3.1 Experimental Tests . . . . . . . . . . . . . . . . . . . . . . . . . . . . . . . . 7
3.2 Compost Material and Characterization . . . . . . . . . . . . . . . . . . . . . 7
3.3 Experimental Setup . . . . . . . . . . . . . . . . . . . . . . . . . . . . . . . 9
3.3.1 Experimental Setup with two Composts of Different Age . . . . . . 9
3.3.2 Experimental Setup with two Composts of Different Type . . . . . 10
3.4 Column Leaching Experiments . . . . . . . . . . . . . . . . . . . . . . . . . 12
3.5 Leachate Characterization . . . . . . . . . . . . . . . . . . . . . . . . . . . 13
3.6 Chemical Speciation Modeling . . . . . . . . . . . . . . . . . . . . . . . . . . 17
3.7 Statistical Analysis . . . . . . . . . . . . . . . . . . . . . . . . . . . . . . . 18
4 Findings/Discussion 19
4.1 Compost Characteristics . . . . . . . . . . . . . . . . . . . . . . . . . . . . 19
4.2 13C-Nuclear Magnetic Resonance (NMR) and Fourier Transform Infrared
Spectroscopy (FTIR) . . . . . . . . . . . . . . . . . . . . . . . . . . . . . . 22
iii
4.3 Dynamics of pH, Dissolved Organic Carbon, and Electrical Conductivity in
Leachate . . . . . . . . . . . . . . . . . . . . . . . . . . . . . . . . . . . . . 25
4.4 1H-Nuclear Magnetic Resonance (NMR) and Fourier Transform Infrared
Spectroscopy (FTIR) of Leachate . . . . . . . . . . . . . . . . . . . . . . . 29
4.5 Nitrogen, Phosphorus, and Copper Dynamics . . . . . . . . . . . . . . . . . . 31
4.6 Mass Balance of C, N, P, and Cu . . . . . . . . . . . . . . . . . . . . . . . 36
4.7 Copper Speciation Modeling . . . . . . . . . . . . . . . . . . . . . . . . . . 40
5 Conclusions 42
6 Recommendations/Applications/Implementation 43
7 References 45
A Appendix A A1
B Appendix B A2
iv

List of Tables
Table 1 Chemical constituents of the stormwater used in the experiments. . 12
Table 2 Analytical methods used for chemical analyses. . . . . . . . . . . . . 16
Table 3 Chemical characteristics of the 6- and 24-month old Cedar Grove
compost at the beginning and the end of the leaching experiments. . 20
Table 4 Chemical composition of Royal Classics and Silver Springs composts
used in the experiment. . . . . . . . . . . . . . . . . . . . . . . . . . . 21
Table 5 Mass balance of C, N, P, and Cu from the 6- and 24-month old Cedar
Grove compost for the experiments using deionized water as influent.
Data represent percentages of material leached compared with initial
content. The percentages listed for each compost represent an average
and standard deviation of three replicates. . . . . . . . . . . . . . . . . 37
Table 6 Mass balance of C, N, P, and Cu in the two compost-amended biore-
tention systems (Royal Classics and Silver Springs). Percentage data
shows the amounts of constituents leached as percentage of constituents
in the compost and stormwater inflow. . . . . . . . . . . . . . . . . . 39
v
List of Figures
Figure 1 Photos of experiment components. a: compost material collection; b:
experimental column setup; c: close-up of 6-month compost; and d:
close-up of 24-month compost. . . . . . . . . . . . . . . . . . . . . . . 10
Figure 2 Bioretention soil mix used in the experiment. (A) Silver Springs com-
post; (B) Royal Classics compost; (C) coarse sand; (D) bioretention
mix after mixing compost with sand at a 40:60 volume ratio (Silver
Springs compost). . . . . . . . . . . . . . . . . . . . . . . . . . . . . . 11
Figure 3 13C-NMR spectra from (a) 6-month and (b) 24-month old Cedar Grove
compost. . . . . . . . . . . . . . . . . . . . . . . . . . . . . . . . . . . 23
Figure 4 13FTIR transmittance spectra from (a) 6-month and (b) 24-month old
Cedar Grove compost. . . . . . . . . . . . . . . . . . . . . . . . . . . 23
Figure 5 Dynamics of leachate from 6-month (left column) and 24-month old
Cedar Grove compost (right column). (a) pH, (b) electrical conductivity
(EC), (c) dissolved organic carbon (DOC), (d) surface tension. Distinct
peaks visible in EC and DOC coincide with the initiation of a new storm. 26
Figure 6 Dynamics of particulate leaching from 6-month (left column) and 24-
month (right column) old Cedar Grove compost. (a) particulate fraction
> 11 µm, (b) particulate fraction 1 − 11 µm, (c) particulate fraction
0.45 − 1 µm. Distinct peaks coincide with the initiation of a new storm. 28
Figure 7 1H-NMR spectra from 6-months (left) and 24-months (right) old Cedar
Grove compost for hourly intervals during the initial storm. Spectra
are offset for clarity. . . . . . . . . . . . . . . . . . . . . . . . . . . . 29
Figure 8 FTIR spectra from 6-month and 24-month old compost leachate. . . . 31
vi
Figure 9 Concentrations of nitrogen, phosphorus, and copper in the leachate
from 6-month and 24-month old Cedar Grove compost for successive
storms using deionized water as the influent. In the later part of the
experiment, not all storms were analyzed, as indicated by the gaps in
the storm number sequence. Significant differences between 6-month
and 24-month old compost are denoted by an asterisk (p = 0.05). Error
bars represent ± one standard deviation. . . . . . . . . . . . . . . . . 32
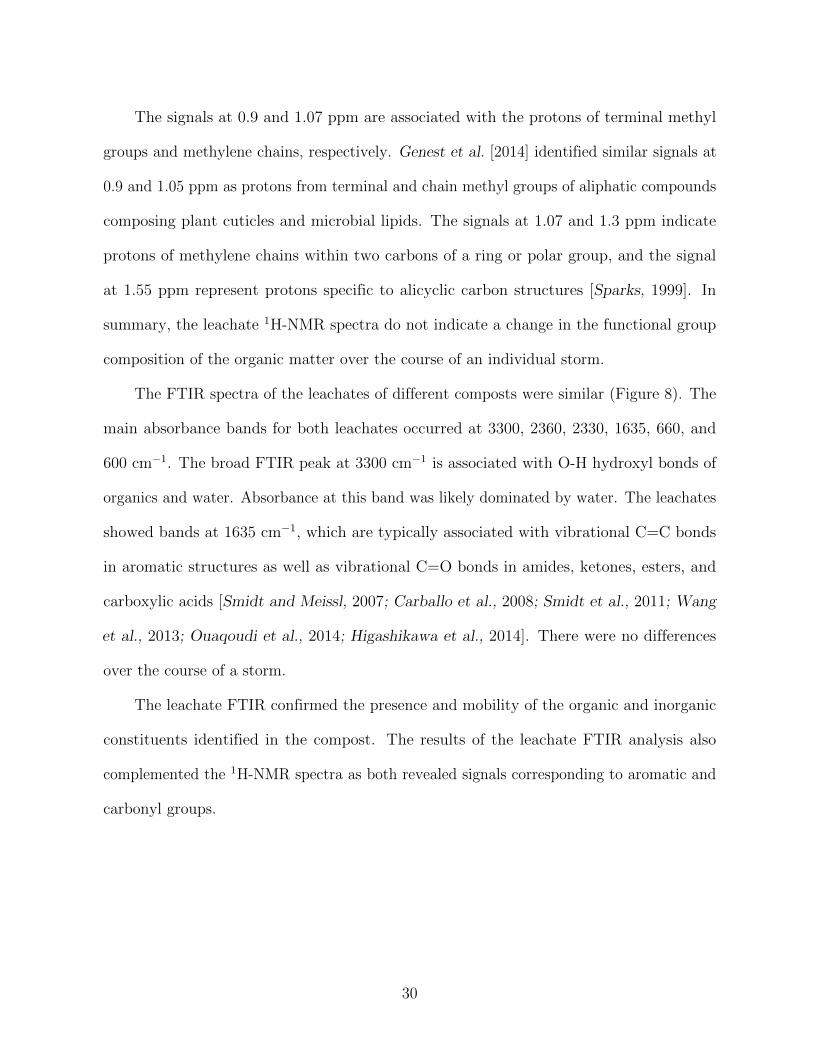
Figure 10 Nutrient and trace metal concentrations in composite samples for suc-
cessive storms from Royal Organic and Silver Springs composts using
copper-spiked stormwater as the influent. Horizontal black lines indicate
the nutrient and trace metal concentration in the influent stormwater. 33
Figure 11 Correlation of dissolved copper with DOC in 6-month and 24-month old
Cedar Grove compost using deionized water as influent. The bracketed
data are considered outliers and were excluded from the linear regression. 36
Figure 12 Copper speciation modeling. (A) Species distribution of copper versus
the amounts of DOC (mg/L) in solution at pH = 7, (B) Species
distribution of total inorganic and total organically complexed copper
at two DOC concentrations (0.1 and 100 mg/L) versus solution pH. . 41
vii
Executive Summary
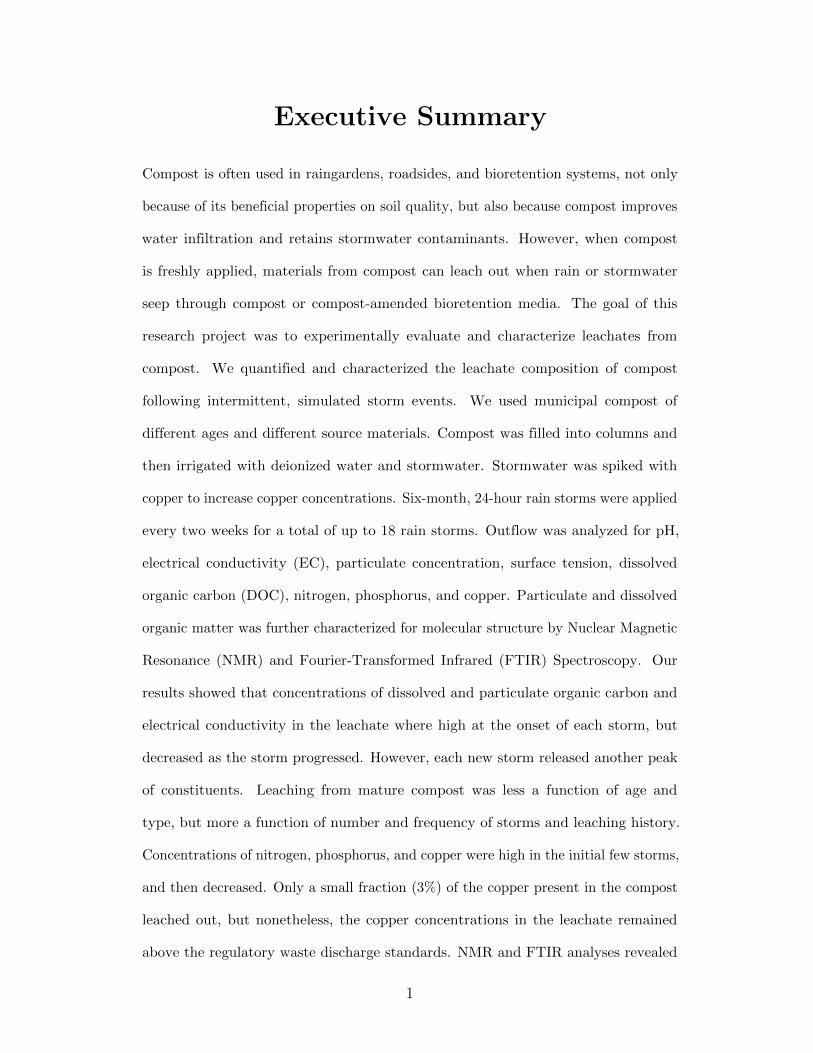
Compost is often used in raingardens, roadsides, and bioretention systems, not only
because of its beneficial properties on soil quality, but also because compost improves
water infiltration and retains stormwater contaminants. However, when compost
is freshly applied, materials from compost can leach out when rain or stormwater
seep through compost or compost-amended bioretention media. The goal of this
research project was to experimentally evaluate and characterize leachates from
compost. We quantified and characterized the leachate composition of compost
following intermittent, simulated storm events. We used municipal compost of
different ages and different source materials. Compost was filled into columns and
then irrigated with deionized water and stormwater. Stormwater was spiked with
copper to increase copper concentrations. Six-month, 24-hour rain storms were applied
every two weeks for a total of up to 18 rain storms. Outflow was analyzed for pH,
electrical conductivity (EC), particulate concentration, surface tension, dissolved
organic carbon (DOC), nitrogen, phosphorus, and copper. Particulate and dissolved
organic matter was further characterized for molecular structure by Nuclear Magnetic
Resonance (NMR) and Fourier-Transformed Infrared (FTIR) Spectroscopy. Our
results showed that concentrations of dissolved and particulate organic carbon and
electrical conductivity in the leachate where high at the onset of each storm, but
decreased as the storm progressed. However, each new storm released another peak
of constituents. Leaching from mature compost was less a function of age and
type, but more a function of number and frequency of storms and leaching history.
Concentrations of nitrogen, phosphorus, and copper were high in the initial few storms,
and then decreased. Only a small fraction (3%) of the copper present in the compost
leached out, but nonetheless, the copper concentrations in the leachate remained
above the regulatory waste discharge standards. NMR and FTIR analyses revealed
1

that dissolved organic carbon consisted mainly of aliphatic and aromatic components
typical of fulvic and humic acids. Our results show that municipal compost can serve
as a sustained source of leaching of nutrients and metals, regardless of compost age
and source. However, the copper concentrations observed in our experiment are likely
not toxic due to the presence of elevated DOC, as DOC readily forms complexes
with dissolved copper thereby reducing its toxicity to aquatic organisms. The DOC
plays a dual role in terms of copper fate and transport: DOC can enhance leaching
of copper by forming aqueous complexes, but at the same time, reduces toxicity of
copper because copper-DOC complexes are less bioavailable.
2
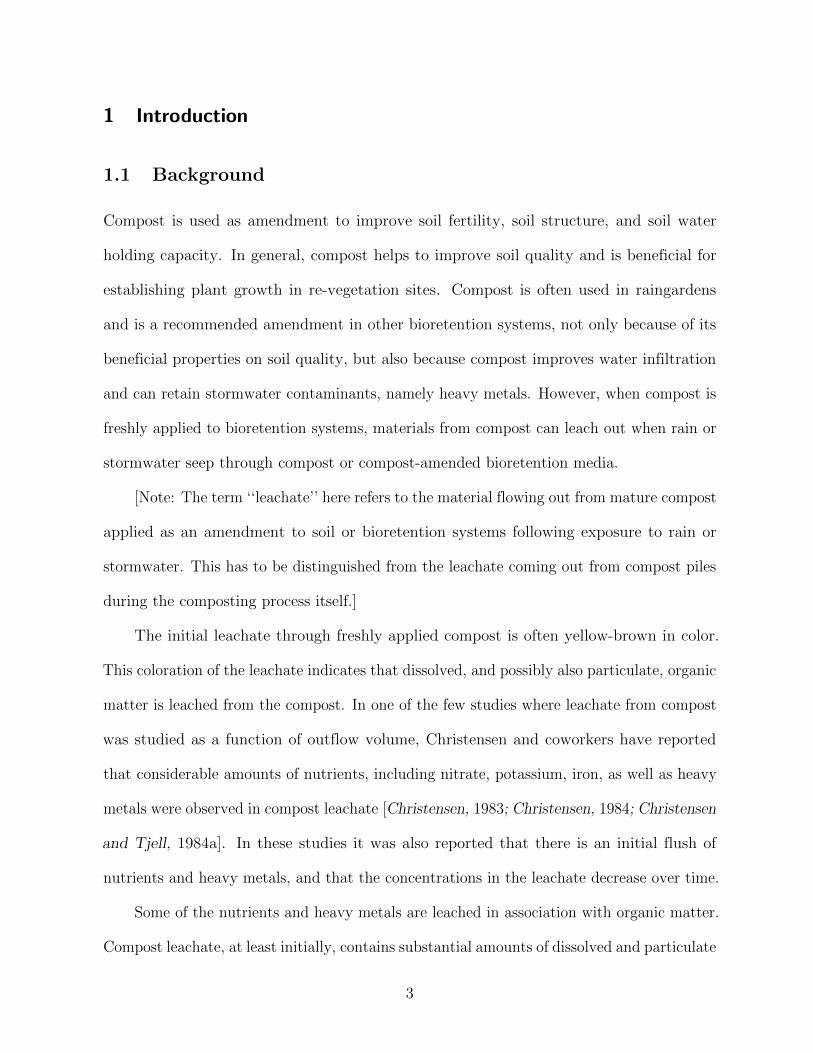
1 Introduction
1.1 Background
Compost is used as amendment to improve soil fertility, soil structure, and soil water
holding capacity. In general, compost helps to improve soil quality and is beneficial for
establishing plant growth in re-vegetation sites. Compost is often used in raingardens
and is a recommended amendment in other bioretention systems, not only because of its
beneficial properties on soil quality, but also because compost improves water infiltration
and can retain stormwater contaminants, namely heavy metals. However, when compost is
freshly applied to bioretention systems, materials from compost can leach out when rain or
stormwater seep through compost or compost-amended bioretention media.
[Note: The term ‘‘leachate’’ here refers to the material flowing out from mature compost
applied as an amendment to soil or bioretention systems following exposure to rain or
stormwater. This has to be distinguished from the leachate coming out from compost piles
during the composting process itself.]
The initial leachate through freshly applied compost is often yellow-brown in color.
This coloration of the leachate indicates that dissolved, and possibly also particulate, organic
matter is leached from the compost. In one of the few studies where leachate from compost
was studied as a function of outflow volume, Christensen and coworkers have reported
that considerable amounts of nutrients, including nitrate, potassium, iron, as well as heavy
metals were observed in compost leachate [Christensen, 1983; Christensen, 1984; Christensen
and Tjell, 1984a]. In these studies it was also reported that there is an initial flush of
nutrients and heavy metals, and that the concentrations in the leachate decrease over time.
Some of the nutrients and heavy metals are leached in association with organic matter.
Compost leachate, at least initially, contains substantial amounts of dissolved and particulate
3

organic matter [Said-Pullicino et al., 2007]. It is this material that renders the leachate
yellow-brown. The molecular characteristics of dissolved organic matter allow for chemical
complexation of certain metals, particularly heavy metals [Kaschl et al., 2002; Bolea et al.,
2006]. This complexation leads to enhanced solubility and decreased sorption of these
metals, thereby facilitating the leaching.
Dissolved organic matter leaching from compost is, in general, similar to dissolved
organic matter from soils, and its molecular structure is derived from degradation of
macromolecular substances, like cellulose, lignin, and proteins. Dissolved organic matter
often has ambiphilic characteristics, meaning the molecules have both hydrophilic and
hydrophobic parts [Kleber and Johnson, 2010]. This characteristic allows the molecule to
interact both with hydrophilic and hydrophobic constituents. An important consequence
of this is that dissolved organic matter can bind hydrophobic contaminants, and thereby
make these contaminants more mobile and enhance their apparent solubility. Hydrophobic
contaminants, for instance polyaromatic hydrocarbons, can thereby become more mobile
and potentially leach in association with dissolved organic matter.
Concerns about compost leachate arise when the leachate flows into sensitive environ-
ments, such as surface and groundwaters. Such conditions can occur when compost is used
as an amendment to bioretention systems, where the outflow is conducted to surface waters,
or when compost is applied as soil amendment along roadsides. To alleviate environmental
hazards due to compost applications, we need to better understand what exactly leaches
out from compost, what the quantities and concentrations of the leachate constituents are,
and for how long after compost applications the leachates may be of concern.
4
1.2 Objectives
The overall goal of this research project was to experimentally evaluate and characterize
leachates from compost. The specific objectives of this study were to:
1. Characterize the nature of compost leachate
2. Quantify loads and concentrations of selected constituents
3. Quantify the dynamics of the leaching process
4. Determine whether age can serve as indicator of leaching
5. Determine whether contaminants in the stormwater are retained or can be leached
with compost leachate
5

2 Review of Previous Work
In a previous project, we have conducted a thorough literature review of compost leachate
and its characteristics [Chatterjee et al., 2013]. We summarized the biochemical processes
occurring during composting, and the use and applications of compost in the environment.
We then reviewed the chemical and physical characteristics of feedstock, compost, and
compost leachate, and discussed environmental implications of the compost leachate.
The review showed that the compost source material, i.e., the feedstock, determines
to a large degree the types of leachates. Compost leachate usually contains large amounts
of dissolved organic matter. Together with the leaching of organic matter, there is evi-
dence for leaching of various nutrients and contaminants present in the original feedstock.
Contaminants can leach by direct dissolution out of the compost. Contaminants can also
leach with the help of dissolved and particulate organic matter, both of which have a high
sorption affinity for inorganic and organic constituents, and which can enhance contaminant
leaching via the mechanism of colloid-facilitated transport. Organic matter, nutrient, and
contaminant concentrations are highest in the initial leachate, and the concentrations
decrease considerably with increasing amount of rain or runoff water leaching through the
compost. More details can be found in Chatterjee et al. [2013].
Based on this previous project, we identified the need for comprehensive studies to
experimentally quantify and characterize compost leachates as related to typical stormwater
applications. Particularly, there is need to study leaching from compost during sequential
storm events, with drying events between storms. We hypothesized that each new storm
triggers a new flush of constituents leached from compost.
6
3 Research Approach/Procedures
3.1 Experimental Tests
The objectives of the project were addressed with a series of compost leaching experiments.
We conducted two sets of leaching experiments:
1. Leaching experiments with two composts of different age
2. Leaching experiments with two composts of different type
3.2 Compost Material and Characterization
We obtained compost samples from local composting facilities in July 2013 and April 2014.
For the experiments testing the effect of compost age, we obtained 6- and 24-month old
compost from the Cedar Grove composting facility in Everett, WA. This compost was made
from a feedstock consisting of 80% yard waste and 20% food waste (by volume). For the
experiments testing the effect of compost type, we obtained compost from Royal Organic
Products in Grant County, WA, and from Silver Springs Organics in Thurston County,
WA. The compost from Royal Organic contained 96% yard waste and 4% food waste, the
compost from Silver Springs contained 99% yard waste and 1% food waste.
The composts as received were air-dried and stored until use in five-gallon plastic
buckets (covered with a 5-mm mesh to allow air circulation) in a greenhouse (16 to 20oC).
Triplicate samples of the composts were sent to Soiltest Farm Consultants, Inc (Moses
Lake, WA) for characterization. Compost material was characterized for pH, electrical
conductivity, various nutrients, heavy metals, and C/N ratio following the protocols of the
Test Methods for the Examination of Composting and Compost (TMECC). Nutrient and
metal contents are important chemical parameters of a compost, and electrical conductivity
7

reflects the overall salt content. Electrical conductivity also is a measure of ionic strength,
an important parameter that affects speciation of chemical in aqueous solution. A Solvita
Compost Emissions Test [Woods End Laboratories, 2014] was performed on all composts to
determine maturity. The Test Methods for the Examination of Composting and Compost
(TMECC) have been established by the US Compost Council to provide a standardized
characterization of compost properties. The methods have been modeled after the American
Society for Testing and Materials (ASTM), and they provide a benchmark for compost
analysis to enable comparison of analytical results. The methods help regulatory agencies to
establish criteria for the safe use of compost. The Washington State Legislative Code WAC
173-350-220, for instance, specifies that compost facilities in Washington State must test
their compost for a variety of metals and other parameters according to the Test Methods
for the Examination of Composting and Compost (TMECC), and the WAC 173-350-220
lists criteria for these parameters.
The chemical structure of the composts prior to leaching was characterized with solid-
state 13C-NMR spectroscopy and ATR-FTIR (Attenuated Total Reflectance-FTIR). For
NMR analysis, paramagnetic material in the compost samples was removed following a
modified method of Skjemstad et al. [1994]. For ATR-FTIR analysis, compost samples were
dried and ground. Sixty scans per sample were acquired using a Shimadzu IR-Prestige 21
analyzer (Columbia, MD) complemented with an ATR unit (PIKE Technologies, Madison,
WI). The band assignments and interpretations of the spectra are based on literature reports:
Huang et al. [2006], Zmora-Nahum et al. [2007], Carballo et al. [2008], Smidt et al. [2011],
Wang et al. [2013], Fels et al. [2014], Ouaqoudi et al. [2014], Higashikawa et al. [2014], and
Provenzano et al. [2014].
8
3.3 Experimental Setup
3.3.1 Experimental Setup with two Composts of Different Age
A total of six PVC columns (64 cm height, 10.2 cm diameter) were loosely packed with
compost to a height of 25 cm. The compost used for these experiments was from Cedar
Grove. The bottom of the columns was made of a perforated end-cap, consisting of a plate
with 150 3-mm diameter holes. This end-cap held the compost in place, but did not restrict
outflow. Three columns were packed with 6-month old compost, and three were packed
with 24-month old compost. In these set of experiments, we only used compost as material
inside the columns to test what the leachate will be from compost itself. When applied to
the environment, compost is often mixed with soil and sand when, and in that case leachate
from compost will interact with mineral particles from soil and sand. This will likely reduce
the amount of material leached from compost; however, it is important to know what
potentially can leach from compost itself. In the second set of experiments described below,
we mixed compost with sand to create a typical mixture used in bioretention systems.
The columns were placed in wooden stands and set up in a greenhouse. A plastic
funnel was used at the bottom to collect outflow into 1-L glass beakers. Each column was
equipped with a custom-built sprinkler head, 5.7 cm in diameter, made of twelve 22-gauge
syringe needles. The sprinkler heads were connected with Tygon tubing to Mariotte bottles
made of 25-L Nalgene carboys. Deionized water, with a pH of around 6, was chosen as the
irrigation solution as its low ionic strength represents a worst-case scenario for leaching.
Figure 1 illustrates compost sampling and the experimental setup.
9
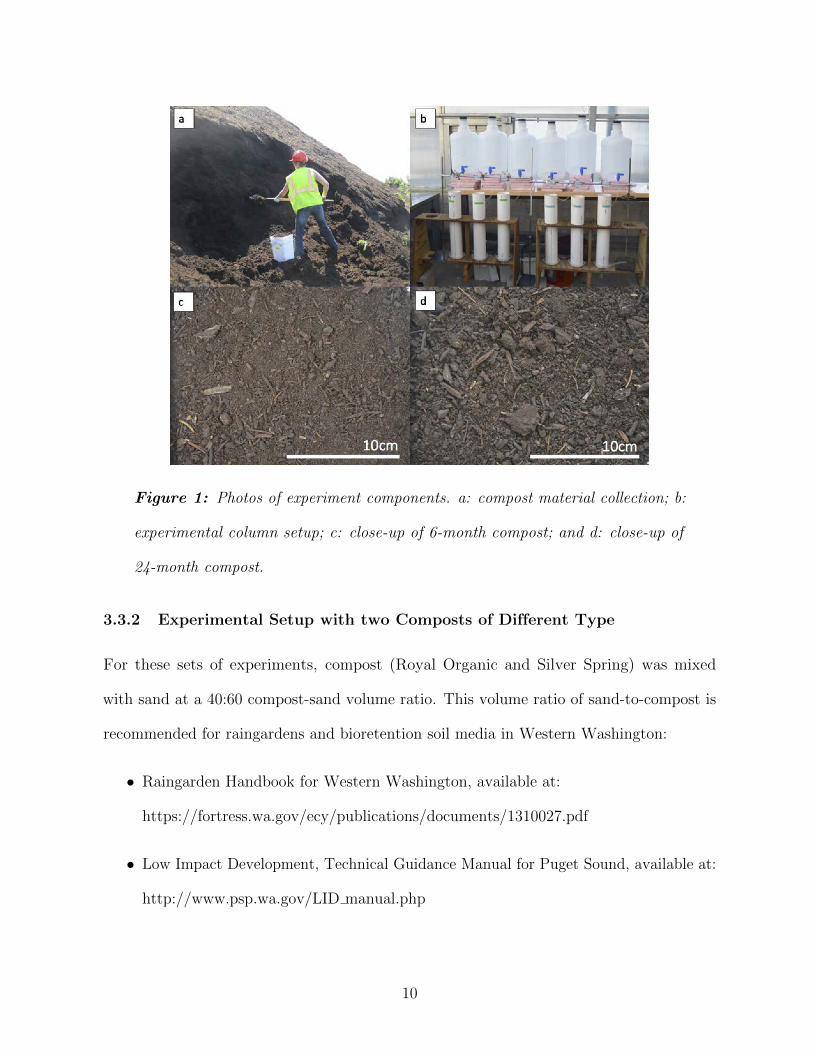
Figure 1: Photos of experiment components. a: compost material collection; b:
experimental column setup; c: close-up of 6-month compost; and d: close-up of
24-month compost.
3.3.2 Experimental Setup with two Composts of Different Type
For these sets of experiments, compost (Royal Organic and Silver Spring) was mixed
with sand at a 40:60 compost-sand volume ratio. This volume ratio of sand-to-compost is
recommended for raingardens and bioretention soil media in Western Washington:
• Raingarden Handbook for Western Washington, available at:
https://fortress.wa.gov/ecy/publications/documents/1310027.pdf
• Low Impact Development, Technical Guidance Manual for Puget Sound, available at:
http://www.psp.wa.gov/LID manual.php
10

The compost-sand mix was then filled into six columns (i.d. 5.1 cm and length 25 cm) in
5-cm increments to a total height of 15 cm. The composts, sand, and compost-sand mix are
shown in Figure 2.
Figure 2: Bioretention soil mix used in the experiment. (A) Silver Springs
compost; (B) Royal Classics compost; (C) coarse sand; (D) bioretention mix after
mixing compost with sand at a 40:60 volume ratio (Silver Springs compost).
The remaining setup was the same as described in Section 3.3.1, except that we used a
peristaltic pump to apply the irrigation, and that we used real stormwater collected at the
WSU Puyallup Research and Extension Station as irrigation solution (Table 1).
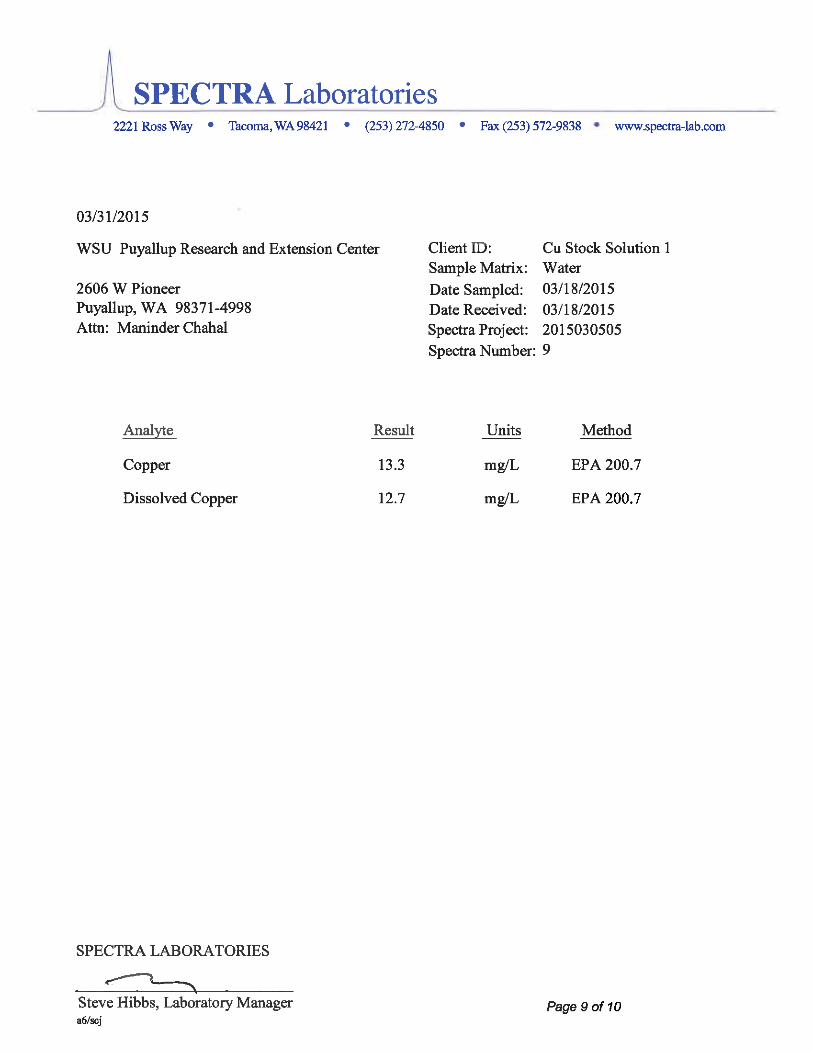
Because the stormwater contained little copper, we spiked the stormwater with copper
to reach copper concentrations of 17--70 µg/L to ‘‘pollute’’ the stormwater. Our target
copper concentration in the stormwater was 50 µg/L, but when we measured the actual
concentrations in the stormwater coming out of the sprinkler heads, the concentrations were
initially always lower than 50 µg/L, so we increased the concentrations in later storms.
11
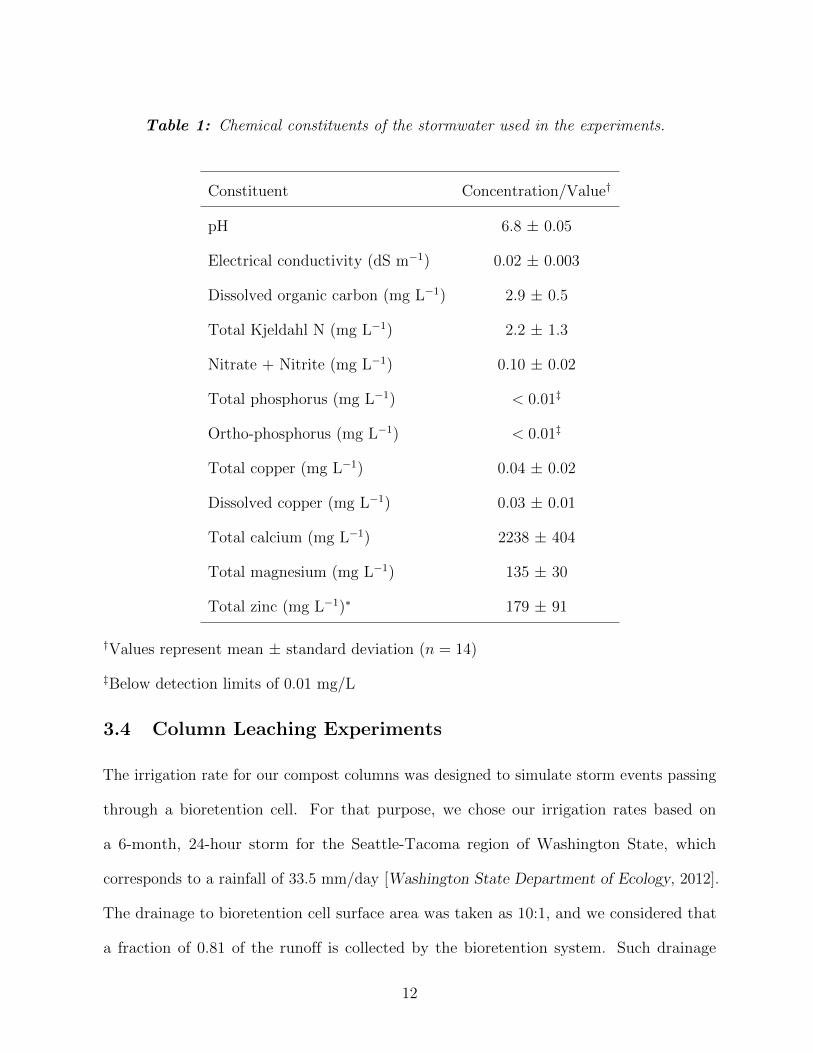
Table 1: Chemical constituents of the stormwater used in the experiments.
Constituent Concentration/Value†
pH 6.8 ± 0.05
Electrical conductivity (dS m−1) 0.02 ± 0.003
Dissolved organic carbon (mg L−1) 2.9 ± 0.5
Total Kjeldahl N (mg L−1) 2.2 ± 1.3
Nitrate + Nitrite (mg L−1) 0.10 ± 0.02
Total phosphorus (mg L−1) < 0.01‡
Ortho-phosphorus (mg L−1) < 0.01‡
Total copper (mg L−1) 0.04 ± 0.02
Dissolved copper (mg L−1) 0.03 ± 0.01
Total calcium (mg L−1) 2238 ± 404
Total magnesium (mg L−1) 135 ± 30
Total zinc (mg L−1)∗ 179 ± 91
†Values represent mean ± standard deviation (n = 14)
‡Below detection limits of 0.01 mg/L
3.4 Column Leaching Experiments
The irrigation rate for our compost columns was designed to simulate storm events passing
through a bioretention cell. For that purpose, we chose our irrigation rates based on
a 6-month, 24-hour storm for the Seattle-Tacoma region of Washington State, which
corresponds to a rainfall of 33.5 mm/day [Washington State Department of Ecology, 2012].
The drainage to bioretention cell surface area was taken as 10:1, and we considered that
a fraction of 0.81 of the runoff is collected by the bioretention system. Such drainage
12
parameters are typical for bioretention and raingarden designs in this region [Hinman,
2013]. The storms were applied within a 4-hour time period. Leachate was collected into
1-L beakers at the base of each column every hour during the storm event. A storm was
simulated every two weeks, so that the compost column could drain and air-dry between
storm events. In total, we simulated 18 individual, successive storms for the experiments
with different compost ages, and 7 individual, successive storms for the experiments with
different compost types.
3.5 Leachate Characterization
The pH of each leachate sample was measured immediately following collection. The samples
were then transferred to a 1-L graduated cylinder to determine the volume, and stored in
Nalgene bottles in the dark at 4oC prior to analysis. Each sample was further analyzed for
electrical conductivity, particulate matter, UV-vis absorbance, dissolved organic carbon, and
surface tension. Electrical conductivity is measure of salts leached from the compost, and is
a surrogate for easily leached chemicals. Electrical conductivity can serve as a conservative
indicator of how fast material can leach. Particulate matter that is leaching from compost
can carry contaminants (like metals or organic pollutants) and it is important to know
how much particulate material leaches out in relation to the dissolved organic carbon
fraction. We determined a calibration curve between UV-vis absorption and dissolved
organic carbon. This calibration curve was then used to determine dissolved organic carbon
from UV-vis absorption. Further, specific absorbance bands in the UV-vis spectra can be
used to characterize the chemical nature of the dissolved organic carbon. Surface tension
was measured because we expected that dissolved organic carbon will reduce the surface
tension. In that case, dissolved organic carbon would accumulate at the air-water interface,
and therefore leach more during infiltration and rainfall events when air-water interface are
13
present and moving though the compost.
Particulate concentrations were measured using sequential vacuum filtration through
11, 1, and 0.45 µm pore filters (Whatman 1, Millipore Glass Fibre without binders, Millipore
Mixed Cellulose Ester Membrane Filter, respectively; all filters from Fisher Scientific). Prior
to filtration, all filters were dried at 105oC for 24 hours, then cooled in a desiccator, and
weighed using an analytical balance. After filtration, the filters were transferred back to
the oven to dry for 24 hours at 105oC, cooled in a desiccator, and measured gravimetrically.
The particulate concentrations were then determined by dividing the mass difference by
the volume of solution filtered.
We measured dissolved organic carbon (DOC) via spectrophotometric absorbance at
a wavelength of 465 nm [Zmora-Nahum et al., 2005]. A calibration curve was developed
by plotting absorbance at 465 nm against the total organic carbon (TOC) for a series of
0.45 µm-filtered dilutions from the column leachate for each compost treatment. These
calibration standards were analyzed for TOC using a TOC analyzer (TOC-VCSH, Shimadzu,
Tokyo, Japan). Surface tension of the filtered leachate samples was measured using the
Wilhelmy plate method at 20oC (Processor Tensiometer K100, Kruss, Hamburg, Germany).
Nanopure water water was used to verify surface tension measurements.
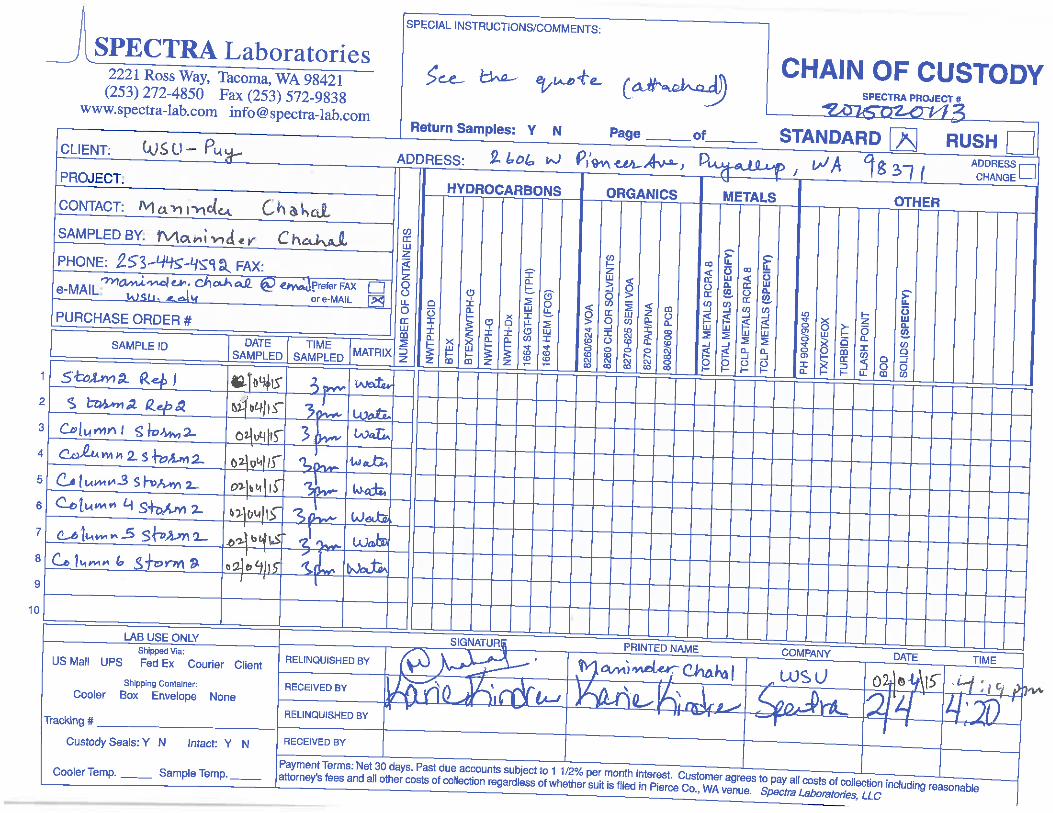
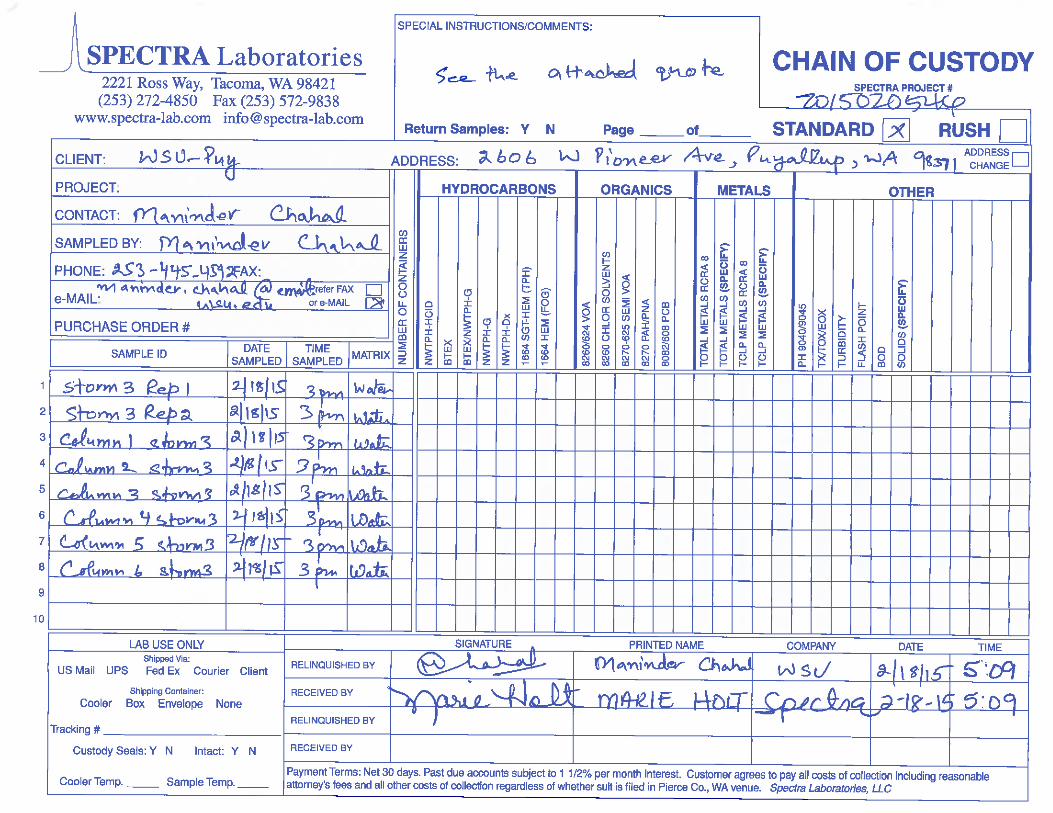
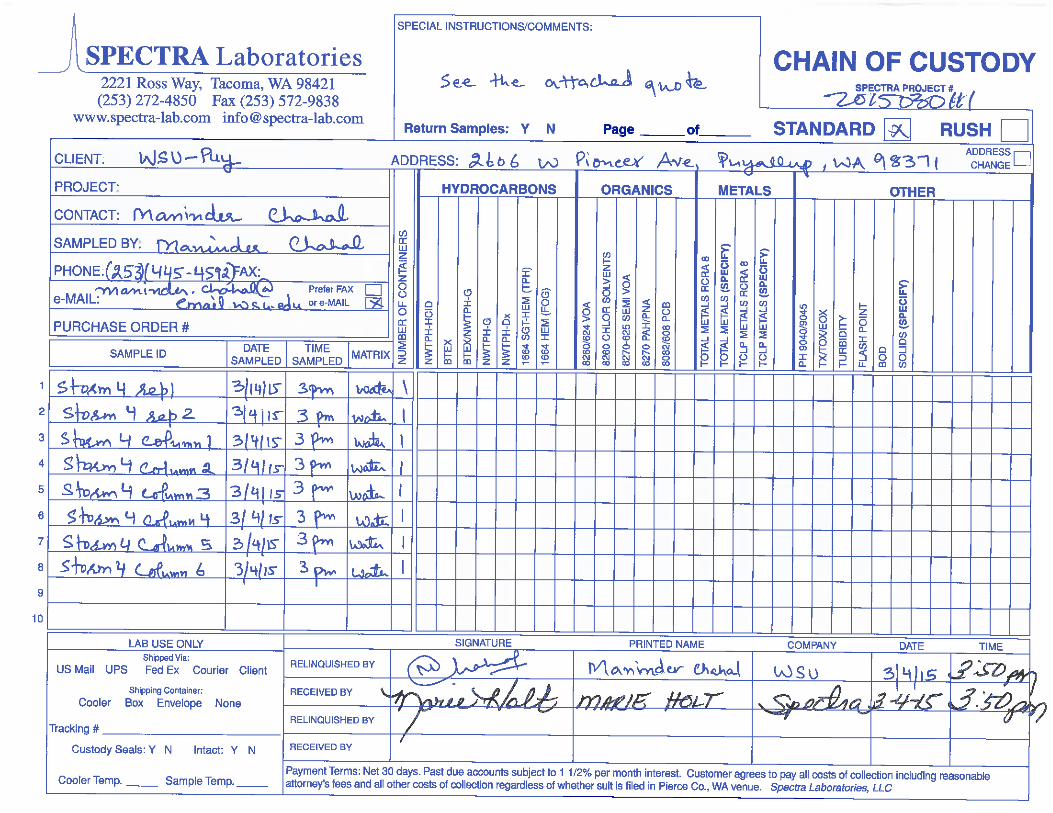
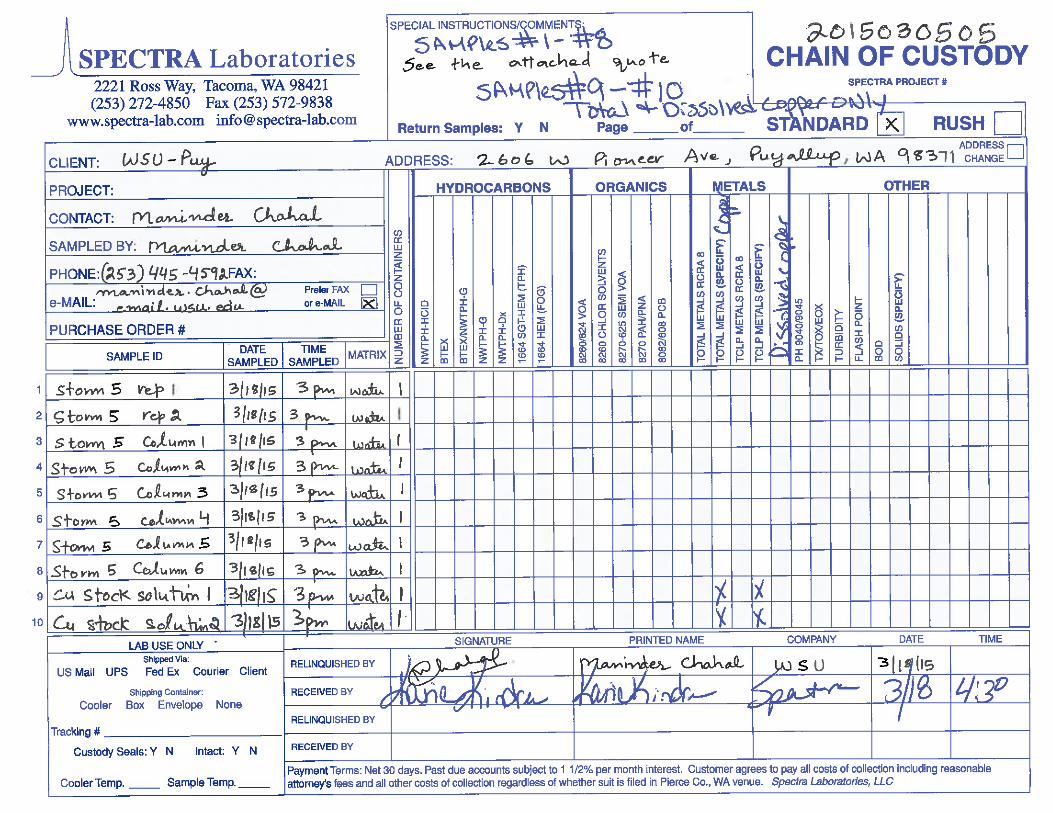
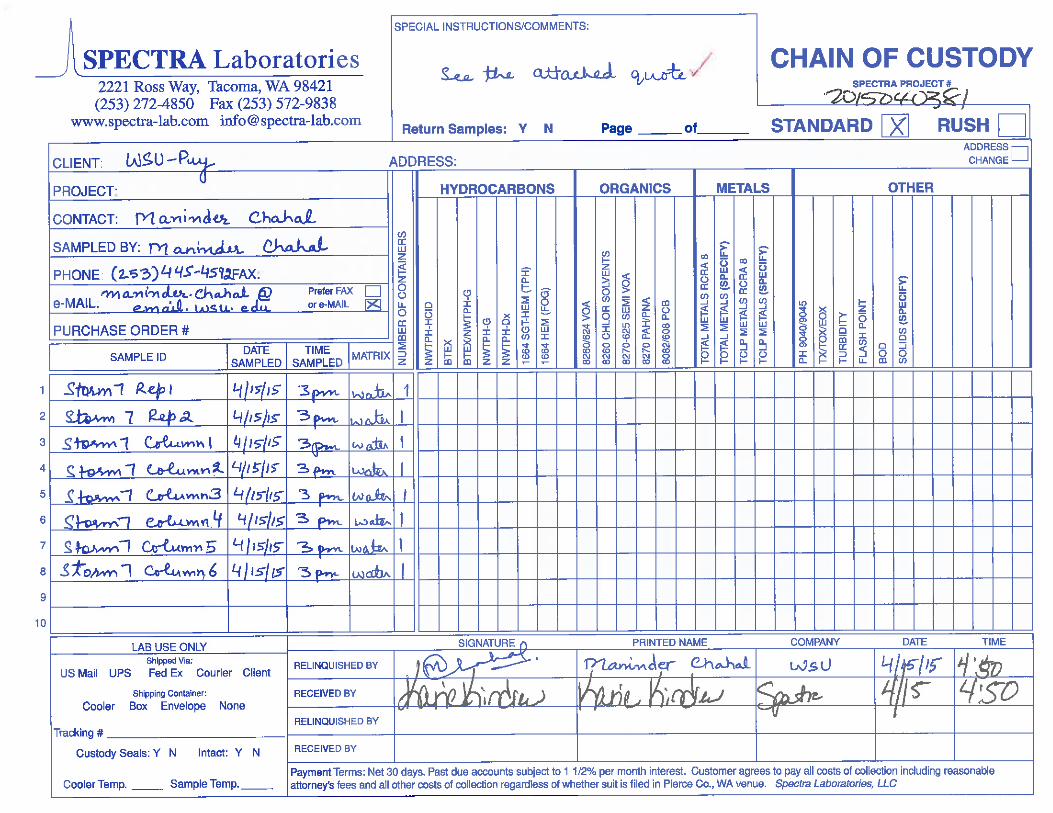
Selected storms were analyzed for nitrogen, phosphorus, and copper. For each storm a
total of six composite samples (one per column) were made. The composite samples were
made on an outflow volume basis for each hourly outflow-increment. Grab samples were
collected at the base of each column after each hour of the storm, and a 20% outflow volume
aliquot from each of these replicate samples was pipetted into the associated acid-washed
amber glass bottles. Samples were kept at 4oC using ice for the duration of the experiment
and during transport to the contracting laboratory. The samples and the necessary chain of
custody documents were delivered to the laboratory immediately following the completion
14

of the storm.
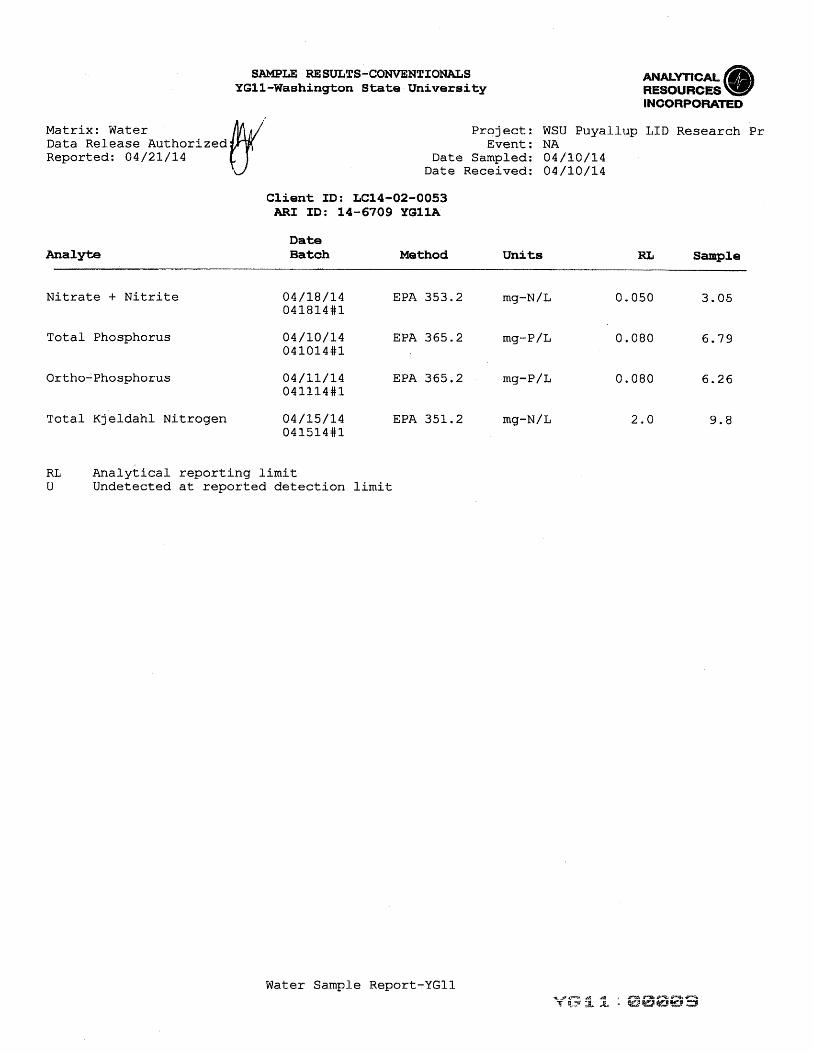
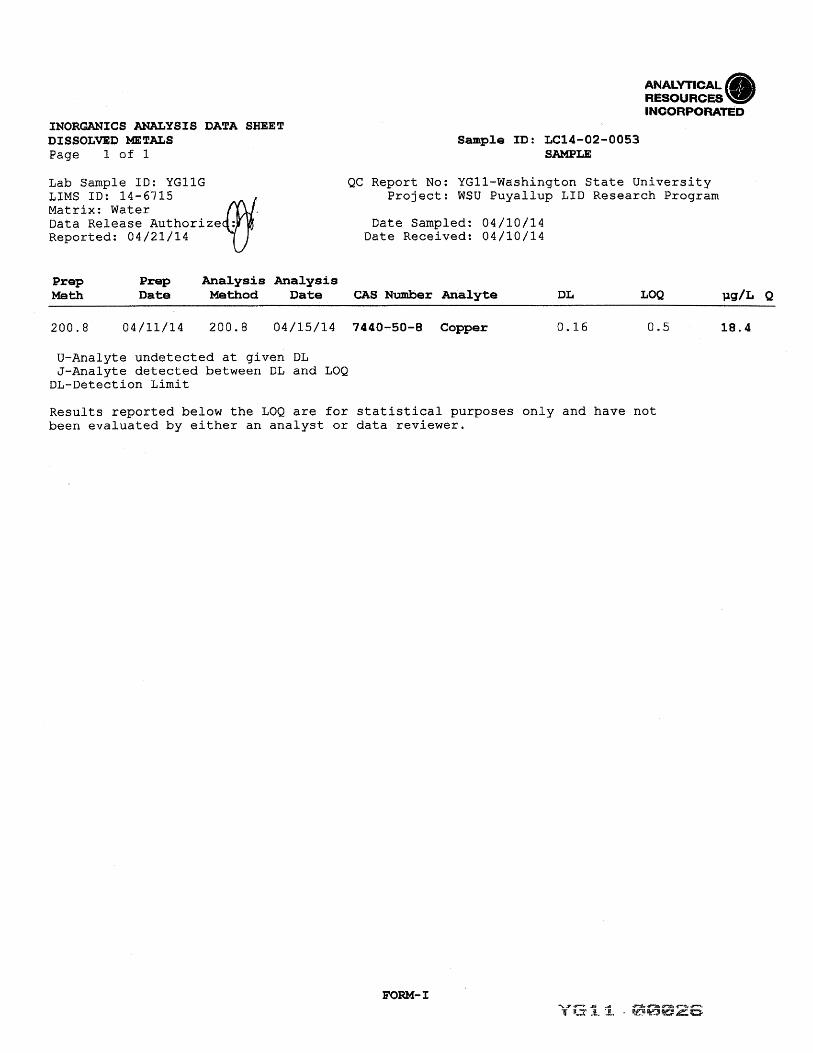
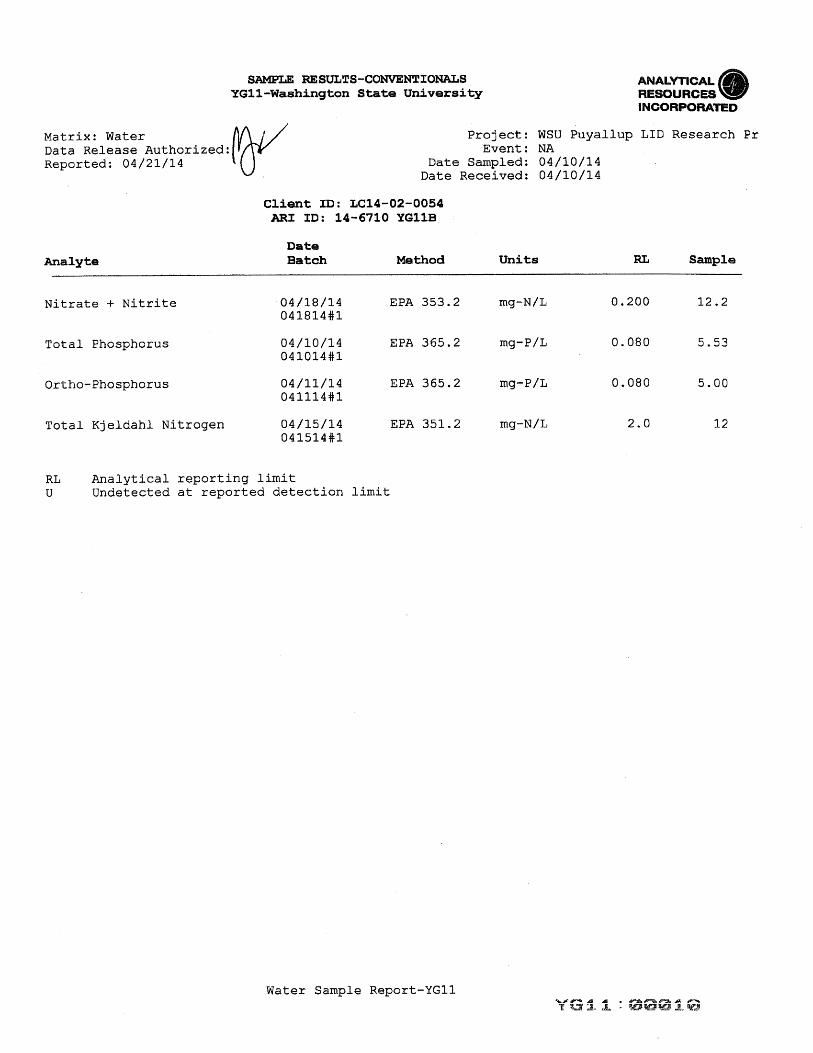
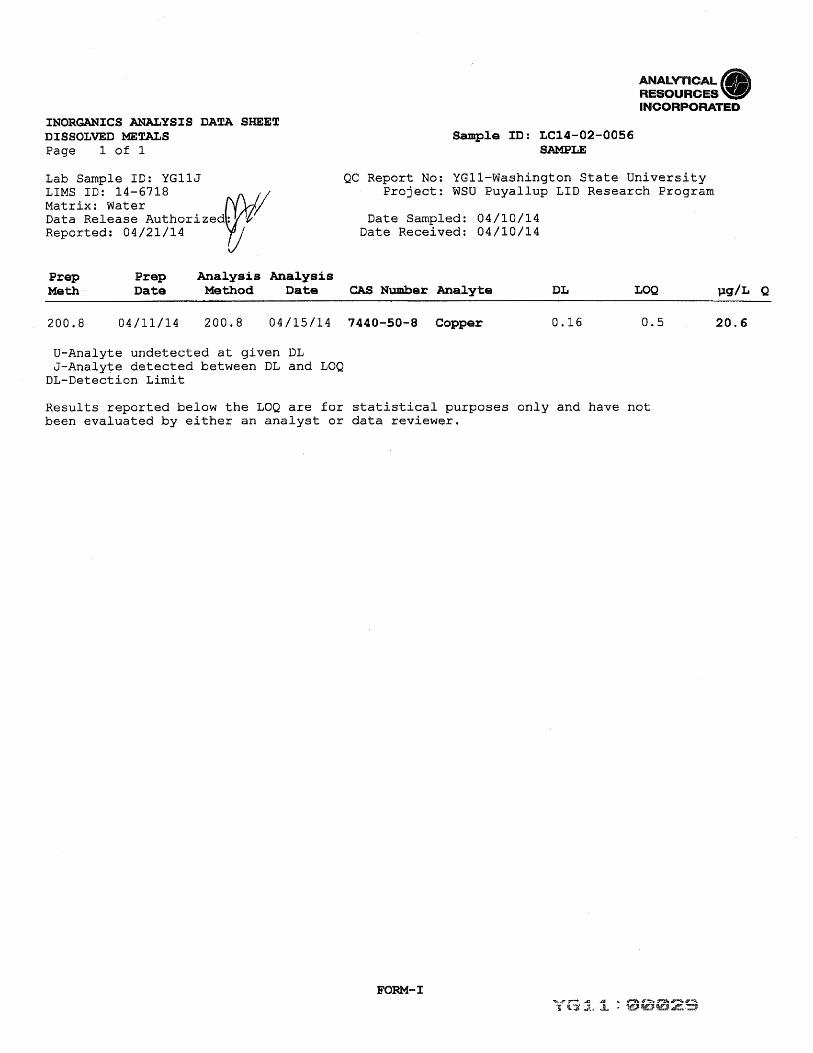
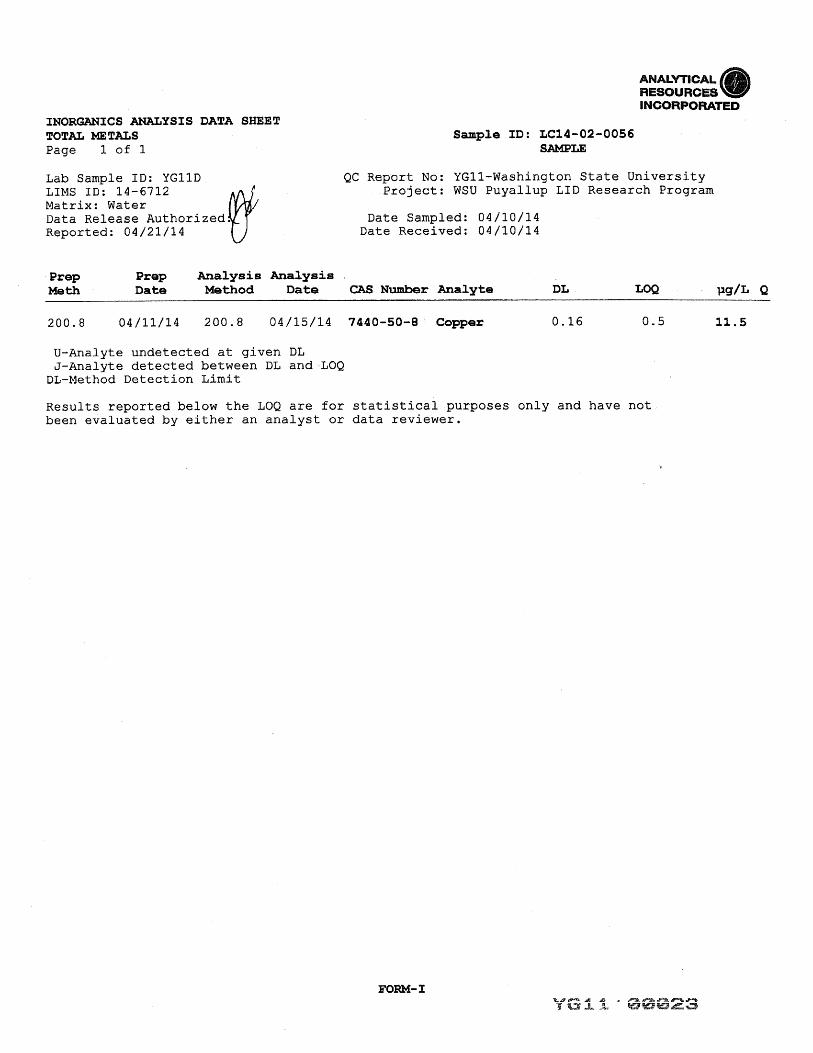
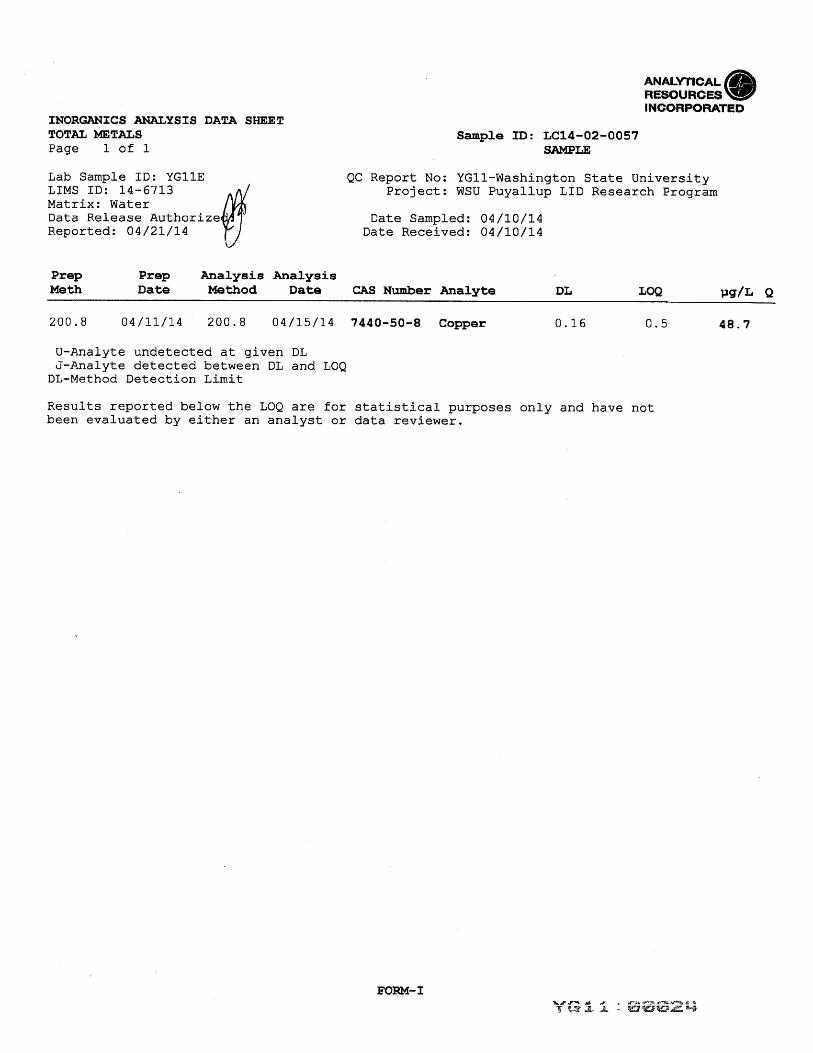
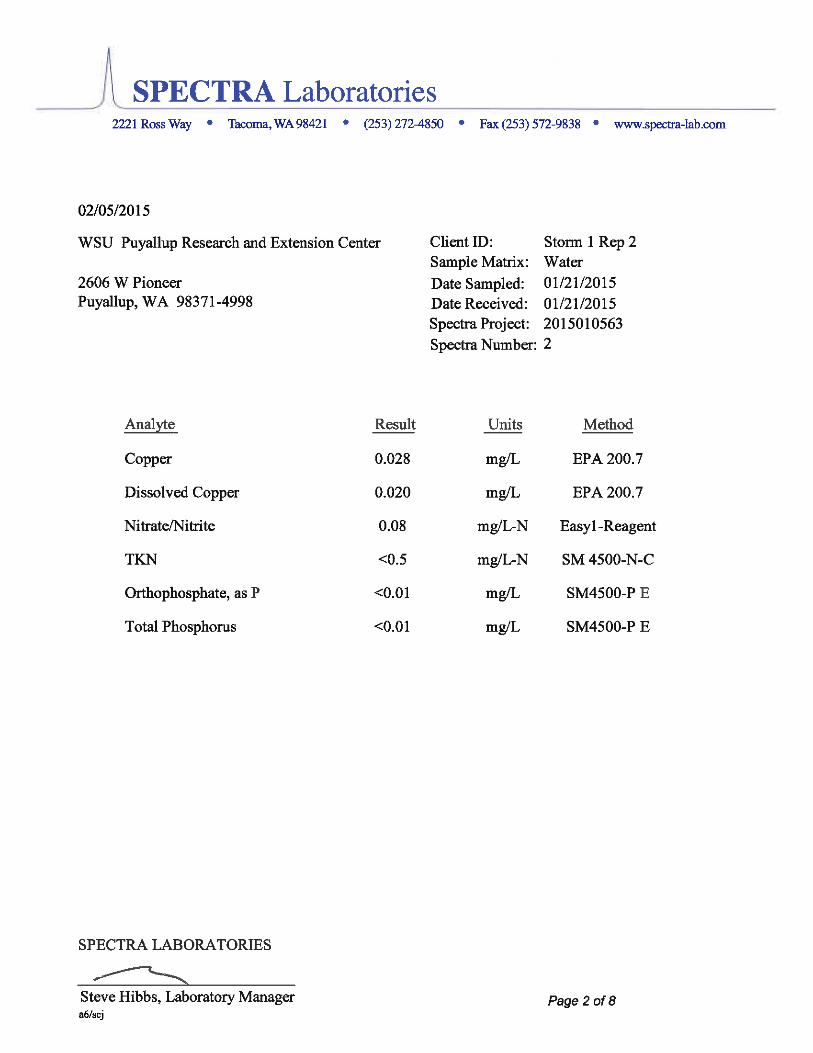
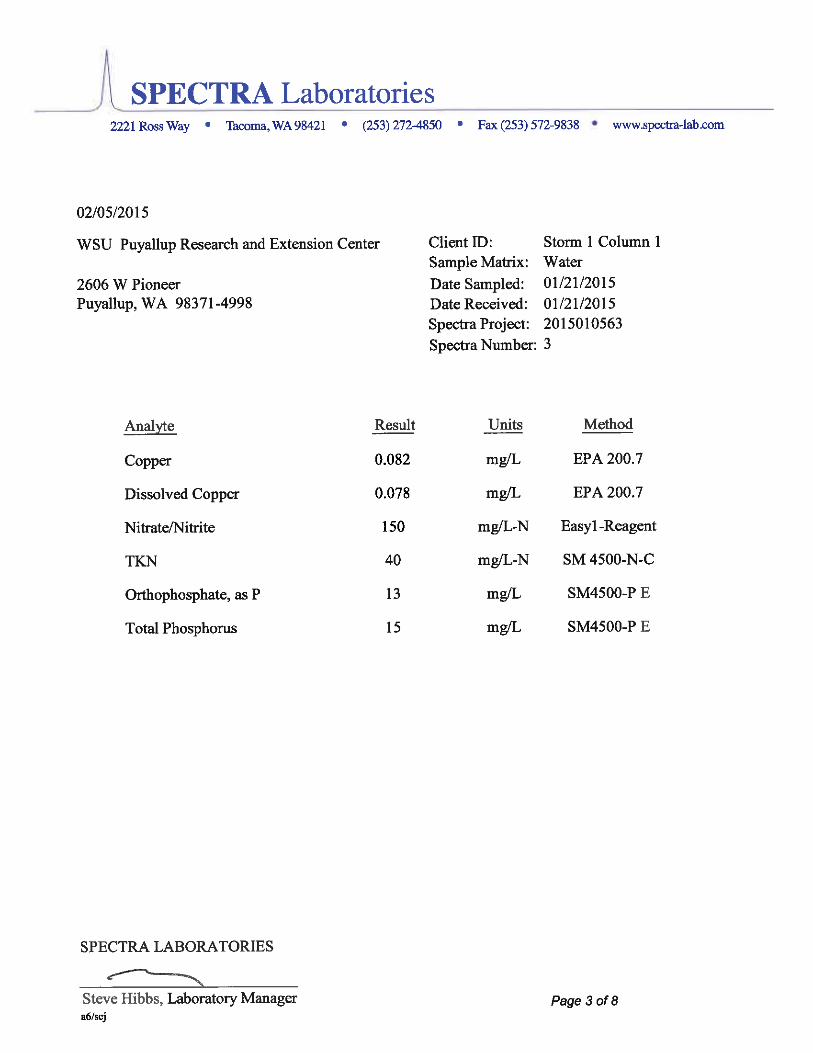
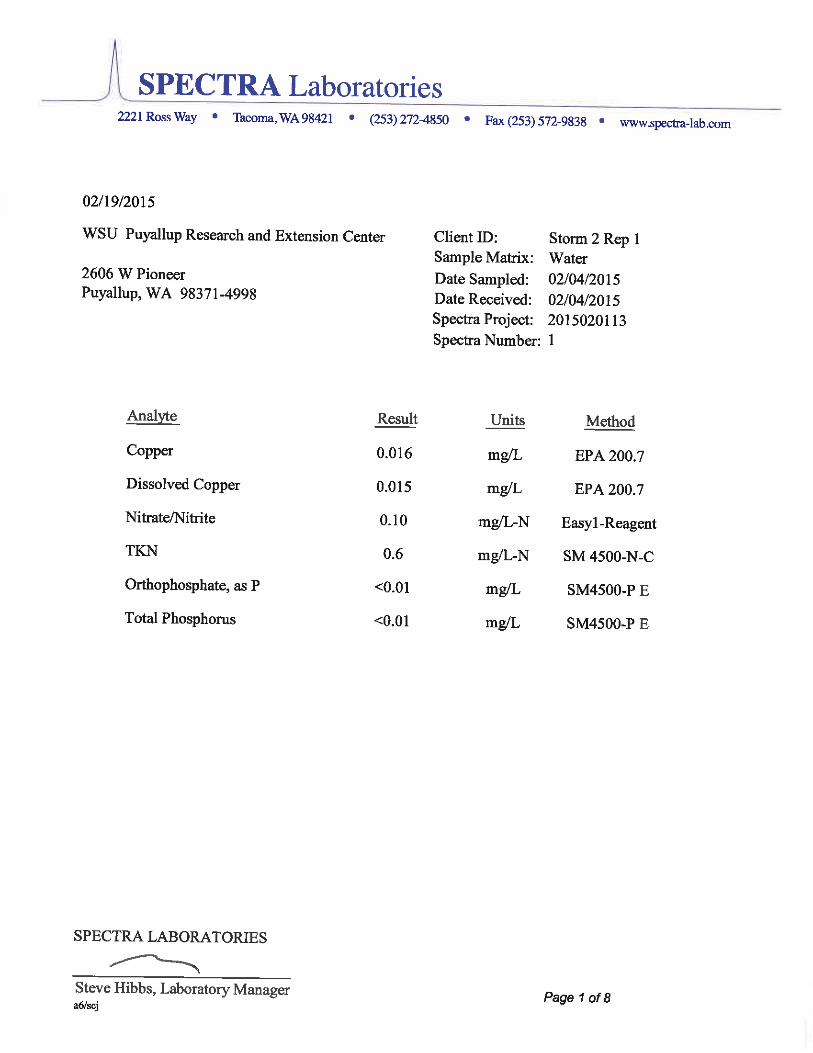
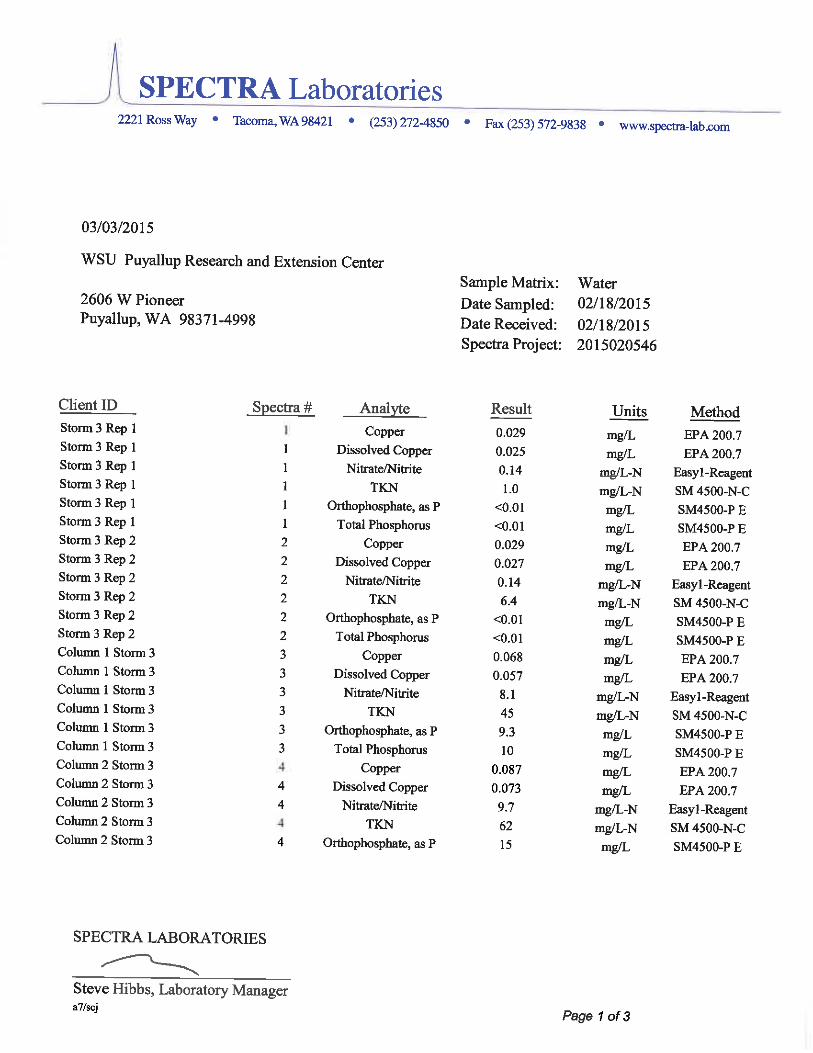
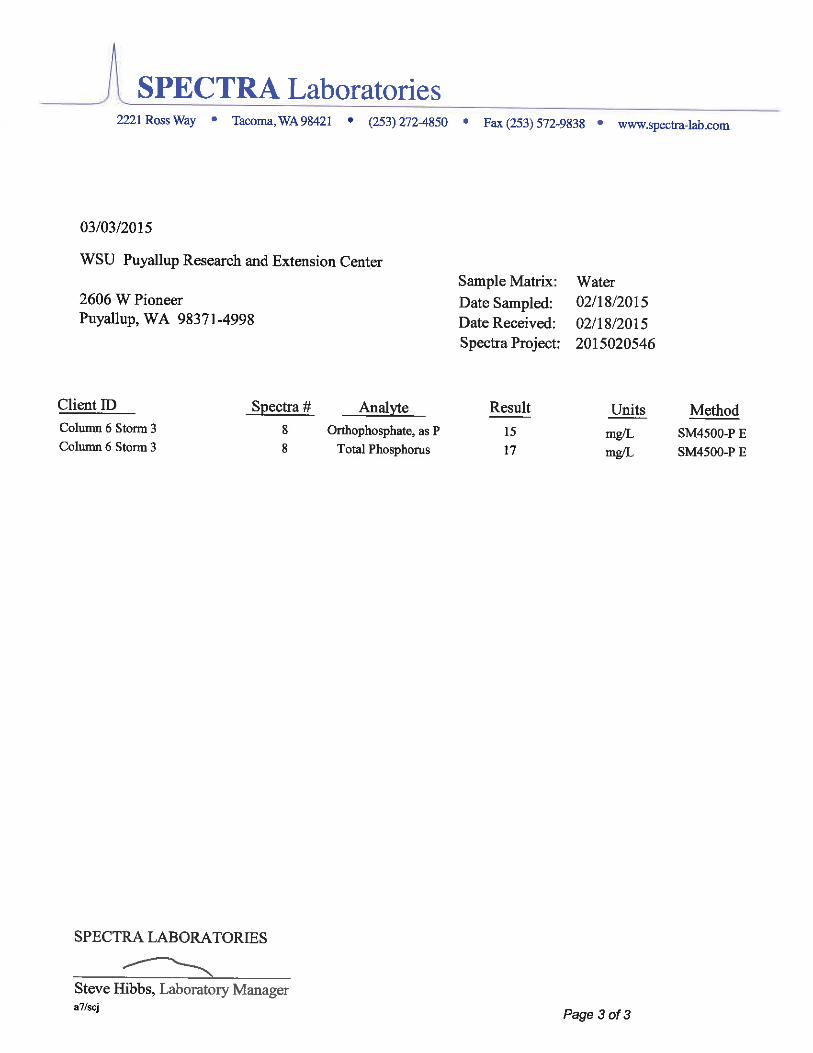
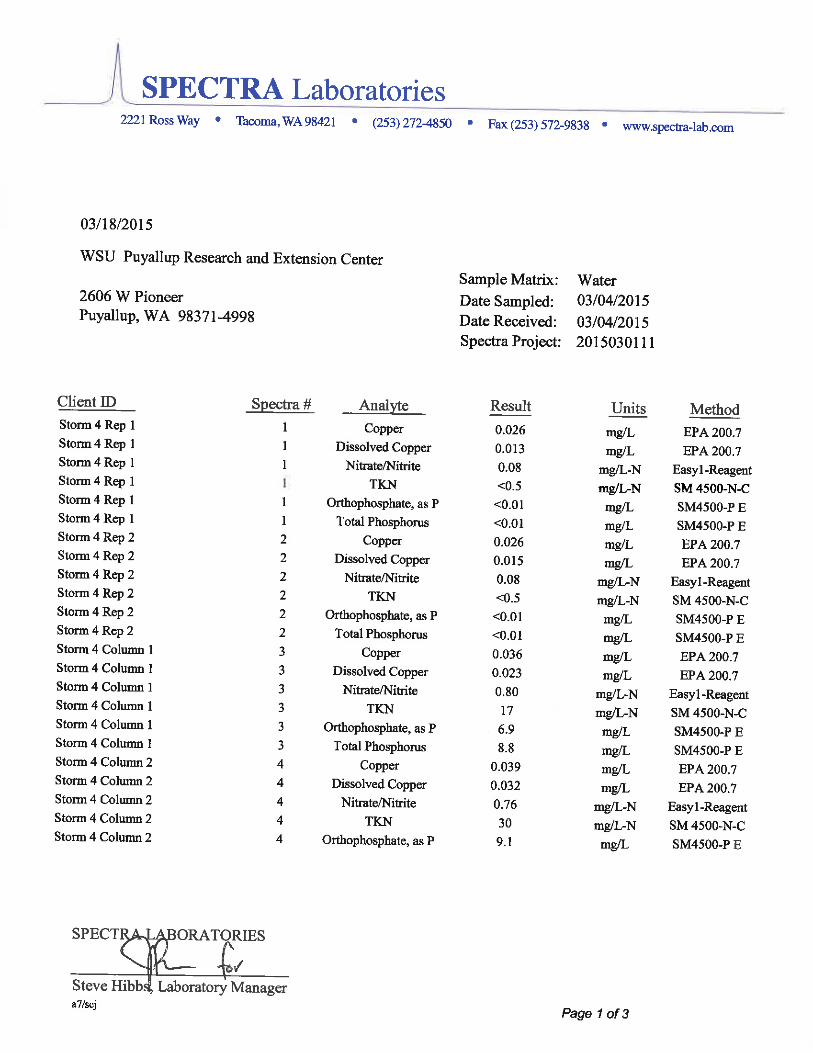
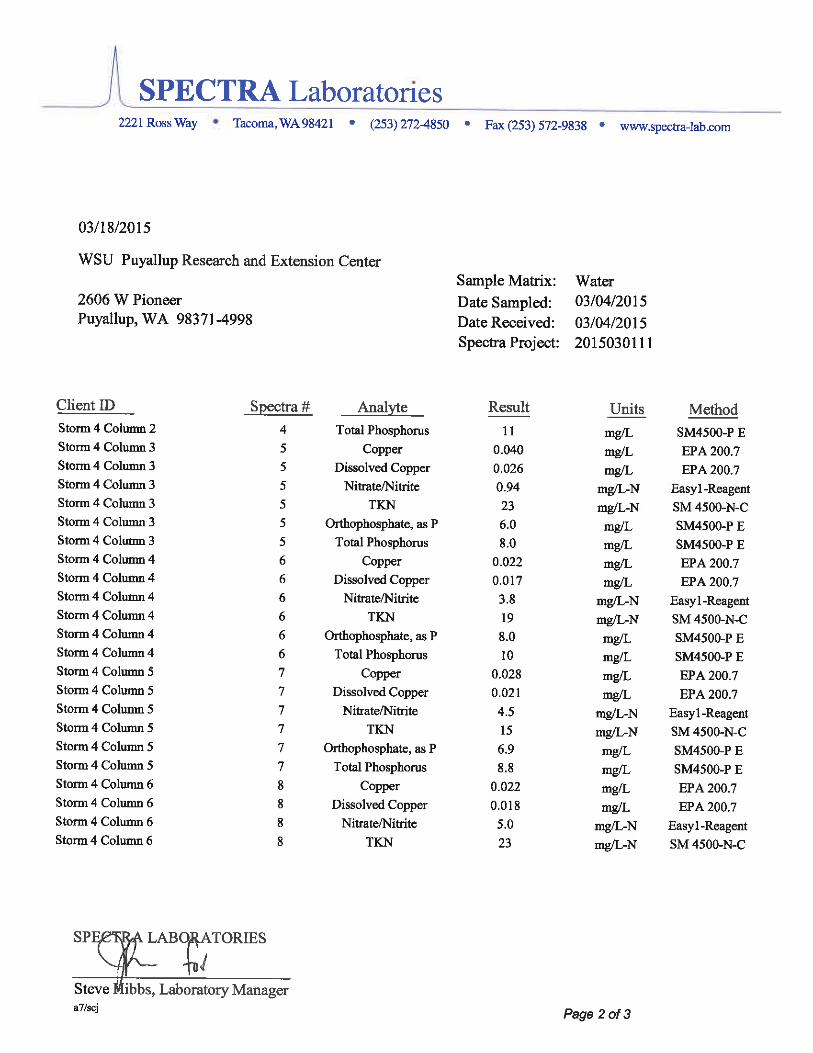
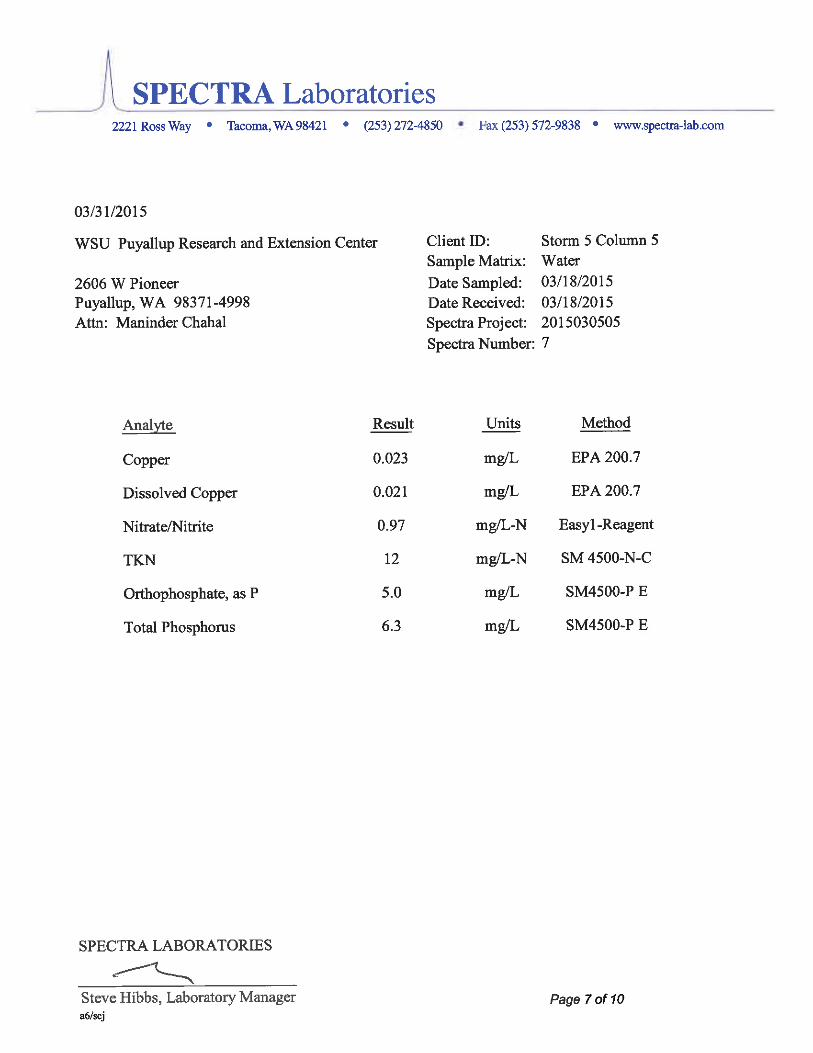
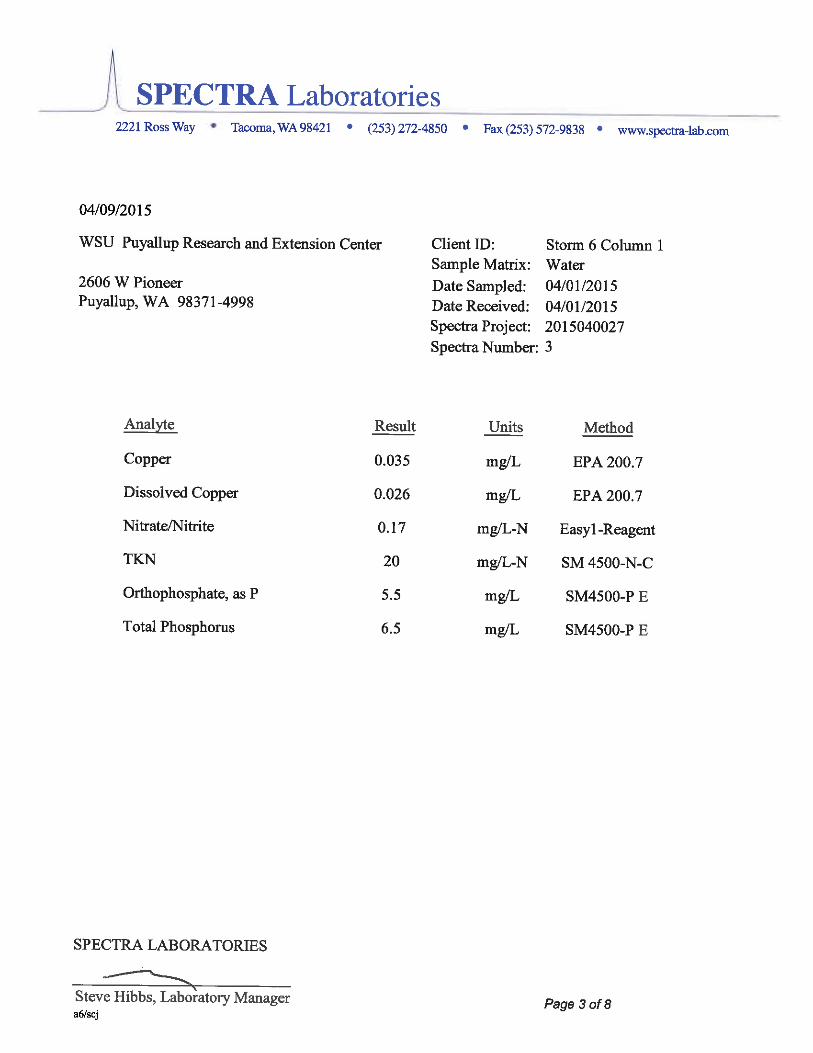
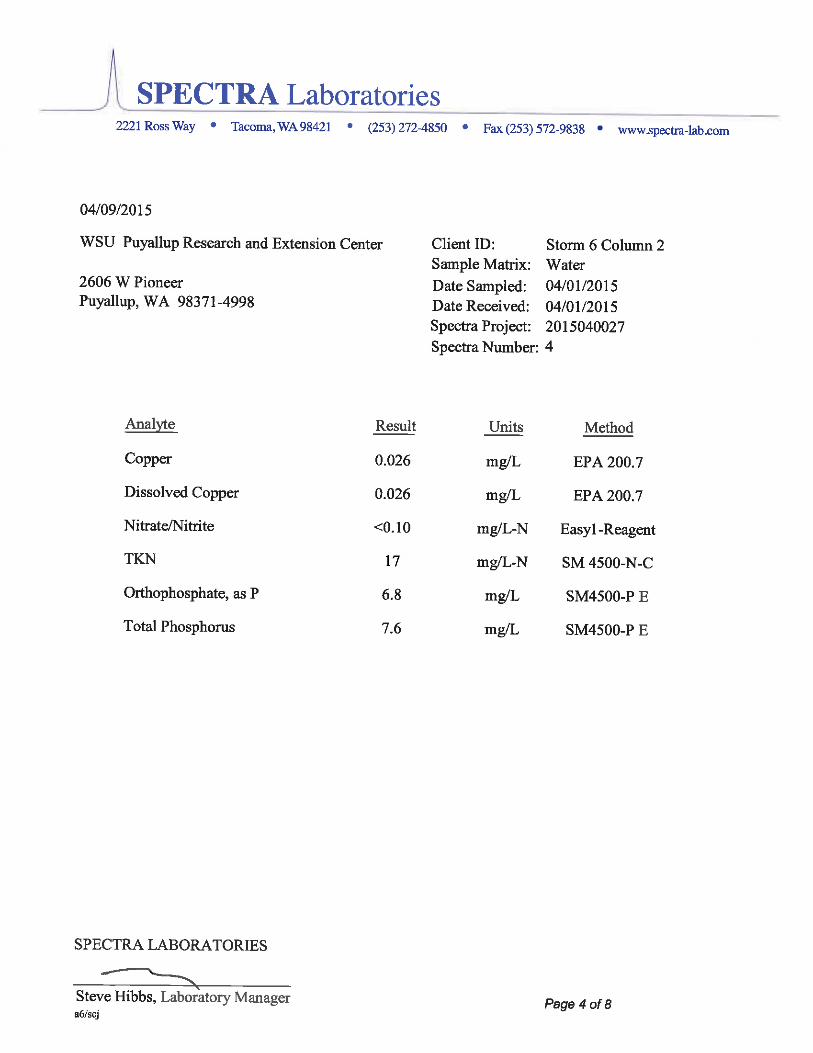
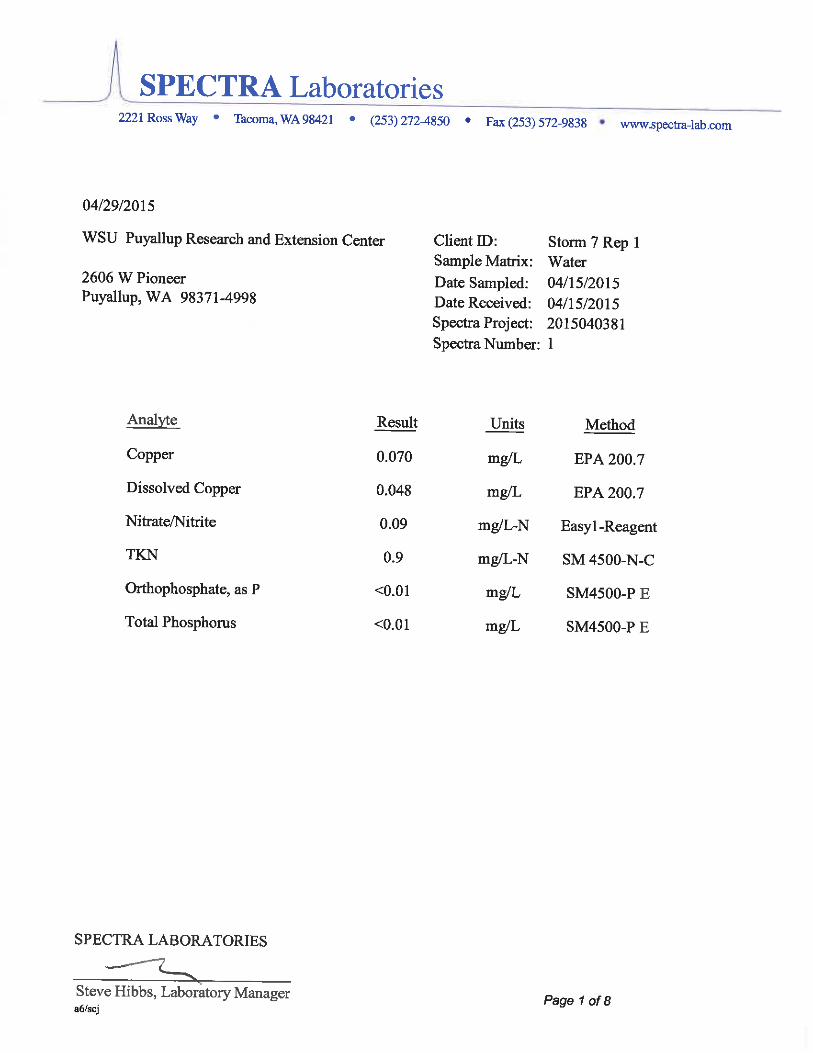
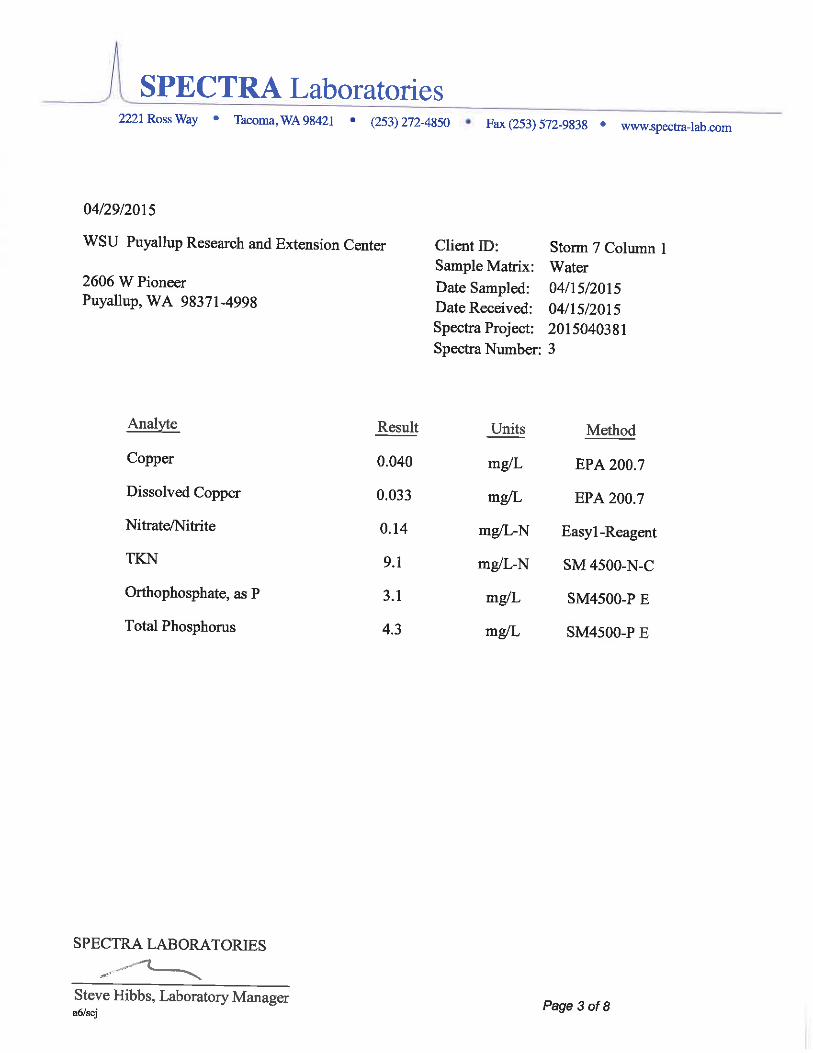
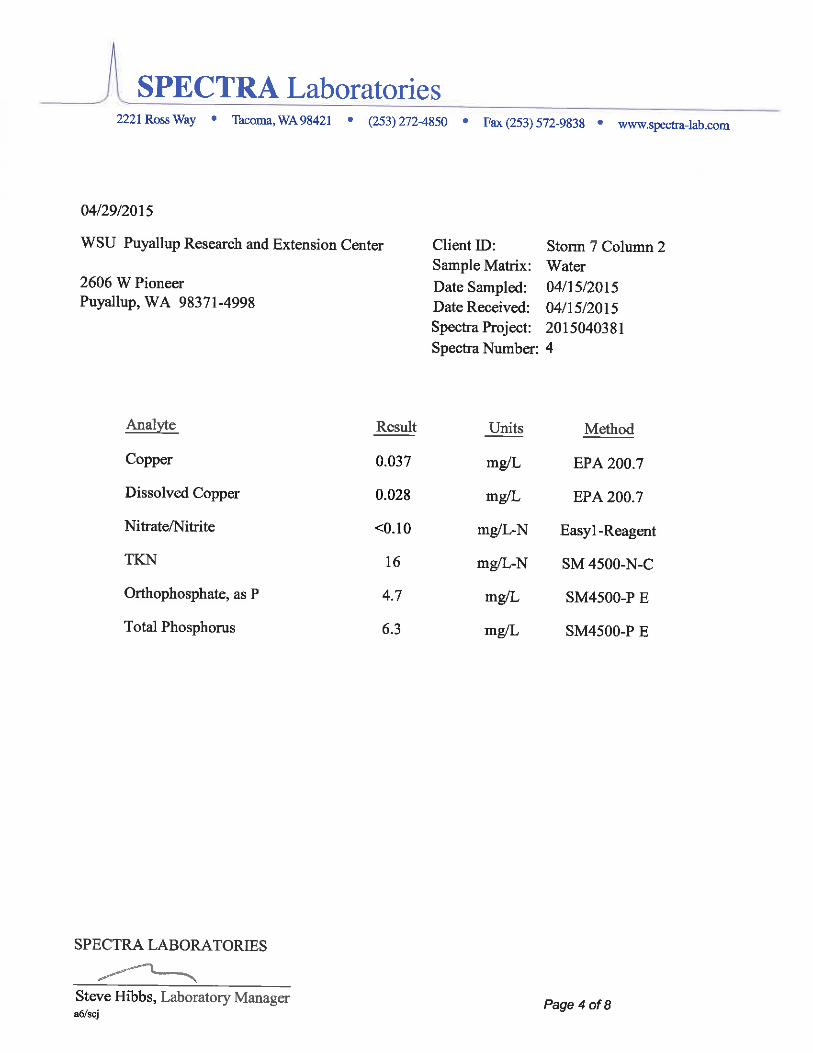
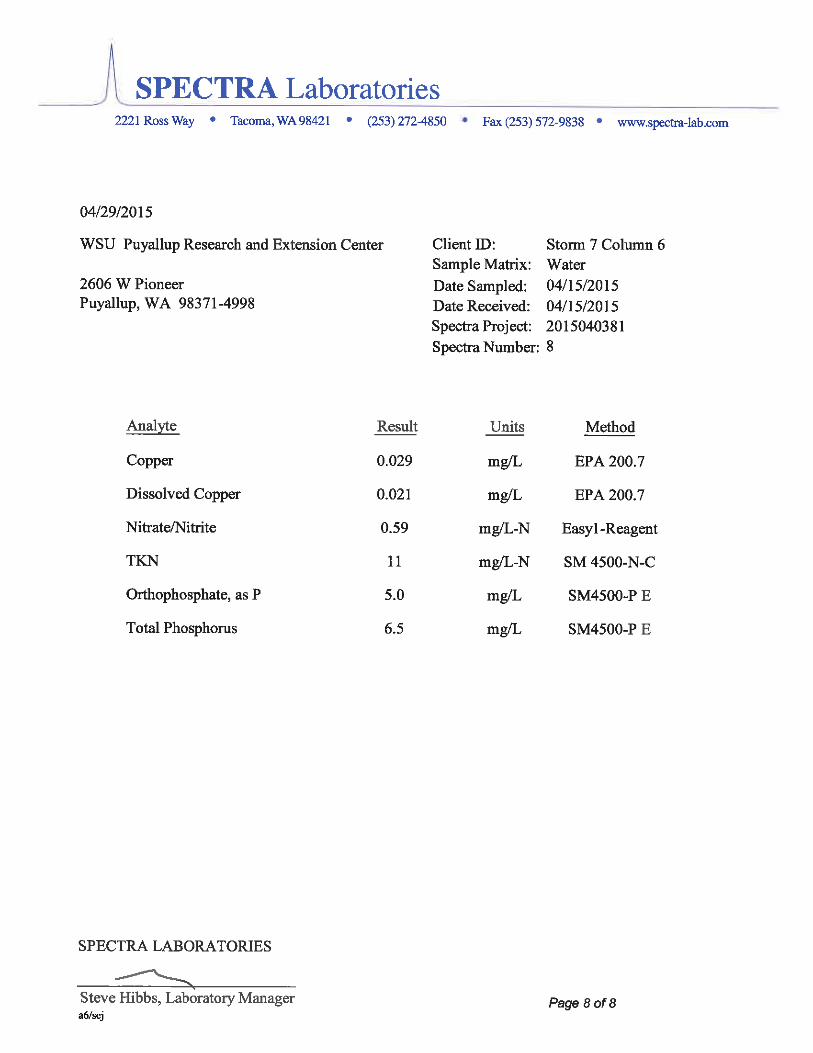
Analytical methods for the composite samples are summarized in Table 2. Analytical
Resources, Inc. (ARI) in Tukwila, WA, and Spectra Laboratories in Tacoma, WA, were the
contracting laboratories. ARI was used for the experiments with deionized water, Spectra
was used for the experiments involving stormwater. ARI and Spectra are certified by the
Washington State Department of Ecology. The samples were analyzed for total Kjeldahl
nitrogen (EPA 351.2), nitrate and nitrite (EPA 353.2), total and ortho-phosphorus (EPA
365.2), and total and dissolved copper (EPA 200.8). In EPA 200.8, total and dissolved
concentrations are differentiated by filtration through a 0.45 µm filter. The laboratory
provided reports containing sample and quality control data as well as a summary of
problems encountered during the analytical process. These reports are included in the
appendix.
15

Table 2: Analytical methods used for chemical analyses.
Analyte Method Holding Preservationc Reporting Limit/ Units
Numbera Timeb Resolution
Total Kjeldahl
nitrogen
EPA 351.2 28 days Cool to 4oC;
H2SO4 to pH<2
1.0 mg/L
Nitrate + nitrite
nitrogen
EPA 353.2 2 days Cool to 4oC;
H2SO4 to pH<2
0.200 mg/L
Total phosphorus EPA 365.2 28 days Cool to 4oC;
H2SO4 to pH<2
0.080 mg/L
Ortho-
phosphorus
EPA 365.2 2 days Cool to 4oC;
filter through
0.45 µm
0.040 mg/L
Copper, total EPA 200.8 6 months Cool to 4oC;
HNO3 to pH<2
0.5 µg/L
Copper, dissolved EPA 200.8 6 months Cool to 4oC;
filter through
0.45 µm;
HNO3 to pH<2
0.5 µg/L
a EPA method numbers are from US EPA (1971, 1993, and 1994).
b Holding time specified in EPA methods.
c Sample filtration and/or preservation will occur within 24 hours of sample collection.
16

Field and laboratory quality control procedures were employed for the nitrogen, phos-
phorus, and copper analyses. Field blanks were collected for the first four storm events. One
field blank per storm was collected from the deionized water carboys into the acid-washed
bottles used for samples. ARI and Spectra performed laboratory control spikes and method
blank analyses for each analyte for each set of samples. ARI and Spectra staff reviewed
the analytical results for errors and ensured that method and quality assurance procedures
were followed. The laboratory review was included in the analytical report.
We analyzed selected leachate samples with liquid-state 1H-NMR (Nuclear Magnetic
Resonance) and ATR-FTIR (Attenuated Total Reflectance-Fourier Transform Infrared
Spectroscopy). 1H-NMR spectra were acquired with 0.1 N NaOD in D2O at 399.764 MHz
and 303 K (Varian 400 MR equipped with a Varian One-NMR multi-tunable probe) at the
WSU NMR center. In addition to the compost leachate, a 100 mg/L humic acid standard
(1S102H, International Humic Substances Society) was used for comparison. The NMR
capillary contained 550 µl sample with an insert treated with trimethylsilyl propanoic acid
(TMSP, 2 mg/mL). The spectra were acquired using a spinning speed of 6 kHz, a saturation
frequency of -191.6 Hz, a relaxation delay of 2.5s, and a saturation delay of 2.2s. The spectra
were analyzed using Varian VnmrJ 3.2A software, and peak assignments and interpretations
are based on Sparks [1999] and Genest et al. [2014].
3.6 Chemical Speciation Modeling
Visual MINTEQ, version 3.1 [Gustafsson, 2010], was used to determine the speciation of
copper and to quantify interactions of copper with DOC. We used measured and estimated
ionic compositions of the outflow samples as inputs for the Visual MINTEQ modeling.
Measured input parameters were pH, NO−3 , PO3−4 , dissolved Cu, DOC, and estimated
parameters were major cations and anions (from measured concentrations in the stormwater
17

inflow). The stormwater used for these MINTEQ simulations was the stormwater spiked
with Cu to a total Cu concentration of 28 µg/L. The partial pressure of carbon dioxide was
fixed at 2 x 0.0032 atm. We used the Stockholm Humic Model (SHM) [Gustaffson, 2001] to
model the interaction of copper with DOC. This model employs the basic Stern Model as
the interface model. We simulated the effects of DOC concentrations and pH on copper
speciation and copper-DOC complexes. The pH (at constant DOC concentrations) was
varied from pH 6 to 8, and DOC concentrations were varied (at constant pH) from 0.01 to
1500 mg/L. Model outputs were the activities (concentrations) of different copper species.
3.7 Statistical Analysis
Statistical analysis was performed using the three replicates from each treatment. Analysis
of variance was carried out to determine significant differences in compost characteristics
between the treatments both before and after leaching (p < 0.05) [R Core Team, 2013].
18

4 Findings/Discussion
4.1 Compost Characteristics
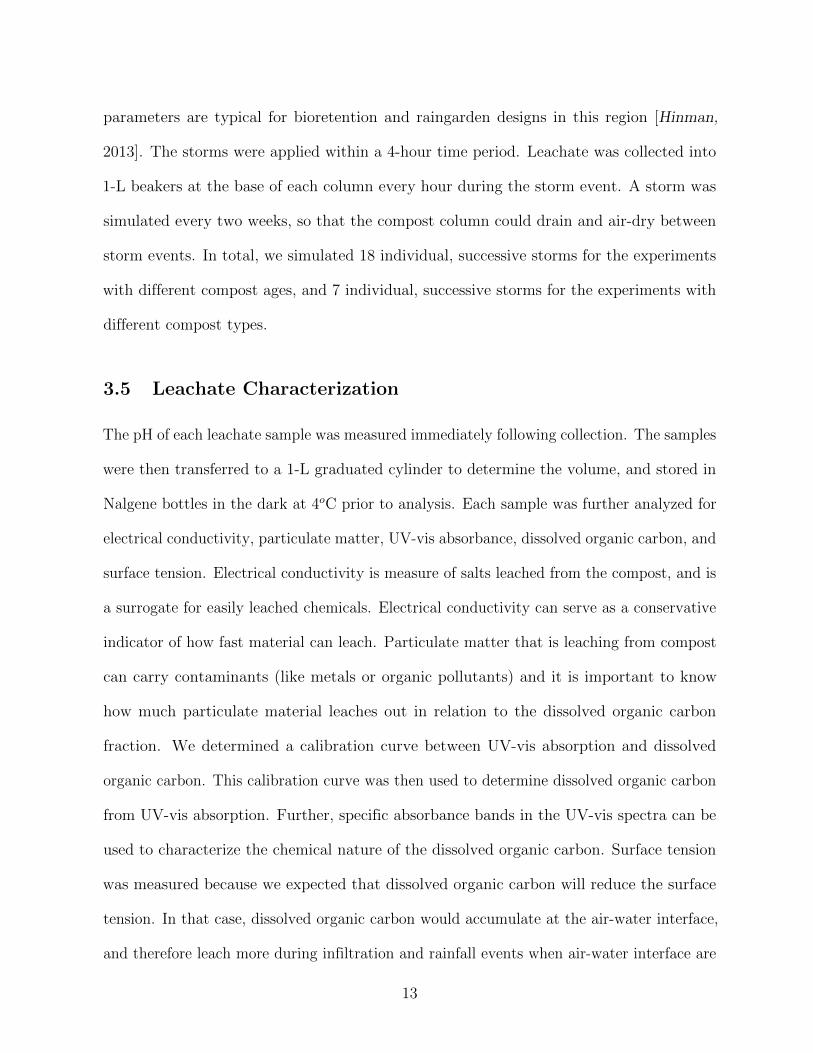
The results of the compost characterization are listed in Tables 3 and 4. Comparison between
the before-leaching and after-leaching values revealed statistically significant differences in
pH, EC, potassium, sodium, and boron. There was a noticeable reduction in EC, potassium,
sodium, and boron following the leaching experiment. These reductions were consistent
with our expectations, as monovalent alkali metals, potassium and sodium, are readily
exchanged with protons during leaching. The results of the Solvita Compost Emissions Test
revealed that the composts were mature. Each compost scored a 5 and a 6 on the ammonia
and the carbon dioxide emissions indices, respectively. These two numbers correspond to
the mature stage of the composting process [Woods End Laboratories, 2014].
19
Table 3: Chemical characteristics of the 6- and 24-month old Cedar Grove
compost at the beginning and the end of the leaching experiments.
Compost Age
6-Month Old Compost 24-Month Old Compost
Parameter Units Initial Final Initial Final
pH 6.7±0a,A 6.6±0.1B 6.4±0.1b,A 6.8±0.1B
Electrical Conductivity dS/m 2.75±0.26A 0.26±0.06B 2.8±0.73A 0.26±0.05B
Organic Matter g/kg 406±54 381±20 400±17 405±30
Organic Carbon (C) g/kg 205±38 191±27 206±10 213±21
Total Nitrogen (N) g/kg 14±2 13±1 15.6±0.3 15±1
Total Iron (Fe) g/kg 16±1.7 15.6 ±1.1 17±1.1 18± 1.7
Total Phosphorus (P) g/kg 2.9±0.6 2.5±0.3 2.7±0.1 2.7±0.4
Total Potassium (K) g/kg 7.3±0.9A 1.4±0.2B 6.9±0.1A 1.5±0.2B
Total Calcium (Ca) g/kg 20±0a 20±1.4 19±0.6b 20.1±2.6
Total Magnesium (Mg) g/kg 5.8±0.8 5.2±0.1 5.8±0.3 6.1±0.3
Total Sodium (Na) g/kg 1.5±0.2a,A 0.3±0.1B 0.9±0.6b,A 0.3±0.6B
Total Sulfur (S) g/kg 1.8±0.2 1.7±0.1 2.1±0.6 2±0.3
Total Boron (B) mg/kg 10.3±2.7A 5.2±0.7B 11.4±0.6A 4.2±0.6B
Total Zinc (Zn) mg/kg 183±12 194 ±10 193±5 213 ±30
Total Manganese (Mn) mg/kg 464±34 504±22 476±11 533±51
Total Copper (Cu) mg/kg 45±4 64±21 50±2 122±65
C/N Ratio − 14.3±0.7 14.3±0.5 13.1±0.4A 14.3±0.3B
Superscripts indicate a significant difference, while the absence of
a superscript indicates no difference.
a,b denotes significant difference between initial 6- and 24-month old compost.
A,B denotes significant difference before and after the leaching experiments within
the 6- and 24-month old compost.
20

Table 4: Chemical composition of Royal Classics and Silver Springs composts
used in the experiment.
Parameter Royal Classics Silver Springs
pH 6.6† ± 0.1 (a)‡ 8.4 ± 0.3 (b)
Electrical conductivity (dS/m) 4.9 ± 0.6 4.3 ± 0.3
Organic matter (g/kg) 368 ± 9 374 ± 9
C : N ratio 10 ± 0.0 12 ± 0.6
Total N (g/kg) 19 ± 1 16 ± 1
Ammonium N (mg/kg) 7 ± 2 (a) 2058 ± 57 (b)
Nitrate N (mg/kg) 1590 ± 356 (a) 28 ± 8 (b)
Phosphorus (g/kg) 2.9 ± 0.4 3.3 ± 0.3
Potassium (g/kg) 12 ± 1 11 ± 1
Calcium (g/kg) 15 ± 0 14 ± 2
Magnesium (g/kg) 4.9 ± 0.1 5.0 ± 0.4
Sulfate-S (mg/kg) 371 ± 98 (a) 170 ± 13 (b)
Iron (g/kg) 13.7 ± 0.4 13.6 ± 0.3
Chloride (mg/kg) 2250 ± 153 (a) 3176 ± 277 (b)
Manganese (mg/kg) 412 ± 21 401 ± 21
Zinc (mg/kg) 146 ± 29 146 ± 12
Copper (mg/kg) 42 ± 4 43 ± 3
Sodium (g/kg) 0.9 ± 0.0 (a) 0.7 ± 0.1 (b)
†Values represent mean ± standard deviation (n = 3)
‡Values followed by different letters in a row are significantly different at p < 0.05
21
4.2 13C-Nuclear Magnetic Resonance (NMR) and Fourier Trans-
form Infrared Spectroscopy (FTIR)
Figure 3 shows the 13C-NMR spectra of the Cedar Grove composts (the spectra for the
Royal Organic and Silver Springs composts were similar to the Cedar Grove compost and
are therefore not shown). The spectra for the 6- and 24- month composts showed the
same peaks, which are typical of municipal compost [Wilson et al., 1981; Spaccini and
Piccolo, 2008]. The major peaks in our spectra occurred in the aliphatic (0-110 ppm) and
the carboxyl regions (160-190 ppm). The most intense peak at 78.2 ppm is associated with
the C2, C3, and C5 carbons of cellulose. The peaks at 159.6 and 177.4 ppm indicate carbons
of phenolic and carboxylic functional groups, respectively [Wilson et al., 1981; Genest et al.,
2014; Gao et al., 2015]. The spectra reveal a predominance of ligno-cellulose and recalcitrant
aliphatic compounds (29.6 and 35.2 ppm) [Spaccini and Piccolo, 2008; Genest et al., 2014].
Overall, the NMR spectra indicate minimal difference in the molecular structure of the
composts.
Figure 4 shows the FTIR spectra of the Cedar Grove composts (the spectra for the
Royal Organic and Silver Springs composts were similar to the Cedar Grove compost and
are therefore not shown). The spectra of the composts had absorbance bands in the same
wavenumber regions. Main absorbance bands occurred at 3280, 2924, 2853, 1590, 1505, 1416,
1265, 1028, and 646 cm−1. The most intense band in the 6- and 24-month compost occurred
at 1024 and 1028 cm−1, respectively. Absorbance at these wavenumbers is associated with
C-O stretching of polysaccharides [Carballo et al., 2008; Smidt et al., 2011; Wang et al.,
2013; Provenzano et al., 2014].
22

Figure 3: 13C-NMR spectra from (a) 6-month and (b) 24-month old Cedar
Grove compost. Structural groups were assigned according to Spaccini and Piccolo
[2008]. Spectra are offset for clarity.
Figure 4: FTIR transmittance spectra from (a) 6-month and (b) 24-month old
Cedar Grove compost. Spectra are offset for clarity.
23

The spectra show a shallow band around 3280 cm−1, associated with O-H stretching
of bonded and non-bonded hydroxyl groups [Smidt et al., 2011; Higashikawa et al., 2014;
Provenzano et al., 2014]. This band has also been associated with phenolic OH and with
phenol, alcohol, and carboxyl groups [Ouaqoudi et al., 2014]. The presence of phenol and
carboxyl groups is further supported by the band at 1416 cm−1, which is associated with
the C-O stretching of carboxylic acids [Smidt et al., 2011; Wang et al., 2013; Ouaqoudi
et al., 2014].
The presence of aliphatic C-H stretching was indicated by weak bands at 2924 and
2853 cm−1 [Huang et al., 2006; Ouaqoudi et al., 2014; Provenzano et al., 2014]. These
wavenumbers correspond to the asymmetric and symmetric C-H stretching of methyl and
methylene groups [Smidt et al., 2011; Fels et al., 2014]. The intensity of bands at 2924 and
2853 cm−1 have been shown to decrease during the composting process. In mature compost,
these aliphatic methylene bands indicate the presence of recalcitrant biomolecules such as
long chain fatty acids and waxes [Smidt et al., 2011; Ouaqoudi et al., 2014].
The presence of aromatic groups was indicated by absorbances at 1590, 1505, and
1265 cm−1. The band at 1590 cm−1 is associated with C=C vibration of aromatic carbon
[Carballo et al., 2008; Smidt et al., 2011], and the band at 1505 cm−1 indicates the
C=C vibration of lignin and lignocellulosic materials [Carballo et al., 2008; Smidt et al.,
2011; Ouaqoudi et al., 2014]. The band at 1265 cm−1 has been attributed to aromatic
carbon and C-O stretching [Huang et al., 2006; Provenzano et al., 2014].
The FTIR spectra support the structural information obtained from the 13C-NMR
spectra. The spectra indicate the presence of aliphatic, aromatic, and carboxylic functional
groups, as well as lignin. The 13C-NMR and FTIR spectra suggest that there was no
significant difference between the molecular structure of the organic matter of the composts.
24
4.3 Dynamics of pH, Dissolved Organic Carbon, and Electrical
Conductivity in Leachate
Figure 5 shows a comparison of the leachate dynamics between the two Cedar Grove
composts (the leaching patterns for the Royal Organic and Silver Spring composts was
similar to the Cedar Grove compost, and the data are therefore not shown). Overall, the
pH of the leachate from both treatments increased during the first few storms, but leveled
off as the leaching continued (Figure 5a). The initial pH of the leachate samples of both
treatments was 6.5. In the subsequent samples until 600 mm cumulative flux, the pH
increased, and then leveled off at a pH between 7.5 and 7.8.
The electrical conductivity of leachates from both treatments followed a decreasing
trend as leaching progressed (Figure 5b). The initial electrical conductivities were higher in
the 24-month treatment than in 6-month treatment. Electrical conductivities were elevated
for the first two to three storms, corresponding to about 500 mm cumulative flux, and
then dropped below 1 dS/m. Each storm was characterized by a distinct peak in electrical
conductivity followed by a continuous decrease in electrical conductivity as the storm
progressed.
The DOC concentrations peaked between 400 and 600 mg/L during the first two
storms (Figure 5c). At the initiation of the third storm, the DOC concentrations increased
to greater than 1000 mg/L. After the spike of the third storm, the DOC concentrations
decreased with each successive storm. Each storm was characterized by a distinct peak
in DOC followed by a continuous decrease in DOC as the storm progressed. The peaks
of successive storms decreased continuously, similar to, but more gradual than what was
observed for the electrical conductivity.
25
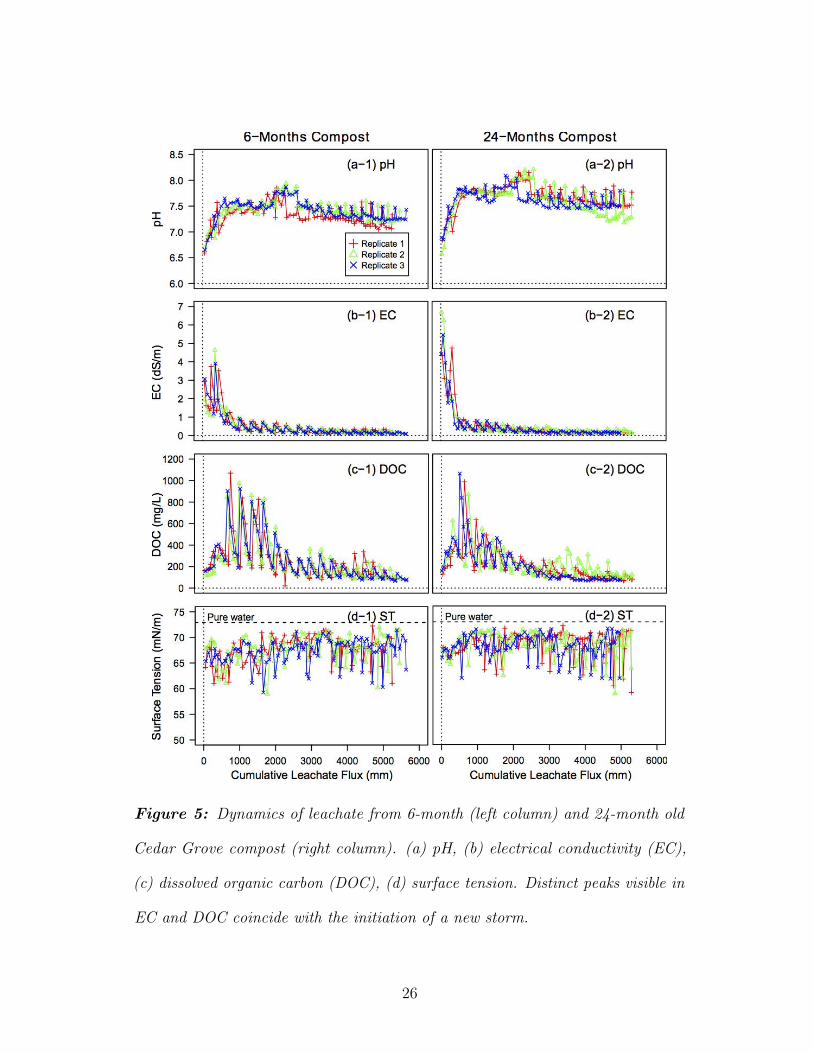
Figure 5: Dynamics of leachate from 6-month (left column) and 24-month old
Cedar Grove compost (right column). (a) pH, (b) electrical conductivity (EC),
(c) dissolved organic carbon (DOC), (d) surface tension. Distinct peaks visible in
EC and DOC coincide with the initiation of a new storm.
26
Surface active compounds, i.e., DOM, decreased the surface tension of the leachate
compared to that of the influent. We hypothesized that the dynamics of the surface tension
would follow the same pattern as observed for the DOC. Over the course of the experiment,
the surface tension of the leachate from both treatments varied between 60 and 72 mN/m
(Figure 5d); however, there was no temporal trend. This indicates continued mobilization of
surface active compounds, but no distinct temporal pattern, contrary to what was seen in
case of EC and DOC. There was no correlation of surface tension within individual storms.
Similar to the pattern seen in the DOC dynamics, the particulate concentrations for
each size fraction (11, 1, and 0.45 µm) reached a peak after the first few storms (Figure 6).
After reaching this peak, the particulate concentration in both treatments decreased with
each successive storm. As observed for both the electrical conductivity and DOC, each
storm was characterized by a distinct peak in particulate concentration followed by a
continuous decrease as the storm progressed. The peaks of successive storms decreased
continuously.
The particulate concentrations for each size fraction were less in the 24-month old
compost than in the 6-month old compost. The majority of particulates in both treatments
were retained on the 1 µm filter, indicating that the particulates of 1 to 11 µm in diameter
were the dominant fraction leached (on a mass basis).
27
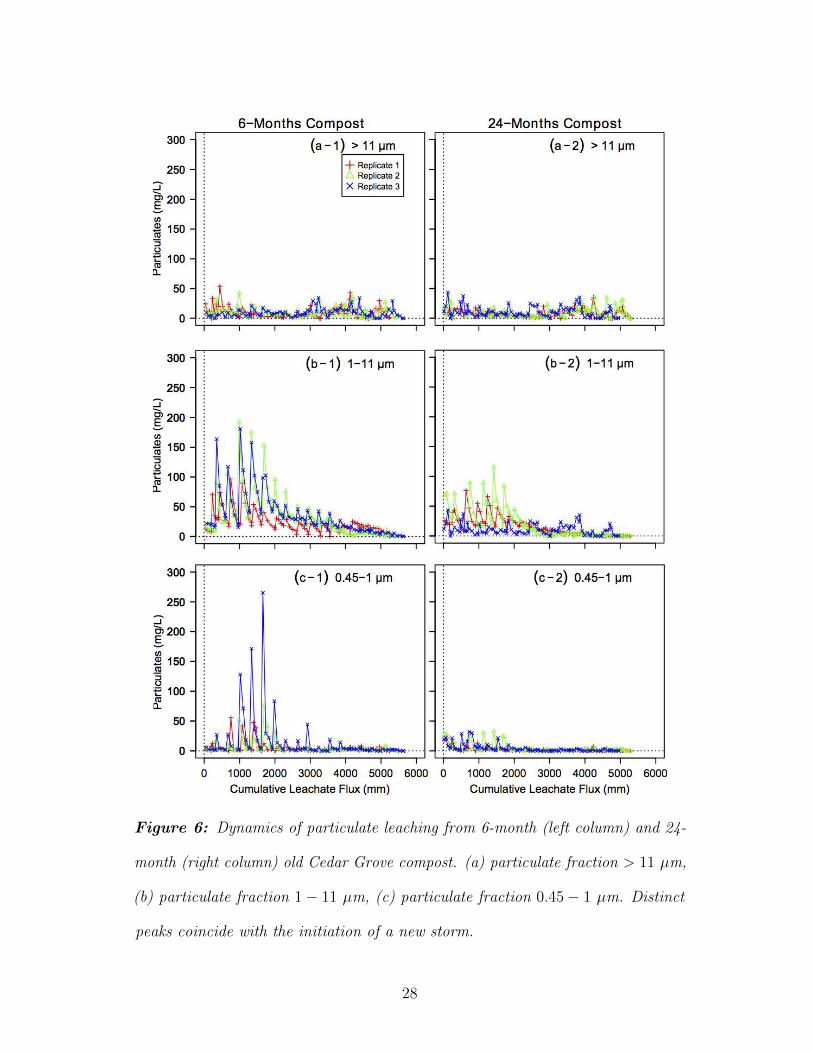
Figure 6: Dynamics of particulate leaching from 6-month (left column) and 24-
month (right column) old Cedar Grove compost. (a) particulate fraction > 11 µm,
(b) particulate fraction 1 − 11 µm, (c) particulate fraction 0.45 − 1 µm. Distinct
peaks coincide with the initiation of a new storm.
28
4.4 1H-Nuclear Magnetic Resonance (NMR) and Fourier Trans-
form Infrared Spectroscopy (FTIR) of Leachate
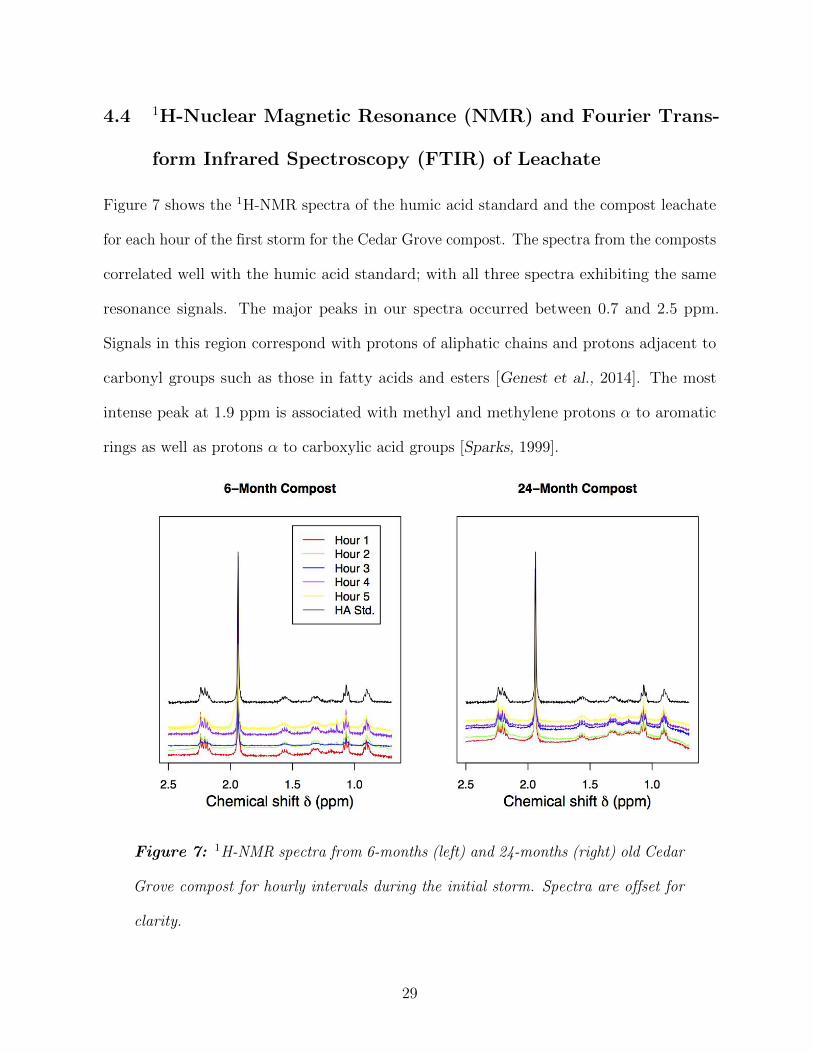
Figure 7 shows the 1H-NMR spectra of the humic acid standard and the compost leachate
for each hour of the first storm for the Cedar Grove compost. The spectra from the composts
correlated well with the humic acid standard; with all three spectra exhibiting the same
resonance signals. The major peaks in our spectra occurred between 0.7 and 2.5 ppm.
Signals in this region correspond with protons of aliphatic chains and protons adjacent to
carbonyl groups such as those in fatty acids and esters [Genest et al., 2014]. The most
intense peak at 1.9 ppm is associated with methyl and methylene protons α to aromatic
rings as well as protons α to carboxylic acid groups [Sparks, 1999].
Figure 7: 1H-NMR spectra from 6-months (left) and 24-months (right) old Cedar
Grove compost for hourly intervals during the initial storm. Spectra are offset for
clarity.
29
The signals at 0.9 and 1.07 ppm are associated with the protons of terminal methyl
groups and methylene chains, respectively. Genest et al. [2014] identified similar signals at
0.9 and 1.05 ppm as protons from terminal and chain methyl groups of aliphatic compounds
composing plant cuticles and microbial lipids. The signals at 1.07 and 1.3 ppm indicate
protons of methylene chains within two carbons of a ring or polar group, and the signal
at 1.55 ppm represent protons specific to alicyclic carbon structures [Sparks, 1999]. In
summary, the leachate 1H-NMR spectra do not indicate a change in the functional group
composition of the organic matter over the course of an individual storm.
The FTIR spectra of the leachates of different composts were similar (Figure 8). The
main absorbance bands for both leachates occurred at 3300, 2360, 2330, 1635, 660, and
600 cm−1. The broad FTIR peak at 3300 cm−1 is associated with O-H hydroxyl bonds of
organics and water. Absorbance at this band was likely dominated by water. The leachates
showed bands at 1635 cm−1, which are typically associated with vibrational C=C bonds
in aromatic structures as well as vibrational C=O bonds in amides, ketones, esters, and
carboxylic acids [Smidt and Meissl, 2007; Carballo et al., 2008; Smidt et al., 2011; Wang
et al., 2013; Ouaqoudi et al., 2014; Higashikawa et al., 2014]. There were no differences
over the course of a storm.
The leachate FTIR confirmed the presence and mobility of the organic and inorganic
constituents identified in the compost. The results of the leachate FTIR analysis also
complemented the 1H-NMR spectra as both revealed signals corresponding to aromatic and
carbonyl groups.
30

Figure 8: FTIR transmittance spectra from 6-month and 24-month old Cedar
Grove compost. Spectra are offset for clarity.
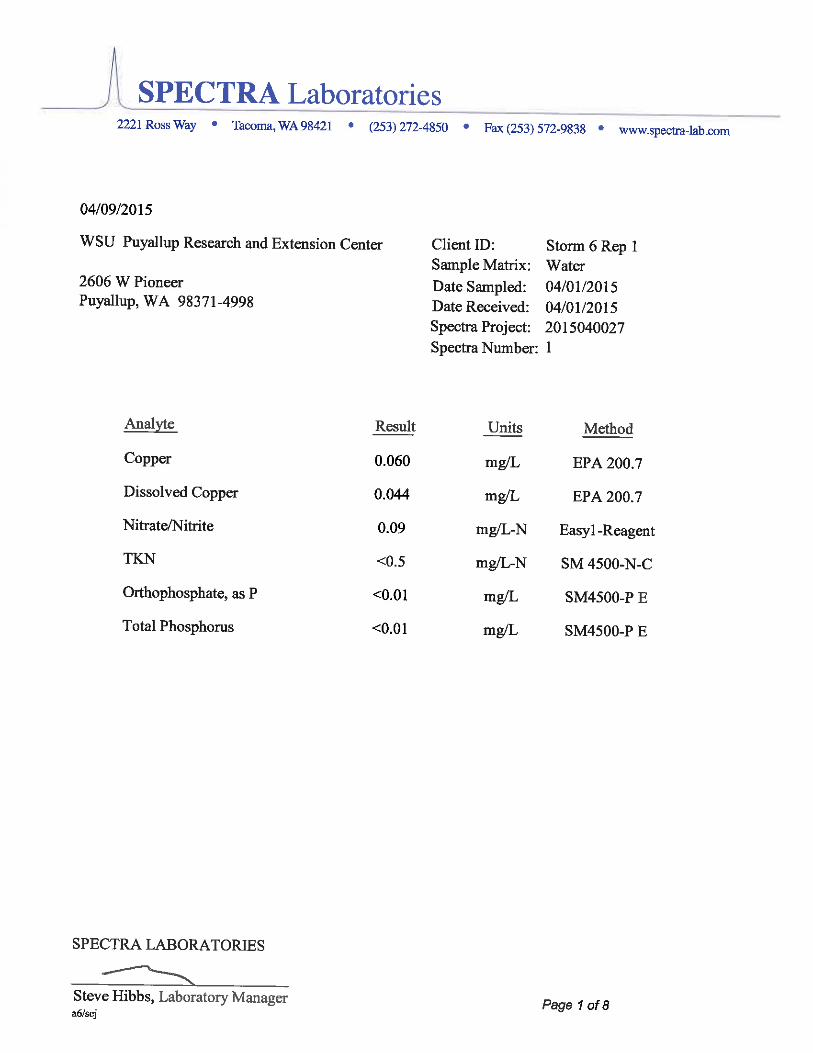
4.5 Nitrogen, Phosphorus, and Copper Dynamics
Figures 9 (experiments with using deionized water as influent) and 10 (experiments using
copper-spiked stormwater as the influent) show the average concentrations of nitrogen,
phosphorus, and copper in the leachate samples. The data represent concentrations in
composite samples for selected storms. Due to the gradual decline of concentrations, we did
not analyze each storm, but skipped several storms in the later part of the experiment.
The majority of nitrate/nitrite was leached within the first three storms. The 24-month
old Cedar Grove compost leached a significantly higher concentration of nitrate/nitrite than
the 6-month old Cedar Grove compost (334 mg N/L vs. 72 mg N/L) during the first storm,
and so did the Royal Organics compost. There was a pronounced decrease in nitrate/nitrite
concentration between storm 1 and storm 2. Although the nitrate/nitrite concentration
decreased considerably after four storms, there was a sustained leaching of nitrate/nitrite
on the order of 1 to 10 mg N/L.
31

Figure 9: Concentrations of nitrogen, phosphorus, and copper in the leachate
from 6-month and 24-month old Cedar Grove compost for successive storms using
deionized water as the influent. In the later part of the experiment, not all storms
were analyzed, as indicated by the gaps in the storm number sequence. Significant
differences between 6-month and 24-month old compost are denoted by an asterisk
(p = 0.05). Error bars represent ± one standard deviation.
32
1 2 3 4 5 6 7
Royal ClassicsSilver Springs
0
50
100
150
200
250
Storm number
Nitr
ate
+ N
itrite
(mg/
L) *
** * * *
1 2 3 4 5 6 70
50
100
150
200
250
Storm number
TKN
(mg/
L)
*
1 2 3 4 5 6 70
10
20
30
40
50
Storm number
Tota
l P (m
g/L)
*
1 2 3 4 5 6 70
10
20
30
40
50
Storm number
Ort
ho P
(mg/
L)
*
1 2 3 4 5 6 70.00
0.05
0.10
0.15
0.20
0.25
Storm number
Tota
l Cu
(mg/
L)
* *
1 2 3 4 5 6 70.00
0.05
0.10
0.15
0.20
0.25
Storm number
Dis
solv
ed C
u (m
g/L)
** * *
Figure 10: Nutrient and trace metal concentrations in composite samples for
successive storms from Royal Organic and Silver Springs composts using copper-
spiked stormwater as the influent. Horizontal black lines indicate the nutrient and
trace metal concentration in the influent stormwater.
33

Total Kjeldahl nitrogen represents the organically-bound nitrogen and ammonia in
the leachate. During each storm the 6-month old Cedar Grove compost leached a higher
concentration of Kjeldahl nitrogen than the 24-month old compost (Figure 9b). In the
later part of the experiment, significantly more nitrogen (both nitrate/nitrite and Kjeldahl
nitrogen) was leached from the 6-month compost compared with the 24-month compost.
This is consistent with more nitrogen-mineralization occurring in the younger compost
during the course of the experiment.
Most of the phosphorus leached was in the form of ortho-phosphorus in both the
deionized water and the stormwater experiments (Figures 9 and 10). Ortho-phosphorus is
the inorganic, plant available form of phosphorus that is associated with excessive plant
and algal growth. This is a concern for receiving waters as excess plant growth depletes the
dissolved oxygen required for other aquatic life. During the first two storms, significantly
more phosphorus leached from the 24-month compared to the 6-month old compost. After
storm 2, there was a steady decrease in phosphorus concentrations; however, sustained
leaching of phosphorus was observed at concentrations of 4 to 15 milligrams of phosphorus
per liter.
The majority of copper leached was in the dissolved phase for both the deionized water
and the stormwater experiments (Figures 9 and 10). The largest portion of copper leached
within the first five to six storms. This was likely the labile fraction of copper leaching out.
For the deionized water experiments, where no copper was present in the inflow, copper
was exported from the compost and leached out (Figure 9). The final leachate concentrations
from the Cedar Grove composts exceeded the allowable discharge level of 14 µg Cu/L
for Western Washington [Washington State Department of Ecology, 2014]. The observed
total copper concentrations, however, were far below the National Recommended Water
Quality Criteria (NRWQC) for human health (1,300 µg Cu/L), but exceeded the saltwater
34

NRWQC for aquatic life (4.8 and 3.1 µg Cu/L for acute and chronic exposure, respectively)
[USEPA, 2014]. However, the copper concentrations observed in our experiment may not
be toxic due to the presence of elevated DOC, as it is known that DOC readily forms
complexes with dissolved copper [McBride, 1994], thereby reducing its toxicity to aquatic
organisms [Linbo et al., 2009; USEPA, 2014]. Chemical complexation is affected by pH,
ionic strength, alkalinity, and ionic composition of the aqueous solution. The MINTEQ
model does consider all these effects in combination (see results of the modeling below). To
highlight the complexation, we plotted copper vs. DOC concentrations (Figure 11). This
plot revealed a significant linear correlation between dissolved copper and DOC in the
leachate from both composts (p < 0.05). It is likely that most of the dissolved copper was
complexed with DOC. It also has to be considered that during compost applications to the
environment, plants and soil fauna will interact with compost and its leachate, potentially
changing the dynamics of DOC leaching and copper complexation.
For the experiments where copper was spiked to the stormwater, the data show an
interesting trend (Figure 10). During the first few storms, a net export of copper was
observed, but at the later storms, copper was retained in the bioretention systems. This is
likely related to the elevated concentrations of DOC leaching in the first few storms. The
first few storms generated the highest DOC concentrations, thereby having the greatest
potential to complex and mobilize copper. It is also likely that the copper leached with the
first few storms was the most labile form of copper, associated with readily leachable DOC.
As this readily leachable DOC is removed from the compost during the first few storms,
compost starts to act as a sink for copper. Copper in later storms will sorb to non-leachable
organic matter in compost.
35

Figure 11: Correlation of dissolved copper with DOC in 6-month and 24-month
old Cedar Grove compost using deionized water as influent. The bracketed data
are considered outliers and were excluded from the linear regression.
In the case where stormwater containing copper was used for the irrigation, the data
show an interesting trend (Figures 10). During the first few storms, a net export of copper
was observed, but at the later storms, copper was retained in the bioretention systems.
This is likely related to the elevated concentrations of DOC leaching in the first few storms.
4.6 Mass Balance of C, N, P, and Cu
Table 5 shows the percentage of carbon, nitrogen, phosphorus, and copper that leached
from the Cedar Grove composts for the experiment using deionized water as influent. The
6-month compost leached a significantly greater percentage of both dissolved and particulate
carbon than the 24-month compost. For both composts, the DOC leached was an order
of magnitude greater than the particulate carbon. These results are consistent with the
observed leaching of DOC (Figure 5c) and particulate concentrations (Figure 6). This also
36
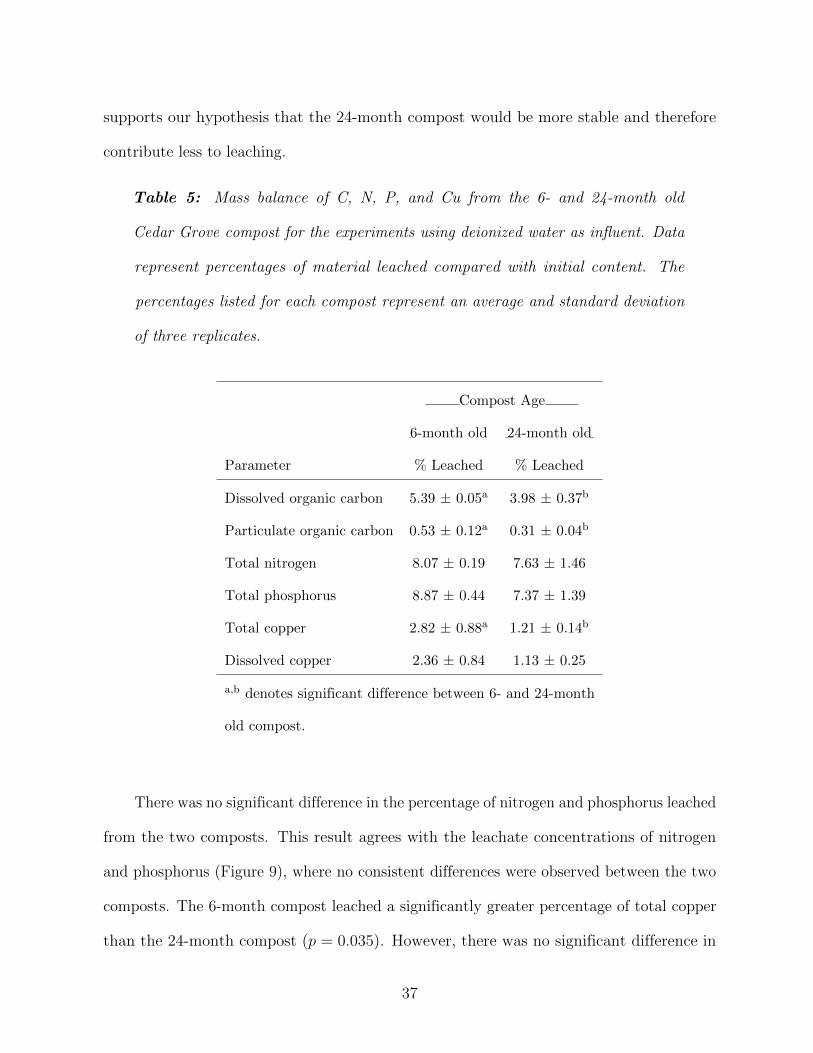
supports our hypothesis that the 24-month compost would be more stable and therefore
contribute less to leaching.
Table 5: Mass balance of C, N, P, and Cu from the 6- and 24-month old
Cedar Grove compost for the experiments using deionized water as influent. Data
represent percentages of material leached compared with initial content. The
percentages listed for each compost represent an average and standard deviation
of three replicates.
Compost Age
6-month old 24-month old
Parameter % Leached % Leached
Dissolved organic carbon 5.39 ± 0.05a 3.98 ± 0.37b
Particulate organic carbon 0.53 ± 0.12a 0.31 ± 0.04b
Total nitrogen 8.07 ± 0.19 7.63 ± 1.46
Total phosphorus 8.87 ± 0.44 7.37 ± 1.39
Total copper 2.82 ± 0.88a 1.21 ± 0.14b
Dissolved copper 2.36 ± 0.84 1.13 ± 0.25
a,b denotes significant difference between 6- and 24-month
old compost.
There was no significant difference in the percentage of nitrogen and phosphorus leached
from the two composts. This result agrees with the leachate concentrations of nitrogen
and phosphorus (Figure 9), where no consistent differences were observed between the two
composts. The 6-month compost leached a significantly greater percentage of total copper
than the 24-month compost (p = 0.035). However, there was no significant difference in
37

the leaching of dissolved copper (p = 0.072). About 90% of the leached copper was in the
dissolved form. The 6-month compost leached just under 3% of the original total copper
content, while the 24-month compost leached just above 1%. This low percentage of copper
leached is supported by the findings of Christensen and Tjell [1984b], who noted that only
0.1 to 1.9% of original heavy metal content leached from their compost lysimeters. The
mass balance of copper in our study shows that the majority of the original copper content
remained in the compost. This, combined with the relatively stable leachate concentrations
of copper in later storms (Figure 9e,f), shows that compost can be a source for continuous
copper export. As mentioned earlier, the copper in the leachate is most likely complexed
with DOC [Kaschl et al., 2002; Chen et al., 2010], which mitigates its toxicity to aquatic
organisms.
Table 6 shows the percentage of carbon, nitrogen, phosphorus, and copper that leached
from the Royal Classic and Silver Springs composts for the experiment using copper-spiked
stormwater as influent. The amount of organic carbon leached was similar between the two
compost and comparable to the data from the experiments with Cedar Grove compost. Royal
Classic compost leached more total nitrogen but less phosphorus than Silver Springs. A
higher percentage of copper leached from these experiments as compared to the experiments
with the deionized water. We suspect that this is because most of the copper in the
stormwater will form organic complexes with the DOC from compost and leach out of the
columns.
38
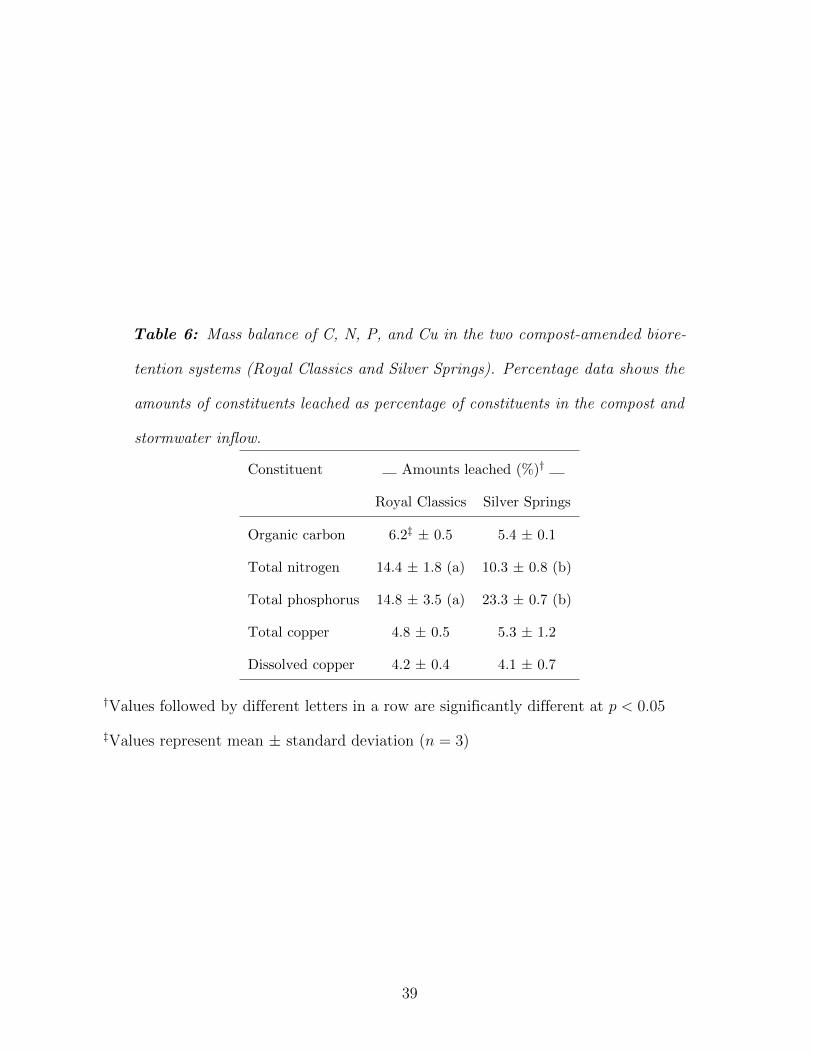
Table 6: Mass balance of C, N, P, and Cu in the two compost-amended biore-
tention systems (Royal Classics and Silver Springs). Percentage data shows the
amounts of constituents leached as percentage of constituents in the compost and
stormwater inflow.
Constituent Amounts leached (%)†
Royal Classics Silver Springs
Organic carbon 6.2‡ ± 0.5 5.4 ± 0.1
Total nitrogen 14.4 ± 1.8 (a) 10.3 ± 0.8 (b)
Total phosphorus 14.8 ± 3.5 (a) 23.3 ± 0.7 (b)
Total copper 4.8 ± 0.5 5.3 ± 1.2
Dissolved copper 4.2 ± 0.4 4.1 ± 0.7
†Values followed by different letters in a row are significantly different at p < 0.05
‡Values represent mean ± standard deviation (n = 3)
39
4.7 Copper Speciation Modeling
Copper forms various organic and inorganic complexes. It is important to determine
these different complexes, because not all forms of copper are toxic to aquatic life. The
most toxic form of copper is the free copper or cupric ion (Cu2+), followed by copper
hydroxide complexes [Magnuson et al., 1979]. Copper also forms dissolved complexes with
organic substances (Cu-Fulvic acid-Cu) and inorganic ions (CuCl+, CuCO3 (aq)), and these
complexes are not toxic [Seligman and Zirino, 1998].
We conducted chemical speciation modeling with MINTEQ to determine the forms of
copper and copper-DOC complexes in the stormwater and leachate from our experiments.
As input parameters for the MINTEQ modeling, we used the solution chemistry measured
from our leachates from the experiments with the copper-spiked stormwater as influent.
In our bioretention leachate at pH 7, the major aqueous copper species were organic
Cu species and the inorganic species Cu2+, CuOH+, Cu(OH)2 (aq), Cu2(OH)2+2 , CuCl+,
CuCO3 (aq), and CuHCO+3 . The first four of the inorganic copper species are toxic to
aquatic organisms, the latter three are non-toxic [Magnuson et al., 1979]. In the presence
of DOC (fulvic acid, FA), copper formed the following organic complexes: FA2Cu (aq),
FACu+ (aq), FA2CuOH with small amounts of FA-Cu+2G (aq). The FA2Cu (aq) and
FA2CuOH are the organically complexed Cu-bidentate complexes, while FACu+ (aq) is the
organically complexed Cu-monodentate complex.
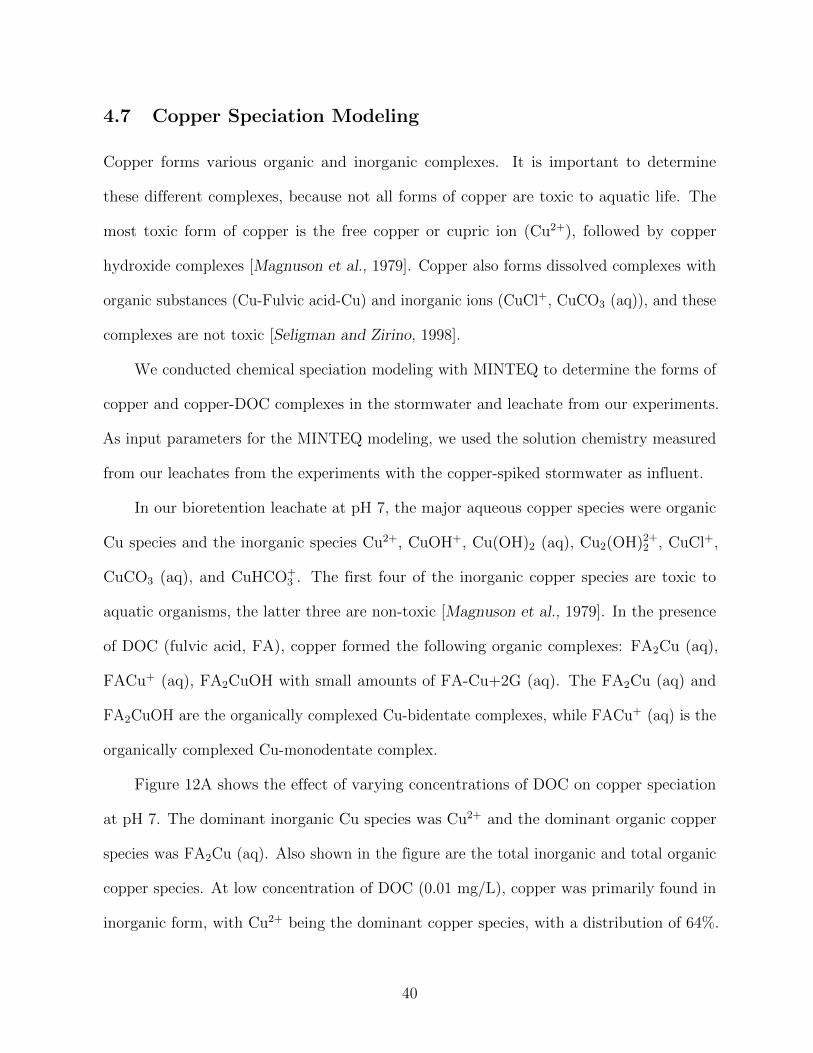
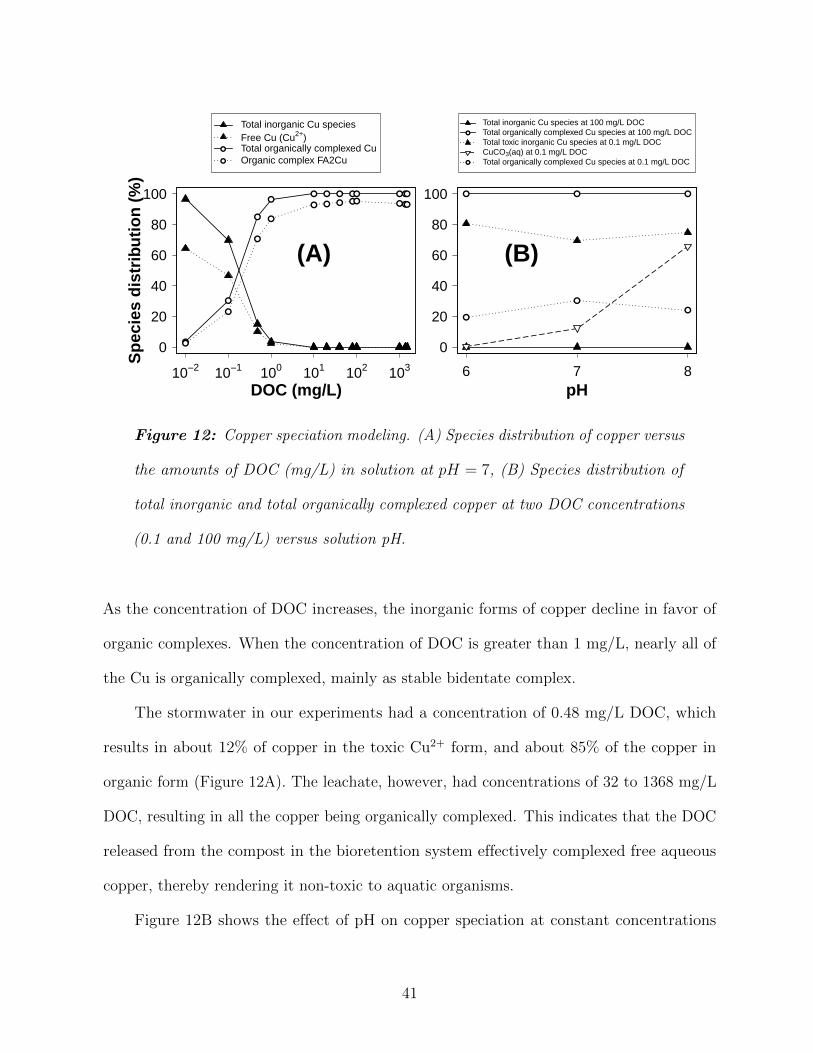
Figure 12A shows the effect of varying concentrations of DOC on copper speciation
at pH 7. The dominant inorganic Cu species was Cu2+ and the dominant organic copper
species was FA2Cu (aq). Also shown in the figure are the total inorganic and total organic
copper species. At low concentration of DOC (0.01 mg/L), copper was primarily found in
inorganic form, with Cu2+ being the dominant copper species, with a distribution of 64%.
40
10−2 10−1 100 101 102 103
DOC (mg/L)
0
20
40
60
80
100
Spec
ies
dist
ribut
ion
(%)
●
●
●
●● ● ● ●● ●●●
●
●
●
●
● ● ● ●● ●●●
●
●
Total inorganic Cu speciesFree Cu (Cu2+)Total organically complexed CuOrganic complex FA2Cu
(A)
6 7 80
20
40
60
80
100
pH
● ● ●
●
●
●
●
●
Total inorganic Cu species at 100 mg/L DOCTotal organically complexed Cu species at 100 mg/L DOCTotal toxic inorganic Cu species at 0.1 mg/L DOCCuCO3(aq) at 0.1 mg/L DOCTotal organically complexed Cu species at 0.1 mg/L DOC
(B)
Figure 12: Copper speciation modeling. (A) Species distribution of copper versus
the amounts of DOC (mg/L) in solution at pH = 7, (B) Species distribution of
total inorganic and total organically complexed copper at two DOC concentrations
(0.1 and 100 mg/L) versus solution pH.
As the concentration of DOC increases, the inorganic forms of copper decline in favor of
organic complexes. When the concentration of DOC is greater than 1 mg/L, nearly all of
the Cu is organically complexed, mainly as stable bidentate complex.
The stormwater in our experiments had a concentration of 0.48 mg/L DOC, which
results in about 12% of copper in the toxic Cu2+ form, and about 85% of the copper in
organic form (Figure 12A). The leachate, however, had concentrations of 32 to 1368 mg/L
DOC, resulting in all the copper being organically complexed. This indicates that the DOC
released from the compost in the bioretention system effectively complexed free aqueous
copper, thereby rendering it non-toxic to aquatic organisms.
Figure 12B shows the effect of pH on copper speciation at constant concentrations
41

of DOC of 0.1 and 100 mg/L. At high DOC concentrations (100 mg/L), all copper was
organically complexed, regardless of pH (solid lines). At low DOC concentrations (0.1 mg/L),
there is substantial presence of toxic inorganic copper species, concentrations of which
decrease with increasing pH (80% at pH 6, 9% at pH 8). This decrease in toxic inorganic
Cu forms with increasing pH was balanced by formation of CuCO3 (aq). However, pH
fluctuations had no effect on the concentrations of organic copper complexes. This indicates
that when the DOC is high (100 mg/L), pH fluctuations do not affect the distribution of
toxic Cu species. However, at low DOC (0.1 mg/L), an increase in pH decreases the Cu
toxicity by formation of CuCO3 (aq). Overall, high pH and high DOC concentrations are
conducive for reduced Cu toxicity to aquatic organisms.
5 Conclusions
Our results suggest that, in general, leachate concentrations from mature compost decrease
over the course of individual rainstorms as well as following successive storms. However, we
observed that this overall decline was not smooth, as the initiation of each storm mobilized
a new peak of constituent concentrations in the leachate. The pattern of decline also
depends on the constituent, and can be rapid as in the case of EC and nitrate/nitrite, or
slow and less pronounced as in the case of DOC, total Kjeldahl nitrogen, and copper. The
elevated leachate concentrations from both composts at the beginning of the experiment
and the beginning of each new rainstorm suggest that leaching from mature compost is less
a function of age and type, but more a function of leaching history. Concentrations of DOC
in initial storms readily reach several hundreds of milligrams DOC per liter. Even after
several storms, DOC concentrations in the leachate remain in the order of several tenths
of milligrams per liter. At such high DOC concentrations, copper is effectively complexed
with DOC and organic copper complexes are formed.
42

6 Recommendations/Applications/Implementation
Compost contains significant amounts of organic carbon, nitrogen, phosphorus and copper.
Both 6-month and 24 month old composts subjected to 6 month 24 hour simulated rain
events leached organic carbon, nitrogen, phosphorus. Nitrogen leached in both organic and
inorganic forms. Phosphorus found in the leachate was mostly in form of ortho-phoshorus,
which is the form of phosphorus readily available to organisms and which contributes
to eutrophication of aquatic ecosystems. Copper also leached from the compost in these
simulated storm events. Our results indicate that the effluent from the first several storms
pose the greatest threat to water quality as the mobile C, N, P and Cu all decrease with
subsequent storms.
If the stormwater applied to columns is spiked with copper, our results show that
additional copper will also be found in leachate after simulated storm events. Our research
has shown that most of the copper in leachate is in the dissolved phase. In addition,
the compost leachates were high in dissolved carbon. Our modeling of copper speciation
showed that with high levels of DOC all of the dissolved copper is expected to form DOC-
Cu complexes at pHs between 6 and 8. In this form the copper is not toxic to aquatic
organisms. However, DOC-Cu complexes may break apart when the dissolved organic
matter is consumed and metabolized by microbial action. Then the Cu would be released
back in toxic form to the aqueous ecosystem. More research is needed to determine whether,
how, and under what conditions DOC-Cu complexes will break apart. More research is
also needed to determine how the quantity of compost and incorporation methods in real
situations effects the movement of C, N, P and Cu.
Our results indicate that the effluent from the first several storms pose the greatest
threat to water quality as the mobile C, N, P, and Cu all decrease with subsequent storms.
43
If there is a receiving waterbody that is impaired or has a TMDL restriction, the amount
and placement of compost should be carefully evaluated to protect water quality.
Future research is recommended in a real-world context, using direct rainfall and
stormwater runoff from a highway that has not been spiked with additional elements. It will
be important to capture the effects of vegetation, soil biota, and varying depths of compost
application and incorporation. In addition, future studies should include the analysis of
zinc and organic pollutants.
44

7 References
Bolea, E., M. Gorriz, M. Bouby, F. Laborda, J. Castillo, and H. Geckeis, Multielement
characterization of metal-humic substances complexation by size exclusion chromatogra-
phy, asymmetrical flow field-flow fractionation, ultrafiltration and inductively coupled
plasma-mass spectrometry detection: a comparative approach, J. Chromatogr. A, 1129,
236--246, 2006.
Carballo, T., M. V. Gil, X. Gomez, F. Gonzalez-Andres, and A. Moran, Characterization of
different compost extracts using Fourier-transform infrared spectroscopy (FTIR) and
thermal analysis, Biodegradation, 19, 815--830, 2008.
Chatterjee, N., M. Flury, C. Hinman, and C. G. Cogger, 2013. Chemical and physical
characteristics of compost leachates---a review, Final project report, Washington State
Department of Transportation.
Chen, G., G. Zeng, C. Du, D. Huang, L. Tang, L. Wang, and G. Shen, Transfer of heavy
metals from compost to red soil and groundwater under simulated rainfall conditions,
J. Hazard. Mater., 181, 211--216, 2010.
Christensen, T. H., Leaching from land disposed municipal composts: 2. Nitrogen, Waste
Manage. Res., 1, 115--125, 1983.
Christensen, T. H., Leaching from land municipal composts: 3. Inorganic ions, Waste
Manage. Res., 2, 63--74, 1984.
Christensen, T. H., and J. C. Tjell, Leaching from land disposed municipal compost: 4.
Heavy metals, Waste Manage. Res., 2, 347--357, 1984a.
45
Christensen, T. H., and J. C. Tjell, Leaching from land disposed municipal compost: 4.
Heavy metals, Waste Manage. Res., 2, 347--357, 1984b.
Fels, L. E., M. Zamama, A. E. Asli, and M. Hafidi, Assessment of biotransformation of
organic matter during co-composting of sewage sludge-lignocelullosic waste by chemical,
FTIR analyses, and phytotoxicity tests, Int. Biodeter. Biodegrad., 87, 128--137, 2014.
Gao, X., D. D. Laskar, J. Zeng, G. L. Helms, and S. Chen, A 13CCP/MAS-based nondegrada-
tive method for lignin content analysis, ACS Sustainable Chem. Eng., 3, 153--162,
2015.
Genest, S. C., M. J. Simpson, A. J. Simpson, R. Soong, and D. J. McNally, Analysis
of soil organic matter at the solid-water interface by Nuclear Magnetic Resonance
spectroscopy, Environ. Chem., 11, 472--482, 2014.
Gustaffson, J. P., Modeling the acid-base properties and metal complexation of humic
substances with the Stockholm Humic Model, J. Colloid Interface Sci., 244, 102--112,
2001.
Gustafsson, J. P., Visual Minteq, version 3.1 ed., KTH, Sweden, available online:
http://www2.lwr.kth.se/English/OurSoftware/Vminteq/index.html, 2010.
Higashikawa, F. S., C. A. Silva, C. A. Nunes, and M. A. Sanchez-Monedero, Fourier
transform infrared spectroscopy and partial least square regression for the prediction
of substrate maturity indexes, Sci. Total Environ., 470-471, 536--542, 2014.
Hinman, C., Rain Garden Handbook for Western Washington, Washington State University
Extension, Pullman, WA, 2013.
46

Huang, G., Q. Wu, J. Wong, and B. Nagar, Transformation of organic matter during
co-composting of pig manure with sawdust, Bioresour. Technol., 97, 1834--1842, 2006.
Kaschl, A., V. Romheld, and Y. Chen, The influence of soluble organic matter from
municipal solid waste compost on trace metal leaching in calcareous soils, Sci. Total
Environ., 291, 45--57, 2002.
Kleber, M., and M. G. Johnson, Advances in understanding the molecular structure of soil
organic matter: Implications for interactions in the environment, Adv. Agron., 106,
77--142, 2010.
Linbo, T. L., D. H. Baldwin, J. K. McIntyre, and N. L. Scholz, Effects of water hardness,
alkalinity, and dissolved organic carbon on the toxicity of copper to the later line of
developing fish, Environ. Toxicol. Chem., 28, 1455--1461, 2009.
Magnuson, V. R., D. K. Harriss, M. S. Sun, D. K. Taylor, and G. E. Glass, Relationships of
activities of metal-ligand species to aquatic toxicity, in Chemical Modeling in Aqueous
Systems, edited by E. A. Jenne, , Symposium series 93, Washington, DC, 1979.
McBride, M. B., Environmental Chemistry of Soils, Oxford University Press, New York,
1994.
Mullane, J. M., M. Flury, H. Iqbal, P. M. Freeze, C. Hinman, C. G. Cogger, and Z. Shi,
Intermittent rainstorms cause pulses of nitrogen, phosphorus, and copper in leachate
from compost in bioretention systems, Sci. Total Environ., 537, 294--303, 2015.
Ouaqoudi, F. Z. E., L. E. Fels, P. Winterton, L. Lemee, A. Ambles, and M. Hafidi, Study
of humic acids during composting of ligno-cellulose waste by infra-red spectroscopic
and thermogravimetric/thermal differential analysis, Compost Sci. Util., 22, 188--198,
2014.
47

Provenzano, M. R., A. D. Malerba, D. Pezzolla, and G. Gigliotti, Chemical and spectroscopic
characterization of organic matter during the anaerobic digestion and successive
composting of pig slurry, Waste Manage., 34, 653--660, 2014.
R Core Team 2013. R: A Language and Environment for Statistical Computing, R
Foundation for Statistical Computing, Vienna, Austria.
Said-Pullicino, D., K. Kaiser, G. Guggenberger, and G. Gigliotti, Changes in the chemical
composition of water-extractable organic matter during composting: Distribution
between stable and labile organic matter pools, Chemosphere, 66, 2166--2176, 2007.
Seligman, P. F., and A. Zirino, 1998. Chemistry, toxicity, and bioavailability of copper and
its relationship to regulation in the marine environment, Technical report, Space and
Naval Warfare Systems Center, San Diego, CA.
Skjemstad, J. O., P. Clarke, J. A. Taylor, J. M. Oades, and R. H. Newman, The removal of
magnetic materials from surface soils. A solid state 13CCP/MAS NMR study, Aust. J.
Soil Res., 32, 1215--1229, 1994.
Smidt, E., and K. Meissl, The applicability of fourier transform infrared (FT- IR) spec-
troscopy in waste management, Waste Manage., 27, 268--276, 2007.
Smidt, E., K. Bohm, and M. Schwanninger, The Application of FT-IR Spectroscopy in Waste
Management, in Fourier Transforms---New Analytical Approaches and FTIR Strategies,
edited by G. Nikolic, pp. 405--430, InTech, http://www.intechopen.com/books/fourier-
transforms-new-analytical-approaches-and-ftir-strategies, 2011.
Spaccini, R., and A. Piccolo, Spectroscopic characterization of compost at different maturity
stages, Clean Soil Air Water, 36, 152--157, 2008.
48

Sparks, D. L., Soil Physical Chemistry, 2 ed., CRC Press, Boca Raton, FL, 1999.
USEPA National Recommended Water Quality Criteria, United States Environmental
Protection Agency, Washington, D.C., 2014.
Wang, K., W. Li, X. Gong, Y. Li, C. Wu, and N. Ren, Spectral study of dissolved organic
matter in biosolid during the composting process using inorganic bulking agent: UV-vis,
GPC, FTIR and EEM, Int. Biodeter. Biodegr., 85, 617--623, 2013.
Washington State Department of Ecology Stormwater Management Manual for Western
Washington, Washington State Department of Ecology, Publication Number 12-10-030,
Olympia, WA, 2012.
Washington State Department of Ecology Industrial Stormwater General Permit: A National
Pollutant Discharge Elimination System (NPDES) and State Waste Discharge General
Permit for Stormwater Discharges Associated with Industrial Activities, Washington
State Department of Ecology, Olympia, WA, 2014.
Wilson, M. A., R. J. Pugmire, K. W. Zilm, K. M. Goh, S. Heng, and D. M. Grant, Cross-
polarization 13C-NMR spectroscopy with ’magic angle’ spinning characterizes organic
matter in whole soils, Nature, 294, 648--650, 1981.
Woods End Laboratories Official Solvita (R) Guideline Compost Emissions Test, vers. 8.0
ed., Woods End Laboratories, Mount Vernon, ME, 2014.
Zmora-Nahum, S., O. Markovitch, J. Tarchitzky, and Y. Chen, Dissolved organic carbon
(DOC) as a parameter of compost maturity, Soil Biol. Biochem., 37, 2109--2116, 2005.
Zmora-Nahum, S., Y. Hadar, and Y. Chen, Physico-chemical properties of commercial
49

composts varying in their source materials and country of origin, Soil Biol. Biochem.,
39, 1263--1276, 2007.
50
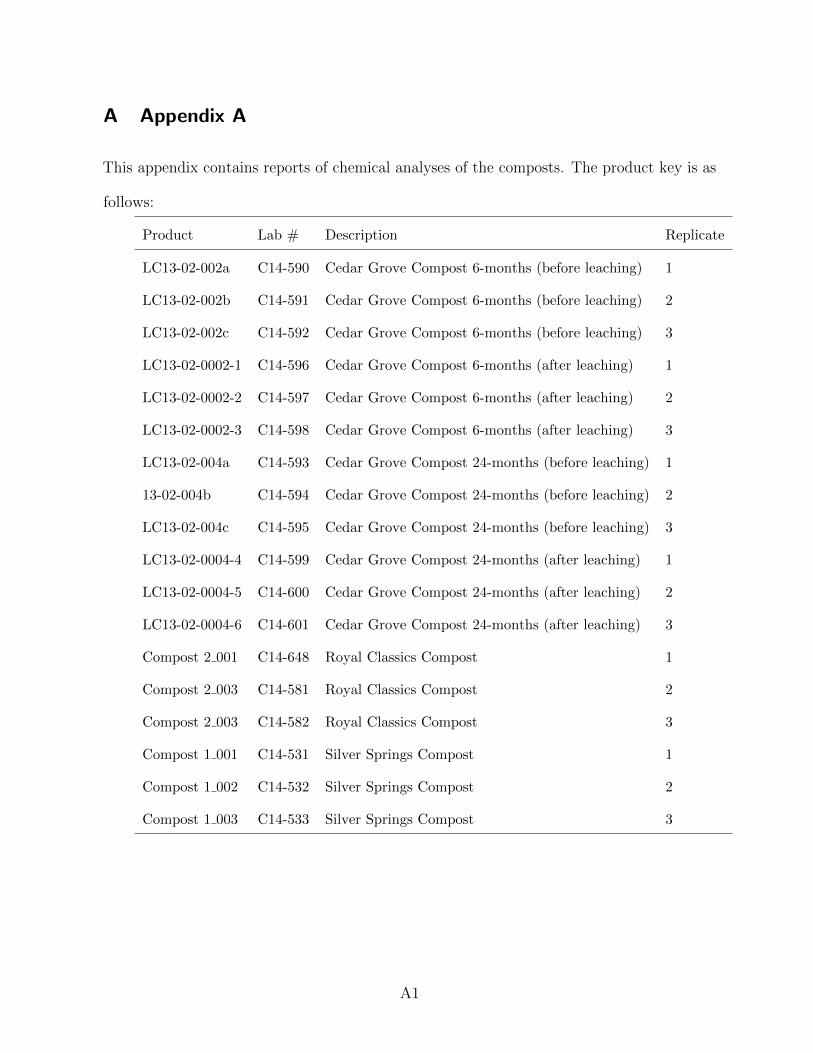
A Appendix A
This appendix contains reports of chemical analyses of the composts. The product key is as
follows:
Product Lab # Description Replicate
LC13-02-002a C14-590 Cedar Grove Compost 6-months (before leaching) 1
LC13-02-002b C14-591 Cedar Grove Compost 6-months (before leaching) 2
LC13-02-002c C14-592 Cedar Grove Compost 6-months (before leaching) 3
LC13-02-0002-1 C14-596 Cedar Grove Compost 6-months (after leaching) 1
LC13-02-0002-2 C14-597 Cedar Grove Compost 6-months (after leaching) 2
LC13-02-0002-3 C14-598 Cedar Grove Compost 6-months (after leaching) 3
LC13-02-004a C14-593 Cedar Grove Compost 24-months (before leaching) 1
13-02-004b C14-594 Cedar Grove Compost 24-months (before leaching) 2
LC13-02-004c C14-595 Cedar Grove Compost 24-months (before leaching) 3
LC13-02-0004-4 C14-599 Cedar Grove Compost 24-months (after leaching) 1
LC13-02-0004-5 C14-600 Cedar Grove Compost 24-months (after leaching) 2
LC13-02-0004-6 C14-601 Cedar Grove Compost 24-months (after leaching) 3
Compost 2 001 C14-648 Royal Classics Compost 1
Compost 2 003 C14-581 Royal Classics Compost 2
Compost 2 003 C14-582 Royal Classics Compost 3
Compost 1 001 C14-531 Silver Springs Compost 1
Compost 1 002 C14-532 Silver Springs Compost 2
Compost 1 003 C14-533 Silver Springs Compost 3
A1
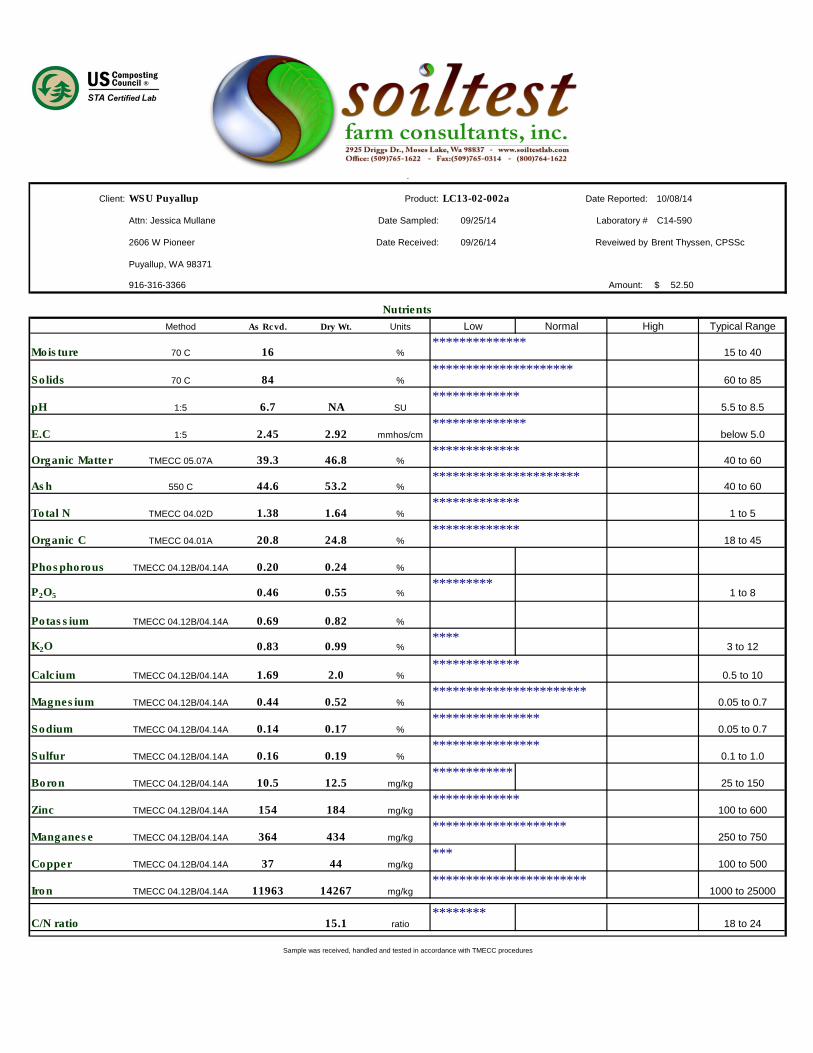
Client: WSU Puyallup Product: LC13-02-002a Date Reported: 10/08/14
Attn: Jessica Mullane Date Sampled: 09/25/14 Laboratory # C14-590
2606 W Pioneer Date Received: 09/26/14 Reveiwed by Brent Thyssen, CPSSc
Puyallup, WA 98371
916-316-3366 Amount: 52.50$
Method As Rcvd. Dry Wt. Units Typical Range
Moisture 70 C 16 %**************
15 to 40
Solids 70 C 84 %*********************
60 to 85
pH 1:5 6.7 NA SU*************
5.5 to 8.5
E.C 1:5 2.45 2.92 mmhos/cm**************
below 5.0
Organic Matter TMECC 05.07A 39.3 46.8 %*************
40 to 60
Ash 550 C 44.6 53.2 %**********************
40 to 60
Total N TMECC 04.02D 1.38 1.64 %*************
1 to 5
Organic C TMECC 04.01A 20.8 24.8 %*************
18 to 45
Phosphorous TMECC 04.12B/04.14A 0.20 0.24 %
P2O5 0.46 0.55 %*********
1 to 8
Potassium TMECC 04.12B/04.14A 0.69 0.82 %
K2O 0.83 0.99 %****
3 to 12
Calcium TMECC 04.12B/04.14A 1.69 2.0 %*************
0.5 to 10
Magnesium TMECC 04.12B/04.14A 0.44 0.52 %***********************
0.05 to 0.7
Sodium TMECC 04.12B/04.14A 0.14 0.17 %****************
0.05 to 0.7
Sulfur TMECC 04.12B/04.14A 0.16 0.19 %****************
0.1 to 1.0
Boron TMECC 04.12B/04.14A 10.5 12.5 mg/kg************
25 to 150
Zinc TMECC 04.12B/04.14A 154 184 mg/kg*************
100 to 600
Manganese TMECC 04.12B/04.14A 364 434 mg/kg********************
250 to 750
Copper TMECC 04.12B/04.14A 37 44 mg/kg***
100 to 500
Iron TMECC 04.12B/04.14A 11963 14267 mg/kg***********************
1000 to 25000
C/N ratio 15.1 ratio********
18 to 24
.
Sample was received, handled and tested in accordance with TMECC procedures
High
Nutrients
NormalLow

Client: WSU Puyallup Product: LC13-02-002b Date Reported: 10/08/14
Attn: Jessica Mullane Date Sampled: 09/25/14 Laboratory # C14-591
2606 W Pioneer Date Received: 09/26/14 Reveiwed by Brent Thyssen, CPSSc
Puyallup, WA 98371
916-316-3366 Amount: 52.50$
Method As Rcvd. Dry Wt. Units Typical Range
Moisture 70 C 11 %*********
15 to 40
Solids 70 C 89 %********************************
60 to 85
pH 1:5 6.7 NA SU*************
5.5 to 8.5
E.C 1:5 2.18 2.45 mmhos/cm**************
below 5.0
Organic Matter TMECC 05.07A 32.8 36.9 %*******
40 to 60
Ash 550 C 56.1 63.1 %********************************
40 to 60
Total N TMECC 04.02D 1.13 1.27 %*************
1 to 5
Organic C TMECC 04.01A 15.5 17.5 %**********
18 to 45
Phosphorous TMECC 04.12B/04.14A 0.31 0.35 %
P2O5 0.71 0.79 %*********
1 to 8
Potassium TMECC 04.12B/04.14A 0.57 0.64 %
K2O 0.69 0.77 %****
3 to 12
Calcium TMECC 04.12B/04.14A 1.74 2.0 %*************
0.5 to 10
Magnesium TMECC 04.12B/04.14A 0.60 0.67 %***********************
0.05 to 0.7
Sodium TMECC 04.12B/04.14A 0.12 0.13 %****************
0.05 to 0.7
Sulfur TMECC 04.12B/04.14A 0.13 0.15 %****************
0.1 to 1.0
Boron TMECC 04.12B/04.14A 6.5 7.3 mg/kg****
25 to 150
Zinc TMECC 04.12B/04.14A 152 171 mg/kg*************
100 to 600
Manganese TMECC 04.12B/04.14A 407 457 mg/kg********************
250 to 750
Copper TMECC 04.12B/04.14A 37 42 mg/kg***
100 to 500
Iron TMECC 04.12B/04.14A 15719 17671 mg/kg***********************
1000 to 25000
C/N ratio 13.7 ratio********
18 to 24
.
Sample was received, handled and tested in accordance with TMECC procedures
High
Nutrients
NormalLow

Client: WSU Puyallup Product: LC13-02-002c Date Reported: 10/08/14
Attn: Jessica Mullane Date Sampled: 09/25/14 Laboratory # C14-592
2606 W Pioneer Date Received: 09/26/14 Reveiwed by Brent Thyssen, CPSSc
Puyallup, WA 98371
916-316-3366 Amount: 52.50$
Method As Rcvd. Dry Wt. Units Typical Range
Moisture 70 C 15 %*********
15 to 40
Solids 70 C 85 %*********************
60 to 85
pH 1:5 6.7 NA SU*************
5.5 to 8.5
E.C 1:5 2.45 2.87 mmhos/cm**************
below 5.0
Organic Matter TMECC 05.07A 32.5 38.0 %*******
40 to 60
Ash 550 C 53.0 62.0 %********************************
40 to 60
Total N TMECC 04.02D 1.18 1.38 %*************
1 to 5
Organic C TMECC 04.01A 16.5 19.3 %*************
18 to 45
Phosphorous TMECC 04.12B/04.14A 0.24 0.28 %
P2O5 0.55 0.64 %*********
1 to 8
Potassium TMECC 04.12B/04.14A 0.63 0.74 %
K2O 0.76 0.89 %****
3 to 12
Calcium TMECC 04.12B/04.14A 1.73 2.0 %*************
0.5 to 10
Magnesium TMECC 04.12B/04.14A 0.48 0.56 %***********************
0.05 to 0.7
Sodium TMECC 04.12B/04.14A 0.13 0.15 %****************
0.05 to 0.7
Sulfur TMECC 04.12B/04.14A 0.16 0.19 %****************
0.1 to 1.0
Boron TMECC 04.12B/04.14A 9.5 11.1 mg/kg************
25 to 150
Zinc TMECC 04.12B/04.14A 167 195 mg/kg*************
100 to 600
Manganese TMECC 04.12B/04.14A 428 501 mg/kg********************
250 to 750
Copper TMECC 04.12B/04.14A 42 49 mg/kg***
100 to 500
Iron TMECC 04.12B/04.14A 13797 16145 mg/kg***********************
1000 to 25000
C/N ratio 14.0 ratio********
18 to 24
.
Sample was received, handled and tested in accordance with TMECC procedures
High
Nutrients
NormalLow
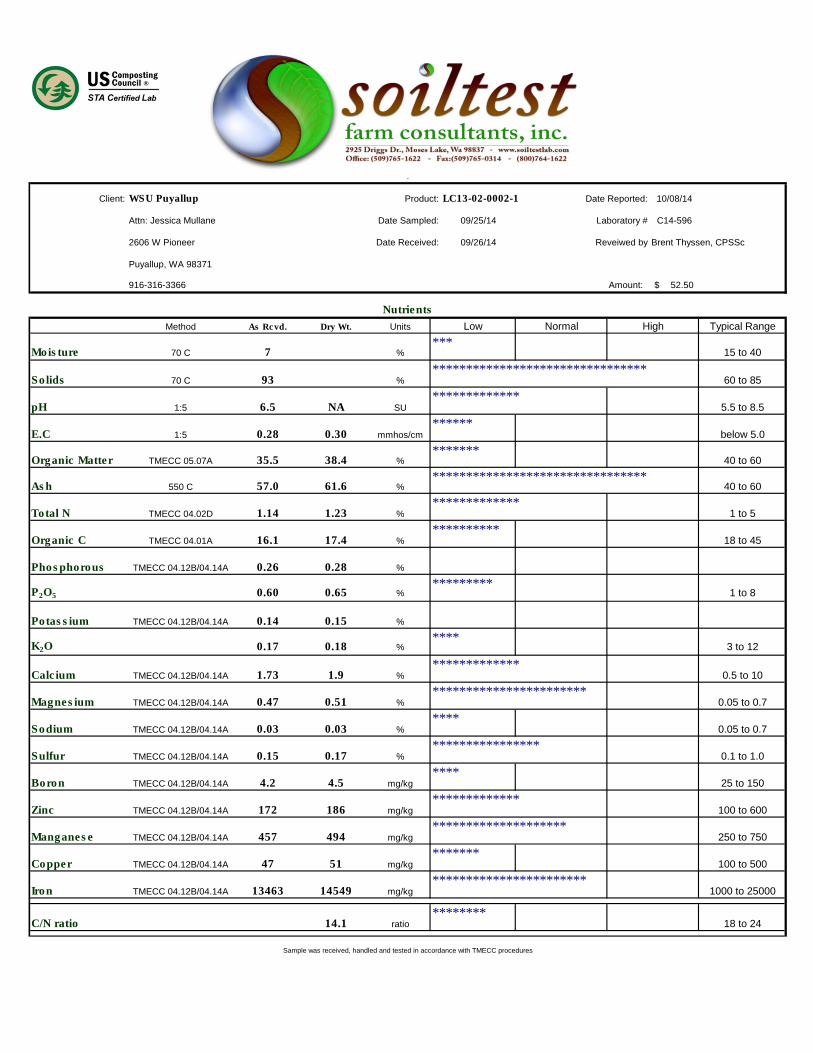
Client: WSU Puyallup Product: LC13-02-0002-1 Date Reported: 10/08/14
Attn: Jessica Mullane Date Sampled: 09/25/14 Laboratory # C14-596
2606 W Pioneer Date Received: 09/26/14 Reveiwed by Brent Thyssen, CPSSc
Puyallup, WA 98371
916-316-3366 Amount: 52.50$
Method As Rcvd. Dry Wt. Units Typical Range
Moisture 70 C 7 %***
15 to 40
Solids 70 C 93 %********************************
60 to 85
pH 1:5 6.5 NA SU*************
5.5 to 8.5
E.C 1:5 0.28 0.30 mmhos/cm******
below 5.0
Organic Matter TMECC 05.07A 35.5 38.4 %*******
40 to 60
Ash 550 C 57.0 61.6 %********************************
40 to 60
Total N TMECC 04.02D 1.14 1.23 %*************
1 to 5
Organic C TMECC 04.01A 16.1 17.4 %**********
18 to 45
Phosphorous TMECC 04.12B/04.14A 0.26 0.28 %
P2O5 0.60 0.65 %*********
1 to 8
Potassium TMECC 04.12B/04.14A 0.14 0.15 %
K2O 0.17 0.18 %****
3 to 12
Calcium TMECC 04.12B/04.14A 1.73 1.9 %*************
0.5 to 10
Magnesium TMECC 04.12B/04.14A 0.47 0.51 %***********************
0.05 to 0.7
Sodium TMECC 04.12B/04.14A 0.03 0.03 %****
0.05 to 0.7
Sulfur TMECC 04.12B/04.14A 0.15 0.17 %****************
0.1 to 1.0
Boron TMECC 04.12B/04.14A 4.2 4.5 mg/kg****
25 to 150
Zinc TMECC 04.12B/04.14A 172 186 mg/kg*************
100 to 600
Manganese TMECC 04.12B/04.14A 457 494 mg/kg********************
250 to 750
Copper TMECC 04.12B/04.14A 47 51 mg/kg*******
100 to 500
Iron TMECC 04.12B/04.14A 13463 14549 mg/kg***********************
1000 to 25000
C/N ratio 14.1 ratio********
18 to 24
.
Sample was received, handled and tested in accordance with TMECC procedures
High
Nutrients
NormalLow

Client: WSU Puyallup Product: LC13-02-0002-2 Date Reported: 10/08/14
Attn: Jessica Mullane Date Sampled: 09/25/14 Laboratory # C14-597
2606 W Pioneer Date Received: 09/26/14 Reveiwed by Brent Thyssen, CPSSc
Puyallup, WA 98371
916-316-3366 Amount: 52.50$
Method As Rcvd. Dry Wt. Units Typical Range
Moisture 70 C 7 %***
15 to 40
Solids 70 C 93 %********************************
60 to 85
pH 1:5 6.6 NA SU*************
5.5 to 8.5
E.C 1:5 6.23 6.71 mmhos/cm*****************************************
below 5.0
Organic Matter TMECC 05.07A 37.1 39.9 %*************
40 to 60
Ash 550 C 55.8 60.1 %**********************
40 to 60
Total N TMECC 04.02D 1.39 1.50 %*************
1 to 5
Organic C TMECC 04.01A 20.6 22.2 %*************
18 to 45
Phosphorous TMECC 04.12B/04.14A 0.22 0.24 %
P2O5 0.51 0.55 %*********
1 to 8
Potassium TMECC 04.12B/04.14A 0.13 0.14 %
K2O 0.16 0.17 %****
3 to 12
Calcium TMECC 04.12B/04.14A 1.91 2.1 %*************
0.5 to 10
Magnesium TMECC 04.12B/04.14A 0.49 0.53 %***********************
0.05 to 0.7
Sodium TMECC 04.12B/04.14A 0.04 0.04 %****
0.05 to 0.7
Sulfur TMECC 04.12B/04.14A 0.17 0.18 %****************
0.1 to 1.0
Boron TMECC 04.12B/04.14A 5.4 5.8 mg/kg****
25 to 150
Zinc TMECC 04.12B/04.14A 190 205 mg/kg*************
100 to 600
Manganese TMECC 04.12B/04.14A 491 529 mg/kg********************
250 to 750
Copper TMECC 04.12B/04.14A 49 53 mg/kg*******
100 to 500
Iron TMECC 04.12B/04.14A 15579 16783 mg/kg***********************
1000 to 25000
C/N ratio 14.8 ratio********
18 to 24
.
Sample was received, handled and tested in accordance with TMECC procedures
High
Nutrients
NormalLow
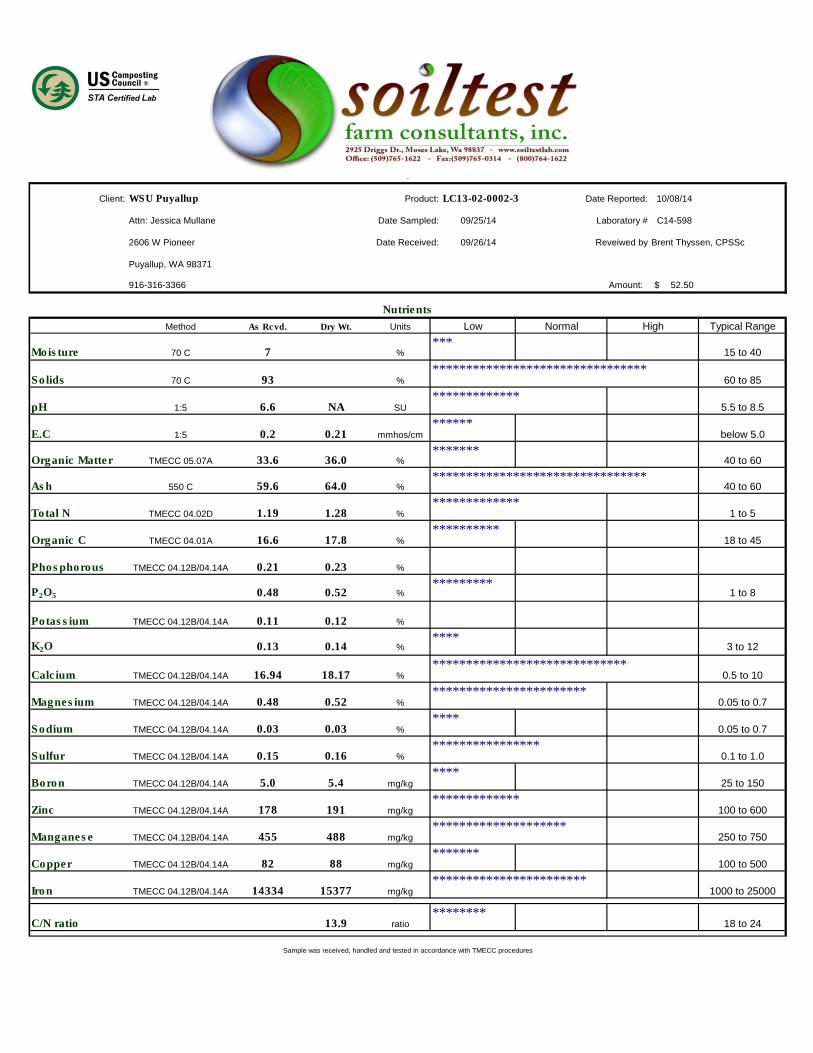
Client: WSU Puyallup Product: LC13-02-0002-3 Date Reported: 10/08/14
Attn: Jessica Mullane Date Sampled: 09/25/14 Laboratory # C14-598
2606 W Pioneer Date Received: 09/26/14 Reveiwed by Brent Thyssen, CPSSc
Puyallup, WA 98371
916-316-3366 Amount: 52.50$
Method As Rcvd. Dry Wt. Units Typical Range
Moisture 70 C 7 %***
15 to 40
Solids 70 C 93 %********************************
60 to 85
pH 1:5 6.6 NA SU*************
5.5 to 8.5
E.C 1:5 0.2 0.21 mmhos/cm******
below 5.0
Organic Matter TMECC 05.07A 33.6 36.0 %*******
40 to 60
Ash 550 C 59.6 64.0 %********************************
40 to 60
Total N TMECC 04.02D 1.19 1.28 %*************
1 to 5
Organic C TMECC 04.01A 16.6 17.8 %**********
18 to 45
Phosphorous TMECC 04.12B/04.14A 0.21 0.23 %
P2O5 0.48 0.52 %*********
1 to 8
Potassium TMECC 04.12B/04.14A 0.11 0.12 %
K2O 0.13 0.14 %****
3 to 12
Calcium TMECC 04.12B/04.14A 16.94 18.17 %*****************************
0.5 to 10
Magnesium TMECC 04.12B/04.14A 0.48 0.52 %***********************
0.05 to 0.7
Sodium TMECC 04.12B/04.14A 0.03 0.03 %****
0.05 to 0.7
Sulfur TMECC 04.12B/04.14A 0.15 0.16 %****************
0.1 to 1.0
Boron TMECC 04.12B/04.14A 5.0 5.4 mg/kg****
25 to 150
Zinc TMECC 04.12B/04.14A 178 191 mg/kg*************
100 to 600
Manganese TMECC 04.12B/04.14A 455 488 mg/kg********************
250 to 750
Copper TMECC 04.12B/04.14A 82 88 mg/kg*******
100 to 500
Iron TMECC 04.12B/04.14A 14334 15377 mg/kg***********************
1000 to 25000
C/N ratio 13.9 ratio********
18 to 24
.
Sample was received, handled and tested in accordance with TMECC procedures
High
Nutrients
NormalLow

Client: WSU Puyallup Product: LC13-02-004a Date Reported: 10/08/14
Attn: Jessica Mullane Date Sampled: 09/25/14 Laboratory # C14-593
2606 W Pioneer Date Received: 09/26/14 Reveiwed by Brent Thyssen, CPSSc
Puyallup, WA 98371
916-316-3366 Amount: 52.50$
Method As Rcvd. Dry Wt. Units Typical Range
Moisture 70 C 17 %**************
15 to 40
Solids 70 C 83 %*********************
60 to 85
pH 1:5 6.4 NA SU*************
5.5 to 8.5
E.C 1:5 2.77 3.34 mmhos/cm**************
below 5.0
Organic Matter TMECC 05.07A 34.1 41.1 %*************
40 to 60
Ash 550 C 48.8 58.9 %**********************
40 to 60
Total N TMECC 04.02D 1.31 1.58 %*************
1 to 5
Organic C TMECC 04.01A 17.2 20.8 %*************
18 to 45
Phosphorous TMECC 04.12B/04.14A 0.22 0.26 %
P2O5 0.50 0.60 %*********
1 to 8
Potassium TMECC 04.12B/04.14A 0.58 0.70 %
K2O 0.70 0.84 %****
3 to 12
Calcium TMECC 04.12B/04.14A 1.56 1.9 %*************
0.5 to 10
Magnesium TMECC 04.12B/04.14A 0.45 0.54 %***********************
0.05 to 0.7
Sodium TMECC 04.12B/04.14A 0.08 0.10 %************
0.05 to 0.7
Sulfur TMECC 04.12B/04.14A 0.17 0.21 %****************
0.1 to 1.0
Boron TMECC 04.12B/04.14A 9.1 11.0 mg/kg************
25 to 150
Zinc TMECC 04.12B/04.14A 157 189 mg/kg*************
100 to 600
Manganese TMECC 04.12B/04.14A 386 466 mg/kg********************
250 to 750
Copper TMECC 04.12B/04.14A 42 50 mg/kg*******
100 to 500
Iron TMECC 04.12B/04.14A 13541 16346 mg/kg***********************
1000 to 25000
C/N ratio 13.2 ratio********
18 to 24
.
Sample was received, handled and tested in accordance with TMECC procedures
High
Nutrients
NormalLow
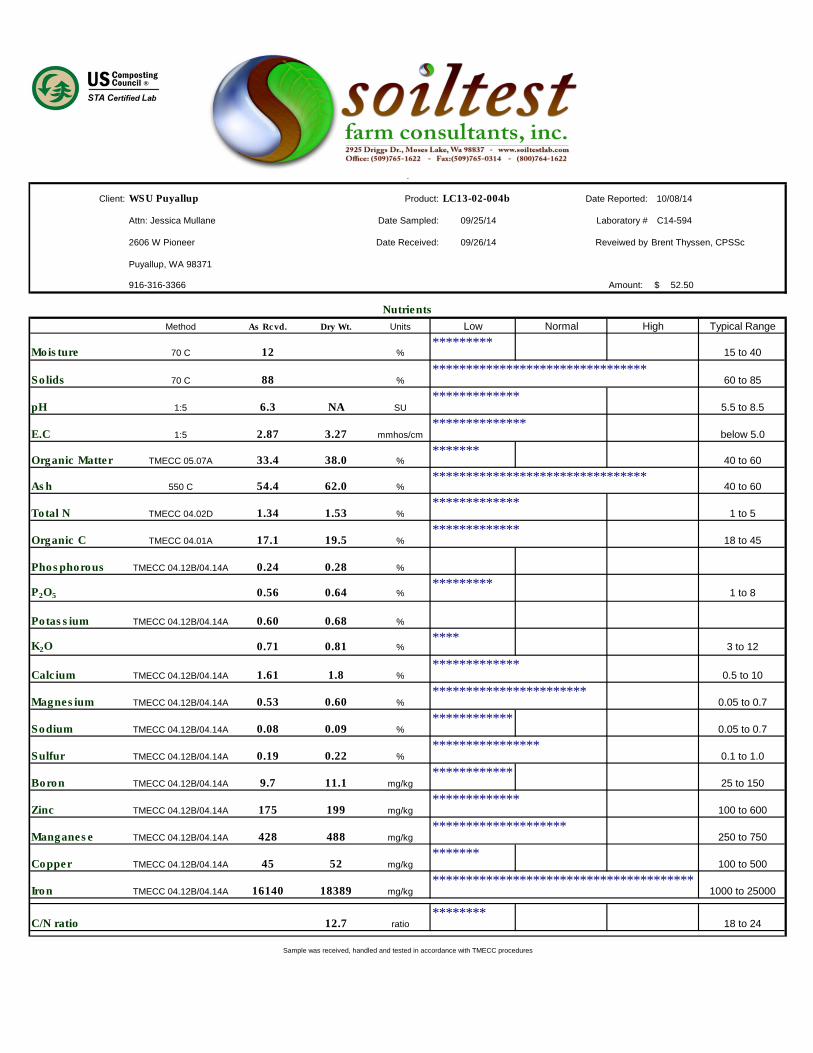
Client: WSU Puyallup Product: LC13-02-004b Date Reported: 10/08/14
Attn: Jessica Mullane Date Sampled: 09/25/14 Laboratory # C14-594
2606 W Pioneer Date Received: 09/26/14 Reveiwed by Brent Thyssen, CPSSc
Puyallup, WA 98371
916-316-3366 Amount: 52.50$
Method As Rcvd. Dry Wt. Units Typical Range
Moisture 70 C 12 %*********
15 to 40
Solids 70 C 88 %********************************
60 to 85
pH 1:5 6.3 NA SU*************
5.5 to 8.5
E.C 1:5 2.87 3.27 mmhos/cm**************
below 5.0
Organic Matter TMECC 05.07A 33.4 38.0 %*******
40 to 60
Ash 550 C 54.4 62.0 %********************************
40 to 60
Total N TMECC 04.02D 1.34 1.53 %*************
1 to 5
Organic C TMECC 04.01A 17.1 19.5 %*************
18 to 45
Phosphorous TMECC 04.12B/04.14A 0.24 0.28 %
P2O5 0.56 0.64 %*********
1 to 8
Potassium TMECC 04.12B/04.14A 0.60 0.68 %
K2O 0.71 0.81 %****
3 to 12
Calcium TMECC 04.12B/04.14A 1.61 1.8 %*************
0.5 to 10
Magnesium TMECC 04.12B/04.14A 0.53 0.60 %***********************
0.05 to 0.7
Sodium TMECC 04.12B/04.14A 0.08 0.09 %************
0.05 to 0.7
Sulfur TMECC 04.12B/04.14A 0.19 0.22 %****************
0.1 to 1.0
Boron TMECC 04.12B/04.14A 9.7 11.1 mg/kg************
25 to 150
Zinc TMECC 04.12B/04.14A 175 199 mg/kg*************
100 to 600
Manganese TMECC 04.12B/04.14A 428 488 mg/kg********************
250 to 750
Copper TMECC 04.12B/04.14A 45 52 mg/kg*******
100 to 500
Iron TMECC 04.12B/04.14A 16140 18389 mg/kg***************************************
1000 to 25000
C/N ratio 12.7 ratio********
18 to 24
.
Sample was received, handled and tested in accordance with TMECC procedures
High
Nutrients
NormalLow

Client: WSU Puyallup Product: LC13-02-004c Date Reported: 10/08/14
Attn: Jessica Mullane Date Sampled: 09/25/14 Laboratory # C14-595
2606 W Pioneer Date Received: 09/26/14 Reveiwed by Brent Thyssen, CPSSc
Puyallup, WA 98371
916-316-3366 Amount: 52.50$
Method As Rcvd. Dry Wt. Units Typical Range
Moisture 70 C 13 %*********
15 to 40
Solids 70 C 87 %********************************
60 to 85
pH 1:5 6.5 NA SU*************
5.5 to 8.5
E.C 1:5 1.78 2.04 mmhos/cm******
below 5.0
Organic Matter TMECC 05.07A 35.7 40.9 %*************
40 to 60
Ash 550 C 51.6 59.1 %**********************
40 to 60
Total N TMECC 04.02D 1.39 1.59 %*************
1 to 5
Organic C TMECC 04.01A 18.8 21.5 %*************
18 to 45
Phosphorous TMECC 04.12B/04.14A 0.24 0.27 %
P2O5 0.54 0.62 %*********
1 to 8
Potassium TMECC 04.12B/04.14A 0.60 0.69 %
K2O 0.72 0.82 %****
3 to 12
Calcium TMECC 04.12B/04.14A 1.69 1.9 %*************
0.5 to 10
Magnesium TMECC 04.12B/04.14A 0.52 0.59 %***********************
0.05 to 0.7
Sodium TMECC 04.12B/04.14A 0.08 0.09 %************
0.05 to 0.7
Sulfur TMECC 04.12B/04.14A 0.18 0.21 %****************
0.1 to 1.0
Boron TMECC 04.12B/04.14A 10.5 12.0 mg/kg************
25 to 150
Zinc TMECC 04.12B/04.14A 167 191 mg/kg*************
100 to 600
Manganese TMECC 04.12B/04.14A 414 474 mg/kg********************
250 to 750
Copper TMECC 04.12B/04.14A 43 49 mg/kg***
100 to 500
Iron TMECC 04.12B/04.14A 14436 16546 mg/kg***********************
1000 to 25000
C/N ratio 13.5 ratio********
18 to 24
.
Sample was received, handled and tested in accordance with TMECC procedures
High
Nutrients
NormalLow

Client: WSU Puyallup Product: LC13-02-0004-4 Date Reported: 10/08/14
Attn: Jessica Mullane Date Sampled: 09/25/14 Laboratory # C14-599
2606 W Pioneer Date Received: 09/26/14 Reveiwed by Brent Thyssen, CPSSc
Puyallup, WA 98371
916-316-3366 Amount: 52.50$
Method As Rcvd. Dry Wt. Units Typical Range
Moisture 70 C 8 %***
15 to 40
Solids 70 C 92 %********************************
60 to 85
pH 1:5 6.9 NA SU*************
5.5 to 8.5
E.C 1:5 0.18 0.20 mmhos/cm******
below 5.0
Organic Matter TMECC 05.07A 39.9 43.4 %*************
40 to 60
Ash 550 C 52.0 56.6 %**********************
40 to 60
Total N TMECC 04.02D 1.40 1.52 %*************
1 to 5
Organic C TMECC 04.01A 20.5 22.3 %*************
18 to 45
Phosphorous TMECC 04.12B/04.14A 0.22 0.24 %
P2O5 0.51 0.56 %*********
1 to 8
Potassium TMECC 04.12B/04.14A 0.12 0.13 %
K2O 0.15 0.16 %****
3 to 12
Calcium TMECC 04.12B/04.14A 17.57 19.14 %*****************************
0.5 to 10
Magnesium TMECC 04.12B/04.14A 0.54 0.59 %***********************
0.05 to 0.7
Sodium TMECC 04.12B/04.14A 0.03 0.03 %****
0.05 to 0.7
Sulfur TMECC 04.12B/04.14A 0.18 0.20 %****************
0.1 to 1.0
Boron TMECC 04.12B/04.14A 3.4 3.7 mg/kg****
25 to 150
Zinc TMECC 04.12B/04.14A 181 197 mg/kg*************
100 to 600
Manganese TMECC 04.12B/04.14A 457 498 mg/kg********************
250 to 750
Copper TMECC 04.12B/04.14A 47 52 mg/kg*******
100 to 500
Iron TMECC 04.12B/04.14A 15180 16528 mg/kg***********************
1000 to 25000
C/N ratio 14.7 ratio********
18 to 24
.
Sample was received, handled and tested in accordance with TMECC procedures
High
Nutrients
NormalLow

Client: WSU Puyallup Product: LC13-02-0004-5 Date Reported: 10/08/14
Attn: Jessica Mullane Date Sampled: 09/25/14 Laboratory # C14-600
2606 W Pioneer Date Received: 09/26/14 Reveiwed by Brent Thyssen, CPSSc
Puyallup, WA 98371
916-316-3366 Amount: 52.50$
Method As Rcvd. Dry Wt. Units Typical Range
Moisture 70 C 7 %***
15 to 40
Solids 70 C 93 %********************************
60 to 85
pH 1:5 6.7 NA SU*************
5.5 to 8.5
E.C 1:5 0.27 0.29 mmhos/cm******
below 5.0
Organic Matter TMECC 05.07A 34.9 37.5 %*******
40 to 60
Ash 550 C 58.0 62.5 %********************************
40 to 60
Total N TMECC 04.02D 1.24 1.33 %*************
1 to 5
Organic C TMECC 04.01A 17.6 18.9 %*************
18 to 45
Phosphorous TMECC 04.12B/04.14A 0.30 0.32 %
P2O5 0.68 0.73 %*********
1 to 8
Potassium TMECC 04.12B/04.14A 0.15 0.16 %
K2O 0.18 0.20 %****
3 to 12
Calcium TMECC 04.12B/04.14A 2.03 2.19 %*************
0.5 to 10
Magnesium TMECC 04.12B/04.14A 0.57 0.61 %***********************
0.05 to 0.7
Sodium TMECC 04.12B/04.14A 0.04 0.04 %************
0.05 to 0.7
Sulfur TMECC 04.12B/04.14A 0.22 0.24 %****************
0.1 to 1.0
Boron TMECC 04.12B/04.14A 4.6 4.9 mg/kg****
25 to 150
Zinc TMECC 04.12B/04.14A 230 247 mg/kg*************
100 to 600
Manganese TMECC 04.12B/04.14A 550 592 mg/kg********************
250 to 750
Copper TMECC 04.12B/04.14A 166 179 mg/kg**************
100 to 500
Iron TMECC 04.12B/04.14A 16476 17729 mg/kg***********************
1000 to 25000
C/N ratio 14.2 ratio********
18 to 24
.
Sample was received, handled and tested in accordance with TMECC procedures
High
Nutrients
NormalLow

Client: WSU Puyallup Product: LC13-02-0004-6 Date Reported: 10/08/14
Attn: Jessica Mullane Date Sampled: 09/25/14 Laboratory # C14-601
2606 W Pioneer Date Received: 09/26/14 Reveiwed by Brent Thyssen, CPSSc
Puyallup, WA 98371
916-316-3366 Amount: 52.50$
Method As Rcvd. Dry Wt. Units Typical Range
Moisture 70 C 7 %***
15 to 40
Solids 70 C 93 %********************************
60 to 85
pH 1:5 6.9 NA SU*************
5.5 to 8.5
E.C 1:5 0.27 0.29 mmhos/cm******
below 5.0
Organic Matter TMECC 05.07A 37.5 40.6 %*************
40 to 60
Ash 550 C 55.0 59.4 %**********************
40 to 60
Total N TMECC 04.02D 1.48 1.60 %*************
1 to 5
Organic C TMECC 04.01A 20.9 22.6 %*************
18 to 45
Phosphorous TMECC 04.12B/04.14A 0.23 0.25 %
P2O5 0.53 0.57 %*********
1 to 8
Potassium TMECC 04.12B/04.14A 0.14 0.15 %
K2O 0.17 0.18 %****
3 to 12
Calcium TMECC 04.12B/04.14A 1.69 1.82 %*************
0.5 to 10
Magnesium TMECC 04.12B/04.14A 0.59 0.64 %***********************
0.05 to 0.7
Sodium TMECC 04.12B/04.14A 0.03 0.03 %****
0.05 to 0.7
Sulfur TMECC 04.12B/04.14A 0.17 0.18 %****************
0.1 to 1.0
Boron TMECC 04.12B/04.14A 3.6 3.9 mg/kg****
25 to 150
Zinc TMECC 04.12B/04.14A 180 195 mg/kg*************
100 to 600
Manganese TMECC 04.12B/04.14A 471 509 mg/kg********************
250 to 750
Copper TMECC 04.12B/04.14A 125 135 mg/kg**************
100 to 500
Iron TMECC 04.12B/04.14A 18466 19954 mg/kg***************************************
1000 to 25000
C/N ratio 14.1 ratio********
18 to 24
.
Sample was received, handled and tested in accordance with TMECC procedures
High
Nutrients
NormalLow
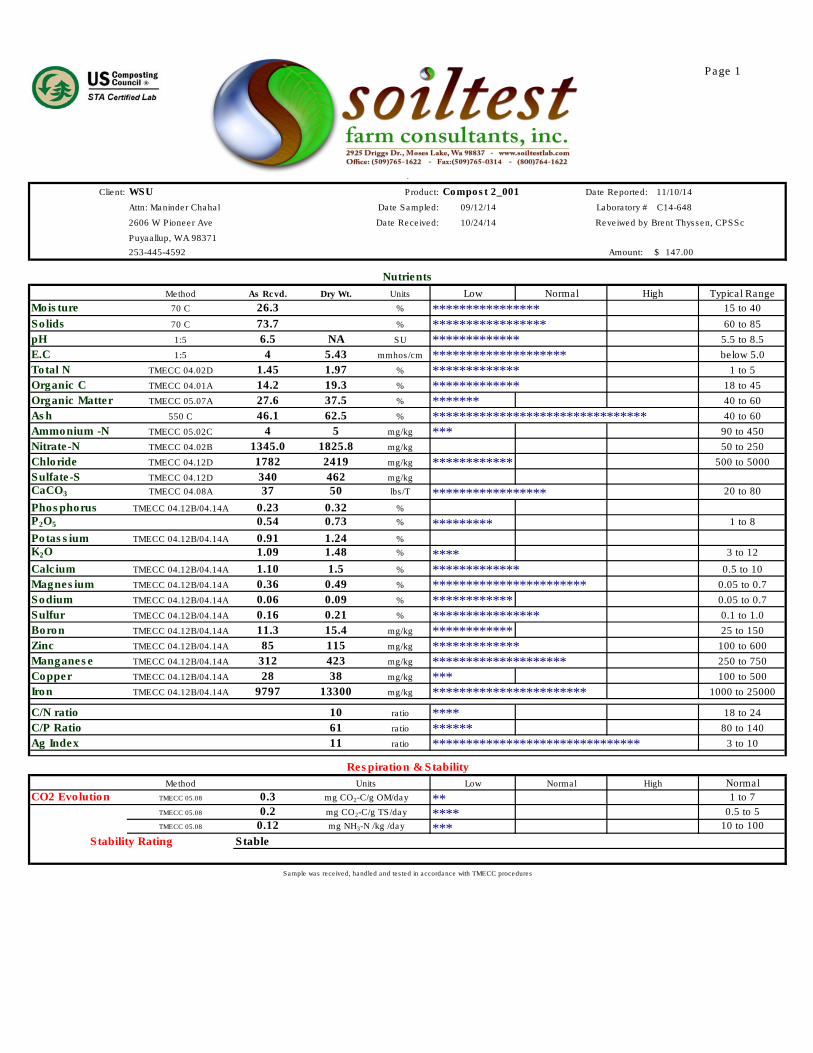
Page 1
Client: WSU Product: Compost 2_001 Date Reported: 11/10/14
Attn: Maninder Chahal Date Sampled: 09/12/14 Laboratory # C14-648
2606 W Pioneer Ave Date Received: 10/24/14 Reveiwed by Brent Thyssen, CPSSc
Puyaallup, WA 98371
253-445-4592 Amount: 147.00$
Method As Rcvd. Dry Wt. Units Typical Range
Moisture 70 C 26.3 % **************** 15 to 40
Solids 70 C 73.7 % ***************** 60 to 85
pH 1:5 6.5 NA SU ************* 5.5 to 8.5
E.C 1:5 4 5.43 mmhos/cm ******************** below 5.0
Total N TMECC 04.02D 1.45 1.97 % ************* 1 to 5
Organic C TMECC 04.01A 14.2 19.3 % ************* 18 to 45
Organic Matter TMECC 05.07A 27.6 37.5 % ******* 40 to 60
Ash 550 C 46.1 62.5 % ******************************** 40 to 60
Ammonium -N TMECC 05.02C 4 5 mg/kg *** 90 to 450
Nitrate-N TMECC 04.02B 1345.0 1825.8 mg/kg 50 to 250
Chloride TMECC 04.12D 1782 2419 mg/kg ************ 500 to 5000
Sulfate-S TMECC 04.12D 340 462 mg/kg
CaCO3 TMECC 04.08A 37 50 lbs/T ***************** 20 to 80
Phosphorus TMECC 04.12B/04.14A 0.23 0.32 %
P2O5 0.54 0.73 % ********* 1 to 8
Potassium TMECC 04.12B/04.14A 0.91 1.24 %
K2O 1.09 1.48 % **** 3 to 12
Calcium TMECC 04.12B/04.14A 1.10 1.5 % ************* 0.5 to 10
Magnesium TMECC 04.12B/04.14A 0.36 0.49 % *********************** 0.05 to 0.7
Sodium TMECC 04.12B/04.14A 0.06 0.09 % ************ 0.05 to 0.7
Sulfur TMECC 04.12B/04.14A 0.16 0.21 % **************** 0.1 to 1.0
Boron TMECC 04.12B/04.14A 11.3 15.4 mg/kg ************ 25 to 150
Zinc TMECC 04.12B/04.14A 85 115 mg/kg ************* 100 to 600
Manganese TMECC 04.12B/04.14A 312 423 mg/kg ******************** 250 to 750
Copper TMECC 04.12B/04.14A 28 38 mg/kg *** 100 to 500
Iron TMECC 04.12B/04.14A 9797 13300 mg/kg *********************** 1000 to 25000
C/N ratio 10 ratio **** 18 to 24
C/P Ratio 61 ratio ****** 80 to 140
Ag Index 11 ratio ******************************* 3 to 10
Method Normal
CO2 Evolution TMECC 05.08 0.3 ** 1 to 7
TMECC 05.08 0.2 **** 0.5 to 5
TMECC 05.08 0.12 *** 10 to 100
Stable
Nutrients
mg CO2-C/g OM/day
mg CO2-C/g TS/day
mg NH3-N /kg /day
NormalLow
Respiration & Stability
LowUnits
.
HighNormal
Stability Rating
Sample was received, handled and tested in accordance with TMECC procedures
High

Page 2
Client: WSU Product: Compost 2_001 Date Reported: 11/10/14
2606 W Pioneer Ave Date Sampled: 09/12/14 Laboratory # C14-648
Puyaallup, WA 98371 Date Received: 10/24/14 Reveiwed by Brent Thyssen, CPSSc
253-445-4592
Method Units Normal
Emergence TMECC 05.05A 97 % ******************************** 80 to 100
Vigor TMECC 05.05A 95 % ******************************** 85 to 100
Plant Description Mature
Date Tested 1/0/1900
Method units Normal
Fecal Coliforms TMECC 07.01B Not Tested MPN/g Less than 1000
Salmonella TMECC 07.01c Not Tested MPN/4g Less than 3
ND = None Detected
Dry Wt. Units WAC Limit
Arsenic 8.8 mg/kg ******** 20
Cadmium 0.3 mg/kg **** 10
Chromium 19.9 mg/kg -
Cobalt 6.2 mg/kg -
Copper 38.4 mg/kg **** 750
Lead 39.5 mg/kg **** 150
Mercury 0.06 mg/kg **** 8
Molybdenum 2.1 mg/kg ************** 9
Nickel 17.1 mg/kg **** 210
Selenium 0.5 mg/kg **** 18
Zinc 115 mg/kg **** 1400
Pass
inches mm % Passing Inerts % by wt.
3 76.2 100
2 50 100 Total Plastic 0.00
1 25 100 Film Plastic 0.00
3/4 19.1 100 Glass 0.00
5/8 16 100 Metal 0.00
1/2" 12.5 100 Sharps 0.00
3/8" 9.5 100
1/4" 6.3 100
.
Pathogens
NormalLow
Method
TMECC 04.12B/04.14A
Low
WAC 173-350-220
TMECC 04.12B/04.14A
TMECC 04.12B/04.14A
TMECC 04.12B/04.14A
TMECC 04.12B/04.14A
Cucumber Bioassay
Low Normal High
TMECC 04.12B/04.14A
Normal
TMECC 04.12B/04.14A
TMECC 04.12B/04.14A
TMECC 04.12B/04.14A
High
Sample was received, handled and tested in accordance with TMECC procedures
TMECC 04.12B/04.14A
TMECC 04.12B/04.14A
Particle Size Distribution TMECC 2.02 B & C
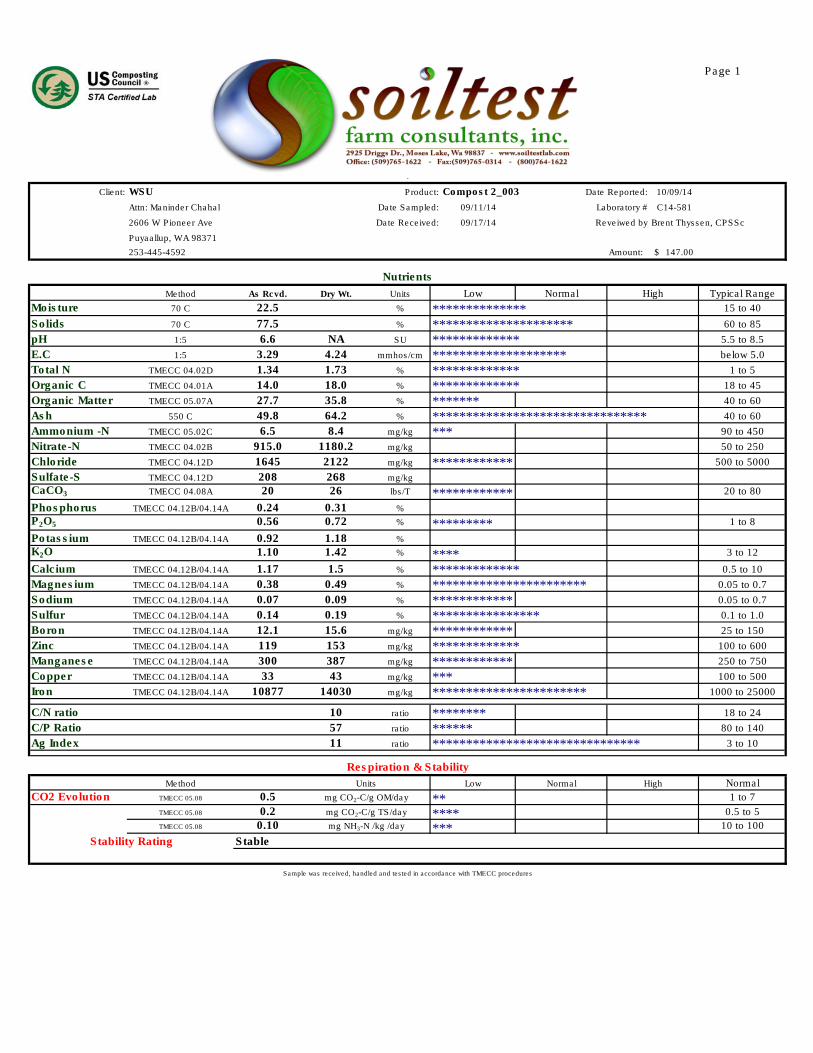
Page 1
Client: WSU Product: Compost 2_003 Date Reported: 10/09/14
Attn: Maninder Chahal Date Sampled: 09/11/14 Laboratory # C14-581
2606 W Pioneer Ave Date Received: 09/17/14 Reveiwed by Brent Thyssen, CPSSc
Puyaallup, WA 98371
253-445-4592 Amount: 147.00$
Method As Rcvd. Dry Wt. Units Typical Range
Moisture 70 C 22.5 % ************** 15 to 40
Solids 70 C 77.5 % ********************* 60 to 85
pH 1:5 6.6 NA SU ************* 5.5 to 8.5
E.C 1:5 3.29 4.24 mmhos/cm ******************** below 5.0
Total N TMECC 04.02D 1.34 1.73 % ************* 1 to 5
Organic C TMECC 04.01A 14.0 18.0 % ************* 18 to 45
Organic Matter TMECC 05.07A 27.7 35.8 % ******* 40 to 60
Ash 550 C 49.8 64.2 % ******************************** 40 to 60
Ammonium -N TMECC 05.02C 6.5 8.4 mg/kg *** 90 to 450
Nitrate-N TMECC 04.02B 915.0 1180.2 mg/kg 50 to 250
Chloride TMECC 04.12D 1645 2122 mg/kg ************ 500 to 5000
Sulfate-S TMECC 04.12D 208 268 mg/kg
CaCO3 TMECC 04.08A 20 26 lbs/T ************ 20 to 80
Phosphorus TMECC 04.12B/04.14A 0.24 0.31 %
P2O5 0.56 0.72 % ********* 1 to 8
Potassium TMECC 04.12B/04.14A 0.92 1.18 %
K2O 1.10 1.42 % **** 3 to 12
Calcium TMECC 04.12B/04.14A 1.17 1.5 % ************* 0.5 to 10
Magnesium TMECC 04.12B/04.14A 0.38 0.49 % *********************** 0.05 to 0.7
Sodium TMECC 04.12B/04.14A 0.07 0.09 % ************ 0.05 to 0.7
Sulfur TMECC 04.12B/04.14A 0.14 0.19 % **************** 0.1 to 1.0
Boron TMECC 04.12B/04.14A 12.1 15.6 mg/kg ************ 25 to 150
Zinc TMECC 04.12B/04.14A 119 153 mg/kg ************* 100 to 600
Manganese TMECC 04.12B/04.14A 300 387 mg/kg ************ 250 to 750
Copper TMECC 04.12B/04.14A 33 43 mg/kg *** 100 to 500
Iron TMECC 04.12B/04.14A 10877 14030 mg/kg *********************** 1000 to 25000
C/N ratio 10 ratio ******** 18 to 24
C/P Ratio 57 ratio ****** 80 to 140
Ag Index 11 ratio ******************************* 3 to 10
Method Normal
CO2 Evolution TMECC 05.08 0.5 ** 1 to 7
TMECC 05.08 0.2 **** 0.5 to 5
TMECC 05.08 0.10 *** 10 to 100
Stable
Nutrients
mg CO2-C/g OM/day
mg CO2-C/g TS/day
mg NH3-N /kg /day
NormalLow
Respiration & Stability
LowUnits
.
HighNormal
Stability Rating
Sample was received, handled and tested in accordance with TMECC procedures
High

Page 2
Client: WSU Product: Compost 2_003 Date Reported: 10/09/14
2606 W Pioneer Ave Date Sampled: 09/11/14 Laboratory # C14-581
Puyaallup, WA 98371 Date Received: 09/17/14 Reveiwed by Brent Thyssen, CPSSc
253-445-4592
Method Units Normal
Emergence TMECC 05.05A 100 % *********************************** 80 to 100
Vigor TMECC 05.05A 99 % ******************************** 85 to 100
Plant Description Mature
Date Tested 1/0/1900
Method units Normal
Fecal Coliforms TMECC 07.01B Not Tested MPN/g Less than 1000
Salmonella TMECC 07.01c Not Tested MPN/4g Less than 3
ND = None Detected
Dry Wt. Units WAC Limit
Arsenic 7.5 mg/kg ******** 20
Cadmium 0.2 mg/kg **** 10
Chromium 26.6 mg/kg -
Cobalt 6.1 mg/kg -
Copper 43.1 mg/kg **** 750
Lead 38.8 mg/kg **** 150
Mercury 0.04 mg/kg **** 8
Molybdenum 3.3 mg/kg ************** 9
Nickel 18.9 mg/kg **** 210
Selenium 0.5 mg/kg **** 18
Zinc 153 mg/kg **** 1400
Pass
inches mm % Passing Inerts % by wt.
3 76.2 100
2 50 100 Total Plastic 0.00
1 25 100 Film Plastic 0.00
3/4 19.1 100 Glass 0.00
5/8 16 100 Metal 0.00
1/2" 12.5 100 Sharps 0.00
3/8" 9.5 100
1/4" 6.3 100
.
Pathogens
NormalLow
Method
TMECC 04.12B/04.14A
Low
WAC 173-350-220
TMECC 04.12B/04.14A
TMECC 04.12B/04.14A
TMECC 04.12B/04.14A
TMECC 04.12B/04.14A
Cucumber Bioassay
Low Normal High
TMECC 04.12B/04.14A
Normal
TMECC 04.12B/04.14A
TMECC 04.12B/04.14A
TMECC 04.12B/04.14A
High
Sample was received, handled and tested in accordance with TMECC procedures
TMECC 04.12B/04.14A
TMECC 04.12B/04.14A
Particle Size Distribution TMECC 2.02 B & C

Page 1
Client: WSU Product: Compost 2_003 Date Reported: 10/09/14
Attn: Maninder Chahal Date Sampled: 09/11/14 Laboratory # C14-582
2606 W Pioneer Ave Date Received: 09/17/14 Reveiwed by Brent Thyssen, CPSSc
Puyaallup, WA 98371
253-445-4592 Amount: 147.00$
Method As Rcvd. Dry Wt. Units Typical Range
Moisture 70 C 26.0 % **************** 15 to 40
Solids 70 C 74.0 % ***************** 60 to 85
pH 1:5 6.6 NA SU ************* 5.5 to 8.5
E.C 1:5 3.64 4.92 mmhos/cm ******************** below 5.0
Total N TMECC 04.02D 1.42 1.92 % ************* 1 to 5
Organic C TMECC 04.01A 14.0 18.9 % ************* 18 to 45
Organic Matter TMECC 05.07A 27.4 37.0 % ******* 40 to 60
Ash 550 C 46.6 63.0 % ******************************** 40 to 60
Ammonium -N TMECC 05.02C 5 7 mg/kg *** 90 to 450
Nitrate-N TMECC 04.02B 1305.0 1763.0 mg/kg 50 to 250
Chloride TMECC 04.12D 1636 2210 mg/kg ************ 500 to 5000
Sulfate-S TMECC 04.12D 284 384 mg/kg
CaCO3 TMECC 04.08A 41 56 lbs/T ***************** 20 to 80
Phosphorus TMECC 04.12B/04.14A 0.18 0.24 %
P2O5 0.41 0.55 % ********* 1 to 8
Potassium TMECC 04.12B/04.14A 0.97 1.32 %
K2O 1.17 1.58 % **** 3 to 12
Calcium TMECC 04.12B/04.14A 1.13 1.5 % ************* 0.5 to 10
Magnesium TMECC 04.12B/04.14A 0.37 0.50 % *********************** 0.05 to 0.7
Sodium TMECC 04.12B/04.14A 0.07 0.09 % ************ 0.05 to 0.7
Sulfur TMECC 04.12B/04.14A 0.16 0.22 % **************** 0.1 to 1.0
Boron TMECC 04.12B/04.14A 12.0 16.2 mg/kg ************ 25 to 150
Zinc TMECC 04.12B/04.14A 127 171 mg/kg ************* 100 to 600
Manganese TMECC 04.12B/04.14A 315 425 mg/kg ******************** 250 to 750
Copper TMECC 04.12B/04.14A 33 45 mg/kg *** 100 to 500
Iron TMECC 04.12B/04.14A 10208 13790 mg/kg *********************** 1000 to 25000
C/N ratio 10 ratio **** 18 to 24
C/P Ratio 78 ratio ****** 80 to 140
Ag Index 11 ratio ******************************* 3 to 10
Method Normal
CO2 Evolution TMECC 05.08 0.4 ** 1 to 7
TMECC 05.08 0.2 **** 0.5 to 5
TMECC 05.08 0.06 *** 10 to 100
Stable
Nutrients
mg CO2-C/g OM/day
mg CO2-C/g TS/day
mg NH3-N /kg /day
NormalLow
Respiration & Stability
LowUnits
.
HighNormal
Stability Rating
Sample was received, handled and tested in accordance with TMECC procedures
High

Page 2
Client: WSU Product: Compost 2_003 Date Reported: 10/09/14
2606 W Pioneer Ave Date Sampled: 09/11/14 Laboratory # C14-582
Puyaallup, WA 98371 Date Received: 09/17/14 Reveiwed by Brent Thyssen, CPSSc
253-445-4592
Method Units Normal
Emergence TMECC 05.05A 100 % *********************************** 80 to 100
Vigor TMECC 05.05A 92 % ******************************** 85 to 100
Plant Description Mature
Date Tested 1/0/1900
Method units Normal
Fecal Coliforms TMECC 07.01B Not Tested MPN/g Less than 1000
Salmonella TMECC 07.01c Not Tested MPN/4g Less than 3
ND = None Detected
Dry Wt. Units WAC Limit
Arsenic 9.7 mg/kg ******** 20
Cadmium 0.3 mg/kg **** 10
Chromium 21.6 mg/kg -
Cobalt 6.4 mg/kg -
Copper 44.7 mg/kg **** 750
Lead 41.2 mg/kg **** 150
Mercury 0.05 mg/kg **** 8
Molybdenum 3.1 mg/kg ************** 9
Nickel 17.7 mg/kg **** 210
Selenium 0.5 mg/kg **** 18
Zinc 171 mg/kg **** 1400
Pass
inches mm % Passing Inerts % by wt.
3 76.2 100
2 50 100 Total Plastic 0.00
1 25 100 Film Plastic 0.00
3/4 19.1 100 Glass 0.00
5/8 16 100 Metal 0.00
1/2" 12.5 100 Sharps 0.00
3/8" 9.5 100
1/4" 6.3 100
.
Pathogens
NormalLow
Method
TMECC 04.12B/04.14A
Low
WAC 173-350-220
TMECC 04.12B/04.14A
TMECC 04.12B/04.14A
TMECC 04.12B/04.14A
TMECC 04.12B/04.14A
Cucumber Bioassay
Low Normal High
TMECC 04.12B/04.14A
Normal
TMECC 04.12B/04.14A
TMECC 04.12B/04.14A
TMECC 04.12B/04.14A
High
Sample was received, handled and tested in accordance with TMECC procedures
TMECC 04.12B/04.14A
TMECC 04.12B/04.14A
Particle Size Distribution TMECC 2.02 B & C

Page 1
Client: WSU Product: Compost 1_001 Date Reported: 09/16/14
Attn: Maninder Chahal Date Sampled: 08/18/14 Laboratory # C14-531
2606 W Pioneer Ave Date Received: 08/27/14 Reveiwed by Brent Thyssen, CPSSc
Puyaallup, WA 98371
253-445-4592 Amount: 147.00$
Method As Rcvd. Dry Wt. Units Typical Range
Moisture 70 C 43.0 % ************************** 15 to 40
Solids 70 C 57.0 % *********** 60 to 85
pH 1:5 8.4 NA SU ***************** 5.5 to 8.5
E.C 1:5 2.4 4.21 mmhos/cm ************** below 5.0
Total N TMECC 04.02D 0.96 1.68 % ************* 1 to 5
Organic C TMECC 04.01A 11.1 19.4 % ************* 18 to 45
Organic Matter TMECC 05.07A 21.3 37.3 % ******* 40 to 60
Ash 550 C 35.8 62.7 % ******************************** 40 to 60
Ammonium -N TMECC 05.02C 1155 2025 mg/kg ******************************* 90 to 450
Nitrate-N TMECC 04.02B 18.5 32.4 mg/kg ******* 50 to 250
Chloride TMECC 04.12D 1941 3403 mg/kg *********************** 500 to 5000
Sulfate-S TMECC 04.12D 100 175 mg/kg
CaCO3 TMECC 04.08A 38 66 lbs/T *********************** 20 to 80
Phosphorus TMECC 04.12B/04.14A 0.18 0.32 %
P2O5 0.42 0.73 % ********* 1 to 8
Potassium TMECC 04.12B/04.14A 0.67 1.18 %
K2O 0.81 1.41 % **** 3 to 12
Calcium TMECC 04.12B/04.14A 0.78 1.4 % ************* 0.5 to 10
Magnesium TMECC 04.12B/04.14A 0.28 0.49 % *********************** 0.05 to 0.7
Sodium TMECC 04.12B/04.14A 0.04 0.08 % ************ 0.05 to 0.7
Sulfur TMECC 04.12B/04.14A 0.11 0.20 % **************** 0.1 to 1.0
Boron TMECC 04.12B/04.14A 8.0 14.1 mg/kg ************ 25 to 150
Zinc TMECC 04.12B/04.14A 88 155 mg/kg ************* 100 to 600
Manganese TMECC 04.12B/04.14A 230 403 mg/kg ******************** 250 to 750
Copper TMECC 04.12B/04.14A 23 41 mg/kg *** 100 to 500
Iron TMECC 04.12B/04.14A 7718 13530 mg/kg *********************** 1000 to 25000
C/N ratio 12 ratio ******** 18 to 24
C/P Ratio 61 ratio ****** 80 to 140
Ag Index 8 ratio *********************** 3 to 10
Method Normal
CO2 Evolution TMECC 05.08 2.2 ************ 1 to 7
TMECC 05.08 1.4 ************* 0.5 to 5
TMECC 05.08 46.1 *********************** 10 to 100
Stable
Nutrients
mg CO2-C/g OM/day
mg CO2-C/g TS/day
mg NH3-N /kg /day
NormalLow
Respiration & Stability
LowUnits
.
HighNormal
Stability Rating
Sample was received, handled and tested in accordance with TMECC procedures
High

Page 2
Client: WSU Product: Compost 1_001 Date Reported: 09/16/14
2606 W Pioneer Ave Date Sampled: 08/18/14 Laboratory # C14-531
Puyaallup, WA 98371 Date Received: 08/27/14 Reveiwed by Brent Thyssen, CPSSc
253-445-4592
Method Units Normal
Emergence TMECC 05.05A 100 % *********************************** 80 to 100
Vigor TMECC 05.05A 100 % ************************************* 85 to 100
Plant Description Mature
Date Tested 1/0/1900
Method units Normal
Fecal Coliforms TMECC 07.01B Not Tested MPN/g Less than 1000
Salmonella TMECC 07.01c Not Tested MPN/4g Less than 3
ND = None Detected
Dry Wt. Units WAC Limit
Arsenic 8.4 mg/kg ******** 20
Cadmium 0.3 mg/kg **** 10
Chromium 21.0 mg/kg -
Cobalt 6.4 mg/kg -
Copper 40.7 mg/kg **** 750
Lead 35.1 mg/kg **** 150
Mercury 0.05 mg/kg **** 8
Molybdenum 1.9 mg/kg ********** 9
Nickel 20.6 mg/kg **** 210
Selenium 0.5 mg/kg **** 18
Zinc 155 mg/kg **** 1400
Pass
inches mm % Passing Inerts % by wt.
3 76.2 100
2 50 100 Total Plastic 0.00
1 25 100 Film Plastic 0.00
3/4 19.1 100 Glass 0.00
5/8 16 100 Metal 0.00
1/2" 12.5 100 Sharps 0.00
3/8" 9.5 100
1/4" 6.3 95
.
Pathogens
NormalLow
Method
TMECC 04.12B/04.14A
Low
WAC 173-350-220
TMECC 04.12B/04.14A
TMECC 04.12B/04.14A
TMECC 04.12B/04.14A
TMECC 04.12B/04.14A
Cucumber Bioassay
Low Normal High
TMECC 04.12B/04.14A
Normal
TMECC 04.12B/04.14A
TMECC 04.12B/04.14A
TMECC 04.12B/04.14A
High
Sample was received, handled and tested in accordance with TMECC procedures
TMECC 04.12B/04.14A
TMECC 04.12B/04.14A
Particle Size Distribution TMECC 2.02 B & C
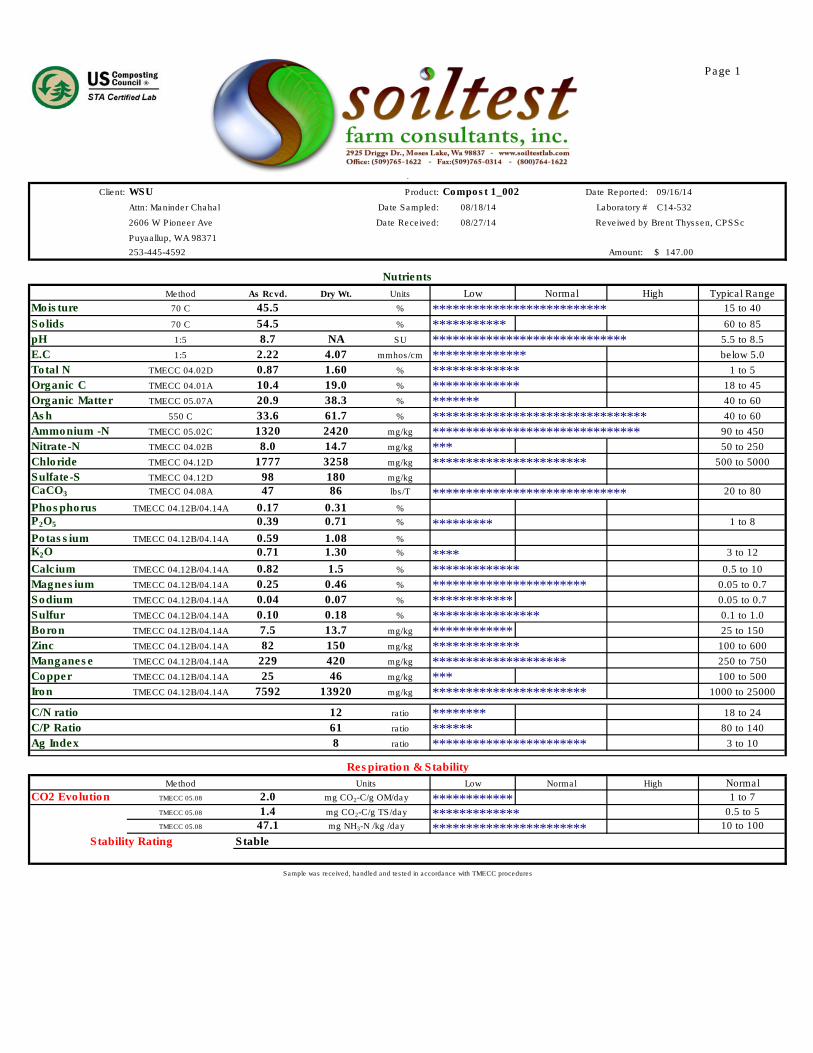
Page 1
Client: WSU Product: Compost 1_002 Date Reported: 09/16/14
Attn: Maninder Chahal Date Sampled: 08/18/14 Laboratory # C14-532
2606 W Pioneer Ave Date Received: 08/27/14 Reveiwed by Brent Thyssen, CPSSc
Puyaallup, WA 98371
253-445-4592 Amount: 147.00$
Method As Rcvd. Dry Wt. Units Typical Range
Moisture 70 C 45.5 % ************************** 15 to 40
Solids 70 C 54.5 % *********** 60 to 85
pH 1:5 8.7 NA SU ***************************** 5.5 to 8.5
E.C 1:5 2.22 4.07 mmhos/cm ************** below 5.0
Total N TMECC 04.02D 0.87 1.60 % ************* 1 to 5
Organic C TMECC 04.01A 10.4 19.0 % ************* 18 to 45
Organic Matter TMECC 05.07A 20.9 38.3 % ******* 40 to 60
Ash 550 C 33.6 61.7 % ******************************** 40 to 60
Ammonium -N TMECC 05.02C 1320 2420 mg/kg ******************************* 90 to 450
Nitrate-N TMECC 04.02B 8.0 14.7 mg/kg *** 50 to 250
Chloride TMECC 04.12D 1777 3258 mg/kg *********************** 500 to 5000
Sulfate-S TMECC 04.12D 98 180 mg/kg
CaCO3 TMECC 04.08A 47 86 lbs/T ***************************** 20 to 80
Phosphorus TMECC 04.12B/04.14A 0.17 0.31 %
P2O5 0.39 0.71 % ********* 1 to 8
Potassium TMECC 04.12B/04.14A 0.59 1.08 %
K2O 0.71 1.30 % **** 3 to 12
Calcium TMECC 04.12B/04.14A 0.82 1.5 % ************* 0.5 to 10
Magnesium TMECC 04.12B/04.14A 0.25 0.46 % *********************** 0.05 to 0.7
Sodium TMECC 04.12B/04.14A 0.04 0.07 % ************ 0.05 to 0.7
Sulfur TMECC 04.12B/04.14A 0.10 0.18 % **************** 0.1 to 1.0
Boron TMECC 04.12B/04.14A 7.5 13.7 mg/kg ************ 25 to 150
Zinc TMECC 04.12B/04.14A 82 150 mg/kg ************* 100 to 600
Manganese TMECC 04.12B/04.14A 229 420 mg/kg ******************** 250 to 750
Copper TMECC 04.12B/04.14A 25 46 mg/kg *** 100 to 500
Iron TMECC 04.12B/04.14A 7592 13920 mg/kg *********************** 1000 to 25000
C/N ratio 12 ratio ******** 18 to 24
C/P Ratio 61 ratio ****** 80 to 140
Ag Index 8 ratio *********************** 3 to 10
Method Normal
CO2 Evolution TMECC 05.08 2.0 ************ 1 to 7
TMECC 05.08 1.4 ************* 0.5 to 5
TMECC 05.08 47.1 *********************** 10 to 100
Stable
.
HighNormal
Stability Rating
Sample was received, handled and tested in accordance with TMECC procedures
High
Nutrients
mg CO2-C/g OM/day
mg CO2-C/g TS/day
mg NH3-N /kg /day
NormalLow
Respiration & Stability
LowUnits
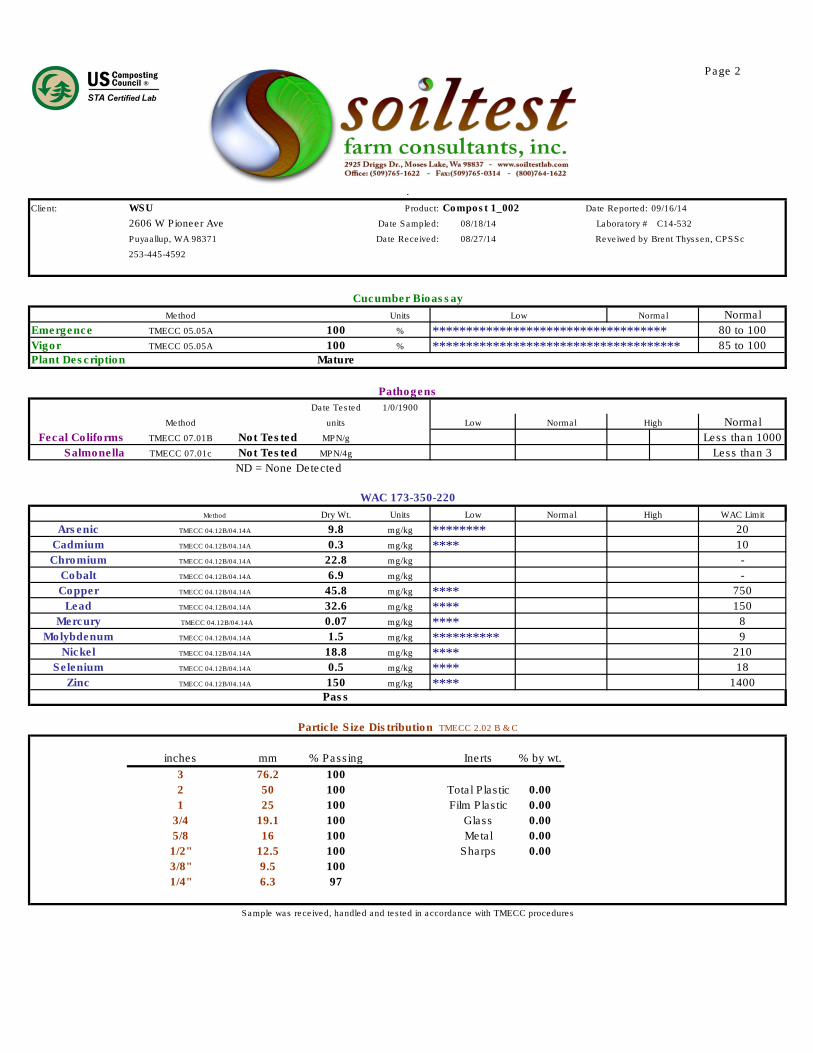
Page 2
Client: WSU Product: Compost 1_002 Date Reported: 09/16/14
2606 W Pioneer Ave Date Sampled: 08/18/14 Laboratory # C14-532
Puyaallup, WA 98371 Date Received: 08/27/14 Reveiwed by Brent Thyssen, CPSSc
253-445-4592
Method Units Normal
Emergence TMECC 05.05A 100 % *********************************** 80 to 100
Vigor TMECC 05.05A 100 % ************************************* 85 to 100
Plant Description Mature
Date Tested 1/0/1900
Method units Normal
Fecal Coliforms TMECC 07.01B Not Tested MPN/g Less than 1000
Salmonella TMECC 07.01c Not Tested MPN/4g Less than 3
ND = None Detected
Dry Wt. Units WAC Limit
Arsenic 9.8 mg/kg ******** 20
Cadmium 0.3 mg/kg **** 10
Chromium 22.8 mg/kg -
Cobalt 6.9 mg/kg -
Copper 45.8 mg/kg **** 750
Lead 32.6 mg/kg **** 150
Mercury 0.07 mg/kg **** 8
Molybdenum 1.5 mg/kg ********** 9
Nickel 18.8 mg/kg **** 210
Selenium 0.5 mg/kg **** 18
Zinc 150 mg/kg **** 1400
Pass
inches mm % Passing Inerts % by wt.
3 76.2 100
2 50 100 Total Plastic 0.00
1 25 100 Film Plastic 0.00
3/4 19.1 100 Glass 0.00
5/8 16 100 Metal 0.00
1/2" 12.5 100 Sharps 0.00
3/8" 9.5 100
1/4" 6.3 97
Sample was received, handled and tested in accordance with TMECC procedures
TMECC 04.12B/04.14A
TMECC 04.12B/04.14A
Particle Size Distribution TMECC 2.02 B & C
Cucumber Bioassay
Low Normal High
TMECC 04.12B/04.14A
Normal
TMECC 04.12B/04.14A
TMECC 04.12B/04.14A
TMECC 04.12B/04.14A
HighMethod
TMECC 04.12B/04.14A
Low
WAC 173-350-220
TMECC 04.12B/04.14A
TMECC 04.12B/04.14A
TMECC 04.12B/04.14A
TMECC 04.12B/04.14A
.
Pathogens
NormalLow
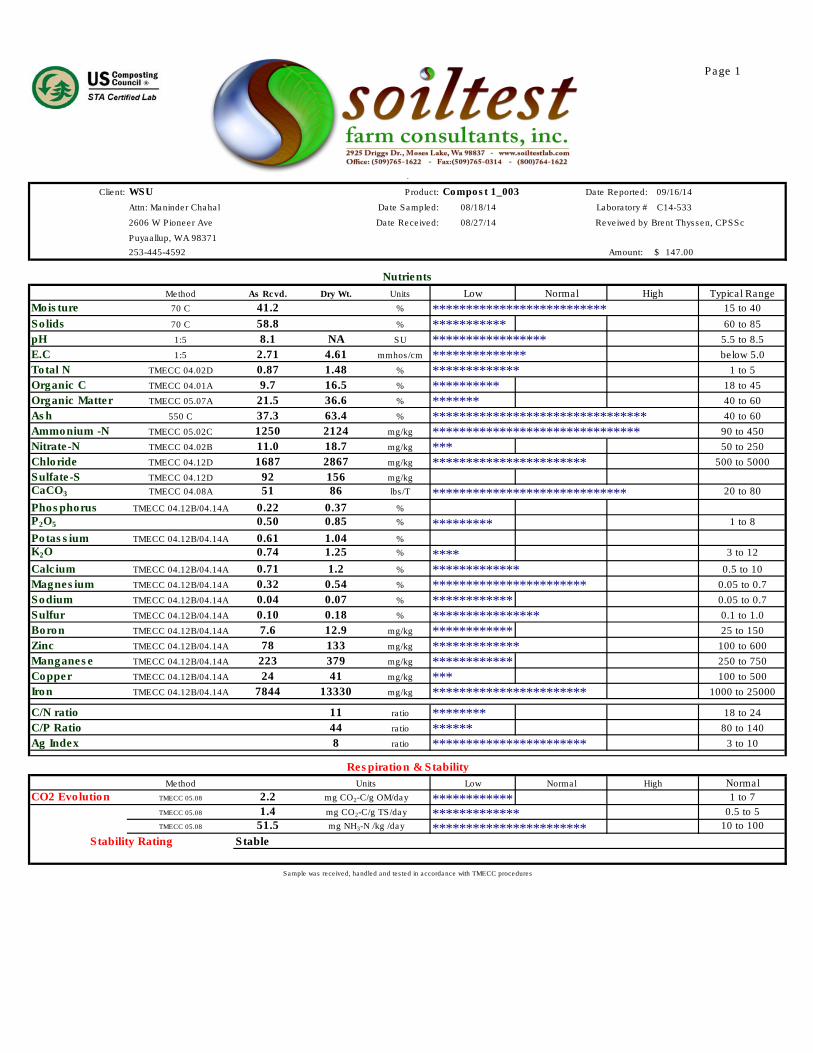
Page 1
Client: WSU Product: Compost 1_003 Date Reported: 09/16/14
Attn: Maninder Chahal Date Sampled: 08/18/14 Laboratory # C14-533
2606 W Pioneer Ave Date Received: 08/27/14 Reveiwed by Brent Thyssen, CPSSc
Puyaallup, WA 98371
253-445-4592 Amount: 147.00$
Method As Rcvd. Dry Wt. Units Typical Range
Moisture 70 C 41.2 % ************************** 15 to 40
Solids 70 C 58.8 % *********** 60 to 85
pH 1:5 8.1 NA SU ***************** 5.5 to 8.5
E.C 1:5 2.71 4.61 mmhos/cm ************** below 5.0
Total N TMECC 04.02D 0.87 1.48 % ************* 1 to 5
Organic C TMECC 04.01A 9.7 16.5 % ********** 18 to 45
Organic Matter TMECC 05.07A 21.5 36.6 % ******* 40 to 60
Ash 550 C 37.3 63.4 % ******************************** 40 to 60
Ammonium -N TMECC 05.02C 1250 2124 mg/kg ******************************* 90 to 450
Nitrate-N TMECC 04.02B 11.0 18.7 mg/kg *** 50 to 250
Chloride TMECC 04.12D 1687 2867 mg/kg *********************** 500 to 5000
Sulfate-S TMECC 04.12D 92 156 mg/kg
CaCO3 TMECC 04.08A 51 86 lbs/T ***************************** 20 to 80
Phosphorus TMECC 04.12B/04.14A 0.22 0.37 %
P2O5 0.50 0.85 % ********* 1 to 8
Potassium TMECC 04.12B/04.14A 0.61 1.04 %
K2O 0.74 1.25 % **** 3 to 12
Calcium TMECC 04.12B/04.14A 0.71 1.2 % ************* 0.5 to 10
Magnesium TMECC 04.12B/04.14A 0.32 0.54 % *********************** 0.05 to 0.7
Sodium TMECC 04.12B/04.14A 0.04 0.07 % ************ 0.05 to 0.7
Sulfur TMECC 04.12B/04.14A 0.10 0.18 % **************** 0.1 to 1.0
Boron TMECC 04.12B/04.14A 7.6 12.9 mg/kg ************ 25 to 150
Zinc TMECC 04.12B/04.14A 78 133 mg/kg ************* 100 to 600
Manganese TMECC 04.12B/04.14A 223 379 mg/kg ************ 250 to 750
Copper TMECC 04.12B/04.14A 24 41 mg/kg *** 100 to 500
Iron TMECC 04.12B/04.14A 7844 13330 mg/kg *********************** 1000 to 25000
C/N ratio 11 ratio ******** 18 to 24
C/P Ratio 44 ratio ****** 80 to 140
Ag Index 8 ratio *********************** 3 to 10
Method Normal
CO2 Evolution TMECC 05.08 2.2 ************ 1 to 7
TMECC 05.08 1.4 ************* 0.5 to 5
TMECC 05.08 51.5 *********************** 10 to 100
Stable
Nutrients
mg CO2-C/g OM/day
mg CO2-C/g TS/day
mg NH3-N /kg /day
NormalLow
Respiration & Stability
LowUnits
.
HighNormal
Stability Rating
Sample was received, handled and tested in accordance with TMECC procedures
High

Page 2
Client: WSU Product: Compost 1_003 Date Reported: 09/16/14
2606 W Pioneer Ave Date Sampled: 08/18/14 Laboratory # C14-533
Puyaallup, WA 98371 Date Received: 08/27/14 Reveiwed by Brent Thyssen, CPSSc
253-445-4592
Method Units Normal
Emergence TMECC 05.05A 97 % ******************************** 80 to 100
Vigor TMECC 05.05A 91 % ******************************** 85 to 100
Plant Description Mature
Date Tested 1/0/1900
Method units Normal
Fecal Coliforms TMECC 07.01B Not Tested MPN/g Less than 1000
Salmonella TMECC 07.01c Not Tested MPN/4g Less than 3
ND = None Detected
Dry Wt. Units WAC Limit
Arsenic 8.2 mg/kg ******** 20
Cadmium 0.2 mg/kg **** 10
Chromium 26.7 mg/kg -
Cobalt 7.3 mg/kg -
Copper 40.7 mg/kg **** 750
Lead 30.7 mg/kg **** 150
Mercury 0.04 mg/kg **** 8
Molybdenum 2.1 mg/kg ************** 9
Nickel 22.4 mg/kg **** 210
Selenium 0.5 mg/kg **** 18
Zinc 133 mg/kg **** 1400
Pass
inches mm % Passing Inerts % by wt.
3 76.2 100
2 50 100 Total Plastic 0.00
1 25 100 Film Plastic 0.00
3/4 19.1 100 Glass 0.00
5/8 16 100 Metal 0.00
1/2" 12.5 100 Sharps 0.00
3/8" 9.5 100
1/4" 6.3 95
.
Pathogens
NormalLow
Method
TMECC 04.12B/04.14A
Low
WAC 173-350-220
TMECC 04.12B/04.14A
TMECC 04.12B/04.14A
TMECC 04.12B/04.14A
TMECC 04.12B/04.14A
Cucumber Bioassay
Low Normal High
TMECC 04.12B/04.14A
Normal
TMECC 04.12B/04.14A
TMECC 04.12B/04.14A
TMECC 04.12B/04.14A
High
Sample was received, handled and tested in accordance with TMECC procedures
TMECC 04.12B/04.14A
TMECC 04.12B/04.14A
Particle Size Distribution TMECC 2.02 B & C

B Appendix B
Reports of chemical analyses from ARI and Spectra Laboratories.
A2