experimental efforts for predictive computational fluid dynamics validation1 …€¦ · ·...
TRANSCRIPT

1
EXPERIMENTAL EFFORTS FOR PREDICTIVE COMPUTATIONAL FLUID DYNAMICS VALIDATION1
J. R. Buchanan, Jr. and R. C. Bauer
Bechtel Marine Propulsion Corporation Bettis Laboratory; P. O. Box 79
West Mifflin, PA, USA 15122
1 The United States Government retains, and by accepting the article for publication, the publisher acknowledges that the United
States Government retains, a non-exclusive, paid-up, irrevocable, worldwide license to publish or reproduce the published form of this work, or allow others to do so, for United States Government purposes.
Abstract Ideally, Validation and Verification methods to be used to deliver Predictive Computational Fluid Dynamics (P-CFD) methods for design use, must utilize a consistent set of detailed input to perform an output response comparison to associated data that can accurately characterize the uncertainty in the calculated results. In this paper, some experimental efforts are described and discussed in relation to their use in Predictive CFD Validation. The P-CFD methodology will be used in a design-by-simulation methodology to design large, complex hydraulic system geometries comprising multiple scales of physical phenomena. Currently, comparisons are made between experiments and CFD at the same integrated-effects scale and it is difficult to identify the causes for why computational predictions do well or the reasons for discrepancies should they arise. Instead of large system or subsystem level tests, the focus for P-CFD Validation-level experimental studies is to concentrate on elucidating the fundamental fluid mechanics of unit physics phenomena. These unit and benchmark experiments can be performed in such a way that the uncertainty in the results can be systematically quantified and provide far greater experimental data density than integrated-effects scale testing. It is this systematic quantification of uncertainty in both the computational and experimental results that forms the basis for Predictive CFD. Examples of validation-level experimental efforts including a surface-mounted cube, bluff bodies in cross flow, and an impinging radial diffuser flow will be discussed. These experimental efforts have enabled us to begin to identify the needed approaches for acquiring comprehensive documentation of the input for underpinning P-CFD principles. These lessons including information about the as-built geometry, the flow conditions, as well as boundary conditions able to be transferred to the analysis will be described. One key finding is that validation-level experiments and the associated analysis must be cooperative between the testing groups and the analysis groups to be successful. Regular communications between the analysts and the experimentalists is crucial in all phases of these studies. In addition, the importance of uncertainty quantification in both the experiments and analysis relating to Predictive CFD Validation will be discussed. Finally, the vision for the design use of Predictive CFD, the key being analysis results with quantified uncertainty, is described. 1. INTRODUCTION The goal of Predictive CFD methods is to provide a tool for the use in design beyond a heuristic experience base and into novel parameter spaces. Confidence in the underlying physical models must be reliably demonstrated through the process of CFD validation. It is the goal of this paper to differentiate traditional CFD practices and those we are identifying to deliver predictive CFD methods in the design process. Typically, the traditional means of testing to qualify a computer code is to build a scale test incorporating as many prototypic design features as possible. Detailed local information cannot be acquired in these facilities and comparisons to CFD predictions are inconclusive relative to quantifying the uncertainty between the experiments and the computations. In the case of poor comparisons, it is often possible to calibrate models to better predict these integral effects measurements, but this paper posits that this is insufficient to achieve a predictive capability for CFD over a wide application domain. For CFD codes which predict local flow field behavior, local information must be provided for reliable comparisons. This is not to discount the value of these scale tests for comparison purposes, but they are insufficient to validate P-CFD methods (Lee & Bauer 2009). Specific experiments designed for acquiring local flow field information are necessary to compare to the physical models implemented in modern CFD codes.

2
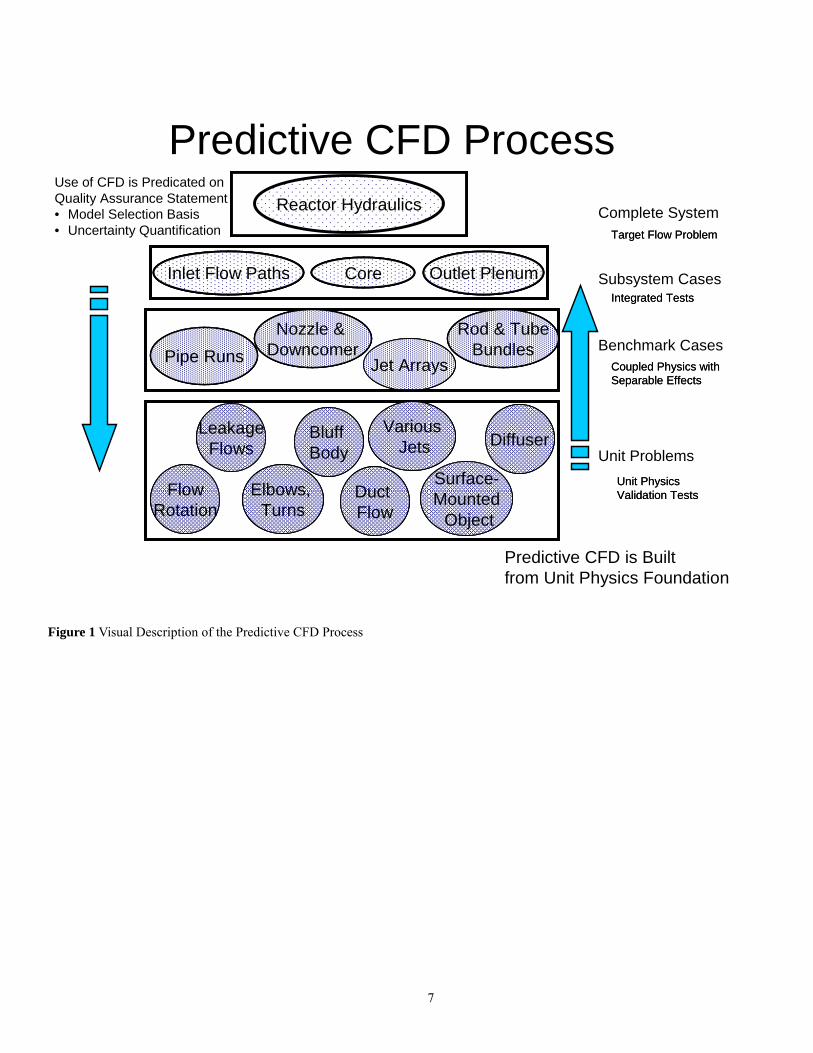
The predictive CFD process is built upon a CFD validation pyramid as shown in Figure 1. The idea is analogous to a Phenomena Identification Ranking Table (PIRT) used in nuclear safety code analysis where the application is at the top of the pyramid, in this case reactor hydraulics, and the system is broken into finer levels of granularity progressing down through the levels. In this sense, the validation pyramid presented in Figure 1 is a specific instantiation of the validation hierarchy suggested by the AIAA (1998) and as discussed in Lee & Bauer (2009), similar notation is adopted. The complete system can be broken down into subsystem cases, typically where the scale tests discussed above reside. The subsystem is then separable into the benchmark level, where coupled physics often prevail however separable effects, such as geometry or scaling parameters can be investigated. The foundation of the pyramid is at the unit level where the relevant fluid physics are of interest. As discussed in the AIAA guide and in the validation pyramid, the application of CFD is from the top downward, focusing on the end use in design. However, P-CFD validation is in the opposite direction. The level of detail necessary to address the turbulent flow physics are best addressed at the unit level. Experiments at the unit and benchmark level that can form the basis for development of Predictive CFD methods are the focus of this paper.
To enable P-CFD, both the experiments and the computations must be of sufficient quality with quantified uncertainties to enable a comprehensive validation assessment (Lee & Bauer, 2009). Towards that goal, three sets of experiments are currently being assessed with the goal of identifying the experimental data requirements needed to assure sufficient quality and density to perform P-CFD validation studies. These are flow past a surface-mounted cube (cf. Fore et al., 2005), flow around a bluff body discussed in Jeffries et al. (2009) and an impinging diffuser flow (IDF), which is discussed in Lorentz et al. (2009). The latter two of these experiments were performed or are being performed at the Pennsylvania State University Applied Research Laboratory (PSU/ARL). The bluff body and surface-mounted cube are considered Unit level experiments whereas the IDF test is considered a Benchmark CFD validation study, i.e., the second level of the P-CFD validation pyramid. The IDF experiment consists of a jet issuing from sharp nozzle, impinging on a surface and turning in a confined space, diffusing radially from the stagnation point. As such, the IDF is comprised of Unit level physics relating to free jets, stagnation point flow and boundary layer flows with a favorable pressure gradient. The overall goal of the experimental program is to provide P-CFD Validation experimental data for high Reynolds number internal flows.
This paper discusses lessons learned in the experimental characterizations of these experiments to date and future plans. Informing these developments are the “Seven Pillars” of Predictive CFD Validation as introduced in Lee & Bauer (2009). CFD Validation is a comparison of the input versus output. The collection and documentation of the input is part of the experimental program that provides the basis for the CFD models. Thus, decisions about the necessary input must include participation of both the experimentalists and the analysts to make the venture successful. The goal of the seven pillars is to characterize the uncertainty in both the experimental data and the computational results of local flow field parameters. The purpose for determining the uncertainty quantification is for performing the comparisons as a part of the CFD validation. Much like comparing CFD results to integral effects data; it is difficult to assess output comparisons of experiments and computations without confidence intervals. The goal of the Predictive CFD Validation pyramid is to be able to perform comparisons at the unit level that give the right results for the right reasons. Building up through the pyramid to the ultimate application and carrying the uncertainty quantification through those levels provides the basis for the design use of Predictive CFD through an appropriate CFD Quality Assurance statement. The context of this CFD Quality Assurance statement will be described later. In what follows, the experimental and computational methods will be briefly described. Much more emphasis will be placed on discussion of the results of the various test programs to date and how they tie into lessons learned in developing an experimental fluid dynamics framework for CFD validation studies. The paper will conclude with a future work plans and how CFD validation ties into the delivery of Predictive CFD methods.

3
2. METHODS
The descriptions of experimental and computational efforts herein are not intended to be comprehensive. Instead, an overview of the experimental and computational approaches will be described briefly for context within the P-CFD approach we are discussing. The references by Lee and Bauer (2009), Jeffries et al. (2009) and Lorentz et al. (2009) provide complementary, detailed discussions. 2.1 Experimental Methods Overview We have used the experiments noted above to initiate development of principles for data sets that are sufficient for Predictive validation considerations. The first task in capturing the experiment for P-CFD support is to record the as-built geometry for use in the modeling. Every attempt is made to record as much information as possible, but a few assumptions have to be made to generate the complete computational representation. The measured coordinates as well as necessary assumptions are formally documented in a Geometry of Record which consists of CAD solid models as well as drawings and a description of the model geometry. As part of this, the coordinate measurement uncertainties as well as the uncertainty estimates based on the assumptions are included in this record. We have adopted the term “Geometry of Record” to denote the full characterization of the test as built geometry and conditions Test data sources for P-CFD require detailed measurements of the associated local flow fields using techniques such as Laser Doppler Velocimetry (LDV), Particle Image Velocimetry (PIV), differential pressure, and static pressure measurements. Where possible, coincident LDV scans and PIV fields of view (FOV) are acquired to provide a quality check on both the mean velocity field as well as the turbulent statistics. In addition to these detailed field interrogations of the flow physics in a particular experiment, relevant input information must be acquired. Engineered flow conditioners can go a long way towards generating uniform flow, but the importance measuring the spatial variation in the inlet flow cannot be overemphasized. Assuming a fully developed or top hat type velocity profile as input is a source of uncertainty that can be minimized. A representative example of measuring the inlet boundary condition will be discussed later. Finally, the a record of the loop conditions during the data acquisition phases is also important for setting material properties as a part of the input and in interpreting experimental results. We have termed the data sets which meet the above goals for P-FCD as validation-level data sets.
2.2 Computational Methods Overview Beginning with a documented Geometry of Record, comprehensive CFD models of the associated geometry are developed. We have constructed such solid models using Pro/ENGINEER (v. 2001 and WildFire v. 2.0, PTC, Needham, MA). Surfaces are tagged in Pro/ENGINEER using the Pro/ENGINEER - ICEM CFD direct interface (v. 11.0.1, ANSYS, Inc., Canonsburg, PA) to write out the geometry in native ICEM CFD (tetin) format for subsequent mesh development. For the analysis presented, the HEXA module of ANSYS ICEM CFD (v. 11.0 SP1, ANSYS, Inc., Canonsburg, PA) was used to generate hexahedral meshes. Multiple mesh sizes are generated for computational uncertainty assessments based on the CFD grid as a part of the Quality Assurance performed on the analysis. From the present work, the surface-mounted cube results reported were performed on a mesh approximately 9 million nodes. Simulations were performed using the realizable cubic k-ε models in CFD++ (v. 7.1.2, Metacomp Technologies, Agoura Hills, CA). Quantitative post-processing is performed using FIELDVIEW (v. 12.1, Intelligent Light, Rutherford, NJ) using a variety of features and relying heavily on the FIELDVIEW Extension Language (FVX) for automation.
3. RESULTS AND DISCUSSION The experiments are discussed in chronological order to reflect the major points that helped evolve the learning process and motivate changes in other CFD validation test programs toward P-CFD Principles. 3.1 Surface-Mounted Cube The surface-mounted cube experiment (Fore et al., 2005) was motivated by the work of Martinuzzi & Tropea (1993a,b) and attempts to compare to the results available as part of the ASME Journal of Fluids Engineering Databank and as Case 6.3 in the ERCOFTAC database. Results of computations showed a significant sensitivity to the inlet boundary conditions

4
either assumed or generated from auxiliary simulations. In order to address the inlet boundary condition uncertainty, experiments were initiated using an existing water tunnel at Bettis (Figure 2) which would not have a fully developed flow. As a part of this work, the ability to engineer optimal flow straighteners was investigated (McKeown & Sapienza, 2004). Velocity measurements at an “inlet” plane to the validation model approximately one third of the way through the water tunnel are shown in Figure 3 for a cube Reynolds number of approximately 20,000. Two-component LDV was used in conjunction with a standard flow conditioning approach, several screens downstream of the asymmetric expansion. As can be seen from the measurements, the flow directly opposite the inlet to the expansion is suppressed and the largest axial velocities are towards the lateral sides of the test section with a strong vertical velocity component. Figure 4 shows the result of applying a compilation of two-component LDV measurements (U & V similar to Figure 3 as well as U & W measurements) to a CFD model of the test section. For comparison, the as measured velocity inlet in the positive-z half of the model is compared to an assumed uniform velocity at the same volumetric flow rate in the negative-z half of the model. The velocity contours between halves of the model are noticeably different as well as details around the cube. For a steady RANS prediction, the uniform inlet condition results in smaller separation downstream of the cube. This work demonstrated the importance of measuring inlet boundary conditions to be applied to the CFD Validation domain. Attention must be paid to flow conditioning as well as methods for applying input data to the CFD model so that precise boundary conditions can be input as the appropriate forcing functions for the P-CFD uncertainty and grid assessment efforts.
3.2 Bluff Body The bluff body in cross flow experiment was performed as a subcontract by PSU/ARL (Jeffries et al., 2009). This work enforced the early need to clearly communicate the requirements for the CFD validation-level testing and evolving their definition considerably. The concept of the Geometry of Record was initiated because, similar to the surface-mounted cube, an existing test section was utilized, in this case the 6” Water Tunnel at the Garfield Facility. Defining precisely the internal wetted dimensions of the water tunnel required several iterations between the organizations before the as-tested geometry was understood by the analysts and the necessary measurements performed at the facility. The information delivered consisted of both qualitative and quantitative data. The qualitative data include flow visualizations of the transient vortex structures downstream and surface flows near the bluff body. The quantitative data included LDV, PIV and static pressure measurements. The reported LDV included the uncertainty analysis and to supplement the processed data, the raw data files were also provided to perform additional conditional averaging. Similarly, the static pressure measurements reported included the uncertainty. The PIV results proved more problematic since only processed results were provided. To avoid this quandary in the future, recent work with ARL has included delivery of the image pairs from the PIV system along with the system description and settings to allow for reprocessing of the image pairs. As noted for P-CFD Validation purposes, it is important to obtain sufficient as built measurements of the test hardware before testing begins, both to allow for parallel computations and experiments, but also because measurements are often easier before and during the assembly phase rather than after the fact. For uncertainty assessment and to create a traceable path, both processed and raw experimental data should be available. For LDV, this entails the burst information and for PIV this includes the image pairs. This creates much higher storage requirements for experimental data, but has proven invaluable in interpreting experimental results. Further details of the bluff body experiment and validation studies of the configuration are discussed in Jeffries et al. (2009).
3.3 Impinging Diffuser Flow The Impinging Diffuser Flow is the second experiment performed at PSU/ARL. As such, the lessons learned for the Bluff Body work applied. More detailed focus was given to gathering as-built dimensions during the assembly process. By the time the as-built dimensions were being provided, a solid model of the experiment was available for updating (Figure 5a). Among the updates to the model were the distance between the nozzle and stagnation plates (Figure 5b), the alignment of the inlet nozzle to the impingement plate (Figure 5c) and details about the inlet pipe and nozzle connection (Figure 5d). These features were incorporated into the solid model with details of the inlet pipe and nozzle connection shown in Figure

5
5e. The importance of knowledge of what is being tested cannot be over emphasized since these are the forcing functions that result in the data obtained and must be accurately incorporated as boundary conditions in the P-CFD models. In the experimental program, a variety of interrogation methods are being applied including LDV, PIV, average static pressure as well as unsteady dynamic pressure measurements. Detailed comparisons of computations and experiments are presented in Lorentz et al. (2009), but one feature of the data collection is coincident collection of LDV, large FOV PIV (i.e., low magnification) and small FOV PIV (i.e., high magnification). This provides a useful corroboration between experimental techniques and opportunities to combine techniques. PIV measurements were performed in the x-z plane with the nozzle discharge in the z-direction and the flow diffusing radially in the x-y plane. Two component LDV measurements were performed opposite the discharge nozzle in the same plane measuring the x and y velocity components. The evolution of the radial velocity is shown in Figure 6 where the open squares are the LDV measurements, the open circles the large FOV PIV and the closed circles the small FOV PIV. The small FOV PIV are only available at present at the x/D = -1 and -2 radial stations in the quarter of the plane closest to the impingement plate. Uncertainty estimates for all three approaches are included in Figure 6. The large FOV PIV uncertainty is most visible with the LDV and small FOV PIV uncertainties noticeable near the wall and in the high velocity gradient regions. To determine the veracity of CFD model predictions, in addition to the velocity predictions, turbulent statistics also must be considered. In Figure 7, the radial development of the axial-radial Reynolds stress component is presented. The larger uncertainty in the large FOV PIV results is again evident and the reason why only comparisons are made to the small FOV PIV in Lorentz et al. (2009). In addition to modeling the turbulent Reynolds stress, two-equation RANS models also predict a turbulent kinetic energy field. By combining the small FOV PIV with coincident LDV locations to generate the trace of the Reynolds stress tensor, the turbulent kinetic energy can be computed as shown in Figure 8. These results are representative of measurements necessary to interrogate local flow physics to attempt to validate turbulent flow predictions.
4. CONCLUSIONS AND FUTURE WORK Bettis Laboratory is pursuing an experimental program to generate validation-level data sets for use in Predictive CFD validation. One important point is that the experiments and analysis must be cooperative with regular communication between both parties. Ideally, CFD validation is input versus output response. However, gathering the input information is a non-trivial task and why regular communication is necessary. A comprehensive documentation of all input is a challenge and must include information about as-tested geometry, flow conditions as well as boundary conditions. Quantification of the uncertainties associated with an experiment and computation is important for any comparison to be valid. Much work remains to be done in the area uncertainty quantification. For the surface-mounted cube, work on the engineered flow conditioner continues as well as more detailed measurements of the inlet boundary condition and fluid dynamics near the cube. The experimental phase of the bluff body study is complete, but the analysis phase continues (cf. Jeffries et al., 2009). Progress in the IDF is discussed in Lorentz et al. (2009) and additional experiments should be performed to provide a more complete CFD validation experiment. 4.1 End State Vision for P-CFD The long term goal of Predictive CFD is to enable the design use of CFD with quantifiable uncertainties in hydraulic design studies up front before large, expensive semi-scale test facilities are built. Referring back to Figure 1, validation of P-CFD is built upon well designed, validation-level experiments which will allow for the predictive capability of tools to be documented and propagated up through the pyramid to the ultimate target. However, today’s use of CFD by designers is often predicated on a top down approach through the validation pyramid. Figure 9 attempts to describe how this loop is closed through the use of a CFD Quality Assurance Statement. The first part is defining the flow problem of interest. In this case a notional flow problem involving parallel flow into a diffuser through a perforated plate and past a bluff body is the problem to be assessed via CFD. This problem can be broken down into the individual component flow paths which can, in turn in the future, be further decomposed into the validation-level data sets underlying the application problem and their relevant flow physics. Through the use of a knowledge management site, best practices guiding model selection and mesh generation can be obtained along with validation assessments related to the design problem and the unit physics and

6
benchmark cases that may have already been catalogued. The CFD Quality Assurance statement that provides the technical basis for the results will utilize the validation assessments to provide an uncertainty estimate related to the original design problem incorporating the model strategy. The goal of P-CFD is to provide a broad validation domain that covers many applications and provide synergy among the datasets at the various levels of the validation pyramid without having to redo testing which already exists to give confidence to the CFD work at hand. Important in realizing this goal is populating the lower levels of the CFD Validation pyramid with validation-level unit physics and separate effects tests that meet the requirements identified herein and in Lee & Bauer (2009). Proprietary application of CFD often resides at the upper level of the pyramid whereas the lower level physics are fundamental enough to avoid this complication. Creation of a shared database resource to populate with unit- and benchmark-level CFD validation experiments would prove to be invaluable in furthering the goal of delivering Predictive CFD. The comprehensive scope of possible lower level experiments is obviously beyond the reach of any single organization and but is possible if populated by many teams of talented researchers. Many flow problems will use the same underlying unit physics and thus will be available to support all studies which need such data in the future.
5. ACKNOWLEDGMENTS The P-CFD Validation work discussed herein is a collaborative effort among analysts and experimentalists across multiple organizations. The efforts of analysts and methods developers D. K. Jeffries, H. B. Lee, D. G. Lorentz and M. A. Ott of the Bettis Laboratory and P. Sapienza of the Westinghouse Electric Company are gratefully acknowledged. The experimental expertise of L. B. Fore, P. T. McKeown, A. T. Tung, J. W. Welch and R. B. Williams of the Bettis Laboratory is appreciated. The efforts of M. H. Krane, H. L. Petrie, A. Fontaine, R. F. Kunz and M. J. Pierzga of the Pennsylvania State University Applied Research Laboratory for the acquisition of the experimental data are gratefully acknowledged.
REFERENCES AIAA “Guide for the Verification and Validation of Computational Fluid Dynamics Simulations,” American Institute of
Aeronautics and Astronautics, AIAA G-077-1998 (1998). Fore, L.B., A. T. Tung, J. R. Buchanan and J. W. Welch “Nonlinear Temporal Filtering of Time-Resolved Digital Particle
Image Velocimetry Data,” Experiments in Fluids, Vol. 39, pp. 22-31 (2005). Jeffries, D. K., M. A. Ott and R. C. Bauer “A Predictive-Computational Fluid Dynamics Validation Assessment of a
Prismatic Bluff Body in Cross Flow,“ ASME 2009 Fluids Engineering Summer Meeting, Vail, CO, August 2 – 6, 2009.
Lee, H. B. and R. C. Bauer (2009) “Predictive Computational Fluid Dynamics Development and Validation: An Overview,” ASME 2009 Fluids Engineering Summer Meeting, Vail, CO, August 2 – 6, 2009, Paper No. FEDSM2009-78147 (2009).
Lorentz, D. G., J. R. Buchanan and R. C. Bauer (2009) “Predictive Computational Fluid Dynamics Validation Assessment of and Impinging Diffuser Flow,” ASME 2009 Fluids Engineering Summer Meeting, Vail, CO, August 2 – 6, 2009, Paper No. FEDSM2009-78154 (2009).
Martinuzzi, R. and C. Tropea (1993a) “Flow around a Surface-Mounted Cube,” in R.J. Adrian, D.F.G. Durao, F. Durst, M.V. Heitor, M. Maeda and J.H. Whitelaw (eds) “Laser Techniques and Applications in Fluid Mechanics,” Springer-Verlag, New York, pp 399-414.
Martinuzzi, R. and C. Tropea (1993b) “Flow Around Surface-Mounted Prismatic Obstacles Placed in a Fully Developed Channel Flow,” Journal of Fluids Engineering, Vol. 115, pp. 85-92.
McKeown, P. T. and P. Sapienza “Non-Uniform Resistance Flow Conditioner Design Using CFD,” 2004 Fluent Users Group Meeting, Hanover, NH (2004).
7
Figure 1 Visual Description of the Predictive CFD Process
Predictive CFD ProcessComplete System
Subsystem Cases
Benchmark Cases
Unit Problems
Reactor Hydraulics
Core Outlet PlenumInlet Flow Paths
Jet ArraysPipe RunsRod & Tube
BundlesNozzle &
Downcomer
LeakageFlows
Elbows, Turns
Bluff Body
Surface-Mounted
Object
Diffuser
Duct Flow
FlowRotation
VariousJets
Reactor HydraulicsReactor Hydraulics
Core Outlet PlenumInlet Flow Paths Core Outlet PlenumInlet Flow Paths
Jet ArraysPipe RunsRod & Tube
BundlesNozzle &
DowncomerJet ArraysPipe Runs
Rod & TubeBundles
Nozzle & Downcomer
LeakageFlows
Elbows, Turns
Bluff Body
Surface-Mounted
Object
Diffuser
Duct Flow
FlowRotation
VariousJets
LeakageFlows
Elbows, Turns
Bluff Body
Surface-Mounted
Object
Diffuser
Duct Flow
FlowRotation
VariousJets
Unit Physics Validation Tests
Coupled Physics with Separable Effects
Integrated Tests
Target Flow Problem
Unit Physics Validation Tests
Coupled Physics with Separable Effects
Integrated Tests
Target Flow Problem
Predictive CFD is Builtfrom Unit Physics Foundation
Use of CFD is Predicated onQuality Assurance Statement• Model Selection Basis• Uncertainty Quantification

8
U VU V
Uniform Inlet
Measured Inlet
Uniform Inlet
Measured Inlet
Figure 2 Surface-Mounted Cube Experimental Description
Figure 3 Sample of Measured Axial and Vertical Velocities at the Inlet Plane to the Surface-Mounted Cube Experiment
Figure 4 Comparison of Computational Results Using a Measured Inlet Boundary Condition and a Uniform Inlet Boundary Condition Matching Water Tunnel Reynolds Numbers
Side View
Top View
x
y
x
z
Flow Conditioners
Side View
Top View
x
y
x
y
x
z
Flow Conditioners

9
• Distance between plates– Design – 3” (7.62 cm)
– Average – 2.946” (7.48 cm)
2.9632.946 2.982
2.930 2.967
2.9482.9172.911
Nozzle location
Window perimeter
2.9632.946 2.982
2.930 2.967
2.9482.9172.911
Nozzle location
Window perimeter
bottom
right
top
left
Window perimeter
True Nozzle
locationDy
Dx
Target Nozzle location
15”
15”
bottom
right
top
left
Window perimeter
True Nozzle
locationDy
Dx
Target Nozzle location
15”
15”
• Inlet Alignment– Dx = 0.044+/-0.002”
(1.12 mm)– Dy = 0.071+/-0.002”
(1.80 mm)
• Alignment Angle– A = 0.2+/-0.1degrees– Not able to measure transverse angle
• Inner Diameter Measurements– Pipe
Di = 3.108+/-0.002”– Nozzle
Dn = 3.069+/-0.002”– “Speed Bump”
Di = Pipe ID Dn=
Nozzle ID
Nozzle CL
Normal to nozzle plate
A = angle of nozzle CL
to plate normal
Side View: Perpendicularity of
nozzle, pipe and nozzle diameters
(N.B.: Not to scale -- misalignments exaggerated for clarity)
Di = Pipe ID Dn=
Nozzle ID
Nozzle CL
Normal to nozzle plate
A = angle of nozzle CL
to plate normal
Side View: Perpendicularity of
nozzle, pipe and nozzle diameters
(N.B.: Not to scale -- misalignments exaggerated for clarity)
5b 5c
5d
5a

10
Radial 0.5 mm “speed bump”
Angled, oriented nozzle (also impingement plate, not shown)
11.6 cm
Radial 0.5 mm “speed bump”Radial 0.5 mm “speed bump”
Angled, oriented nozzle (also impingement plate, not shown)Angled, oriented nozzle (also
impingement plate, not shown)
11.6 cm11.6 cm
Figure 5 Geometric Model of Impinging Diffuser Flow: (a) CAD Solid Model; (b) As-Built Measured Distances between Nozzle and Impingement Plates; (c) As-Built Alignment between Nozzle and Impingement Plate; (d) As-Built Inlet Pipe to Nozzle Measurements and Alignment; (e) CAD Model Details of Inlet Pipe and Nozzle Geometry
Figure 6 Mean Velocity Development of Radial Shear Layer in Impinging Diffuser Flow Experiment Comparing Experimental Measurements
5e

11
Figure 7 Measured Reynolds Stress in Developing Radial Shear Layer in Impinging Diffuser Flow Experiment
Figure 8 Measured Turbulent Kinetic Energy in Developing Radial Shear Layer in Impinging Diffuser Flow Experiment

12
• Problem Definition:
Parallel flow into diffuser, through a flow straightener and past a bluff body
Physics of Flow Problem• Pipe Flow• Diffuser• Jets and Jet Arrays• Bluff Body
Knowledge Management Site• Validation Assessments• Best Practice Guidelines
– Model Selection– Meshing Approach
• Uncertainty Estimation
Result with Quantified Uncertainty
Figure 9 End State Vision for Use of Predictive CFD in the Design Process