experimental design tutorial presented by michael w. totaro wireless research group center for...
TRANSCRIPT

Experimental Design Tutorial
Presented By
Michael W. TotaroWireless Research GroupCenter for Advanced Computer StudiesUniversity of Louisiana at Lafayette

Topics
Introduction 2k Factorial Designs Factors/Responses Effects Factor Interaction Quantifying the Effects Proper Perspective

Topics
Introduction 2k Factorial Designs Factors/Responses Effects Factor Interaction Quantifying the Effects Proper Perspective

Introduction Broad goal of simulation projects is to
learn how the inputs affect the outputs
Kinds of factors (input parameters) Quantitative vs. Qualitative Controllable vs. Uncontrollable
In modeling, everything is controllable Simulation output performance
measures are the responses

Analogy to Traditional Physical Experiments
Laboratory
Agricultural
Industrial
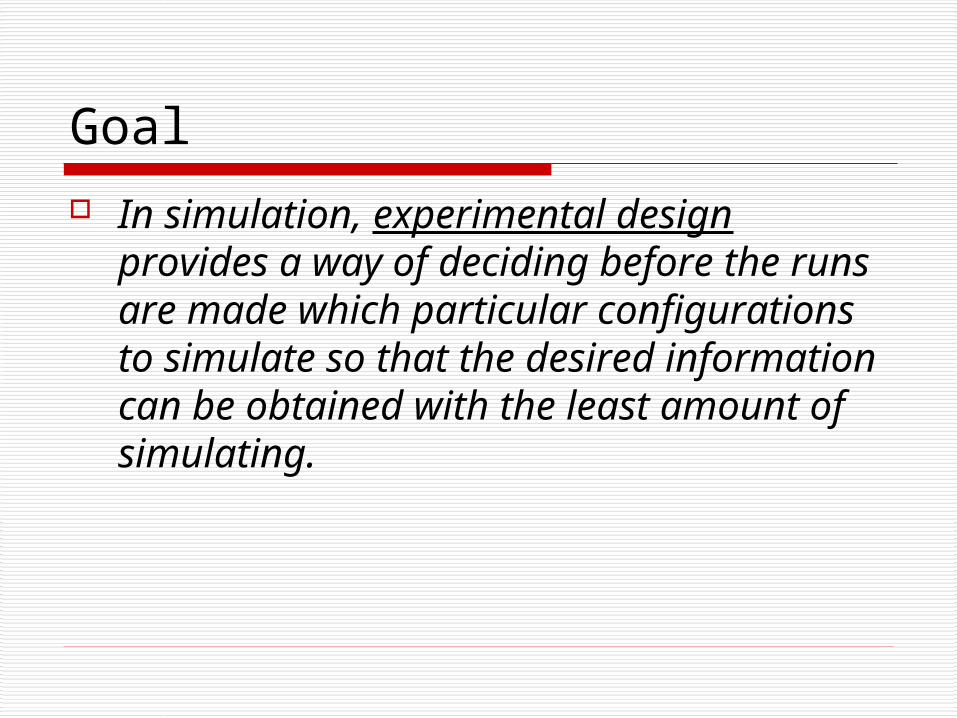
Goal
In simulation, experimental design provides a way of deciding before the runs are made which particular configurations to simulate so that the desired information can be obtained with the least amount of simulating.

Possible Factors/Responses
Usually, there are many possible
factors and responses

Setting Factor Levels
There is no real prescription for setting factor levels (i.e., values they can take on) Qualitative—may be clear from context Quantitative—may set at “reasonable”
levels; however, that might push the boundaries

Opportunities
Special opportunities in simulation-based experiment Everything is controllable Control source of randomness, and
exploit for variance reduction No need to randomize assignment of
treatments to experimental results
Topics
Introduction 2k Factorial Designs Factors/Responses Effects Factor Interaction Quantifying the Effects Proper Perspective

Feasible Design
Example of a design that is feasible in many simulations: 2k factorial design
Have k factors (inputs), each at just two levels
Number of possible combinations of factors—usually called design points—is 2k

Topics
Introduction 2k Factorial Designs Factors/Responses Effects Factor Interaction Quantifying the Effects Proper Perspective
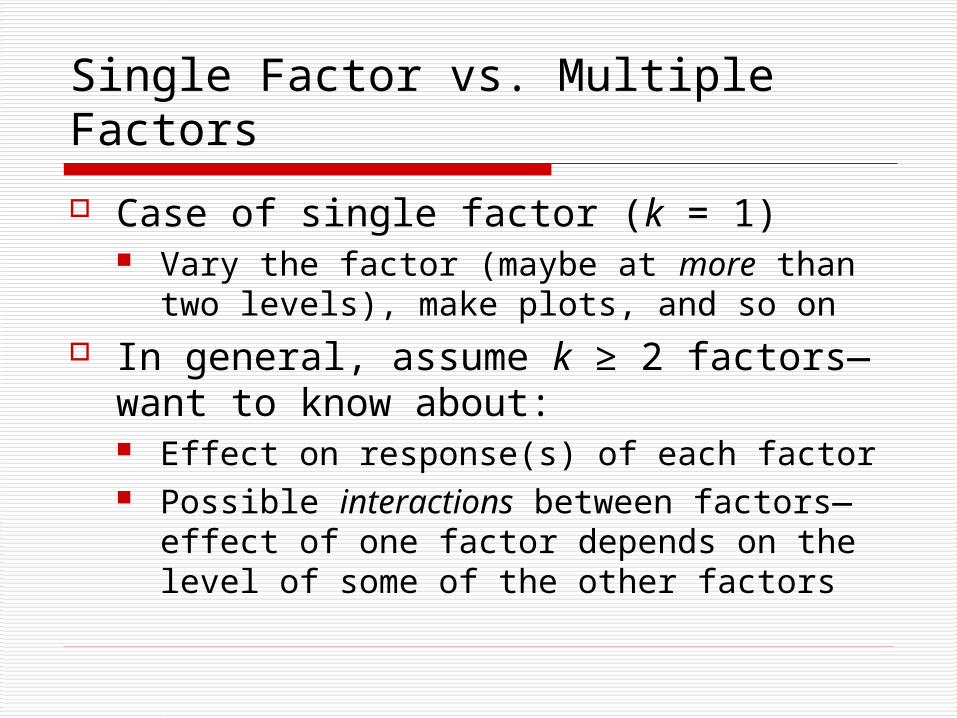
Single Factor vs. Multiple Factors
Case of single factor (k = 1) Vary the factor (maybe at more than two
levels), make plots, and so on In general, assume k ≥ 2 factors—
want to know about: Effect on response(s) of each factor Possible interactions between factors—
effect of one factor depends on the level of some of the other factors
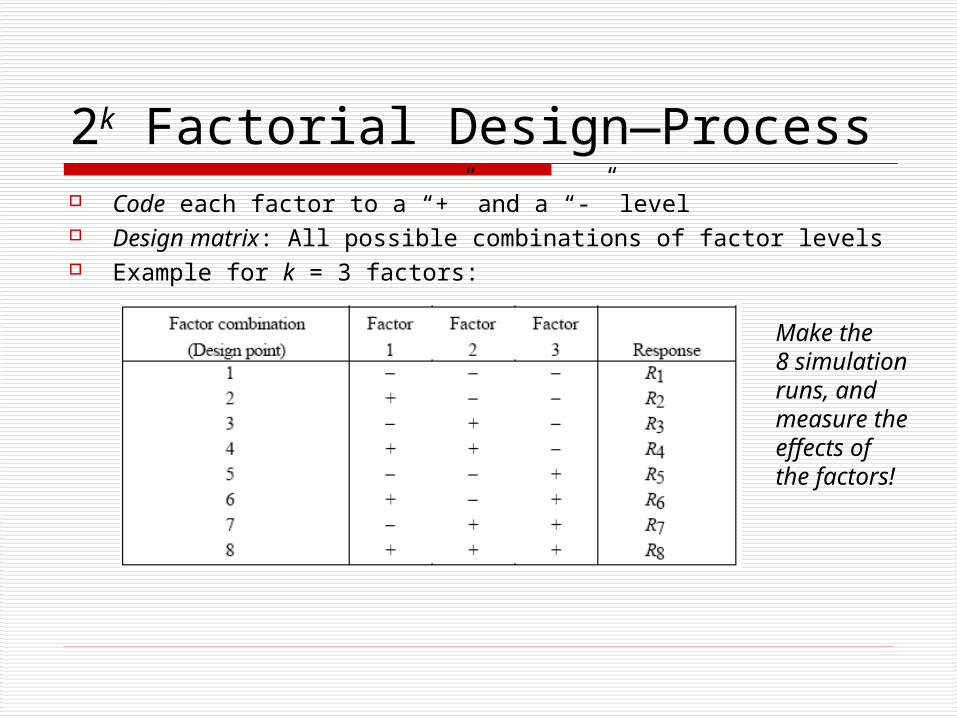
2k Factorial Design—Process Code each factor to a “+” and a “-” level Design matrix: All possible combinations of factor levels Example for k = 3 factors:
Make the8 simulationruns, andmeasure theeffects ofthe factors!
Topics
Introduction 2k Factorial Designs Factors/Responses Effects Factor Interaction Quantifying the Effects Proper Perspective

Main Effect of a Factor
Main effect of a factor is the average difference in the response when this factor is at its “+” level as opposed to its “-” level:
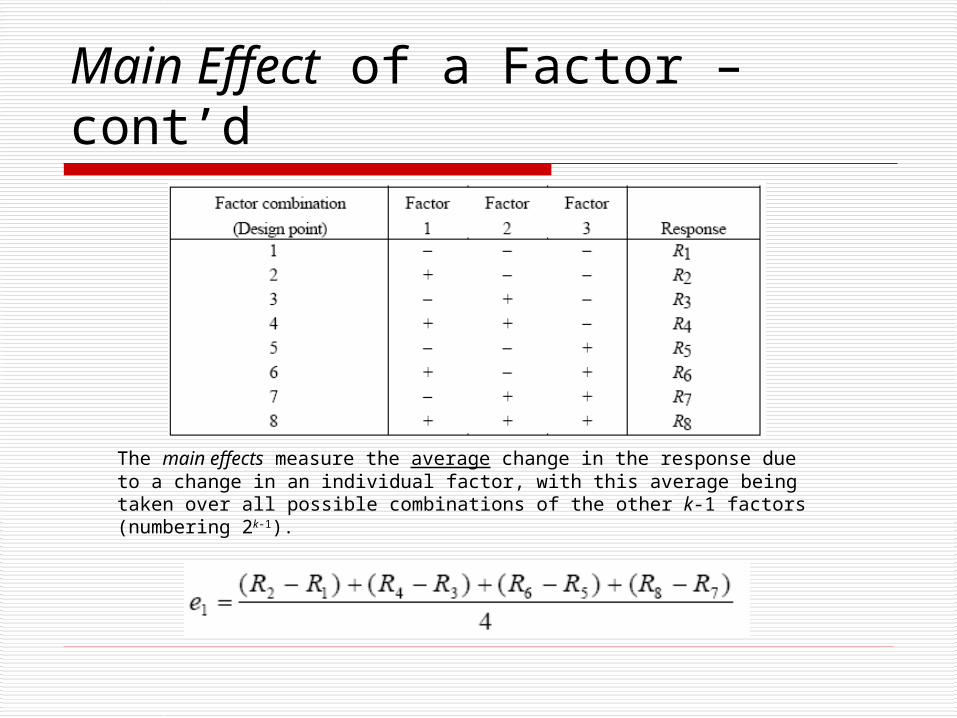
Main Effect of a Factor – cont’d
The main effects measure the average change in the response due to a change in an individual factor, with this average being taken over all possible combinations of the other k-1 factors (numbering 2k-1).

Main Effect of a Factor – cont’d
We can rewrite the above as “Factor 1” column ● “Response” column / 2k-1
-R1 + R2 – R3 + R4 – R5 + R6 – R7 + R8
e1 =
4
Topics
Introduction 2k Factorial Designs Factors/Responses Effects Factor Interaction Quantifying the Effects Proper Perspective

Factor Interaction Two factors A and B are said to interact if
the effect of one depends upon the level of the other
Conversely, these two factors, A and B, are said to be noninteracting if the performance of one is not affected by the level of the other
We shall look at examples of interacting factors and noninteracting factors

Examples of Noninteracting and Interacting Factors
A1 A2
B1 3 5
B2 6 8
Noninteracting Factors
Interacting Factors
A1 A2
B1 3 5
B2 6 9
As the factor A is changedfrom level A1 to level A2,the performance increasesby 2 regardless of the levelof factor B
As the factor A is changedfrom level A1 to level A2,the performance increaseseither by 2 or 3 dependingupon whether B is at levelB1 or level B2, respectively

Examples of Noninteracting and Interacting Factors—cont’d
Performance
Graphical representation of interacting and noninteracting factors.
6
2
8
A1 A2
B2
B1
Performance
6
2
8
B1
A2
A1
B2
(a) No Interaction
Performance
6
2
8
A1 A2
B2
B1
Performance
6
2
8
B1
A2
A1
B2(b) Interaction

Interaction Effects
1 x 3 interaction effect: “Factor 1” ● “Factor 3” ● “Response” / 2k-1
R1 - R2 + R3 - R4 – R5 + R6 – R7 + R8
e13 =
4
Addresses the question: “Does the effect of a factor depend on level of others?”
Sign of effect indicates direction of effect on response of moving that factor from its “-” to its “+” level
Topics
Introduction 2k Factorial Designs Factors/Responses Effects Factor Interaction Quantifying the Effects Proper Perspective

Quantifying the Effects Statistical significance of effects
estimates (i.e., are they real?) A luxury in simulation-based
experiments: Replicate the whole design n times Get n observations on each effect Compute sample mean, sample variance,
confidence interval, etc., on expected effects—effect is “real” if confidence interval misses 0

Quantifying the Effects--Example
Example of 26 Factorial Design
In addition to above, machine suffers breakdowns, and thus must undergo repair Response: Average time in system of a part (called the makespan)

Quantifying the Effects—Example (cont’d)
Factors and coding:
Full 26 factorial design involves 64 factor combinations Entire design is replicated n = 5 times; thus, this is a 26 5 factorial experimental design
Quantifying the Effects—Example (cont’d)
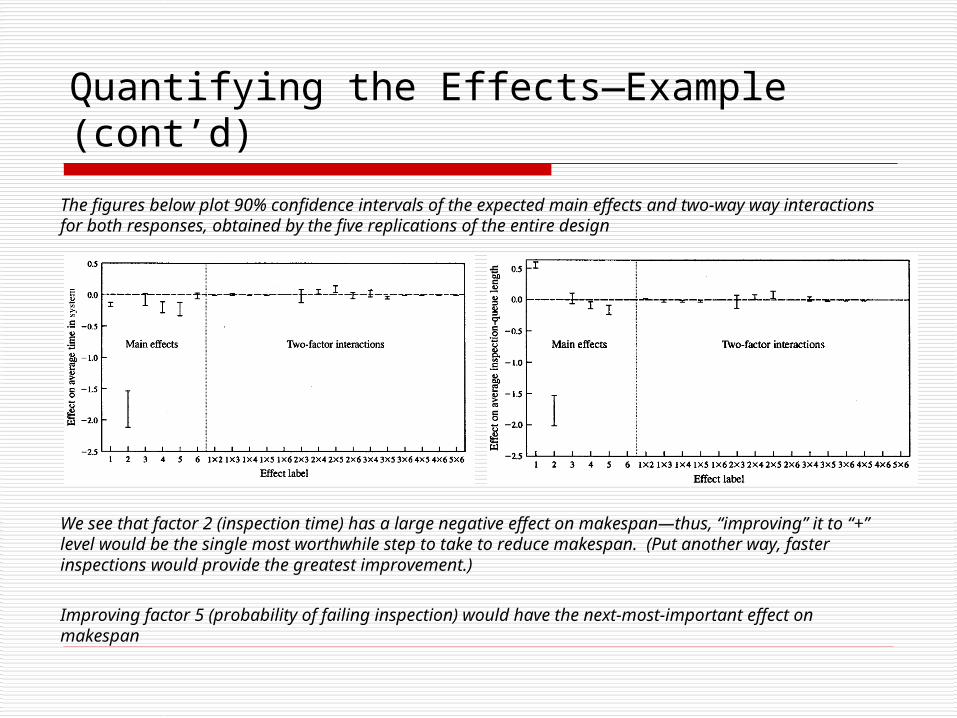
The figures below plot 90% confidence intervals of the expected main effects and two-way way interactions for both responses, obtained by the five replications of the entire design
We see that factor 2 (inspection time) has a large negative effect on makespan—thus, “improving” it to “+” level would be the single most worthwhile step to take to reduce makespan. (Put another way, faster inspections would provide the greatest improvement.)
Improving factor 5 (probability of failing inspection) would have the next-most-important effect on makespan

Topics
Introduction 2k Factorial Designs Factors/Responses Effects Factor Interaction Quantifying the Effects Proper Perspective

Keep a Proper Perspective Results are relative to the particular values chosen for
the factors, and cannot necessarily be extrapolated to other regions in the factor space
It is probably not good to choose the “-” and “+” levels of a factor to be extremely far apart from each other
Could result in experiments for factor levels that are unrealistic in the problem context
Might not get information on “interior” of design space between the factor levels; thus, we may not see interactions that might be present there

Sources
Simulation Modeling and Analysis, Third Ed., by Averill M. Law and W. David Kelton, The McGraw-Hill Companies, Inc., 2000.
The Art of Computer Systems Performance Analysis: Techniques for Experimental Design, Measurement, Simulation, and Modeling, by Raj Jain, John Wiley & Sons, Inc., New York, 1991.