experimental design 1 - files.eric.ed.gov design 3 the no child left behind act (nclb) demands...
TRANSCRIPT

Experimental Design 1
Running Head: EXPERIMENTAL DESIGN
Experimental Design and Some Threats to
Experimental Validity: A Primer
Susan Skidmore
Texas A&M University
Paper presented at the annual meeting of the Southwest Educational
Research Association, New Orleans, Louisiana, February 6, 2008.

Experimental Design 2
Abstract
Experimental designs are distinguished as the best method to respond to
questions involving causality. The purpose of the present paper is to explicate
the logic of experimental design and why it is so vital to questions that demand
causal conclusions. In addition, types of internal and external validity threats are
discussed. To emphasize the current interest in experimental designs, Evidence-
Based Practices (EBP) in medicine, psychology and education are highlighted.
Finally, cautionary statements regarding experimental designs are elucidated
with examples from the literature.

Experimental Design 3
The No Child Left Behind Act (NCLB) demands “scientifically based
research” as the basis for awarding many grants in education (2001).
Specifically, the 107th Congress (2001) delineated scientifically-based research
as that which “is evaluated using experimental or quasi-experimental designs”.
Recognizing the increased interest and demand for scientifically-based research
in education policy and practice, the National Research Council released the
publication, Scientific Research in Education (Shavelson & Towne, 2002) a year
after the implementation of NCLB. Almost $5 billion have been channeled to
programs that provide scientifically-based evidence of effective instruction, such
as the Reading First Program (U. S. Department of Education, 2007). With
multiple methods available to education researchers, why does the U. S.
government show partiality to one particular method? The purpose of the
present paper is to explicate the logic of experimental design and why it is so
vital to questions that demand causal conclusions. In addition, types of internal
and external validity threats are discussed. To emphasize the current interest in
experimental designs, Evidence-Based Practices (EBP) in medicine, psychology
and education are highlighted. Finally, cautionary statements regarding
experimental designs are elucidated with examples from the literature.
Experimental Design
An experiment is “that portion of research in which variables are
manipulated and their effects upon other variables observed” (Campbell &
Stanley, 1963, p. 171). Or stated another way, experiments are concerned with
an independent variable (IV) that causes or predicts the outcome of the

Experimental Design 4
dependent variable (DV). Ideally, all other variables are eliminated, controlled or
distributed in such a way that a conclusion that the IV caused the DV is validly
justified.
Figure 1. Diagram of an experiment.
In Figure 1 above you can see that there are two groups. One group
receives some sort of manipulation that is thought (theoretically or from previous
research) to have an impact on the DV. This is known as the experimental group
because participants in this group receive some type of treatment that is
presumed to impact the DV. The other group, which does not receive a treatment
or instead receives some type of alternative treatment, provides the result of
what would have happened without experimental intervention (manipulation of
the IV).
So how do you determine whether participants will be in the control group
or the experimental group? The answer to this question is one of the
characteristics that underlie the strength of true experimental designs. True
experiments must have three essential characteristics: random assignment to
Outcome measured as DV
No manipulation or alternate manipulation of IV (treatment
or intervention)
Control Group
Manipulation of IV (treatment or intervention)
Experimental Group
Experimental Design 5
groups, an intervention given to at least one group and an alternate or no
intervention for at least one other group, and a comparison of group
performances on some post-intervention measurement (Gall, Gall, & Borg,
2005).
Participants in a true experimental design are randomly allocated to either
the control group or the experimental group. A caution is necessary here.
Random assignment is not equivalent to random sampling. Random sampling
determines who will be in the study, while random assignment determines in
which groups participants will be. Random assignment makes “samples
randomly similar to each other, whereas random sampling makes a sample
similar to a population” (Shadish, Cook, & Campbell, 2002, p. 248, emphasis in
original). Nonetheless, random assignment is extremely important. By randomly
assigning participants (or groups of participants) to either the experimental or
control group, each participant (or groups of participants) is as likely to be
assigned to one group as to the other (Gall et al., 2005). In other words, by giving
each participant an equal probability of being a member of each group, random
assignment equates the groups on all other factors, except for the intervention
that is being implemented, thereby ensuring that the experiment will produce
“unbiased estimates of the average treatment effect” (Rosenbaum, 1995, p. 37).
To be clear, the term “unbiased estimates” describes the fact that any observed
effect differences between the study results and the “true” population are due to
chance (Shadish et al., 2002).
Experimental Design 6
This equality of groups assertion is based on the construction of infinite
number of random assignments of participants (or groups of participants) to
treatment groups in the study and not to the single random assignment in the
particular study (Shadish et al., 2002). Thankfully, researchers do not have to
conduct an infinite number of random assignments in an infinite number of
studies for this assumption to hold. The equality of groups‟ assumption is
supported in studies with large sample sizes, but not in studies with very small
sample sizes. This is true due to the law of large numbers. As Boger (2005)
explained, “If larger and larger samples are successively drawn from a population
and a running average calculated after each sample has been drawn, the
sequence of averages will converge to the mean, µ, of the population” (p. 175). If
the reader is interested in exploring this concept further, the reader is directed to
George Boger‟s article that details how to create a spreadsheet simulation of the
law of large numbers. In addition, a medical example of this is found in
Observational Studies (Rosenbaum, 1995, pp. 13-15).
To consider the case of small sample size, let us suppose that I have a
sample of 10 graduate students that I am going to randomly assign to one of two
treatment groups. The experimental group will have regularly scheduled graduate
advisor meetings to monitor students‟ educational progress. The control group
will not have regularly scheduled graduate advisor meetings. Just to see what
happens, I choose to do several iterations of this random assignment process. Of
course, I discover that the identity of the members in the groups across iterations
is wildly different.

Experimental Design 7
Recognizing that most people are outliers on at least some variables
(Thompson, 2006), there may be some observed differences that are due simply
to the variable characteristics of the members of the treatment groups. For
example, let‟s say that six of the ten graduate students are chronic
procrastinators, and might benefit greatly from regular scheduled visits with a
graduate advisor, while four of the ten graduate students are intrinsically
motivated and tend to experience increased anxiety with frequent graduate
advisor inquiries. If the random assignment process distributes these six
procrastinator graduate students equally among the two groups, a bias due to
this characteristic will not evidence itself in the results. If instead, due to chance
all four intrinsically motivated students end up in the experimental group, the
results of the study may not be the same had the groups been more evenly
distributed. Ridiculously small sample sizes, therefore would result in more
pronounced differences between the groups that are not due to treatment effects,
but instead are due to the variable characteristics of the members in the groups.
If instead I have a sample of 10,000 graduate students that that I am going
to randomly assign to one of two treatment groups, the law of large numbers
works for me. As explained by Thompson et al. (2005), “The beauty of true
experiments is that the law of large numbers creates preintervention group
equivalencies on all variables, even variables that we do not realize are essential
to control” (p. 183). While there is still not identical membership across treatment
groups, and I still expect that the observed differences between the control group
and the experimental group are going to be due to any possible treatment effects

Experimental Design 8
and to the error associated with the random assignment process, the expectation
of equality of groups is nevertheless reasonably approximated. In other words, I
expect the ratio of procrastinators to intrinsically motivated students to be
approximately the same across the two treatment groups. In fact, I expect
proportions of variables I am not even aware of to be the same, on average,
across treatment groups!
The larger sample size has greatly decreased the error due to chance
associated with the random assignment process. As you can see in Figure 2,
even if both of the sample studies produce identical treatment effects, the results
are not equally valid. The majority of the effect observed in the small sample
size study is actually due to error associated with the random assignment
process and not a result of the treatment. This effect due to error is greatly
reduced in the large sample size study.
Figure 2. Observed treatment effects in two studies with different sample sizes.
The white area represents the amount of the observed effect due to the error
associated with the random assignment process. The grey area represents the
“true” treatment effect.
Three Experimental Designs
When well-conducted, a randomized experiment is considered the “gold
standard” in causal research (Campbell, 1957; Campbell & Stanley, 1963;
“True” treatment
effects
n=10
error
“True” treatment
effects
n=10,000
e
r
r
o
r

Experimental Design 9
Sackett, Strauss, Richardson, Rosenberg, & Haynes, 2000; Thompson, 2006). In
fact, “No other type of quantitative research (descriptive, correlational, or causal-
comparative) is as powerful in demonstrating the existence of cause-and-effect
relationships among variables as experimental research” (Gall et al., 2005, p.
249). There are three designs that meet the characteristics of true experimental
designs, first described by Campbell (1957) and revisited in several research
design texts. While other designs have the potential to produce causal effects
(see Odom et al., 2005; Rosenbaum, 1995; Thompson et al., 2005) only the
three classic true experimental designs are discussed in the present paper. For a
more extensive description of other experimental designs, the reader is directed
to research design works such as Campbell (1957); Campbell and Stanley
(1963); Creswell (2003); Gall et al. (2005); Shadish et al. (2002); and Thompson
(2006).
The first true experimental design is known as the Pretest-Posttest
Control-Group Design. This research design meets the characteristics of a true
experiment because participants are randomly assigned (denoted by an R) to
either the experimental or control group. There is an intervention or treatment
(denoted by an X) given to one group, the experimental group, and no
intervention (or alternate intervention) given to the other group, the control group.
Finally, there is some form of post-intervention measurement (denoted by an O).
This is also known as a posttest, because this measurement occurs after the
intervention. In addition, in this particular design, there is also a pretest, denoted
by an O prior to the intervention. The pretest allows the researcher to test for
Experimental Design 10
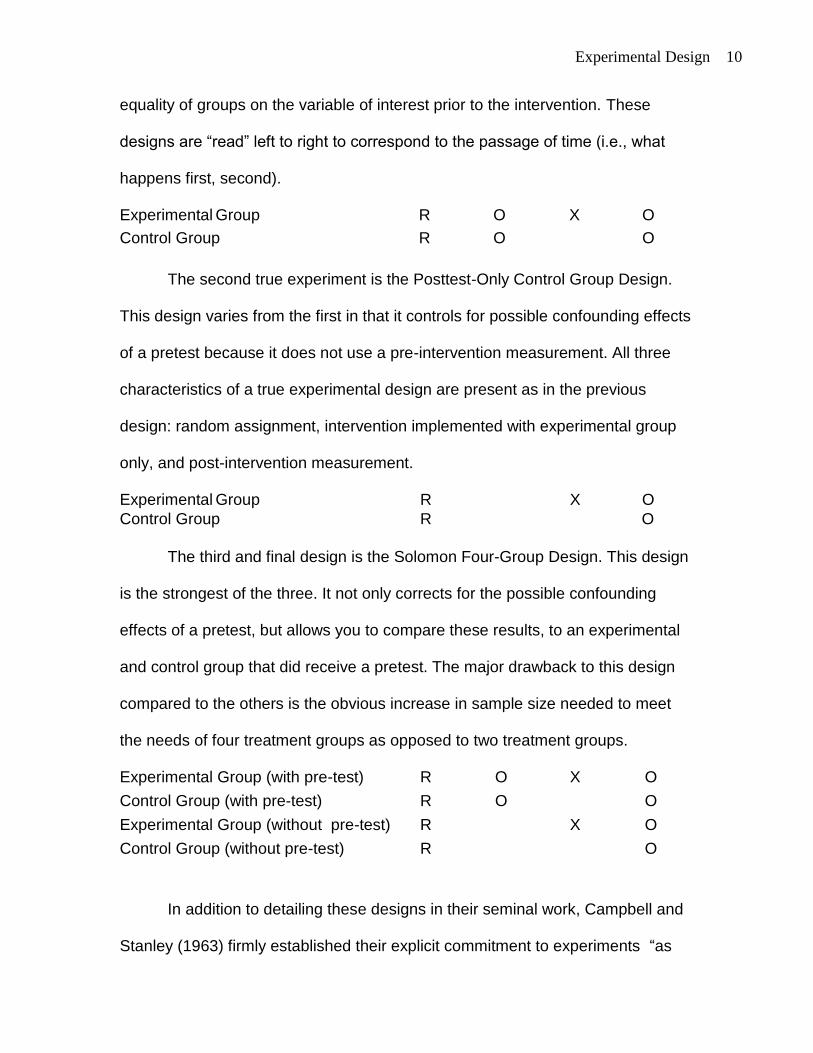
equality of groups on the variable of interest prior to the intervention. These
designs are “read” left to right to correspond to the passage of time (i.e., what
happens first, second).
Experimental Group R O X O
Control Group R O O
The second true experiment is the Posttest-Only Control Group Design.
This design varies from the first in that it controls for possible confounding effects
of a pretest because it does not use a pre-intervention measurement. All three
characteristics of a true experimental design are present as in the previous
design: random assignment, intervention implemented with experimental group
only, and post-intervention measurement.
Experimental Group R X O
Control Group R O
The third and final design is the Solomon Four-Group Design. This design
is the strongest of the three. It not only corrects for the possible confounding
effects of a pretest, but allows you to compare these results, to an experimental
and control group that did receive a pretest. The major drawback to this design
compared to the others is the obvious increase in sample size needed to meet
the needs of four treatment groups as opposed to two treatment groups.
Experimental Group (with pre-test) R O X O
Control Group (with pre-test) R O O
Experimental Group (without pre-test) R X O
Control Group (without pre-test) R O
In addition to detailing these designs in their seminal work, Campbell and
Stanley (1963) firmly established their explicit commitment to experiments “as

Experimental Design 11
the only means for settling disputes regarding educational practice, as the only
way of verifying educational improvements, and as the only way of establishing
a cumulative tradition in which improvements can be introduced without the
danger of a faddish discard of old wisdom in favor of inferior novelties”(Campbell
& Stanley, 1963, p. 172).
Validity Threats
Even when these designs are used, there are differences in how rigidly
they are followed as well as to what extent the researcher addresses the multiple
threats to validity (see Figure 3 below). Threats to validity are important not only
to research designer but also to consumers of research. An informed consumer
of research wants to rule out all competing hypothesis and be firmly convinced
that the evidence supports the claim that the IV caused the DV. To merit this
conclusion, an evaluation of the study is necessary to determine whether threats
to experimental validity were recognized and mitigated.
Figure 3. Example of a research experiment and the questions you should ask
yourself about internal and external validity. Adapted from (Sani & Todman,
2006).
hypothesized effects
internal validity
Are we really observing these effects or the
effects of other variables on the DV
(procrastination vs. intrinsically motivated)?
external validity
Are these effects to be found in other
contexts and people, or are they specific to
our experimental setting and participants?
Independent Variable Graduate Advisor Meetings
Dependent Variable Procrastination/
Motivation scale

Experimental Design 12
Internal Validity
Creswell defines internal validity threats as those “experimental
procedures, treatments, or experiences of the participants that threaten the
researchers‟ ability to draw correct inferences from the data in an experiment”
(2003, p. 171). In their classic text, Campbell and Stanley (1963) identified eight
threats to internal validity. In a more recent text, Shadish, Cook and Campbell
(2002) addressed nine threats to validity which are described below. For an
extensive list of threats to internal and external validity, the reader is directed to
Onwuegbuzie‟s work that cogently expresses the need to evaluate “all
quantitative research studies” (2000, p. 7), not just experimental design studies,
for threats to internal and external validity.
1. Ambiguous temporal precedence: uncertainty about which occurred first (IV
or DV) which would lead to questions about which variable is the cause and
which is the effect.
2. Selection bias: a systematic bias resulting in non-random selection of
participants to groups. By definition random assignment prevents selection bias,
if and only if the law of large numbers can be invoked.
3. History: an event that may occur between measurements that is not part of the
intervention that could impact the posttest measurement. For example, let us
return to the ten fictional graduate students described previously in the study.
Let‟s say they were all living in the same dorm and the fire alarm kept going off
the night before they were to take the motivation/ procrastination measurement
instrument. Due to lack of sleep, participants may perform differently on the

Experimental Design 13
motivation/ procrastination scale than they would have had they gotten enough
sleep.
4. Maturation: an observed change that is naturally occurring (such as aging,
fatigue, hair length, number of graduate hours completed) that may be confused
with the intervention effects but is really a function of the passage of time.
5. Statistical regression: the phenomenon that occurs when participant selection
is based on extreme scores whereby the scores become less extreme, which
may appear to be the intervention effect. If in our study of graduate students we
purposively select students based on pretest scores of extreme procrastination,
the extreme procrastinator graduate students will on the posttest not be as
extreme in their procrastination tendencies.
Regression toward the mean was first documented by Sir Francis Galton
in the late 1800s. Galton (1886) measured the heights of fathers and sons at a
World Exposition. Galton found that very tall fathers tended to have sons who
were not quite as tall, and that very short fathers tended to have sons who were
not quite as short. Clearly, this phenomenon is not a function of the exercise of
will (i.e., fathers did not say to their wives, “Let‟s make a shorter son” or “Let‟s
make a taller son”)!
6. Experimental mortality or attrition: a concern about a differential loss of
participants, or of different types of participants from the experimental or control
group that may produce an effect that appears to be due to the intervention. For
example, if half of the students in the experimental group drop out of the study,
but none of the control group members drop, we would likely question the results.

Experimental Design 14
Were those students that left somehow different from the ones that remained? If
so, would that difference have produced differential results than the ones we
observed with the remaining participants?
7. Testing: the concern that a testing event will impact scores of a subsequent
testing event. For example, if we give the graduate students the procrastination/
motivation scale prior to any graduate advisor meetings (the intervention), and
then after the intervention we give them the procrastination/ motivation scale
again, we may observe difference in the pre- and posttest that are due partly to
familiarity with the test or the influence of the testing itself.
8. Instrumentation: the change in either the measurement instrument itself or the
manner in which the instrument is implemented or scored that may cause
changes that appear to be due to the intervention, or the failure to detect
changes that actually did occur. For example, if between the first and second
time that the procrastination/motivation test is given, the developers of the exam
decide to remove ten of the questions, we do not know if the exclusion of those
questions is responsible for differential scores or if the differences are due to
treatment effects.
9. Additive and interactive effect of threats to internal validity: the concern that
the impact of the threats may be additive or that presence of one threat may
impact another. A selection-history additive effect occurs when nonequivalent
groups are selected. For example, groups may be selected from two different
locations, such as, rural and urban areas. The participants in the groups are
nonequivalent by selection and they also have unique local histories. The
Experimental Design 15
resulting net bias is dependent on both the direction and magnitude of each
individual bias and how the biases combine. Selection-maturation, and selection-
instrumentation are other versions of this type of effect.
External Validity
External validity threats are threats of “incorrect inferences from the
sample data to other persons, other settings, and past or future situations”
(Creswell, 2003, p. 171). Researchers must always remember the context from
which their sample comes from, and take caution not to overgeneralize beyond
that.
Campbell and Stanley (1963) included four threats to external validity.
Shadish (2002) listed five external validity threats, as detailed below.
1. Interaction of the causal relationship with participants: an effect with certain
kinds of participants that may not be present (or present to the same extent) with
other kinds of participants. For example, reduction of salt intake in hypertensive
patients is more beneficial to certain populations than others (American Heart
Association Nutrition Committee, 2006).
2. Interaction of the causal relationship over treatment variations: the
permanence of the causal relationship is dependent on fidelity to the specific
treatment, thus possibly producing differential effects when treatments are
varied. If a particular instructional intervention includes 5 components, the causal
relationship may not hold if only 2 or 3 of the components are utilized.
3. Interaction of the causal relationships with outcomes: an effect that is present
with one type of outcome measurement that may not be present (or present to

Experimental Design 16
the same extent) if other outcome measurements were used. For example, if a
person scores highest on a test for physical strength they may not necessarily
score highest on a flexibility test.
4. Interactions of the causal relationship with settings: an effect that is present in
a particular setting may not be present (or present to the same extent) in a
different setting. For example, a particular after school character development
program involving community project work may not work equally well in rural
versus urban areas.
5. Context-dependent mediation: an explanatory mediator of a causal
relationship in one context may not have the same impact in another context. For
example, a study might find that a reduction in federal funding has no impact on
student achievement because schools were able to turn to education foundation
grants to provide them with additional resources. In another school district where
schools did not have access to education foundation resources, the same causal
mechanism may not be available.
In addition to internal and external validity threats, there are other threats
that we need to be aware of in the design and evaluation of studies. Interested
readers may refer to such texts as Experimental and Quasi-Experimental
Designs (Shadish et al., 2002) or Research Design: Qualitative, Quantitative, and
Mixed Methods Approaches (Creswell, 2003) for information about statistical
conclusion validity and construct validity concerns.

Experimental Design 17
EBP in Medicine, Psychology and Education
While the origins of EBP may date back to the origin of scientific
reasoning, the Evidence-Based Medicine Working Group (EBMWG) brought the
discussion of EBP to the forefront of medicine (1992). In 1996, Evidence-Based
Medicine (EBM) was defined as “the conscientious, explicit, and judicious use of
current best evidence in making decisions about the care of individual patients.
The practice of evidence based medicine means integrating individual clinical
expertise with the best available external clinical evidence from systematic
research” (Sackett, Rosenberg, Gray, Haynes, & Richardson, 1996, p. 71). While
EBP has many supporters in medicine, EBP has caused some concerns among
practitioners. Researchers have addressed concerns regarding the perception of
EBM as a top down approach that results in ivory tower researchers dictating
how practitioners should practice (Sackett et al., 1996) or similarly that evidence
from randomized controlled trials may be valued more highly than practitioner
expertise (Kübler, 2000).
Yet, it is difficult to deny that there is great support for EBP considering the
number of periodicals that have emerged since the years after EBMWG
convened. A keyword search for “evidence-based” returns 100 serials on
WorldCAT. A keyword search for “evidence-based” returns 96 serials in Ulrich’s
Periodical Directory. At least 32 active periodicals, either in print form, electronic
form, or both contain “evidence-based” within the title of the periodical. At least
26 of these periodicals are available electronically. See Table 1.
Experimental Design 18
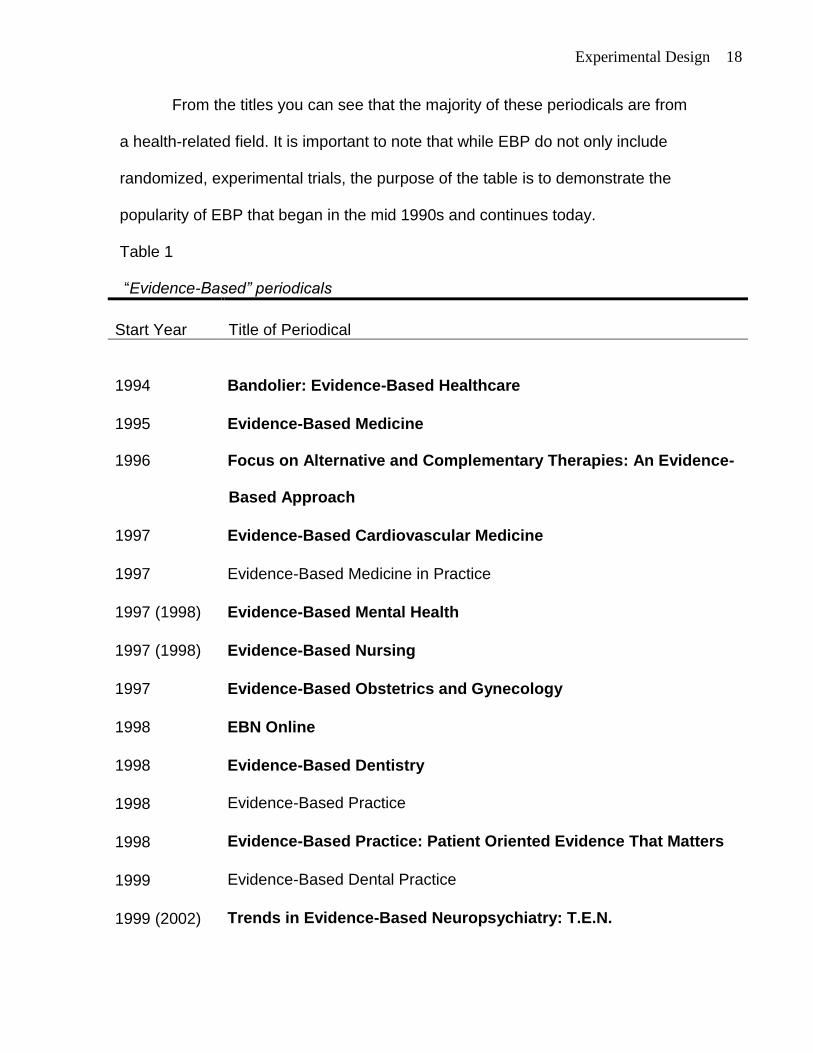
From the titles you can see that the majority of these periodicals are from
a health-related field. It is important to note that while EBP do not only include
randomized, experimental trials, the purpose of the table is to demonstrate the
popularity of EBP that began in the mid 1990s and continues today.
Table 1
“Evidence-Based” periodicals
Start Year Title of Periodical
1994 Bandolier: Evidence-Based Healthcare
1995 Evidence-Based Medicine
1996 Focus on Alternative and Complementary Therapies: An Evidence-
Based Approach
1997 Evidence-Based Cardiovascular Medicine
1997 Evidence-Based Medicine in Practice
1997 (1998) Evidence-Based Mental Health
1997 (1998) Evidence-Based Nursing
1997 Evidence-Based Obstetrics and Gynecology
1998 EBN Online
1998 Evidence-Based Dentistry
1998 Evidence-Based Practice
1998 Evidence-Based Practice: Patient Oriented Evidence That Matters
1999 Evidence-Based Dental Practice
1999 (2002) Trends in Evidence-Based Neuropsychiatry: T.E.N.

Experimental Design 19
Table 1 (continued).
Start Year Title of Periodical
2000
Evidence-Based Gastroenterology
2000 Evidence-Based Oncology
2000 Trauma Reports: Evidence-Based Medicine for the ED
2001 Journal of Evidence-Based Dental Practice
2003 Evidence-Based Integrative Medicine
2003 Evidence-Based Midwifery
2003 Evidence-Based Preventive Medicine
2003 Evidence-Based Surgery
2003 (2005) International Journal of Evidence-Based Healthcare
2004 Evidence-Based Complementary and Alternative Medicine: eCAM
2004 Journal of Evidence-Based Social Work
2004 Worldviews on Evidence-Based Nursing
2005 Advances in Psychotherapy: Evidence-Based Practice
2005 Evidence-Based Ophthalmology
2005 Journal of Evidence-Based Practices for Schools
2006 Evidence-Based Child Health
2006 Evidence-Based Library and Information Practice
2007 Evidence-Based Communication Assessment and Intervention
Periodicals available electronically are shown in bold.
Parenthetical dates indicate different start year date in WorldCAT.

Experimental Design 20
The popularity of EBP is evident in psychology as well. The American
Psychological Association‟s Presidential Task Force on Evidence-Based Practice
specifically defined Evidence-Based Practice in Psychology (EBPP) as “the
integration of the best available research with clinical expertise in the context of
patient characteristics, culture, and preferences” (2006, p. 273). In addition to
advocating evidence-based practices, this task force also established the two
necessary components for evaluation of psychological interventions: treatment
efficacy and clinical utility. Treatment efficacy specifically addresses questions
such as how well a particular treatment works. This type of question lends itself
to experimental investigation to draw valid causal conclusions about the effect of
a particular intervention (or lack thereof) on a particular disorder (American
Psychological Association, 2002). Chambless and Hollon (1998), in their review
of psychological treatment literature, provide a description of variables of interest
when evaluating treatment efficacy in research studies. The Task Force
acknowledged that while there are other methods that may lead to causal
conclusions “randomized controlled experiments represent a more stringent way
to evaluate treatment efficacy because they are the most effective way to rule out
threats to internal validity in a single experiment” (American Psychological
Association, 2002, p. 1054).
The appeals for evidence continue also in the field of education. Grover J.
(Russ) Whitehurst, who directs the Education Department's Institute of Education
Sciences, defined Evidence-Based Education (EBE) as “the integration of
professional wisdom with the best available empirical evidence in making

Experimental Design 21
decisions about how to deliver instruction” (in Towne, 2005, p. 41). Whitehurst
(2002b) explained that without empirical evidence education is at the mercy of
the latest educational craze. In addition, asserted that cumulative knowledge
cannot be generated without empirical evidence. To assist education
practitioners in the identification of EBP, a practical guide has been provided (see
Coalition for Evidence-Based Policy, 2003).
Table 2
Definitions of EBP in medicine, psychology and education
Field Definition
Evidence-based
medicine (EBM)
“the conscientious, explicit, and judicious use of current best
evidence in making decisions about the care of individual
patients. The practice of evidence based medicine means
integrating individual clinical expertise with the best available
external clinical evidence from systematic research” (Sackett et
al., p. 71).
Evidence-based
practices in
psychology (EBPP)
“the integration of the best available research with clinical
expertise in the context of patient characteristics, culture, and
preferences” (American Psychological Association, 2006, p. 273).
Evidence-based
education (EBE)
“the integration of professional wisdom with the best available
empirical evidence in making decisions about how to deliver
instruction” (Whitehurst, 2002b, Slide 3).
Medicine, psychology, and education all have seemed to have jumped on
the evidence wagon. Their definitions share the common themes of integration of

Experimental Design 22
expertise with the best available evidence (see Table 2 above). We cannot
ignore this need to balance practitioner expertise with empirical evidence
whether in the field of medicine, psychology or education. As Kübler (2000)
cautions:
Undoubtedly evidence based medicine is the gold standard for modern
medicine. The results, however, should be applied in patient care with
careful reflection. Otherwise evidence based medicine may acquire the
same status for the doctor as a lamp post for a drunk: it gives more
support than enlightenment. (p. 135)
Frequency of Experiments in Different Disciplines
One final caution is offered. It is imperative that consumers and producers
of research critically evaluate research. In addition to threats to validity, we must
keep in mind that experiments are conducted by people. People are fallible. We
are prone to make mistakes, both consciously and unconsciously. An example
of this is a graph that appears to be from the same data, yet describes different
results. What is critical about these graphs is that depending on which one you
look at, education ranks third, fourth, or first in cumulative total number of reports
of trials identified from the Campbell Collaboration Social, Psychological,
Educational and Criminological Trials Register (C2-SPECTR) (Petrosino, Boruch,
Rounding, McDonald, & Chalmers, 2000).
One graph depicts education behind criminology and psychology, but
ahead of social policy (Boruch, Moya, & Snyder, 2002, p. 63). The authors
describe the graph as follows:

Experimental Design 23
Figure 3-4 shows the increase in the number of articles on randomized
and possibly randomized experiments that have appeared in about 100
peer-reviewed journals and in other places since 1950. The figure is
based on the Campbell Collaboration Social, Psychological, Educational,
and Criminological Trials Registry (C2-SPECTR) that is being developed
in a continuing effort to identify all RFTs. (p. 62).
The authors correctly cite Petrosino et al. (2000) as the source of the graph.
In another graph, which cites Boruch et al. (2002), education is now in last
place behind criminology, psychology and social policy respectively (Whitehurst,
2002b). The following description was offered in Whitehurst‟s (2002b)
presentation:
This chart indicates the total number of articles about randomized field
trials in other areas of social science research (criminology, social policy
and psychology) has steadily grown over the last 40 years; however, the
number related to education research has trailed behind. (Table
Description, Slide 22)
In a very similar presentation by Whitehurst (2002a), a more extensive
description of the same graph is provided:
While the total number of articles about randomized field trials in other
areas of social science research has steadily grown, the number in
education research has trailed behind. The graph on this slide measures
the growth of randomized field trials from 1950 to the present in the areas
of criminology, social policy, psychology, and education. It shows that the

Experimental Design 24
most rapid growth has been in criminology, followed by comparable rates
of growth in social policy and psychology, with education having the least
amount of growth. Source for the graph: Robert Boruch, Dorothy de Moya,
and Brooke Snyder, 2001. (slide 21)
The correct year for the citation is actually 2002.
Finally, in still another version of the graph, education is leading the pack
followed by psychology, social and criminology (Petrosino, Boruch, Soydan,
Duggan, & Sanchez-Meca, 2001). The following description is offered:
To facilitate the work of reviewers, the Campbell Collaboration Social,
Psychological, Educational and Criminological Trials Register (C2-
SPECTR) is in development. As Figure 2 shows, preliminary work toward
C2-SPECTR has already identified more than 10000 citations to
randomized or possibly randomized trials. (p. 28)
Petrosino et al. (2001) cite Petrosino et al. (2000), the same reference cited in
Boruch et al. (2002). The only difference is that incorrect page numbers are given
here. Instead of correctly identifying the pages as 206-219, Petrosino et al.
(2001) identify pages 293-307.
Aside from the citations errors, one would hope that clarity about the
results of the graph would be found in the original citation. Is education fourth,
third or first in cumulative number of reports of randomized trials? The original
citation, Petrosino et al. (2000) does match the results of the graph in Petrosino
et al. (2001), but not the results of the graphs in Whitehurst (2002b) or Boruch et
al. (2002).The original source offers the following description for the chart:

Experimental Design 25
C2-SPECTR thus currently contains a total of 10,449 records. Figure 1
shows cumulative totals of reports of trials published between 1950 and
1998, subdivided on the basis of the „high level‟ codes which were
assigned to indicate the sphere(s) of intervention. (p. 211)
See Figure 4 for a visual explanation.
Figure 4. Diagram of citation errors. Deviations from original source are shown in
bold.
Examining the graphs, it is easy to see how these changes could have
been made inadvertently. Nonetheless, one has to consider the impact that these
errors may have had. Whitehurst‟s presentation was disseminated in “a series of
four regional meetings as part of its work to ensure the effective implementation
of the No Child Left Behind (NCLB) Act” (U. S. Department of Education, 2002).
In addition, the Web of Science shows that this presentation was cited at least 6
cite
cite cites
Boruch et al. (2002)
1. Criminology
2. Psychology
3. Education
4. Social
(p. 206-219)
Petrosino et al.
(2001) 1. Education
2. Psychology
3. Social
4. Criminology
(p. 293-307)
Original Source
Petrosino et al.
(2000, p. 206-219)
1. Education
2. Psychology
3. Social
4. Criminology
Whitehurst (2002)
1. Criminology
2. Psychology
3. Social Policy
4. Education
No page
number given
(2001)

Experimental Design 26
times, Evidence Matters (Mosteller & Boruch, 2002) was cited at least 35 times,
and the original source (Petrosino et al., 2000) was cited 12 times with the
correct page number and 6 times with the incorrect page number which is given
in Petrosino et al. (2001).
Whitehurst‟s (2002b) presentation was described in a report by WestEd
titled Scientific Research and Evidence-Based Practice (Hood, 2003). Hood
gives the following description of the graph in Whitehurst‟s presentation:
22. Education Lags Behind Chart Description: This chart indicates the total
number of articles about randomized field trials in other areas of social
science research (criminology, social policy and psychology) has
steadily grown over the last 40 years; however, the number related to
education research has trailed behind. [By approximately 1996, the
cumulative number of articles about definite and possible randomized field
trials in criminology is approaching 6,000; the numbers in social policy
and psychology exceed 2,000; while the number for education is less than
1,000.] (p.22)
In addition, Whitehurst‟s presentation is identified as one of the Editor‟s Picks
under Proven Methods: Doing What Works within the NCLB page on the U.S.
Department of Education‟s Website (see
http://www.ed.gov/nclb/methods/whatworks/edpicks.jhtml). Colorado‟s
Department of Education has apparently incorporated Whitehurst‟s graph into
their Fast Facts: Evidence-Based Practice (2005). Perhaps because of
Whitehurst‟s position as the Director of the Institute of Education Sciences, or

Experimental Design 27
perhaps because of the wide dissemination of this presentation, citations alone
are not enough to measure the impact that his presentation has had.
Errors in scholarly reports are not new. Thompson (1988, 1994) examined
methodological mistakes in dissertations. Doctoral students and the prevalence
of documentation errors are discussed in a recent article where the authors give
several sources that address documentation errors in the literature such as
“citation errors (for example, non-compliance to the prescribed editorial style),
reference omissions, reference falsification, inconsistent references, inaccurate
quotations, misspelled names, incorrect page numbers, and even fraudulent
research” (Waytowich, Onwuegbuzie, & Jiao, 2006, p. 196). Mistakes will always
be present; it is up to the research community, and informed consumers to make
wise decisions regarding the worth of studies. There is no substitute for good
judgment.
Summary
While true experiments do have the potential to provide the best possible
causal evidence, it is imperative to keep in mind the threats that may undermine
confidence in the findings, from internal and external validity threats, to simple
human errors. In the wise words of Sackett and colleagues, the purpose of this
type of research is to inform, but not to replace individual practitioner‟s
knowledge (Sackett et al., 1996). This implies judgment on the part of the reader.

Experimental Design 28
References
American Heart Association Nutrition Committee. (2006). AHA Scientific statement:
Diet and lifestyle recommendations revision 2006. Circulation, 114, 82-96.
American Psychological Association. (2002). Criteria for evaluating treatment guidelines.
American Psychologist, 57, 1052-1059.
American Psychological Association. (2006). Evidence-based practice in psychology.
American Psychologist, 61, 271-285.
Boger, G. (2005). Spreadsheet simulation of the law of large numbers. Mathematics and
Computer Education, 39, 175-182.
Boruch, R., Moya, D. D., & Snyder, B. (2002). The importance of randomized field trials
in education and related areas. In F. Mosteller & R. Boruch (Eds.), Evidence
matters: Randomized trials in education research (pp. 50-79). Washington, DC:
Brookings Institution Press.
Campbell, D. T. (1957). Factors relevant to the validity of experiments in social settings.
Psychological Bulletin, 54, 297-312.
Campbell, D. T., & Stanley, J. C. (1963). Experimental and quasi-experimental designs
for research on teaching. In N. L. Gage (Ed.), Handbook of research on teaching
(pp. 171-246). Chicago: Rand McNally.
Chambless, D. L., & Hollon, S. D. (1998). Defining empirically supported therapies.
Journal of Consulting and Clinical Psychology, 66, 7-18.
Coalition for Evidence-Based Policy. (2003). Identifying and implementing educational
practices supported by rigorous evidence: A user friendly guide.
Colorado Department of Education. (2005). Fast facts: Evidence-based practice.
Retrieved Jan 3, from http://www.cde.state.co.us/cdesped/download/pdf/ff-
EvidenceBasedPractice_Intro.pdf
Creswell, J. W. (2003). Research design: Qualitative, quantitative, and mixed methods
approaches (2nd ed.). Thousand Oaks, CA: Sage Publications, Inc.
Evidence-Based Medicine Working Group. (1992). Evidence-based medicine: A new
approach to teaching the practice of medicine. Journal of the American Medical
Association, 268, 2420-2425.
Gall, J. P., Gall, M. D., & Borg, W. R. (2005). Applying educational research: A
practical guide (5th ed.). Boston: Pearson Education, Inc.

Experimental Design 29
Galton, F. (1886). Regression towards mediocrity in hereditary stature. Journal of the
Anthropological Institute, 15, 246-263.
Hood, P. D. (2003). Scientific research and evidence-based practice. Retrieved January
2, 2008, from http://www.wested.org/online_pubs/scientrific.research.pdf
Kübler, W. (2000). Treatment of cardiac diseases: Evidence based or experience based
medicine? 84, 134-136.
Mosteller, F., & Boruch, R. (Eds.). (2002). Evidence matters: Randomized trials in
education research. Washington, DC: Brookings Institution Press.
Odom, S. L., Brantlinger, E., Gersten, R., Horner, R. H., Thompson, B., & Harris, K. R.
(2005). Research in special education: Scientific methods and evidenced-based
practices. Exceptional Children, 71, 137-148.
Onwuegbuzie, A. J. (2000, November). Expanding the framework of internal and
external validity in quantitative research. Paper presented at the annual meeting
of the Association for the Advancement of Educational Research, Ponte Vedra,
FL. (ERIC Document Reproduction Service No. ED 448 205).
Petrosino, A., Boruch, R. F., Soydan, H., Duggan, L., & Sanchez-Meca, J. (2001).
Meeting the challenges of evidence-based policy: The campbell collaboration The
ANNALS of the American Academy of Political and Social Science, 578, 14-34.
Petrosino, A. J., Boruch, R. F., Rounding, C., McDonald, S., & Chalmers, I. (2000). The
campbell collaboration social, psychological, educational and criminological trials
register (C-2 SPECTR) to facilitate the preparation and maintenance of systematic
reviews of social and educational interventions. Evaluation and Research in
Education, 14, 206-219.
Rosenbaum, P. R. (1995). Randomized experiments. New York: Springer-Verlag.
Sackett, D. L., Rosenberg, W. M. C., Gray, J. A. M., Haynes, R. B., & Richardson, W. S.
(1996). Evidence based medicine: What it is and what it isn't. British Medical
Journal, 312(7023), 71-72.
Sackett, D. L., Strauss, S. E., Richardson, W. S., Rosenberg, W., & Haynes, R. B. (Eds.).
(2000). Evidence-based medicine: How to practice and teach EBM. New York:
Churchill Livingstone.
Sani, F., & Todman, J. (2006). Experimental design and statistics for psychology: A first
course. Malden, MA: Blackwell Publishing.
Shadish, W. R., Cook, T. D., & Campbell, D. T. (2002). Experimental and quasi-
experimental designs for generalized causal inference. Boston: Houghton Mifflin.

Experimental Design 30
Shavelson, R. J., & Towne, L. (Eds.). (2002). Scientific research in education.
Washington, DC: National Academy Press.
Thompson, B. (1988, November). Common methodology mistakes in dissertations:
Improving dissertation quality. Paper presented at the Annual Meeting of the
Mid-South Educational Research Association, Louisville, KY. (ERIC
Document Reproduction Service No. ED 301 595).
Thompson, B. (1994, April). Common methodology mistakes in dissertations, revisited.
Paper presented at the Annual Meeting of the American Educational Research
Association New Orleans, LA. (ERIC Document Reproduction Service No. ED
368 771).
Thompson, B. (2006). Foundations of behavioral statistics: An insight-based approach.
New York: Guilford.
Thompson, B., Diamond, K. E., McWilliam, R., Snyder, P., & Snyder, S. W. (2005).
Evaluating the quality of evidence from correlational research for evidence-based
practice. Exceptional Children, 71, 181-194.
Towne, L. (2005). Scientific evidence and inference in educational policy and practice:
Defining and implementing "Scientifically based research". In C. A. Dwyer (Ed.),
Measurement and Research in the Accountability Era (pp. 41-58). Mahwah, NJ:
Routledge.
U.S. Congress. (2001). No Child Left Behind Act of 2001, Public Law No. 107-110.
Washington, DC.
U. S. Department of Education. (2002). Lead & manage my school: Student achievement
and school accountability conference. Retrieved December 27, 2007, from
http://www.ed.gov/admins/lead/account/sasaconference02.html
Waytowich, V. L., Onwuegbuzie, A. J., & Jiao, Q. G. (2006). Characteristics of doctoral
students who commit citation errors. Library Review, 55, 195-208.
Whitehurst, G. J. (2002a). Archived evidence-based education (EBE). Retrieved
December 20, 2007, from
http://www.ed.gov/offices/OERI/presentations/evidencebase.html
Whitehurst, G. J. (2002b). Evidence-based education (EBE). On Student Achievement
and School Accountability Conference. Retrieved December 20, 2007, from
http://www.ed.gov/nclb/methods/whatworks/eb/edlite-index.html