experimental behaviour of high strength concrete …vuir.vu.edu.au/8911/1/v3_revised _journal deep...
TRANSCRIPT

EXPERIMENTAL BEHAVIOUR OF HIGH STRENGTH
CONCRETE DEEP BEAMS WITH WEB OPENINGS
TAE-MIN YOO1, JEUNG-HWAN DOH
1*, HONG GUAN
1 AND SAM FRAGOMENI
2
1Griffith School of Engineering, Griffith University Gold Coast Campus, Queensland
4222, Australia 2 School of Engineering and Science, Victoria University, Melbourne, Australia
SUMMARY
This paper focuses on an experimental study undertaken on High Strength Concrete (HSC)
deep beams with various opening sizes and locations on the web. The test covers a wide scope
of variables that have not been investigated in previous research. Apart from highlighting the
experimental setup, failure loads and typical crack patterns of the test specimens are also
reported. Experimental results are then compared with predictions using currently available
design methods. The comparison indicates that the predictions using current design methods
can overly underestimate or sometimes overestimate the ultimate strength of these HSC deep
beams. Further, the reduction of ultimate strengths due to the existence of web openings is not
considered adequately in these design methods. To rectify the shortcomings of current design
formulae, a new design equation is proposed and compared with the experimental results and
those from previous studies on the related topics. The accuracy and reliability of the proposed
new equation is subsequently confirmed. Based on the outcome of this work, more
experimental tests with various opening configurations including shape and location of web
openings are recommended for future study.
1. INTRODUCTION
The utilisation of deep beams within structural engineering practice has grown substantially over the last four decades. More specifically, there has been an increased practise of including deep beams in the design of high-rise buildings, offshore structures, and foundations. A deep beam loaded at any point or loaded continuously over its span distributes this load to its supports, and this can aid in the provision of more open space in a structure when compared with other design methods. Although reinforced concrete deep beams are of considerable interest in structural engineering practice, major codes of practice such as AS3600-2009, ACI318-08 and CSA 1984, still offer little guidance on the design of high strength concrete deep beams, particularly when openings in the web region are provided for essential services and accessibility (Kong, 1990). The need for an accurate design method for deep beams with openings is therefore becoming increasingly necessary.
Web openings are introduced to accommodate services including air-conditioning ducts
and cables to save space, as these would otherwise be located below the deep beam. An
opening produces geometric discontinuity within the beam and affects the nonlinear stress
* Correspondence to: Jeung-Hwan Doh, Griffith School of Engineering, Griffith University,
Gold Coast campus, QLD, Australia, 4222. E-mail: [email protected]
distribution over the depth of the beam. The inclusion of web openings decreases the ultimate
strength of a deep beam that can be attributed to the reduction of concrete mass acting in
compression and the opening acting as a stress raiser for shear crack propagation. This is
particularly evident when the opening is located long the critical load path of a deep beam.
Current code of standards such as AS3600-2009 and ACI318-2009 devote separate
chapters to deep beam design, recommended the use of strut-and-tie methods. However,
current codes of standards are only intended for solid deep beams.
Web openings in a deep beam significantly affect its structural behaviour as demonstrated
in previous studies (Kong and Sharp 1977; Kong et al. 1978; Mansur and Alwis 1984; Ray
1990; Almeida and Pinto 1999; Ashour and Rishi 2000; Maxwell and Breen 2000; Tan et al.
2003; Yang et al. 2006; Yang and Ashour 2008). A simple structural idealization for
predicting the ultimate shear strength of deep beams with web openings was proposed some
thirty years ago based on a series of laboratory testing conducted by Kong and Sharp (1977)
and Kong et al. (1978) and extended upon by Tan et al. (2003). The structural idealization
shows the lower and upper paths of load transfer when a web opening is present. It offers a
good indication of the ultimate load-carrying capacity of the beam which is affected by the
size and location at which the natural load path is interrupted by an opening (Guan and Doh,
2007).
Even if many researchers have conducted extensive experimental tests on the simply
supported deep beams with various web opening configurations, there are still gap to rectify
the limitations on the previous study. Table 1 presents summary of previously available tests
on the simply supported deep beams with web openings.
Yang et al. (2006) tested 32 high strength concrete deep beams with and without web
openings under two-point loading. The variables included concrete strength, width and depth
of opening and shear span-to-depth ratio. The authors found that Kong and Sharp’s (1977)
equation for deep beams with web openings became more conservative with the increase in
concrete strength, and Tan et al.’s (2003) equation was less conservative. It is also interesting
to note that as the shear span-to-depth ratio increased from 0.5 to 1.0 in normal strength and
high strength concrete beams, both equations overestimated the shear strength of the deep
beams with web openings. This is a concern where deep beams with web openings need to be
utilised that comprise of higher shear-span to depth ratios, thus presenting a limitation to these
equations.
In recent attention, Ashour and Yang (2008) conducted extensive review on the application
of plasticity theory to reinforced concrete deep beams with and without openings. Authors
concluded that the strut-and-tie models are generally more difficult to develop for deep beams
with web openings than the mechanism approach.
Although these complicated stress states have been reported on in the past, most research
has been limited to lightweight and normal strength concrete, the web openings have been
very large when compared to the smaller shear-span to depth ratios < 1.
Hence, the purpose of this study is to investigate the behaviour of high strength concrete
deep beams with various web opening sizes and locations. To achieve this, an experimental
program has been undertaken to obtain data that includes the ultimate load, crack patterns and
failure modes.
This paper details the test procedure and analysis of forty three (43) simply supported high
strength concrete deep beams with various web opening sizes and locations. These beams are
split into three groups to investigate a variety of geometric parameters relating to different
behaviour characteristics of the beams. Data obtained from testing are then compared to
predicted results using methods from Kong et al. (1978), Kong and Sharp (1977) and Tan et
al. (2003). Note that the effects of web reinforcements are not considered in this study. Also

2. CURRENT DESIGN FORMULA FOR DEEP BEAM WITH WEB OPENINGS
Based on experimental studies, Kong et al. (1970, 1978) and Kong and Sharp (1973, 1977) derived design equations for normal and lightweight concrete deep beams with and without web openings. The ultimate shear strength equations for reinforced concrete deep beams are:
2
21 sin35.01D
yACbDf
D
xCQ wtult (1)
for solid deep beam, and
1
2122
2
11 sin35.01
D
yACDbkf
Dk
xkCQ wtult (2)
for deep beam with web opening
The geometric notations are illustrated in Figure 1.
Kong and Sharp (1973, 1977) and Kong et al. (1978) made significant contributions to the
development of the British Standard and the first term on the right side of Eq. (1) and Eq. (2)
expresses the load capacity of a strut. When an opening is in the natural loading path, the first
term considers the lower load path. The second term on the right side of the equation
articulates the contribution of reinforcement in deep beams. It should be noted however, that
these equations are only applicable for concrete strengths less than 46 MPa.
2
w
2
w
CL
a1xe
k1xe
k2D
a2D
xe
α
A
B
C
E
Upper path
Lower path
Figure 1. Notation for size and location of opening (half length) (Kong and Sharp, 1977).
Tan et al. (1995, 1997 & 2003) and Leong and Tan (2003) investigated the effects of high
strength, shear span to depth ratios and web reinforcement ratios of the beams using both an
experimental program and numerical analysis. The design shear strength for high strength
concrete deep beams is
D

sstrcct
sn
AfAf
V
sin'
12sin
1
(3)
where ct
w
s
c
wsyww
s
c
sys
t fd
d
A
fA
A
fAf
sin
)sin(2
sin
sin2 (4a)
and 2 2tan
a b
s
l lh
a
(4b)
Eq. (2) has limitation on the web opening size and location with respect to the x/D ratio
within the 0.25 to 0.4 range. However Eq. (3) does not give any design limitations in regards
to the opening size, location or orientation of the opening size; or for that fact, the geometry
of the beam itself, including the x/D or L/D ratio. Either they have not considered the effect of
these variables, or they are confident that the equation will work under any circumstance.
Although Yang et al. (2006) supports the use of these two equations for high strength
concrete deep beams with web openings, the authors noted that Eq. (1) and Eq. (2) were very
conservative with the increase in concrete strength, thus the design of these concrete beams is
less economical. C1 in the Eq. (1) and Eq. (2) is 0.35 in which represented semi-empirical
expressions from the experiments conducted by the authors. These are located within the first
half of the equation which is a measure of the load-carrying capacity of the concrete strut of
the lower path in the structural idealisation ( 1 2tC f bk D ). The factor 1
2
1 0 35.k x
k D
allows for
experimental observation of the way the load capacity varied with cot α, where α is the
inclination of the lower load path to the horizontal. As such, the first term is a semi-empirical
expression for the capacity of the lower path – the strut fails when this capacity is reached.
The second term represents the contribution of steel reinforcement to the shear strength of the
beam. In this paper the second hand term will not be modified as the structural idealisation of
the steel reinforcement is considered to be appropriately dealt with in this original
manifestation.
3. EXPERIMENTAL PROGRAM
3.1 Test setup
In order to utilise previously published research (Kong et al. 1978, Tan et al, 2003 and Yang
et al. 2006) for an in-depth comparison, an additional forty three deep beams with various
opening sizes and locations were cast and tested to failure in this study. The overall
dimensions of all deep beam specimens were 2400 mm × 600 mm 110 mm thick, as
detailed in Figure 2 (a) & (b). For specimens under the single-point loading shown in Figure
2(a), the shear span was 900mm, which resulted in a clear span to depth (L/D) ratio of 3 and a
shear span to depth ratio (a/D) of 1.5. For those beams under two-point loading shown in
Figure 2(b), L/D ratio and a/D equalled 3.0 and 1.0, respectively.
The size of openings were varied from 60mm×60mm to 210mm210mm and the opening
configurations for each specimen were detailed in Table 2 with details of geometric notations
presented in Figure 3 (a) & (b). The existing test beams have the web opening ratios varied

0.18 ≤ a1 ≤ 0.38 and 0.1 ≤ a2 ≤ 0.4. It presents the opening sizes are relatively larger and hence,
there needs to be more details study on the openings ratios in the range 0.075 ≤ a1 ≤ 0.3 and
0.1 ≤ a2 ≤ 0.4.
Each beam consisted of two 20 mm diameter deformed reinforcement bars, with nominal
yield stress of 500 MPa, in the longitudinal direction located close to the bottom of the beam.
Each bar had a length of 2700mm and a 90 degree cog at each end with a vertical length
200mm to prevent end anchorage failure. The concrete was supplied by a local ready-mix
company and the compressive concrete strengths for all specimens were mainly high strength
varying from 63 to 91 MPa. It should be noted that four deep beam specimens (Group 8)
comprised of concrete with a lower compressive strength of 34 MPa.
The test frame was designed to support a jack of 80 tonne capacity. Dial gauges were used
to measure the vertical deflections of the beams at the midspan during testing (see Figure 4 (a)
& (b)).
The deep beams were loaded in increments of approximately 10 kN at the beginning until
an initial flexural crack was observed. The load increment was reduced to approximately 5kN
afterwards. The load increment was further reduced to approximately 2kN after propagation
of diagonal cracks. Upon approaching failure load, the load increment was made even smaller
to 0.1 kN. At each load increment, crack patterns and deflections were recorded. The latter
allowed the load-deflection history to be traced accurately.
300 3001800
CL
900 900
60
0
Hydraulic
jack
Support
(Hinge)Support
(Roller)
2 main reinforcement bars,
(500MPa, 20Ø)
Load cell
Bearing
cage
300 3001800
CL
600 600
60
0
Hydraulic
jack
Support
(Hinge) Support (Roller)
2 main reinforcement
bars,
(500MPa, 20Ø)
Load cell
Bearing
cage
(a) Specimens under single-point loading
(b) Specimens under two-point loadings
(Categories 10 Specimens)
Figure 2. Details of deep beam specimens (dimensions in mm)
CL
y 2y 1
x2x1
a1
a2
x2x1
a1
CL
y 1y 2
a2
(a) Specimens under single-point loading
(Categories 1 to 9)
(b) Specimens under two-points loading
(Category 10)
Figure 3. Notations for test specimens

(a) Side View (b) Front view
Figure 4. Test setup
3.2 Test specimens
The beams were separated into three groups to ensure a variety of parameters relating to
different behaviour characteristics was investigated. The varying parameters included
concrete strengths, opening sizes, shapes, locations, and shear span-to-depth ratios.
Dimensions of each deep beam specimen are detailed in Table 1 and in Figures 5 to 7.
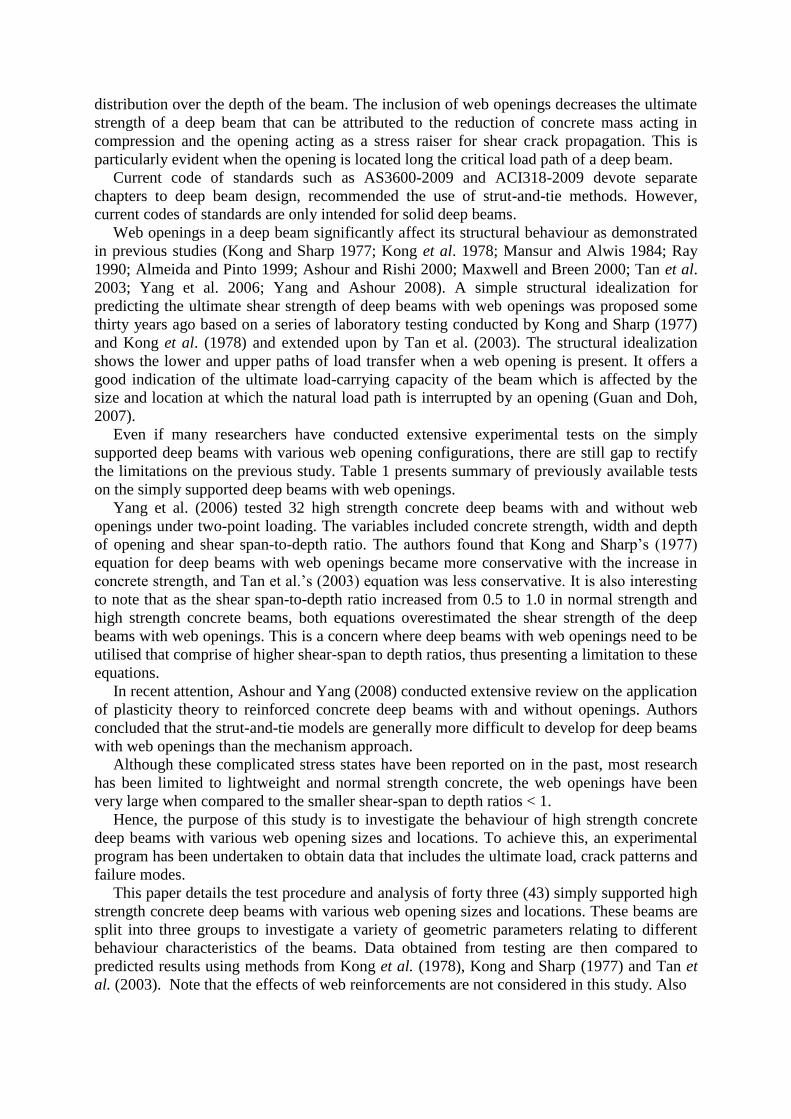
3.2.1 Group 1
Group 1 specimens were divided into four Categories (Category 1, 2, 3 & 4) to observe the
effect of location of a web opening on the high strength concrete (HSC) deep beams. There
were four specimens cast for each category in this group. The web opening remained at a
standard size of 60mm×60mm with its various positions. The varying parameters were:
Category 1- the location of the web opening remained at mid-depth of the beam, but was
moved sideways for each of the allocated test specimens (see Figure 5(a));
Category 2- the location of the web opening remained at mid-depth of the beam but was
moved up or down for each of the test specimens(see Figure 5(b));
Category 3- the location of the web opening was positioned at different locations
diagonally – parallel to the critical load path (see Figure 5(c));
Category 4- the location of the web opening was positioned at different locations
diagonally in the beam, but perpendicular to the critical shear load path (see Figure 5(d)).
CL
60
270
465 60
Varying opening location
S01-72-1
CL
60
330
405 60
Varying opening location
S02-72-1
(a) Category 1 (b) Category 2
CL
60
330
495 60
S03-63-1
Varying opening location
CL
60
330
315 60
S04-82-1
Varying opening location
(c) Category 3 (d) Category 4
Figure 5. Group 1 test specimens (dimensions in mm)
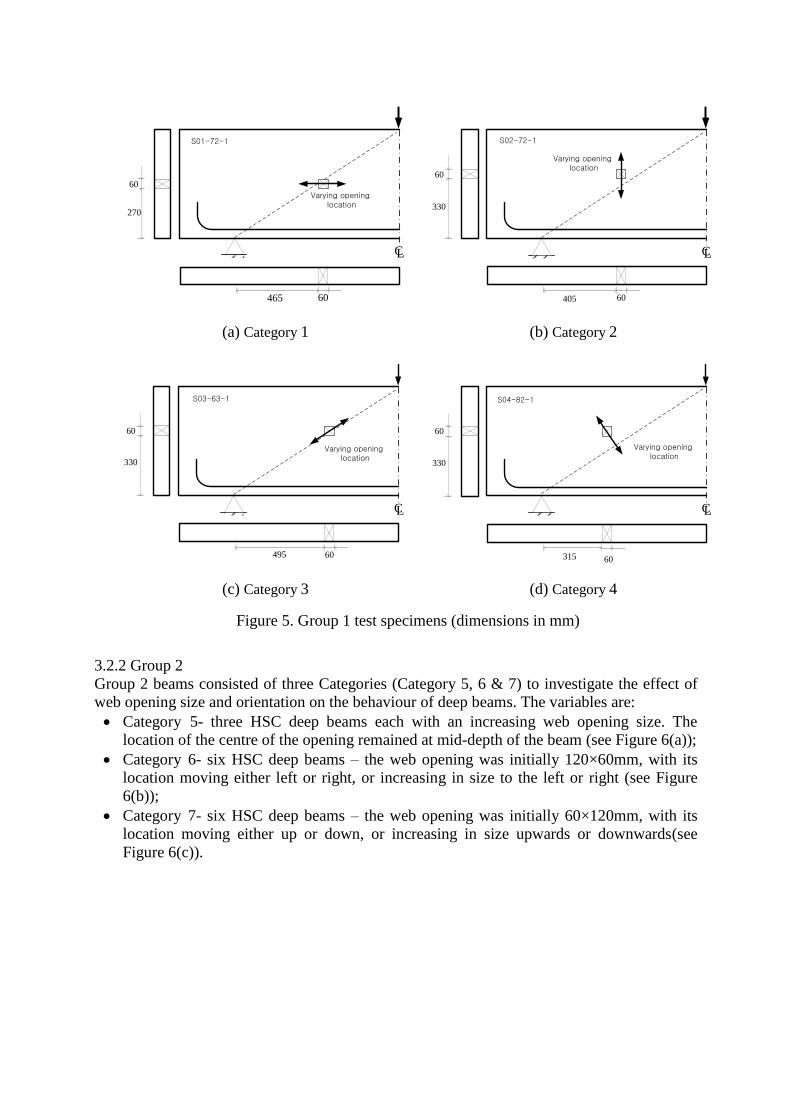
3.2.2 Group 2
Group 2 beams consisted of three Categories (Category 5, 6 & 7) to investigate the effect of
web opening size and orientation on the behaviour of deep beams. The variables are:
Category 5- three HSC deep beams each with an increasing web opening size. The
location of the centre of the opening remained at mid-depth of the beam (see Figure 6(a));
Category 6- six HSC deep beams – the web opening was initially 120×60mm, with its
location moving either left or right, or increasing in size to the left or right (see Figure
6(b));
Category 7- six HSC deep beams – the web opening was initially 60×120mm, with its
location moving either up or down, or increasing in size upwards or downwards(see
Figure 6(c)).

CL
60
270
405 60
S05-72-1
CL
90
255
382.5 90
S05-80-2
CL
120
240
360 120
S05-80-3
(a) Category 5
CL
270
405
60
120
S06-79-1
CL
405 240
270
60
S06-79-2
CL
345 120
270
60
S06-79-3
CL
225 240
270
60
S06-79-4
CL
270
345
60
180
S06-64-5
CL
285 240
270
60
S06-64-6
(b) Category 6
CL
405 60
120
270
S07-91-1
CL
405 60
180
210
S07-91-2
CL
405 60
120
210
S07-91-3
CL
405 60
180
150
S07-91-4
CL
405 60
180
210
S07-64-5
CL
405 60
240
180
S07-64-6
(c) Category 7
Figure 6. Group 2 test specimens (dimensions in mm)
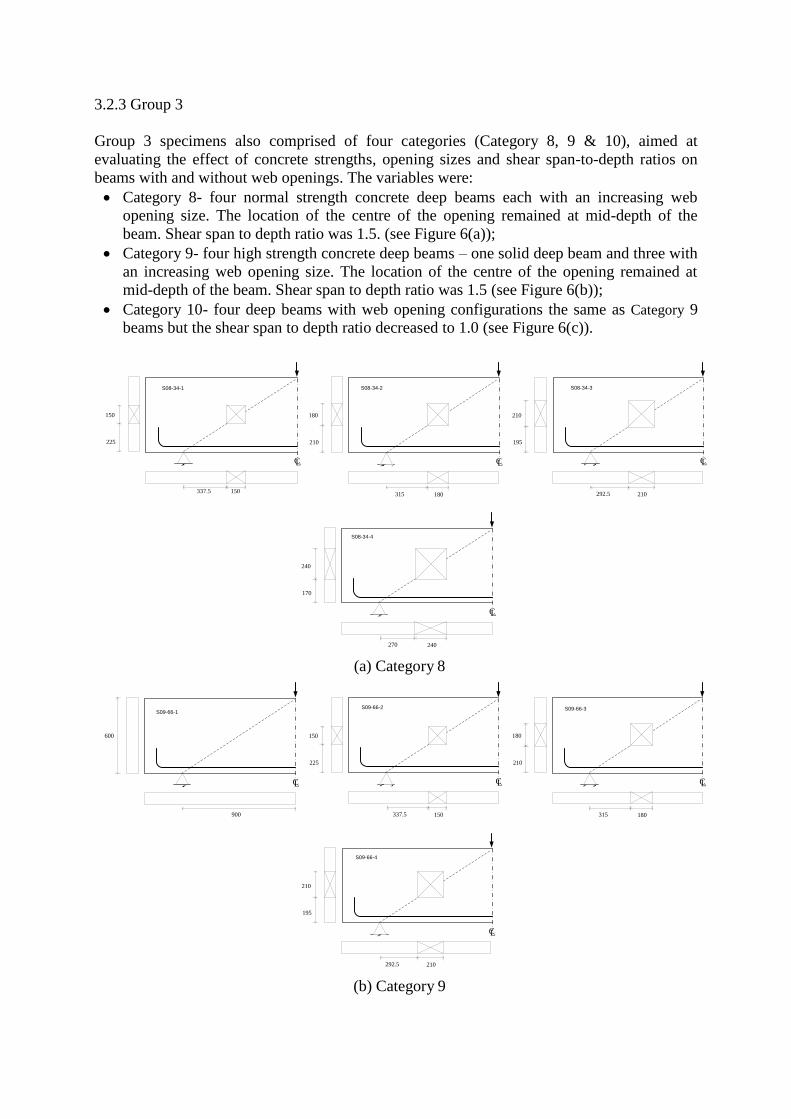
3.2.3 Group 3
Group 3 specimens also comprised of four categories (Category 8, 9 & 10), aimed at
evaluating the effect of concrete strengths, opening sizes and shear span-to-depth ratios on
beams with and without web openings. The variables were:
Category 8- four normal strength concrete deep beams each with an increasing web
opening size. The location of the centre of the opening remained at mid-depth of the
beam. Shear span to depth ratio was 1.5. (see Figure 6(a));
Category 9- four high strength concrete deep beams – one solid deep beam and three with
an increasing web opening size. The location of the centre of the opening remained at
mid-depth of the beam. Shear span to depth ratio was 1.5 (see Figure 6(b));
Category 10- four deep beams with web opening configurations the same as Category 9
beams but the shear span to depth ratio decreased to 1.0 (see Figure 6(c)).
CL
150
225
337.5
S08-34-1
150
CL
180
210
315 180
S08-34-2
CL
210
195
292.5 210
S08-34-3
CL
240
170
270 240
S08-34-4
(a) Category 8
CL
600
900
S09-66-1
CL
150
225
337.5 150
S09-66-2
CL
180
210
315 180
S09-66-3
CL
210
195
292.5 210
S09-66-4
(b) Category 9

CL
600
600
300
S10-66-1
CL
150
225
337.5 150
300
S10-66-2
CL
180
210
315 180
300
S10-66-3
CL
210
195
292.5 210
300
S10-66-4
(c) Category 10
Figure 7. Group 3 test specimens (dimensions in mm)
4. RESULTS AND DISCUSSION
4.1Crack patterns
Typical crack patterns for a sample of the deep beams tested are given in Figures 8 to 17. All
of the beams exhibited crack patterns and failure modes that are consistent with the expected
behaviour of simply supported deep beams with openings. In the majority of cases flexural
type cracks were evident in initial stages. These crack developments ceased to propagate once
shear cracks appeared near the edge of corners and near the load point and support conditions.
Most specimens developed flexural cracks once loading reached approximately 30% of the
ultimate strength. At 70-90% of the ultimate load, diagonal cracks generally developed
around the corner of the web openings toward the supports and also under load points. These
crack propagations formed in rapid manner when loading approach failure. Overall it seems
openings played a major role in cracking behaviour, with more evidence of shear type
cracking, whereas the beams with no openings (Figures 14 and 16) exhibit the more typical
shear-flexure type cracking behaviour.
Figure 8. Failure crack patterns S03-63-1 Figure 9. Failure crack patterns S03-63-4
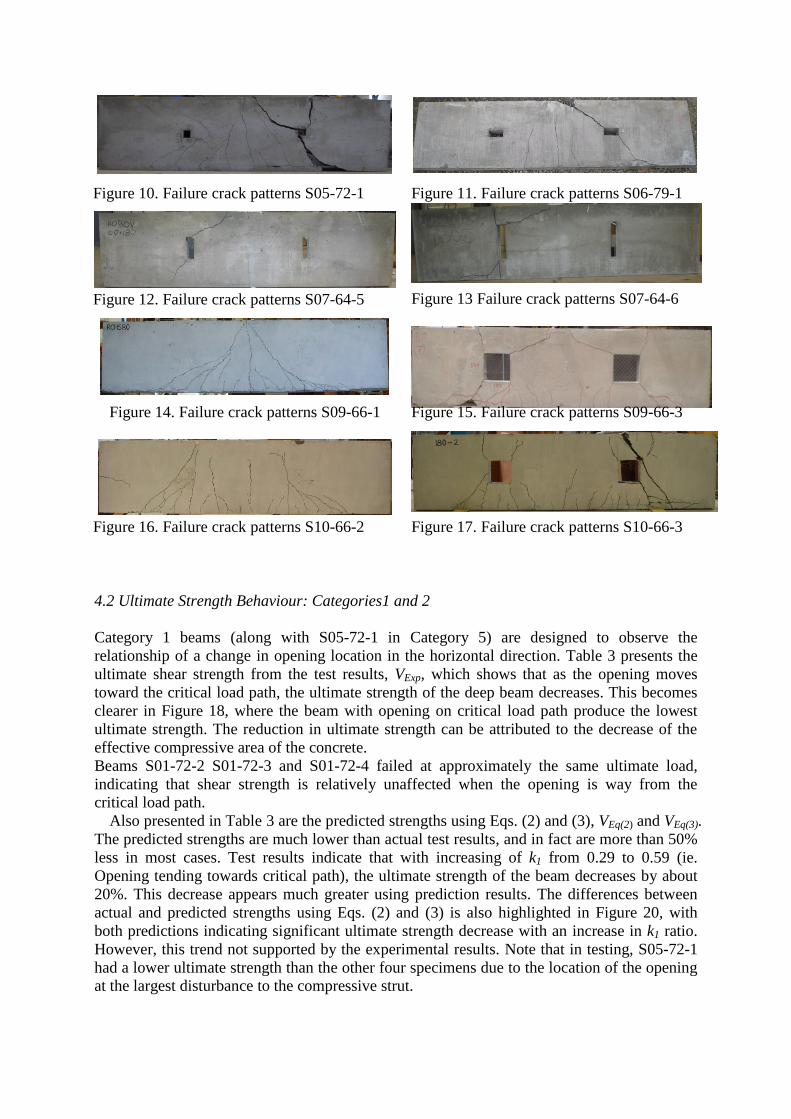
Figure 10. Failure crack patterns S05-72-1 Figure 11. Failure crack patterns S06-79-1
Figure 12. Failure crack patterns S07-64-5 Figure 13 Failure crack patterns S07-64-6
Figure 14. Failure crack patterns S09-66-1 Figure 15. Failure crack patterns S09-66-3
Figure 16. Failure crack patterns S10-66-2 Figure 17. Failure crack patterns S10-66-3
4.2 Ultimate Strength Behaviour: Categories1 and 2
Category 1 beams (along with S05-72-1 in Category 5) are designed to observe the
relationship of a change in opening location in the horizontal direction. Table 3 presents the
ultimate shear strength from the test results, VExp, which shows that as the opening moves
toward the critical load path, the ultimate strength of the deep beam decreases. This becomes
clearer in Figure 18, where the beam with opening on critical load path produce the lowest
ultimate strength. The reduction in ultimate strength can be attributed to the decrease of the
effective compressive area of the concrete.
Beams S01-72-2 S01-72-3 and S01-72-4 failed at approximately the same ultimate load,
indicating that shear strength is relatively unaffected when the opening is way from the
critical load path.
Also presented in Table 3 are the predicted strengths using Eqs. (2) and (3), VEq(2) and VEq(3).
The predicted strengths are much lower than actual test results, and in fact are more than 50%
less in most cases. Test results indicate that with increasing of k1 from 0.29 to 0.59 (ie.
Opening tending towards critical path), the ultimate strength of the beam decreases by about
20%. This decrease appears much greater using prediction results. The differences between
actual and predicted strengths using Eqs. (2) and (3) is also highlighted in Figure 20, with
both predictions indicating significant ultimate strength decrease with an increase in k1 ratio.
However, this trend not supported by the experimental results. Note that in testing, S05-72-1
had a lower ultimate strength than the other four specimens due to the location of the opening
at the largest disturbance to the compressive strut.

Category 2 beams are designed to observe the relationship of a change in opening location
in the vertical direction. Previous research suggests that as the opening moves away from the
critical load path the strength of the beam will increase, this trend was also observed in the
experimental results. It can be seen from Figure 19 that the strength of the beam decreases as
the opening is moved to a lower position. The reason for this may be that by lowering the
position of the opening, the effective depth of the neutral axis tends upwards, meaning there is
more concrete in tension. The area gain in tension has a larger effect than the decrease of area
in compression, resulting in a lower ultimate load. Figure 21 shows the ultimate shear load
versus depth from opening to bottom (k2). It can be seen from this figure that predictions of
ultimate strength with Eqs. (2) and (3) increase as the web opening moves away from the
soffit of the beam. The ratios of the increments of the predicted results are near uniform and
thus conform to a linear relationship. Once again, the predicted strengths are much lower than
actual test results. Therefore the ultimate strengths predicted by previous researchers are too
conservative
51 2 3 4
S01-72-2S01-72-1S01-72-4 S01-72-3 S05-72-1
CL
150
200
250
300
350
400
450
-200 -100 0 100 200
Horizontal distance from the critical shear path
Maxim
um
Sh
ear
Lo
ad
(kN
)
S01-72-4S01-72-3
S05-72-1
S01-72-1
S01-72-2
CL
S02-70-4
S02-70-3
S05-72-1
S02-70-2
S02-70-1
150
200
250
300
350
400
450
-150 -100 -50 0 50 100 150
Vertical distance from the critical shear path
Maxim
um
Sh
ear
Lo
ad
(kN
)
S02-70-4S02-70-3
S05-72-1
S02-70-1
S02-70-2
Figure 18 Horizontal Position of Opening
versus Ultimate Load
Figure 19 Vertical Position of Opening versus
Ultimate Load
4.3 Ultimate Strength Behaviour: Categories 3 and 4
Category 3 represents the varying of both horizontal and vertical opening location ratios, k1
and k2. Experimental results along with predictions are again presented in Table 3 and
graphically in Figure 22. In general, the test results and the ultimate strength predictions
increased with the increase of k1 and k2. However the test ultimate strength of S03-63-2
illustrated an unexpected different behaviour with an ultimate strength lower than that of S03-
63-1. This is possibly due to the shape of the strut and the reduction effect caused by the
opening. The strut is actually representative of a bottle shape with the stress from the load
area spread out along the diagonal load path. When the opening is located at the neck area of

the bottle shape strut, the reduction effect due to the opening is greater than when the opening
is located proximate to neutral axis of the beam. The predicted ultimate load capacities using
Eqs. (2) and (3) are again lower than experimental values, and increase as the web opening
moves away from the soffit, even though the web opening is located close to the loading zone.
The test ultimate strengths of the Category 4 specimens are similar to each other when the
openings were located above the critical zone as shown in Table 3 and indicated in Figure 23.
However, the ultimate strengths decreased significantly when openings were located in the
flexural zone. The conservative nature of both Eqs. (2) and (3) was evident for the high
strength concrete deep beams tested. It should be noted that Eq (2) actually gives a negative
result for the S04-82-4 implying zero strength as shown in Table 3. This highlights the need
for a modified design equation to predict the maximum shear strength for such high strength
concrete deep beams with openings located near the flexural zone.
0
100
200
300
400
500
0.00 0.25 0.50 0.75 1.00
Ult
imate
lo
ad
(k
N)
k1
Test
Equation (2)
Equation (3)
0
50
100
150
200
250
300
350
400
450
500
0 0.2 0.4 0.6 0.8k 2
Ult
imat
e l
oad
(k
N)
Test
Equation (2)
Equation (3)
Figure 20. V versus k1 - Category 1
specimens
Figure 21. V versus k2 - Category 2
specimens

0
50
100
150
200
250
300
350
0.00 0.25 0.50 0.75 1.00
Ult
imate
lo
ad
(k
N)
k2
Test
Equation (2)
Equation (3)
0
50
100
150
200
250
300
350
400
450
500
0.00 0.25 0.50 0.75 1.00U
ltim
ate
lo
ad
(k
N)
k2
Test
Equation (2)
Equation (3)
Figure 22. V versus k2 - Category 3 specimens Figure 23. V versus k2 - Category 4 specimens
4.4 Ultimate Strength Behaviour: Categories 6 and 7
Category 6 and 7 beams were tested to observe the effect of web opening size and orientation,
where the web opening was elongated incrementally in different directions. Similar to the
Category 2 beams, the ultimate shear loads in Category 6 were found to increase linearly with
an increase in k1 value. Also it was found that for Category 7 beams there was an increase of
about 44 % in ultimate shear strength for an increase of k2 from 0.25 to 0.45. Interestingly, in
these categories, it was found that the equations gave a closer prediction of actual ultimate
strength. It can be noted that opening sizes are larger than in previous categories resulting in
much lower experimental ultimate strengths.
4.4 Ultimate Strength Behaviour: Categories 5, 8, 9 and 10
As can be seen in Table 3, as the web opening size increases a significant decrease in the
ultimate strength occurs in all these categories. The ultimate loads achieved for the single point loaded deep beams (Category 9) were much lower when compared to the corresponding two-point loaded deep beams (Category 10). Thus a decrease in shear span ratio will lead to an increase in the ultimate strength. This effect was more pronounced when the compressive strength of the concrete was higher.
A further significant observation can be made between normal and high strength concrete
deep beams using Table 3.. For the normal strength concrete deep beams of Category 8, an
increase in the opening size from 150mm to 210mm led to a strength reduction of 17.8%. The
increased size of the web opening was a more significant factor in high strength concrete deep
beams where it was observed that an increase in the opening size from 150mm to 210mm led
to a strength reduction of 34.4% and 70.0% for single point loaded beams (Category 9) and

double-point loaded beams (Category 10), respectively. For beams loaded at two points
(Category 10), greater reduction in shear strength of the deep beams can be attributed to the
influence the larger opening had on the shear path.
4.5 Overall Comparison study: predicted versus actual ultimate strengths
As highlighted in Table 2, the calculated ultimate strength using Eqs. (2) and (3) proposed by
previous researchers were compared with the experimental test results of the 43 deep beams
with and without web openings. Even though the proposed Eq. (2) gives a safe estimate of
failure load for all beams with a mean (Predicted/Experimental) of 0.57 and standard
deviation of 0.23, the result is quite conservative. Also for some predictions such as when the
opening size increases and the opening approaches nearer to the bottom of the beam, Eq. (2)
yields negative strength values which indicate zero capacity. The reason is that the empirical
coefficients obtained from the previous research for normal strength or lightweight concrete
are not valid for the high strength concrete deep beams with openings in this research. Hence
the failure load predictions obtained from this method produce greater discrepancies.
On the other hand, Eq. (3) gives a more acceptable mean of 0.82 ratio, but a higher
standard deviation of 0.33. There are a number of ratios that are greater than 1 for Groups 2
and 3 samples, suggesting that the equation overestimates the failure load, which could be
unsafe. It is therefore evident that, even though Tan et al. (2003) have extensively
investigated and proposed design equations for normal strength concrete deep beams,
modifications are still required to produce a satisfactory design formula for high strength
concrete deep beams, particularly when openings are located near critical shear paths.
The approach used in Eq. (3) utilises the more modern strut-and-tie method that accounts
for the flow of forces around the openings. This method uses ratios of the forces in the upper
and lower load paths, and as such is iterative and can be quite lengthy if web reinforcement is
present. It can also be seen from the comparison results that the equation is conservative in
describing the strength of beams with web openings located away from the critical shear path.
5. PROPOSED DESIGN EQUATION
Based on the above finding, the parameter of opening location and size λc can be expressed as
a combination of the parameters of the horizontal and vertical opening location and size
change.
λc, by Kong (1990) was
)1( mc (5a)
where m is the ratio of strength reduction of opening location and size ( x /y ) multiplied by
the shear span to depth ratio (x/D). Re-arranging Eq.(5a) leads to
D
x
y
xc
1 (5b)
Kong (1990) proposed that the strength reduction parameter due to the existence of opening,
λc, is to represent typical diagonal mode of failure generally termed as shear-proper, shear-
flexure and shear-compression, and the failure is mainly related to the shear-span to depth
ratio (x/D). Kong (1990) also proposed that eccentricities of the opening in horizontal and

vertical dimensions can be combined with the effect of size of opening as well as location of
openings. Therefore x can be expressed as
x
exx 1 (5c)
in where the eccentricity of opening in horizontal dimension, xatkex )2(1 131 .
Similarly,
D
ey
y 1 (5d)
where the eccentricity of opening in vertical dimension, Datkey )2(1 242 .
Therefore, substituting Eqs. (5c) and (5d) into Eq. (5b) leads to
D
x
atk
atktc
242
1312
2
21 (5e)
where t2, t3 and t4 are the coefficients of the parameters, k1, k2, a1 and a2 are shown in Eq. (5e).
The expression in bracket in Eq. (5e) is the combination of eccentricity of the opening centre
to the beam centre in the horizontal and vertical directions.
The ultimate strength related to steel is adopted from Eq. (2). Therefore, Vs is
212 sin
D
AyCVs (5f)
The coefficients of the parameters (C, t2, t3 and t4) are obtained by linear analysis based on
least square method using numerical parametric study results for best fit (Yoo, 2011). This
yields for Rigid zone, C1 = 1.1, t2 = 0.2, t3 = -0.5 and t4 = 0.3 and for Flexural zone, C1 = 1.2,
t2 = 0.15, t3 = -0.1 and t4 = 0.9.
Therefore the proposed design equation for high strength concrete deep beams with web
openings is expressed as
2122
22
11 sin90.02
10.0215.012.1
D
AyCDbkf
D
x
ak
akV tFlex (6)
for opening located in Flexural zone, and
2122
22
11 sin15.0
25.02.011.1
D
AyCDbkf
D
x
ak
akV tRigid (7)
for opening located in Rigid zone
5.1 Verification of proposed equation
To verify the proposed design equation, a comparison of proposed equations and other
existing equations is made utilising the experiment results presented in Table 3. Table 3
shows the details of the experimental results (VExp) and the ultimate strength predictions due

to the proposed equations (VProposed), Eq. (2) (VEq (2)) and Eq. (3) (VEq (3)). The ratios VProposed/
VExp, VEq.(2)/ VExp and VEq.(3)/ VExp are also presented in the table. The average values of the three
ratios are shown to be 0.81, 0.57 and 0.82, respectively and the corresponding standard
deviations are 0.31, 0.23 and 0.33, respectively. The proposed equations give a safe estimate
of failure load. Even though Eq. (3) has a better mean value, the standard deviation is slightly
higher than the proposed design equations.
Again less accurate predictions are found for deep beam specimens with web opening
located closer to the beam soffit and/or centre. However, these specimens can be neglected
due to unpractical location or size of the opening. The modification is acceptable because of
the increased strength obtained in the testing and the application of the capacity reduction
assures that all the experimental test results fall well below the predicted design load.
Further comparisons of the proposed equations with test results of Yang et al. (2006)
demonstrate the advantage and benefit of the proposed equations. Yang et al. (2006)’s
experiment was focused on high strength concrete deep beams with web openings but without
web reinforcement. This is similar to the experimental conditions of the present work and
hence, this comparison is valid. In addition, Yang et al.’s (2006) work was to investigate the
effect of main longitudinal steel and shear span to depth ratio when web opening changes.
The impact of the change in opening size and location was not evaluated in detail. The present
study thus offers more insight into this area to further advance the fundamental understanding
provided by the existing research.
As shown in Table 4, the proposed equations are able to make better ultimate strength
predictions than the other existing equations, based on published experimental results of Yang
et al. (2006). The mean ratio of VProposed/VExp is 1.00 and the standard deviation is 0.18.
Whereas the mean ratios of VEq.(2)/VExp and VEq.(3)/VExp are 0.84 and 0.93, respectively with
standard deviations of 0.15 and 0.21, respectively. Overall Eq. (2) and Eq. (3) predict the
experimental ultimate strength successfully. However, the proposed equation showed better
accuracy on the data collected from literature.
6. CONCLUSION
An experimental program has been undertaken to investigate the applicability of current
design methods for concrete deep beams with various web opening configurations. A
comparative study indicates that the currently available design methods proposed by previous
researchers are inadequate in their strength predictions, particularly for deep beams with high
strength concrete. In such cases the formulae can yield conservative and at times
underestimate strengths. They can also produce negative strength values which indicate zero
load-bearing capacity, which was found to be incorrect in this experimental evaluation.
Further, it was generally found that the accuracy of both proposed design procedures
decreased as the distance from the critical load path increased.
Consequently the study found that the concrete deep beams have significantly reduced
strengths with various web opening sizes and its locations. The current design methods do not
adequately account for these variations. In view of the significant shortcomings, there is a
need to amend current design formulae. The special feature of the formulae is its applicability
to both normal and high strength concrete deep beams with various web openings. It also
caters for the effect of opening sizes and various locations. Comparisons with test data and
previous test results confirmed that the new formula is accurate and reliable.
The presented results give a general overview of trends. More detailed analysis is required
before a reliable prediction formula can be established. This may include various support
conditions, shear span to depth ratios and varying web steel ratios and orientation.

REFERENCES
ACI318-09. 2009. Building Code Requirements for Structural Plain Concrete. American
Concrete Institute, Detroit.
AS3600-2009. 2009. Concrete Structures”, Standards Australia. Sydney, Australia, 2009.
Ashour, A.F. & Yang, K.-H. 2008. ‘Application of plasticity theory to reinforced concrete
deep beams: a review’, Magazine of Concrete Research, 60(9):657-664.
Ashour, A.F. & Rishi, G. 2000. Tests of reinforced concrete continuous deep beams with web
openings, ACI Structural Journal 97(5): 418-426.
Eun, H.C, Lee, Y.H., Chung H.S. and Yang, K.H. 2006. On the Shear Strength of Reinforced
Concrete Deep Beam with Web Opening. The Structural Design of Tall and Special
Buildings DOI: 10.1002/tal.306.
Guan, H., & Doh, J. 2007. Development of Strut-and-Tie Models in Deep Beams with Web
Openings. Advances in Structural Engineering 10(6): 697-711.
Kong, F.K., Robins, P.J., & Cole, D.F. 1970. Web Reinforcement Effects on Deep Beams.
ACI Journal 67(12): 1010-1017.
Kong, F.K. & Sharp, G.R. 1973. Shear strength of lightweight reinforced concrete deep
beams with web openings. The Structural Engineer 51(8): 267-275.
Kong, F.K. & Sharp, G.R. 1977. Structural idealization for deep beams with web openings.
Magazine of Concrete Research, 29(99): 81-91.
Kong, F. K., Sharp, G.R., Appleton, S.C., Beaumont, C.J., & Kubik, L.A. 1978. Structural
idealization for deep beams with web openings: further evidence. Magazine of Concrete
Research 30(103): 89-95.
Kong, F. K. 1990. Reinforced Concrete Deep Beams. New York: Routledge.
Leong, C.L. & Tan, K. H. 2003. Proposed Revision on CIRIA Design Equation for Normal
and High Strength Concrete Deep Beams. Magazine of Concrete Research 55: 2 6 7 -2 78 .
Mansur M.A. & Alwis W.A.M. 1984, Reinforced fibre concrete deep beams with web
openings, International Journal of Cement Composites and Lightweight Concrete 6(4):
263-271.
Maxwell, B.S. & Breen, J.E. 2000. Experimental evaluation of strut-and-tie model applied to
deep beam with opening, ACI Structural Journal 97(1): 142-149.
Ray S.P. 1991, Deep beams with web openings. Reinforced Concrete Deep Beams 60-94.
Tan, K. H. & Mansur, M. A. 1992, Partial Prestressing in Concrete Corbels and Deep Beams.
ACI Structural Journal 89: 251-262.
Tan, K.H, Tong, K, & Tang, C.Y. 1997. Effect of web reinforcement on high strength
concrete deep beams. ACI Structural Journal 94(5): 572-82.
Tan, K. H., Kong, F. K., Teng, S. & Guan, L. 1995. High-Strength Concrete Deep Beams
with Effective Span and Shear Span Variations. ACI Structural Journal 92: 1-11.
Tan, K. H., Lu, H.Y. & Teng, S. 1999. Size Effect in Large Prestressed Concrete Deep Beams.
ACI Structural Journal 96: 937-946.
Tan, K.H., Tong, K., & Tang, C.Y. 2003. Consistent strut-and-tie modelling of deep beams
with web openings. Magazine of Concrete Research 55(1): 65-75.
Yang, K.H., Eun, H.C., & Chung, H.S. 2003. Shear characteristics of high-strength concrete
deep beams without shear reinforcement. Engineering Structures 25(8): 1343-52.

Yang, K.H., Eun, H.C., & Chung, H.S. 2006. The influence of web openings on the structural
behavior of reinforced high-strength concrete deep beams. Engineering Structures 28(13):
1825-1834.
Yang, K.H., Chung, H.S. & Ashour, A.F. 2007. Influence of inclined web reinforcement on
reinforced concrete deep beams with openings, ACI Structural Journal 104(5): 580-589.
Yang, K. H. & Ashour A. F. 2008. Code modelling of reinforced concrete deep beams.
Magazine of Concrete Research, 2008, 60(6): 441–454.
Yoo. T.M., 2011. Strength and behaviour of high strength concrete deep beam with web
opening, PhD Thesis, Griffith University.

NOTATION
a shear span measured between concentrated load and support point
a1 width of opening
a2 depth of opening
a1 ratio of width of opening to the shear span
a2 ratio of depth of opening to the depth of the beam
Ac area of concrete strut
As cross section of main reinforcement bars
Ast area of an individual web bar or longitudinal bar
Astr cross sectional area of diagonal strut
Asuh area of single horizontal web reinforcement
Aw area of web reinforcement
b breadth (thickness) of beam
C1 empirical coefficient 1.4 , 1.35 and 1.1 for normal, lightweight concrete and high
strength concrete respectively
C2 empirical coefficient 300N/mm2 and 130N/mm
2 for deformed and plain round bars
respectively
d effective depth of the beam
dw distance from the beam top to the intersection of web reinforcement with the diagonal
strut
D overall Depth of the Beam '
cf characteristic compressive cylinder strength of concrete at 28 days
fct cylinder-splitting tensile strength of concrete
ft combined tensile strength of concrete and steel
fyw yield strength of web reinforcement
h overall height of deep beam (= D)
k1 ratio of width of bottom corner of the opening to the shear span
k2 ratio of height of top corner of the opening to the height of the beam
la depth of bottom nodal zone
lb width of support bearing plate
L simple span of the beam
Qult ultimate shear strength (Kong and Sharp 1977)
t1, t2, t3,t4 coefficients of the geometric parameters (Yoo, 2011)
Vn ultimate shear strength (Tan et al. 2003)
VFlex proposed design equation for high strength concrete deep beams with web openings
where opening located in flexural zone
VRigid proposed design equation for high strength concrete deep beams with web openings
where opening located in rigid zone
Vs ultimate strength related to steel
w total load on beam
x clear-shear span distance
x1 horizontal distance measured from the centre of the corner of support to the nearest
corner of the opening
x2 horizontal distance measured from the centre of the corner of support to the distant
corner of the opening
xe clear shear span length
y depth at which a typical bar intersects the potential critical diagonal crack, which
forms approximately along the line joining the loading and reaction points

y1 depth at which a typical bar intersects a potential critical diagonal crack in a deep
beam with openings
y2 width at which a typical bar intersects a potential critical diagonal crack in a deep
beam with openings
θs angle between the longitudinal tension reinforcement and the diagonal strut
θw angle between the web reinforcement and the axis of beams at the intersection of the
reinforcement and diagonal strut
α angle of intersection between a typical bar and the potential critical diagonal crack
described in the definition of y above
α1 angle of intersection between a typical bar and a potential critical diagonal crack in a
deep beam with openings
λ empirical coefficient, equal to 1.5 for web bars and 1.0 for main longitudinal bars
strength reduction factor
Table 1 Summary of the simply supported deep beam tests with web openings and variables
used
Researcher
Concrete
Strength
('
cf ) MPa
Number
of test
specimen
Shear span
to depth
ratio (a/D)
Opening size ratio Opening location ratio
Horizontal
a1
Vertical
a2
Horizontal
k1
Vertical
k2
Kong & Sharp
(1973) 29.2-37.2 24 0.25, 0.4 0.25-0.5 0.1-0.4 0.63-1.0 0.12-0.8
Kong & Sharp
(1977) 30.2-38.9 34 0.2, 0.3 0.3-1.5 0.2 0.3-1.3 0.13-0.67
Kong et al.
(1978) 36.8-46.2 17 0.28, 0.3 0.3-1.0 0.2, 0.3 0.3-1.0 0.13-0.67
Ashour & Rishi
(2000) 20.8-29.8 16 0.9 0.18, 0.38 0.2, 0.38 0.2 0.3 0.3, 0.4
Maxwell & Breen
(2000) 27.7-28.8 4 1.0 0.3 0.3 0.1 0.1
Yang et. al
(2006) 24-80 32 0.5-1.5 0.25, 0.5 0.1-0.3 0.2-0.4 0.25-0.38

Table 2 Web opening configuration and concrete strength G
rou
p 1
Specimens '
cf
(MPa)
x1
(mm)
x2
(mm)
y1
(mm)
y2
(mm)
a1
(mm)
a2
(mm) k1 k2
Category 1
S01-72-1
72
465 375 270 270 60 60 0.59 0.45
S01-72-2 585 255 270 270 60 60 0.74 0.45
S01-72-3 345 495 270 270 60 60 0.44 0.45
S01-72-4 225 615 270 270 60 60 0.29 0.45
Category 2
S02-70-1
70
405 435 330 210 60 60 0.52 0.55
S02-70-2 405 435 390 150 60 60 0.52 0.65
S02-70-3 405 435 210 330 60 60 0.52 0.35
S02-70-4 405 435 150 390 60 60 0.52 0.25
Category 3
S03-63-1
63
495 345 330 210 60 60 0.63 0.55
S03-63-2 585 255 390 150 60 60 0.74 0.65
S03-63-3 315 525 210 330 60 60 0.41 0.35
S03-63-4 225 615 150 390 60 60 0.29 0.25
Category 4
S04-82-1
82
315 525 330 210 60 60 0.41 0.55
S04-82-2 225 615 390 150 60 60 0.29 0.65
S04-82-3 495 345 210 330 60 60 0.63 0.35
S04-82-4 585 255 150 390 60 60 0.74 0.25
Gro
up
2
Category 5
S05-72-1 72 405 435 270 270 60 60 0.52 0.45
S05-80-2 80
382.5 427.5 255 255 90 90 0.53 0.43
S05-80-3 360 420 240 240 120 120 0.54 0.40
Category 6
S06-79-1
79
405 375 270 270 120 60 0.59 0.45
S06-79-2 405 255 270 270 240 60 0.74 0.45
S06-79-3 345 435 270 270 120 60 0.52 0.45
S06-79-4 225 435 270 270 240 60 0.52 0.45
S06-64-5 64
345 375 270 270 180 60 0.59 0.45
S06-64-6 285 315 270 270 240 60 0.59 0.45
Category 7
S07-91-1
91
405 435 270 210 60 120 0.52 0.45
S07-91-2 405 435 270 150 60 180 0.52 0.45
S07-91-3 405 435 210 270 60 120 0.52 0.35
S07-91-4 405 435 150 270 60 180 0.52 0.25
S07-64-5 64
405 435 210 210 60 180 0.52 0.35
S07-64-6 405 435 180 180 60 240 0.52 0.30
Gro
up
3
Category 8
S08-34-1
34
337.5 412.5 225 225 150 150 0.55 0.38
S08-34-2 315 405 210 210 180 180 0.56 0.35
S08-34-3 292.5 397.5 195 195 210 210 0.57 0.33
S08-34-4 270 390 170 170 240 240 0.58 0.28
Category 9
S09-66-1
66
900 N/A 600 600 N/A N/A N/A N/A
S09-66-2 337.5 412.5 225 225 150 150 0.55 0.38
S09-66-3 315 405 210 210 180 180 0.56 0.35
S09-66-4 292.5 397.5 195 195 210 210 0.57 0.33
Category 10
S10-66-1
66
600 N/A 600 600 N/A N/A N/A N/A
S10-66-2 337.5 112.5 225 225 150 150 0.88 0.38
S10-66-3 315 105 210 210 180 180 0.89 0.35
S10-66-4 292.5 97.5 195 195 210 210 0.91 0.33

Table 3 Comparison of predicted ultimate strengths by proposed equations, Eq. (2) and Eq.
(3) utilising experimental results
Specimens VExp VProposed Exp
Proposed
V
V VEq (2)
Eq (2)
Exp
V
V VEq (3)
Eq (3)
Exp
V
V
S01-72-1 352.8 157.7 0.45 110.9 0.31 155.0 0.44
S01-72-2 415.8 135.5 0.33 70.5 0.17 138.4 0.33
S01-72-3 422.4 166.6 0.39 160.0 0.38 180.8 0.43
S01-72-4 422.2 214.4 0.51 223.2 0.53 227.4 0.54
S02-70-1 347.7 193.1 0.56 187.5 0.54 198.9 0.57
S02-70-2 401.8 237.7 0.59 240.5 0.60 232.8 0.58
S02-70-3 267.9 121.3 0.45 77.8 0.29 127.5 0.48
S02-70-4 240.5 73.9 0.31 23.6 0.10 89.7 0.37
S03-63-1 303.1 189.0 0.62 146.7 0.48 168.5 0.56
S03-63-2 254.1 213.5 0.84 164.3 0.65 180.4 0.71
S03-63-3 189.7 139.4 0.73 111.0 0.59 137.1 0.72
S03-63-4 177.6 114.0 0.64 92.7 0.52 113.6 0.64
S04-82-1 454.2 234.3 0.52 240.6 0.53 246.7 0.54
S04-82-2 457.8 316.7 0.69 344.3 0.75 342.4 0.75
S04-82-3 232.3 111.2 0.48 49.3 0.21 128.0 0.55
S04-82-4 185.1 54.7 0.30 N/A* N/A
* 84.4 0.46
S05-72-1 309.1 172.1 0.56 134.3 0.43 167.0 0.54
S05-80-2 193.2 165.2 0.86 121.1 0.63 165.9 0.86
S05-80-3 112.8 152.2 1.35 103.7 0.92 155.0 1.37
S06-79-1 166.8 163.2 0.98 114.3 0.69 164.3 0.99
S06-79-2 122.6 140.1 1.14 72.5 0.59 147.6 1.20
S06-79-3 174.4 164.6 0.94 129.3 0.74 155.3 0.89
S06-79-4 122.8 138.6 1.13 129.3 1.05 155.3 1.27
S06-64-5 146.1 163.0 1.12 114.3 0.78 164.3 1.12
S06-64-6 138.2 162.7 1.18 114.3 0.83 164.3 1.19
S07-91-1 306.6 162.1 0.53 144.5 0.47 190.1 0.62
S07-91-2 157.9 163.6 1.04 144.5 0.91 190.1 1.20
S07-91-3 135.2 120.4 0.89 75.9 0.56 120.5 0.89
S07-91-4 111.8 78.0 0.70 23.4 0.21 84.3 0.75
S07-64-5 109.8 140.0 1.27 83.8 0.76 149.4 1.36
S07-64-6 81.4 116.8 1.44 53.6 0.66 128.5 1.58
S08-34-1 88.1 103.5 1.18 69.2 0.79 82.9 0.94
S08-34-2 87.0 93.8 1.08 56.5 0.65 75.9 0.87
S08-34-3 79.5 65.7 0.83 44.1 0.56 68.9 0.87
S08-34-4 72.4 69.8 0.96 25.3 0.35 58.1 0.80
S09-66-1 489.5 270.2 0.55 248.1 0.51 227.2 0.46
S09-66-2 125.6 130.2 1.04 82.0 0.65 128.6 1.02
S09-66-3 93.2 118.5 1.27 66.2 0.71 118.9 1.28
S09-66-4 78.9 80.9 1.02 50.7 0.64 109.2 1.38
S10-66-1 657.6 673.5 1.02 701.6 1.07 569.4 0.87
S10-66-2 583.1 260.1 0.45 164.0 0.28 256.7 0.44
S10-66-3 334.5 236.8 0.71 132.4 0.40 237.3 0.71
S10-66-4 174.4 214.2 1.23 101.3 0.58 218.0 1.25
Average 0.81 0.57 0.82
Standard Deviation 0.31 0.23 0.33 * The negative strength values which indicate zero-bearing capacity

Table 4 Comparison of predicted ultimate strengths by proposed equations, Eq. (2) and Eq.
(3) utilising Yang et al. (2006)’s experiment results
Specimens VExp Vproposed Exp
Proposed
V
V VEq (2)
Eq (2)
Exp
V
V VEq (3)
Eq (3)
Exp
V
V
H5NN 684.0 559.5 0.82 624.9 0.91 592.5 0.87
H5F1 466.3 342.6 0.73 341.5 0.73 302.4 0.65
H5F2 347.9 310.9 0.89 304.6 0.88 269.7 0.78
H5F3 288.6 276.5 0.96 264.8 0.92 235.3 0.82
H5T3 336.6 306.3 0.91 302.3 0.90 267.8 0.80
H5S3 235.7 260.1 1.10 243.9 1.03 220.1 0.93
H10NN 476.0 445.9 0.94 464.2 0.98 407.1 0.86
H10F1 224.8 225.2 1.00 182.1 0.81 192.7 0.86
H10F2 183.8 196.5 1.07 145.9 0.79 171.5 0.93
H10F3 144.1 167.9 1.16 109.6 0.76 149.8 1.04
H10T3 163.2 193.2 1.18 150.1 0.92 167.2 1.02
H10S3 129.5 155.9 1.20 88.5 0.68 141.8 1.09
UH5NN 823.0 641.4 0.78 722.1 0.88 781.8 0.95
UH5F1 514.5 382.4 0.74 381.1 0.74 366.7 0.71
UH5F2 419.4 346.3 0.83 338.5 0.81 325.6 0.78
UH5F3 339.1 307.4 0.91 293.1 0.86 283.5 0.84
UHFT3 394.9 338.0 0.86 333.0 0.84 320.7 0.81
UH5S3 331.2 290.6 0.88 270.7 0.82 266.5 0.80
UH7NN 744.0 591.4 0.79 648.9 0.87 655.3 0.88
UH7F3 263.6 249.0 0.94 211.7 0.80 230.5 0.87
UH10NN 573.0 518.9 0.91 541.5 0.95 529.5 0.92
UH10F1 245.0 259.9 1.06 206.8 0.84 243.9 1.00
UH10F2 198.5 227.3 1.15 164.9 0.83 218.4 1.10
UH10F3 155.0 194.7 1.26 122.9 0.79 192.4 1.24
UH10T3 185.0 221.5 1.20 168.4 0.91 210.0 1.14
UH10S3 140.0 181.8 1.30 98.8 0.71 184.4 1.32
UH15NN 418.0 420.3 1.01 384.8 0.92 411.6 0.98
UH15F3 94.8 145.1 1.53 15.9 0.17 161.0 1.70
L5NN 500.0 478.2 0.96 528.6 1.06 402.4 0.80
LFF3C 233.2 232.2 1.00 224.4 0.96 151.8 0.65
L10NN 375.0 373.5 1.00 387.6 1.03 282.4 0.75
L10F3C 117.1 129.4 1.11 90.6 0.77 87.4 0.75
Average 1.00 0.84 0.93
Standard Deviation 0.18 0.15 0.21