experimental assessment ofthe ductility ofextended … · experimental assessment ofthe ductility...
TRANSCRIPT

� Corresponding author. Tel.: +31-1
2783173.
E-mail address: [email protected]
0141-0296/$ - see front matter # 2004 Else
doi:10.1016/j.engstruct.2000.09.001
5-2784581; fax: +31-15-
ft.nl (F.S.K. Bijlaard).
vier Ltd. All rights reserved.
Engineering Structures 26 (2004) 1185–1206
www.elsevier.com/locate/engstructExperimental assessment of the ductility of extendedend plate connections
Ana M. Girao Coelho a, Frans S. K. Bijlaard b,�, Luıs Simoes da Silva c
a Department of Civil Engineering, Polytechnic Institute of Coimbra, Rua Pedro Nunes, 3030-199 Coimbra, Portugalb Faculty of Civil Engineering and Geosciences, Steel and Timber Structures, Delft University of Technology, PO Box 5048, 2600 GA Delft,
The Netherlandsc Department of Civil Engineering, University of Coimbra Polo II, Pinhal de Marrocos, 3030-290 Coimbra, Portugal
Received 19 January 2004; received in revised form 25 March 2004; accepted 25 March 2004
Abstract
An experimental investigation of eight statically loaded extended end plate moment connections was undertaken at the DelftUniversity of Technology to provide insight into the behaviour of this joint type up to collapse. The specimens were designed toconfine failure to the end plate and/or bolts without development of the full plastic moment capacity of the beam. The para-meters investigated were the end plate thickness and steel grade. The results show that an increase in end plate thickness results inan increase in the connection flexural strength and stiffness and a decrease in rotation capacity. Similar conclusions are drawn forthe effect of the end plate steel grade, though no major variations in the initial stiffness are observed. The failure modes involvedweld failure in two test specimens, nut stripping in four tests and bolt fracture in the remaining, always after significant yieldingof the end plate and bolt bending. Comparisons of the joint ductility and the corresponding equivalent T-stub for the end plateside are drawn.# 2004 Elsevier Ltd. All rights reserved.
Keywords: Ductility; End plate connections; Experimental testing; High-strength steel grade; Resistance; Rotation capacity; Steel connections;
Stiffness; T-stub model
1. Introduction
Structural joints exhibit a distinctively nonlinear
behaviour that results from a multitude of phenomena,
which include elastoplastic deformations, contact, slip
and separation of their elemental parts. The analysis of
such behaviour is complex. For simplicity, joints can
be divided into three characteristic zones, tension, com-
pression and shear, whose deformation contributes to
the overall joint response. The joint behavioural char-
acteristics can be represented by means of a moment–
rotation (M–U) curve that defines three main proper-
ties: resistance, stiffness and rotation capacity. Histori-
cally, moment resisting joints have been designed for
resistance and stiffness with little regard to rotational
capacity. Yet, the knowledge of the available rotationcapacity of structural joints is of utmost importance fordesigning partial strength joints in combination with aplastic global analysis or under seismic conditions.
The research work reported in this paper focuses onthe characterization of the properties of bolted beam-to-column joints with an extended end plate, similar tothat shown in Fig. 1(a). In this joint type, the mainsource of deformability is the tension zone that can beidealized by means of equivalent T-stubs [1,2], whichcorrespond to two T-shaped elements connectedthrough the flanges by means of one or more boltrows. This idealization is also adopted in moderndesign codes, as the Eurocode 3 [3]. Fig. 1(a) identifiesthe T-stub that accounts for the deformation of thecolumn flange and the end plate in bending. In thisparticular case, since the column flange is unstiffened,the T-stub on the column side is orientated at rightangles to the end plate T-stub [2].

Nomenclature
aw throat thickness of a fillet weldbb beam section widthbc column section widthbp end plate widthd bolt diameterd0 bolt hole clearancee edge distanceecomp distance from the compression bolt row to the bottom of the end plateeX distance from the upper tension bolt row to the top of the end plateE Young modulusEst strain hardening modulusFtr.Rd effective tension resistance of bolt row rF0 force acting at the T-stub webfu (static) ultimate or tensile stressfu.b tensile strength of a boltfy (static) yield stresshb beam section heighthc column section heightHc.low clearance of the column below the end plateHc.up clearance of the column above the end platehp end plate heighthr distance from bolt row r to the centre of compressionkeff,r effective stiffness coefficient relative to bolt row rkeq equivalent stiffness coefficientki,r stiffness coefficient representing component i relative to bolt row rki stiffness coefficient for joint component ik1 stiffness coefficient for the column web in sheark2 stiffness coefficient for the column web in transverse compressionLbeam length of the beamLcomp height of the end plate extension in the compression zone (below the beam compression flange)LDTi distance between LVDT i and the face of the end plateLload distance between the load application point and the face of the end plateLstiffened stiffened beam lengthLX height of the end plate extension in the tension zone (above the beam tension flange)M bending momentMmax maximum bending moment attained during the testMj.Rd joint flexural full plastic resistanceM/Cd
bending moment corresponding to the attainment of the rotation capacity
p pitch of the tension boltsp2–3 distance between the tension bolt row 2 and the compression bolt row 3r bolt row numberR correlation factorSj.ini joint initial rotational stiffnessSj.p-l joint post-limit rotational stiffnesst thicknesstfb beam flange thicknesstfc column flange thicknesstp end plate thicknessts thickness of a stiffenertwb beam web thicknessw gauge of the boltsz lever arm
1186 A.M. Girao Coelho et al. / Engineering Structures 26 (2004) 1185–1206

db bolt elongationdDTi displacement measured by LVDT DTiD axial deformationDF0:max
deformation value evaluated at the maximum value of the force acting at the T-stub webDF0:Rd
deformation value evaluated at the plastic resistance value of the force acting at the T-stub webDKR.inf deformation of the end plate at the lower bound of the knee-range of the component moment–rotation
curveDKR.sup rotation at the upper bound of the knee-range of the component moment–rotation curveest strain at the strain hardening pointeu ultimate straineuni uniform strain/ connection rotation/Cd rotation capacity/KR.inf rotation at the lower bound of the knee-range of the component force–deformation curve/KR.sup rotation at the upper bound of the knee-range of the component moment–rotation curve/max maximum rotation/MRd
maximum rotation corresponding to the joint plastic resistance
/Mmaxrotation value at maximum moment
U joint rotationc shear deformation of the column web panel zonehb beam rotationhb.el beam elastic rotationhc column rotationqy yield ratiowi component i ductility indexwi.inf ductility index evaluated at the lower bound of the knee-range of the component force–deformation
curvewi.sup ductility index evaluated at the upper bound of the knee-range of the component force–deformation
curvewj joint ductility indexwj.inf ductility index evaluated at the lower bound of the knee-range of the moment–rotation curvewj.sup ductility index evaluated at the upper bound of the knee-range of the moment–rotation curve0 index related to the equivalent T-stub
A.M. Girao Coelho et al. / Engineering Structures 26 (2004) 1185–1206 1187
The models for the column and the end plate sides
are different. The T-stub elements on the column flange
side are generally hot rolled profiles, whilst on the end
plate side such elements comprise two welded plates,
the end plate and the beam flange, and a further
additional stiffener that corresponds to the beam web(Fig. 1(b)). The first model has been extensively studiedover the past years and was the aim of several researchprogrammes that are reported in the literature [1,2,4–12].The current approach to account for the behaviour ofT-stubs made up of welded plates consists in a mereextrapolation of the existing rules for the otherassembly type. This assumption may be erroneous andlead to unsafe estimations of the characteristic proper-ties [13,14]. To deal with this problem, a research pro-ject was devised to increase the knowledge andunderstanding of end plate behaviour and contributetowards the improvement of its design. Simultaneously,the issue of available ductility was also addressed.
First, a series of thirty-two tests on isolated T-stubconnections made up of welded plates was conducted atthe Delft University of Technology. Their primary intentwas to provide insight into the actual behaviour of thistype of connection, failure modes and deformation
Fig. 1. Unstiffened bolted extended end plate connection. (a) T-stub
identification. (b) T-stub model for the end plate side.
1188 A.M. Girao Coelho et al. / Engineering Structures 26 (2004) 1185–1206
capacity. In addition, the role of the welding and thepresence of transverse stiffeners were tackled. Theresults of this test series are reported in [15].
As a follow up study, a second test series on fullscale bolted extended end plate single-sided beam-to-column connections was planned. The main objectivewas the analysis of the ultimate behaviour of the ten-sion zone of such a joint type and eventually the pro-posal of sound design rules for this elemental partwithin the framework of the component method [3,16].The description of this test programme and results isgiven below. Comparisons with the code predictions [3]are also drawn.
Concerning the evaluation of the rotation capacity ofend plate joints, there are several procedures reportedin the literature. Zoetemeijer [17] proposes some cri-teria and simple empirical expressions for the esti-mation of a joint deformation capacity based on aseries of experiments. Later, Jaspart [18] extended thesecriteria for inclusion in Eurocode 3 [3]. The code statesthat a bolted end plate joint may be assumed to havesufficient rotation capacity for plastic analysis, pro-vided that both of the following conditions are satis-fied: (i) the moment resistance of the joint is governedby the resistance of either the column flange in bendingor the end plate in bending and (ii) the thickness t ofeither the column flange or the end plate (not necessar-ily the same basic component as in (i)) satisfies:
t � 0:36d
ffiffiffiffiffiffiffifu:bfy
s: ð1Þ
where d is the bolt diameter, fu.b is the tensile strengthof the bolt and fy is the yield stress of the relevant basiccomponent.
More recently, several researchers have developedsimplified approaches based on the component methodto propose expressions to quantify the overall rotationcapacity. Since in many cases the most important sour-ces of deformability in bolted joints can be idealized bymeans of the equivalent T-stub in tension, specialattention has been devoted to this component.Swanson [19] developed a methodology for character-ization of the ductility of T-stub connections. Faellaand co-workers [10,11,20] set up a procedure forcomputation of the deformation capacity of the
isolated T-stub and the overall joint. Other compo-nents have also been studied within this framework.Kuhlmann and Kuhnemund [21] performed tests onthe component column web under transverse com-pression and proposed design rules for this componentfrom the point of view of resistance and deformationcapacity. These researchers also conducted a series offull-scale tests that are reported in [22]. The study wasrestricted to joints under balanced loading. The domi-nant component of all tests was the column web incompression. They also developed a procedure basedon the component method to determine the rotationcapacity of the joint.
Beg et al. [23] set up a methodology for characteriza-tion of the rotational response to include the evalu-ation of rotation capacity. They analysed differentcomponents, the column web, the bolts in tension, thecolumn flange and the end plate in bending, andproposed simple expressions for evaluation of thedeformation capacity based on numerical evidence.
This paper also deals with this specific issue andprovides explicit experimental evidence of the rotationcapacity of end plate beam-to-column joints.
2. Description of the experimental programme
2.1. Test details
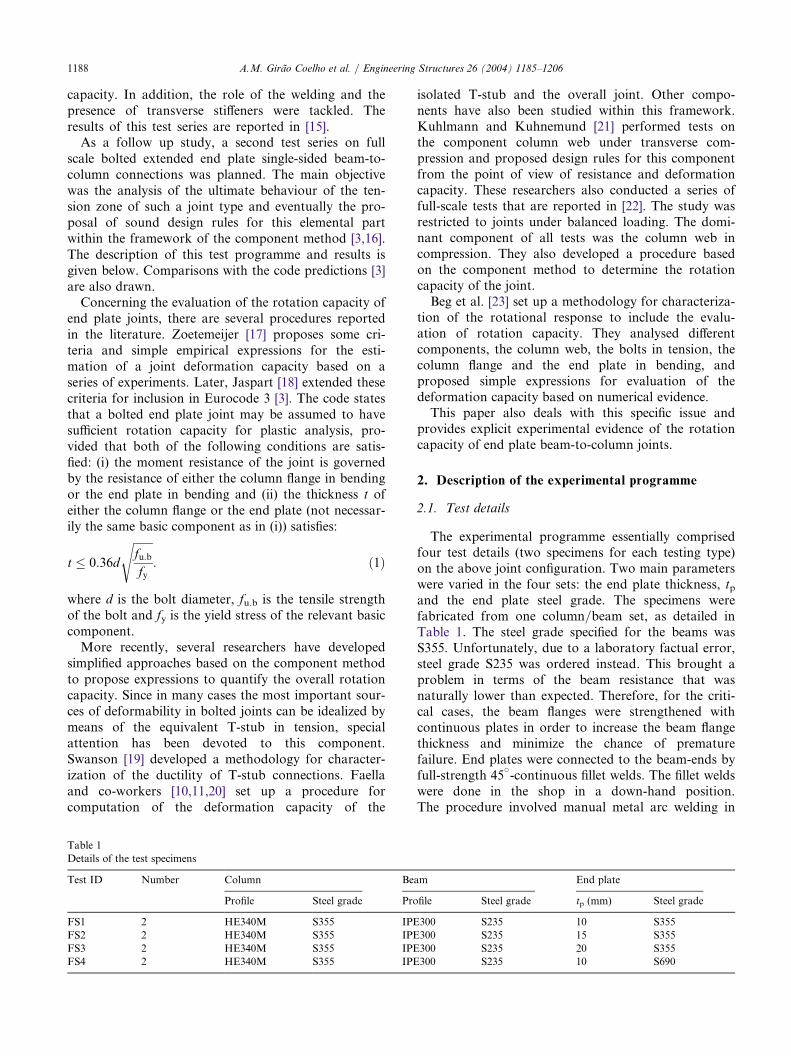
The experimental programme essentially comprisedfour test details (two specimens for each testing type)on the above joint configuration. Two main parameterswere varied in the four sets: the end plate thickness, tpand the end plate steel grade. The specimens werefabricated from one column/beam set, as detailed inTable 1. The steel grade specified for the beams wasS355. Unfortunately, due to a laboratory factual error,steel grade S235 was ordered instead. This brought aproblem in terms of the beam resistance that wasnaturally lower than expected. Therefore, for the criti-cal cases, the beam flanges were strengthened withcontinuous plates in order to increase the beam flangethickness and minimize the chance of prematurefailure. End plates were connected to the beam-ends byfull-strength 45
v-continuous fillet welds. The fillet welds
were done in the shop in a down-hand position.The procedure involved manual metal arc welding in
Table 1
Details of the test specimens
Test ID N
umber C olumn Beam End plateProfile S
teel grade Profile S teel grade tp (mm) S teel gradeFS1 2
H E340M S 355 IPE300 S 235 10 S 355FS2 2
H E340M S 355 IPE300 S 235 15 S 355FS3 2
H E340M S 355 IPE300 S 235 20 S 355FS4 2
H E340M S 355 IPE300 S 235 10 S 690
A.M. Girao Coelho et al. / Engineering Structures 26 (2004) 1185–1206 1189
which consumable electrodes were used. Basic, soft,
low hydrogen electrodes have been used in the process.
Hand tightened full-threaded M20 grade 8.8 bolts in 22
mm drilled holes were employed in all sets. Two differ-
ent batches of bolts were employed. The first batch of
bolts were employed in tests FS1a-b, FS2a-b and FS3a
in both tension and compression zones; the second
batch of bolts were used to fasten the end plate and the
beam in the tension zone in the remaining tests.The geometry of the specimens is depicted in Figs. 2,
3. The column had a section profile HE340M that was
chosen so that it behaves almost as a rigid element. In
addition, for the available column, the clearance above
and below the end plate was less than 400 mm. How-
ever, since this is a rigid column, this limitation proved
not to be severe. Regarding the joint geometry, the top
bolt row corresponds to specimen WT7_M20 (refer to
[15]) from the former test series on isolated T-stubs.
This specimen comprised two plates of 10.0 mm thick-
ness that were welded together by means of a continu-
ous 45v-fillet weld with similar plate characteristics.
Two snug-tightened M20 grade 8.8 bolts fastened the
T-stub elements. All end plate specimens were designed
complying with the Eurocode 3 requirements [3] so that
the components end plate and bolts in the tension zone
were the determining factor of collapse.
2.2. Geometrical properties
The actual geometry of the various connection ele-ments was recorded before starting the test. For thevarious specimens the profiles and plates actual dimen-sions and connection geometry are summarized inTable 2. These values are given as an average value ofthe several measurements from each series. Table 3indicates the bolts measurements for each test.
Fig. 2. Geometry of the specimens (dimensions in [mm]).
Fig. 3. Details of the specimens (dimensions in [mm]). (a) Detail of
the end plate. (b) Detail of the stiffener.

1190 A.M. Girao Coelho et al. / Engineering Structures 26 (2004) 1185–1206
2.3. Mechanical properties
2.3.1. Tension tests of the structural steelThe test programme included two different steel
grades for the end plate: S355 and S690. According to
the European Standards EN 10025 [24] and EN 10204
[25], the steel qualities are S355J0 (ordinary steel) and
N-A-XTRA M70 (high-strength steel for plates),
respectively. For the beam profile, steel grade S235JR
was ordered. Table 4 summarizes the chemical compo-
sition for the different steel grades.The coupon tension testing of the structural steel
material was performed according to the RILEM pro-
cedures [26]. The average characteristics are set out in
Table 2
Actual geometry of the connection (dimensions in [mm])
Test ID C
olumn profile Beam profilehc b
c tf c H c.up H c.low h b b b tfb t wb Lbeam L loadFS1 3
76.00 3 07.50 4 0.21 1 75.00 2 19.00 3 00.45 1 50.50 10.76 7 .20 1200.00 1 002.50FS2 3
76.00 3 07.50 4 0.21 1 74.50 2 19.50 3 01.40 1 49.60 10.67 7 .01 1200.38 1 000.25FS3 3
76.00 3 07.50 4 0.21 1 77.50 2 6.50 3 01.46 1 49.75 10.57 7 .03 1191.50 9 92.63FS4 3
76.00 3 07.50 4 0.21 1 74.50 2 19.50 3 00.66 1 49.54 11.86 7 .03 1218.75 9 91.88Test ID S
tif. End plate and connection geometryts h
p b p t p e w e X LX p p2–3 e compFS1 1
0.76 4 01.04 1 49.84 1 0.40 3 0.01 8 9.91 2 9.90 69.35 9 0.03 205.90 7 6.45FS2 1
0.50 4 00.84 1 49.41 1 5.01 2 9.76 8 9.89 3 0.10 69.30 8 9.98 205.04 7 5.44FS3 1
0.46 4 01.40 1 50.47 2 0.02 3 0.27 8 9.93 2 9.74 68.90 9 0.14 204.84 7 6.82FS4 1
0.42 4 01.69 1 49.76 1 0.06 2 9.94 8 9.88 2 9.83 69.86 8 9.95 205.28 7 6.13Table 3
Bolt hole clearance and length (dimensions in [mm])
Test ID
# 1 #2 # 3 # 4 # 5 # 6FS1a B
olt lengthd0 2
1.93 21.98 21.98 21.75 2 1.98 2 1.93Initial 9
4.00 94.00 94.10 94.25 9 3.00 9 2.90Hand-tightening 9
4.00 94.00 94.10 94.25 9 3.10 9 3.00After collapse 9
4.65 94.40 94.50 94.90 9 3.00 9 3.10FS1b B
olt lengthd0 2
2.05 22.00 22.03 22.05 2 2.10 2 1.90Initial 9
4.00 94.25 94.40 94.05 9 3.15 9 3.20Hand-tightening 9
4.00 94.25 94.40 94.05 9 3.15 9 3.20After collapse 9
4.95 96.00 95.40 94.85 9 3.00 9 3.15FS2a B
olt lengthd0 2
1.93 22.08 22.00 22.08 2 2.03 2 2.03Initial 9
4.00 93.90 94.20 93.85 9 2.90 9 2.90Hand-tightening 9
4.02 93.94 94.20 93.85 9 2.94 9 2.96After collapse 9
5.70 96.18 1 02.06 96.62 9 3.24 9 3.78FS2b B
olt lengthd0 2
2.00 21.93 22.00 21.98 2 2.00 2 1.95Initial 9
3.90 94.30 93.90 94.12 9 2.86 9 2.78Hand-tightening 9
3.90 94.40 93.90 94.12 9 2.94 9 2.90After collapse 9
5.16 97.02 1 01.30 96.52 9 3.28 9 3.04FS3a B
olt lengthd0 2
2.95 22.88 22.95 22.98 2 3.03 2 2.93Initial 9
4.04 94.00 93.74 94.10 9 3.16 6 2.90Hand-tightening 9
4.10 94.00 93.80 94.16 9 3.16 9 2.90After collapse 9
5.56 95.10 96.04 96.12 9 3.48 9 3.44FS3b B
olt lengthd0 2
2.05 21.90 22.00 22.03 2 1.95 2 2.03Initial 9
2.54 92.52 92.56 92.50 9 2.78 9 3.14Hand-tightening 9
2.54 92.52 92.56 92.50 9 3.00 9 3.14After collapse 9
5.30 95.00 95.25 99.22 9 3.24 9 3.24FS4a B
olt lengthd0 2
2.08 22.00 22.05 21.93 2 2.00 2 2.05Initial 9
2.46 92.45 92.54 92.52 9 2.70 9 2.68Hand-tightening 9
2.50 92.48 92.56 92.54 9 2.74 9 2.70After collapse 9
4.40 93.94 99.62 1 02.62 9 3.06 9 3.10FS4b B
olt lengthd0 2
2.03 22.08 21.98 22.00 2 1.98 2 2.03Initial 9
2.40 92.38 92.32 92.38 9 3.04 9 3.06Hand-tightening 9
2.42 92.40 92.34 92.42 9 3.06 9 3.08After collapse 9
4.16 94.82 1 00.94 1 00.26 9 3.26 9 3.38
A.M. Girao Coelho et al. / Engineering Structures 26 (2004) 1185–1206 1191
Table 5. In this table the values for the Young modu-lus, E, the strain hardening modulus, Est, the staticyield and tensile stresses, fy and fu, the yield ratio,qy ¼ fy=fu, the strain at the strain hardening point, est,the uniform strain, euni, and the ultimate strain, eu aregiven. The stress values indicated in the table corre-spond to the static stresses, which are the stress valuesobtained at zero strain rate, i.e. during a hold on of thedeformation driven experiment. It has been observedthat the static stresses were reached after a hold on ofcirca 1 min. The total hold on lasted for 3 min. Theyield ratio gives an idea on the material ductility.Gioncu and Mazzolani suggest that a good ductility isensured if 0:5 � qy � ¼ 0:7 [27]. High strength steel
grades with qy > 0:9 show a rather poor structural duc-
tility [27]. That is the case of the steel grade S690(Table 5). In the authors’ opinion, these values arerather conservative. Eurocode 3 [3] indicates that agood material ductility is guaranteed if qy > 0:83
(recommended value for steel grades up to S460). Theassurance of a good material ductility does not neces-sarily imply that the whole structure is ductile. Thestructural ductility depends on the yield ratio butespecially on the structural discontinuities, such aswelds, bolt holes, etc.
2.3.2. Tension tests on the boltsTwo different batches of bolts were used in the
experiments. Having performed tests from series FS1,FS2 and test FS3a, it was decided to use a differentbatch of bolts, from another manufacturer as explainedlater in the text. Three machined bolts from each groupwere tested in tension in order to determine the mech-anical properties of the bolt material, in accordancewith ISO 898-1999(E) [28]. The average properties areset out in Table 6.
2.4. Test arrangement and instrumentation
The main features of the test apparatus are illu-strated in Fig. 4(a, b). With reference to the T arrange-ment depicted in Figs. 2, 3, the actual connection wasrotated 180
vfor practical reasons. The column was
bolted to a reaction wall. The reader should bear inmind that the goal of these tests was the study of theend plate in the tension zone and therefore it had to beensured that the column was not governing any failuremode.
The load was applied by a 400 kN testing machine(hydraulic jack with maximum piston stroke of �200mm), through a purpose-built device (Fig. 4(c)) that wasclamped to the beam at 200 mm from the free end. Inorder to prevent lateral torsional buckling of the beamwith the course of loading, a beam guidance device nearthe loading point had to be provided. For that purpose,a special device located at 250 mm from the load pointwas attached to the specimens (Fig. 4(a, b)).
The length of the beam was chosen to ensure a realisticstress pattern developed at the connection, on one hand,and that fracture of the several specimens, i.e. ultimateload, was attained with the specific testing machine.
The instrumentation plan is described in Figs. 5–7below. The primary requirements of the instrumen-tation were the measurement of the applied load, therelevant displacements of the connection (e.g. verticaldisplacement of the beam, horizontal displacement of
Table 4
Chemical composition of the structural steels according to the European standards
% maximum C
Mn S i P S N C EVS235JR 0
.17 1.40 – 0.045 0 .045 0.012 0 .35S355J0 0
.20 1.60 0 .55 0.040 0 .045 0.009 0 .40N-A-XTRA M70 0
.20 1.60 0 .80 0.020 0 .010 – 0 .48Table 5
Average characteristic values for the structural steels
Specimen
Steel grade E (MPa) Est (MPa) f y (MPa) f u (MPa) q y e st e uni e uEnd plate tp
¼ 10 S355 2 09856 2264 3 40.12 4 80.49 0 .708 0 .015 0 .224 0 .361tp ¼ 15
S355 2 08538 2901 3 42.82 5 07.85 0 .675 0 .020 0 .198 0 .475tp ¼ 20
S355 2 08622 2771 3 42.62 5 02.59 0 .682 0 .017 0 .196 0 .457tp ¼ 10
S690 2 04462 2495 6 98.55 7 41.28 0 .940 0 .014 0 .075 0 .174Beam W
eb S235 2 08332 1856 2 99.12 4 46.25 0 .670 0 .016 0 .235 0 .464Flange
S235 2 09496 1933 3 16.24 4 62.28 0 .684 0 .016 0 .235 0 .299Table 6
Average characteristic values for the bolts
Batch E
(MPa) f y (MPa) fu (MPa) e u1 2
23166 8 57.33 9 13.78 0 .2722 2
22982 8 54.31 9 16.81 0 .231
1192 A.M. Girao Coelho et al. / Engineering Structures 26 (2004) 1185–1206
the assembly end plate–tensile beam flange) and boltelongation. The displacements were measured by meansof Linear Variable Displacement Transducers (LVDTs),located as indicated in Fig. 5. The bolts deformationswere measured with special measuring brackets, MBs(horseshoe device). These devices were only attached tothe bolts on the tension side and were removed beforecollapse to prevent damage to these devices due to boltfailure. Finally, strain gauges, SGs, TML (maximumstrain 21000 lm/m) were added to the end plate (backside) in the tension zone to provide insight into thestrain distribution in this zone (Fig. 7(a)). In addition,the specimens were provided with strain gauges at thetop of the tension beam flange (Fig. 7(b)).
For good comparison of results, all specimens usedthe same arrangement for the location of the straingauges and measuring devices.
2.5. Testing procedure
Before installation of the specimens into the testingrig, the dimensions of the plates were recorded and thebolts were hand-tightened and measured. The speci-mens were then placed into the machine and aligned.The bolts were fastened by using an ordinary spanner(45
vturn) and measured.
In order to sketch the yield line patterns the speci-
mens were painted with chalk. The measurement devi-
ces and strain gauges were then connected. Electronic
records started and all the equipment was verified.The specimens were subjected to monotonic tensile
force, which was applied to the beam as explained
before. The tests were carried out under displacement
control with a constant speed of 0.02 mm/s up to
collapse of the specimens. The test itself then started
with loading of the specimen up to 2/3Mj.Rd, which
corresponds to the theoretical elastic limit. Mj.Rd is the
full plastic moment resistance of the joint and is
determined according to Eurocode 3 [3]. Complete
unloading followed on and the specimen was then
reloaded up to collapse. In this third phase, the test
was interrupted at the load levels corresponding to
2/3Mj.Rd, Mj.Rd, at the knee-range (KR) and after this
level each 6 min, equivalent to an actuator displace-
ment of 7.2 mm. The knee-range of the M–U curve
corresponds to the transition from the stiff to the soft
part. The hold on of the test lasted for 3 min and
intended to record the quasi-static forces.Four collapse failure modes or a combination of
those were observed in the test: (i) weld cracking, (ii)
plate cracking, (iii) bolt fracture and (iv) bolt nut strip-
uipment and test specimen. (a) Test apparatus (illustration with specimen FS2a). (b) Detail of the beam and conne
Fig. 4. Eq ction zone(illustration with specimen FS1a). (c) Detail of the load application device.
A.M. Girao Coelho et al. / Engineering Structures 26 (2004) 1185–1206 1193
ping (see Table 7). After collapse, the bolts were mea-
sured again.
3. Test results
3.1. Generality
The results presented in the following sections relate
to the third phase of the tests, after elimination of slip-
pery and after settlement of the connecting parts. Theplotted graphs refer to the applied load, displacementand strain direct readings and to the correspondingbending moment and deformations.
The bending moment, M, acting on the connectioncorresponds to the applied load, ‘‘Load’’ multiplied bythe distance between the load application point and theface of the end plate, Lload:
M ¼ Load � Lload: ð2ÞThe rotational deformation of the joint, U, is the
sum of the shear deformation of the column web panelzone, c and the connection rotational deformation, /[18]. Connection rotation is defined as the change inangle between the centrelines of beam and column, hb
and hc, respectively [18]:
/ ¼ hb � hc: ð3ÞIn these tests, the column hardly deforms as it
behaves as a rigid element. This statement will be vali-dated later in the text. Then, both c and hc are noughtand so,
U ¼ / ¼ hb: ð4Þ
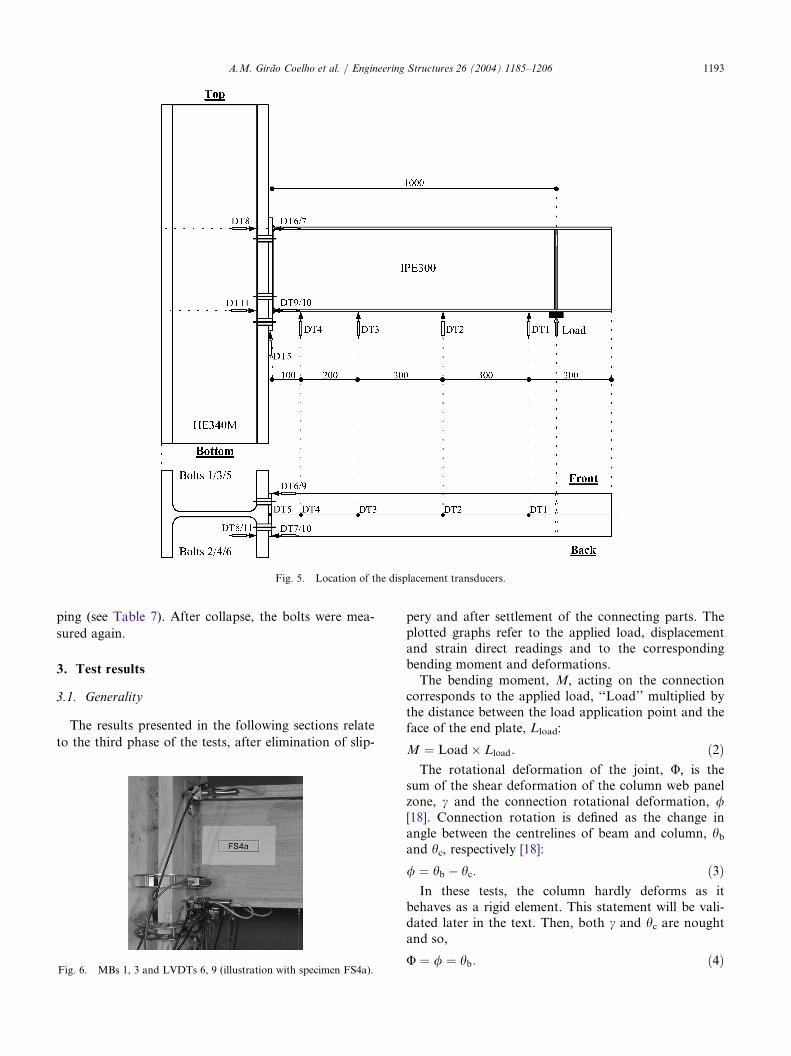
Fig. 5. Location of the displacement transducers.
, 3 and LVDTs 6, 9 (illustration with sp
Fig. 6. MBs 1 ecimen FS4a).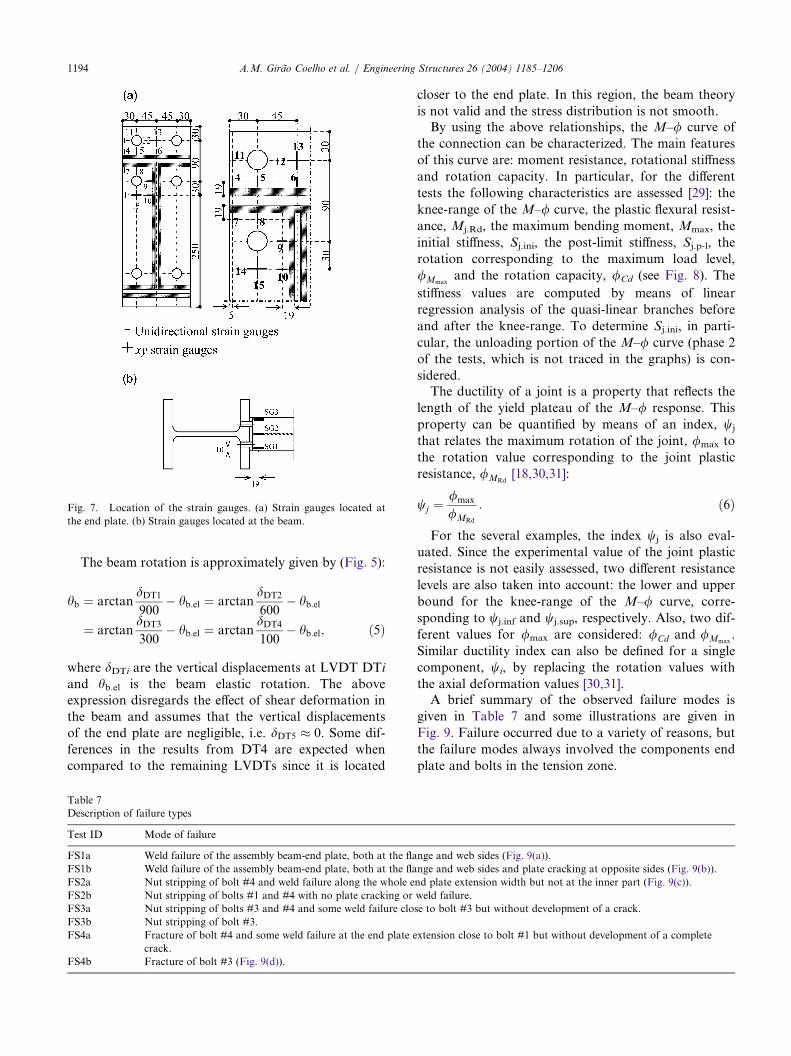
1194 A.M. Girao Coelho et al. / Engineering Structures 26 (2004) 1185–1206
The beam rotation is approximately given by (Fig. 5):
hb ¼ arctandDT1
900� hb:el ¼ arctan
dDT2
600� hb:el
¼ arctandDT3
300� hb:el ¼ arctan
dDT4
100� hb:el; ð5Þ
where dDTi are the vertical displacements at LVDT DTiand hb.el is the beam elastic rotation. The aboveexpression disregards the effect of shear deformation inthe beam and assumes that the vertical displacementsof the end plate are negligible, i.e. dDT5 0. Some dif-ferences in the results from DT4 are expected whencompared to the remaining LVDTs since it is located
closer to the end plate. In this region, the beam theory
is not valid and the stress distribution is not smooth.By using the above relationships, the M–/ curve of
the connection can be characterized. The main features
of this curve are: moment resistance, rotational stiffness
and rotation capacity. In particular, for the different
tests the following characteristics are assessed [29]: the
knee-range of the M–/ curve, the plastic flexural resist-
ance, Mj.Rd, the maximum bending moment, Mmax, the
initial stiffness, Sj.ini, the post-limit stiffness, Sj.p-l, the
rotation corresponding to the maximum load level,
/Mmaxand the rotation capacity, /Cd (see Fig. 8). The
stiffness values are computed by means of linear
regression analysis of the quasi-linear branches before
and after the knee-range. To determine Sj.ini, in parti-
cular, the unloading portion of the M–/ curve (phase 2
of the tests, which is not traced in the graphs) is con-
sidered.The ductility of a joint is a property that reflects the
length of the yield plateau of the M–/ response. This
property can be quantified by means of an index, wj
that relates the maximum rotation of the joint, /max to
the rotation value corresponding to the joint plastic
resistance, /MRd[18,30,31]:
wj ¼/max
/MRd
: ð6Þ
For the several examples, the index wj is also eval-
uated. Since the experimental value of the joint plastic
resistance is not easily assessed, two different resistance
levels are also taken into account: the lower and upper
bound for the knee-range of the M–/ curve, corre-
sponding to wj.inf and wj.sup, respectively. Also, two dif-
ferent values for /max are considered: /Cd and /Mmax.
Similar ductility index can also be defined for a single
component, wi, by replacing the rotation values with
the axial deformation values [30,31].A brief summary of the observed failure modes is
given in Table 7 and some illustrations are given in
Fig. 9. Failure occurred due to a variety of reasons, but
the failure modes always involved the components end
plate and bolts in the tension zone.
cation of the strain gauges. (a) Strain gauges
Fig. 7. Lo located atthe end plate. (b) Strain gauges located at the beam.
Table 7
Description of failure types
Test ID M
ode of failureFS1a W
eld failure of the assembly beam-end plate, both at the flange and web sides (Fig. 9(a)).FS1b W
eld failure of the assembly beam-end plate, both at the flange and web sides and plate cracking at opposite sides (Fig. 9(b)).FS2a N
ut stripping of bolt #4 and weld failure along the whole end plate extension width but not at the inner part (Fig. 9(c)).FS2b N
ut stripping of bolts #1 and #4 with no plate cracking or weld failure.FS3a N
ut stripping of bolts #3 and #4 and some weld failure close to bolt #3 but without development of a crack.FS3b N
ut stripping of bolt #3.FS4a F
racture of bolt #4 and some weld failure at the end plate extension close to bolt #1 but without development of a completecrack.
FS4b F
racture of bolt #3 (Fig. 9(d)).
A.M. Girao Coelho et al. / Engineering Structures 26 (2004) 1185–1206 1195
3.2. Moment–rotation curves
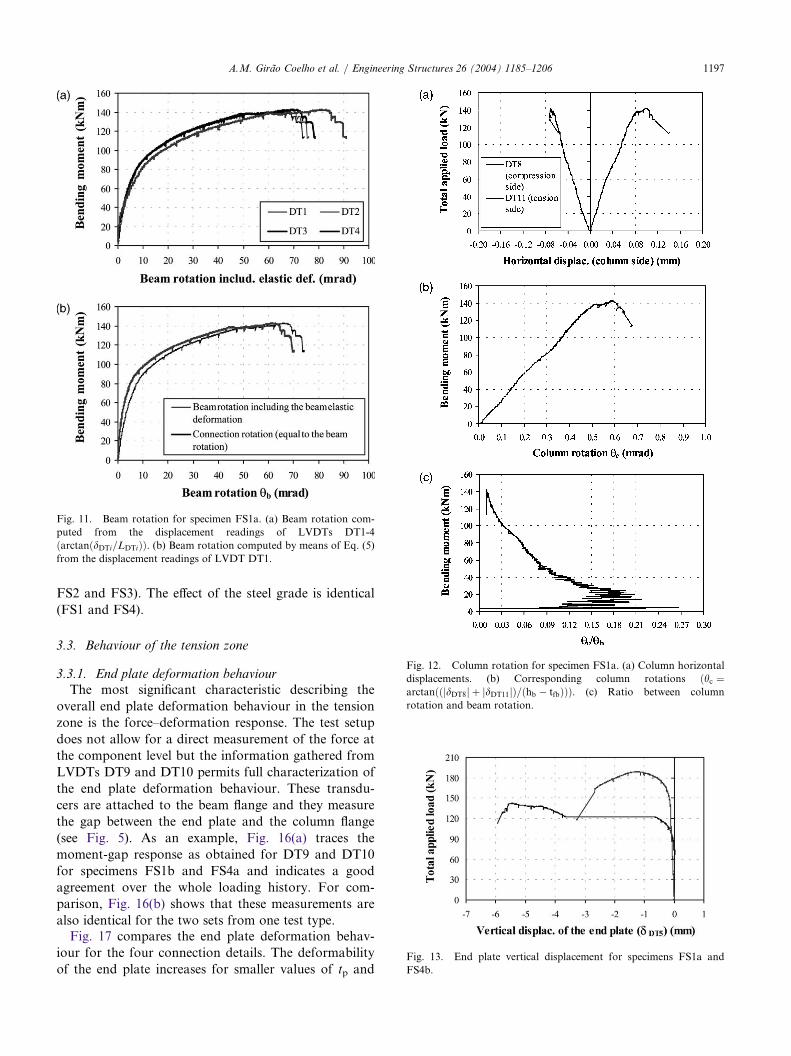
As explained above, the M–/ curves for the severalconnections are obtained from the beam vertical dis-
placement readings and the applied load. For illus-
tration, Fig. 10 plots the load vs. vertical displacementof the beam for specimen FS1a. This curve can be con-
verted into moment–‘‘gross beam rotation’’ curve
through application of Eqs. (2) and (5) excluding hel, asshown in Fig. 11(a) for the four LVDTs DT1-4. Exam-
ination of these four curves indicates a good agreement
of the results obtained for DT1-3 and some deviation
for DT4. These differences have already been explainedearlier in the text. Therefore, the results from DT1 arekept for further analysis. If now the beam elastic defor-mation is subtracted from the ‘‘gross rotation’’(Eq. (5)), the connection rotation can be completelycharacterized (Fig. 11(b)). This value is taken as equalto the beam rotation as the column rotation, hc, can bedisregarded in comparison with hb (see Fig. 12) andalso because the end plate vertical deformation due tobolt hole elongation can be neglected when comparedto dDT1 (see Fig. 13). Note that for specimen FS1a theslippery at circa 110 kN has to be disregarded.
The M–/ responses for the eight connection detailsare reported in Fig. 14. Almost identical responses areobtained for each set over the entire elastoplasticrange. This proves that the test procedure and theinstrumentation setup adopted for the programme wassatisfactory. The main features of the eight curves aresummarized in Table 8. All characteristic values arereferred to the readings from LVDT DT1. In all cases,the knee-range domain of the curves is alike for thesame connection detail. The maximum resistance isalso similar, though in series FS1 and FS3 some differ-ences are observed. In series FS1, experimental obser-vations show that the welding quality in set FS1a ispoor, i.e. the welding procedure resulted in a glue weldinstead of a burnt-in weld. This induced premature
Fig. 8. Moment–rotation characteristics from tests.
Fig. 9. Illustration of the various failure types observed in the experiments. (a) Specimen FS1a: weld failure. (b) Specimen FS1b. (i) General
view. (ii) Detail of the weld failure at the front side. (iii) Detail of the end plate cracking (extension) at the back side. (iv) Elongation of the bolt
holes in the tension zone. (v) Detail of bolts #2 and #4 (back side) after failure (notice the bending of bolt #2). (c) Specimen FS2a. (i) General
view of the end plate. (ii) Nut stripping of bolt #4 (column side). (iii) Detail of the weld fracture in the tension zone. (iv) Detail of tension bolts
(bolt #3 nearly fractures). (d) Specimen FS4b. (i) Bolt #3. (ii) Bolt #4.

1196 A.M. Girao Coelho et al. / Engineering Structures 26 (2004) 1185–1206
cracking of the specimen. Regarding series FS3, the
discrepancies arise because different bolts are employed
in the two sets and also because there was a disturb-
ance in test FS3a at a load level of 190 kN that may
have had some effect over the final results. In terms of
rotational stiffness, some differences arise, particularly
for Sj.ini in the case of series FS1 and Sj.p-l for series
FS3. Identical values of the ratio Sj:ini=Sj:p-l areobtained for the four test types. Exception is made forjoint FS3a, which shows some disturbance in the post-limit regime, and therefore the out coming results arenot reliable in this domain.
Now, in terms of maximum rotation, the values atMmax are close for each set (again, the results for FS3ashould not be relied upon in the post-limit domain),particularly for specimen FS2. Higher deviationsappear for /Cd, especially for series FS1 and FS2. Thedifferences that are observed in series FS1 have alreadybeen explained above. For series FS2 and FS3, /Cd isnot well defined since it corresponds to the beginningof final unloading of the test. No actual rupture wasobserved in this case. The test was stopped because thedeformations were already too high and there was fearof damaging the equipment if the test went on further.
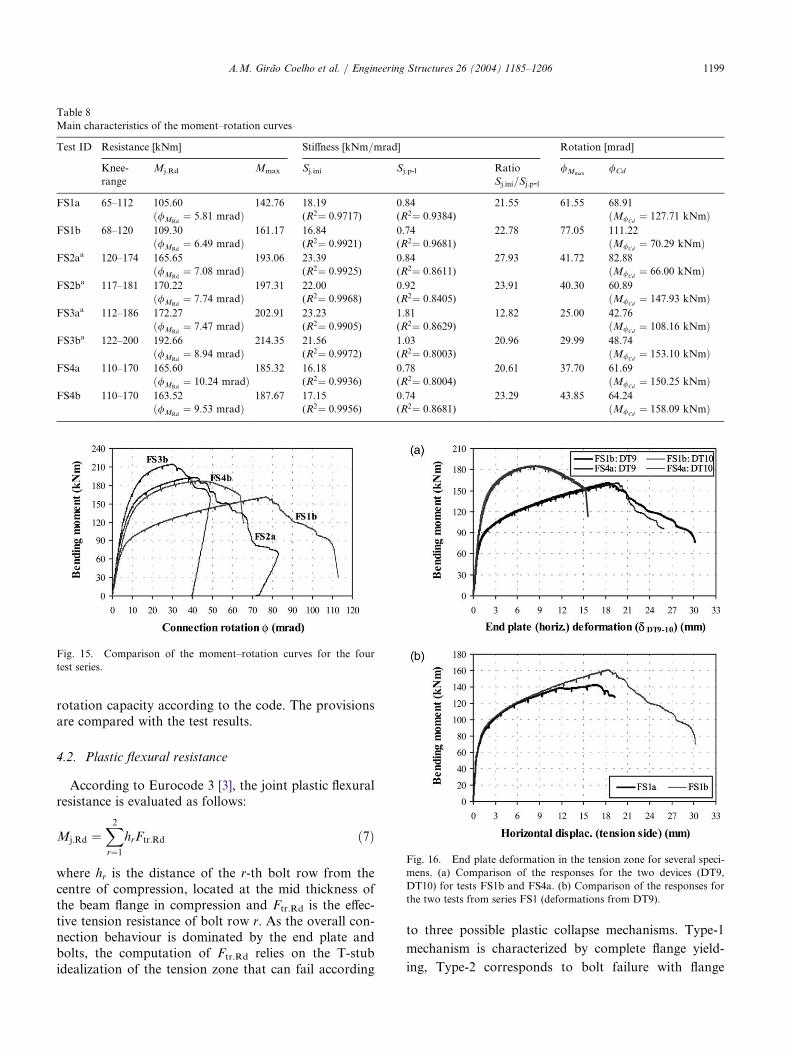
One connection from each set is now chosen for thepurpose of a comparative study. In all cases, theassembly end plate-bolts is the main source of connec-tion deformability. Fig. 15 compares the rotationalbehaviour of the four test types and shows an increasein resistance and rotational stiffness and a loss ofrotation capacity with the end plate thickness (FS1,
Fig. 10. Beam vertical displacement readings of LVDTs DT1-4 for
specimen FS1a.
Fig. 9 (continued )
A.M. Girao Coelho et al. / Engineering Structures 26 (2004) 1185–1206 1197
FS2 and FS3). The effect of the steel grade is identical
(FS1 and FS4).
3.3. Behaviour of the tension zone
3.3.1. End plate deformation behaviourThe most significant characteristic describing the
overall end plate deformation behaviour in the tension
zone is the force–deformation response. The test setup
does not allow for a direct measurement of the force at
the component level but the information gathered from
LVDTs DT9 and DT10 permits full characterization of
the end plate deformation behaviour. These transdu-
cers are attached to the beam flange and they measure
the gap between the end plate and the column flange
(see Fig. 5). As an example, Fig. 16(a) traces the
moment-gap response as obtained for DT9 and DT10
for specimens FS1b and FS4a and indicates a good
agreement over the whole loading history. For com-
parison, Fig. 16(b) shows that these measurements are
also identical for the two sets from one test type.Fig. 17 compares the end plate deformation behav-
iour for the four connection details. The deformability
of the end plate increases for smaller values of tp and
Fig. 11. Beam rotation for specimen FS1a. (a) Beam rotation com-
puted from the displacement readings of LVDTs DT1-4
ðarctanðdDTi=LDTiÞÞ. (b) Beam rotation computed by means of Eq. (5)
from the displacement readings of LVDT DT1.
Fig. 12. Column rotation for specimen FS1a. (a) Column horizontal
displacements. (b) Corresponding column rotations ðhc ¼arctanðð dDT8j j þ dDT11j jÞ=ðhb � tfbÞÞÞ. (c) Ratio between column
rotation and beam rotation.
13. End plate vertical displacement for specimens FS1a a
Fig. ndFS4b.

1198 A.M. Girao Coelho et al. / Engineering Structures 26 (2004) 1185–1206
lower steel grades. This behaviour is identical to the
connection rotation, as expected, since the components
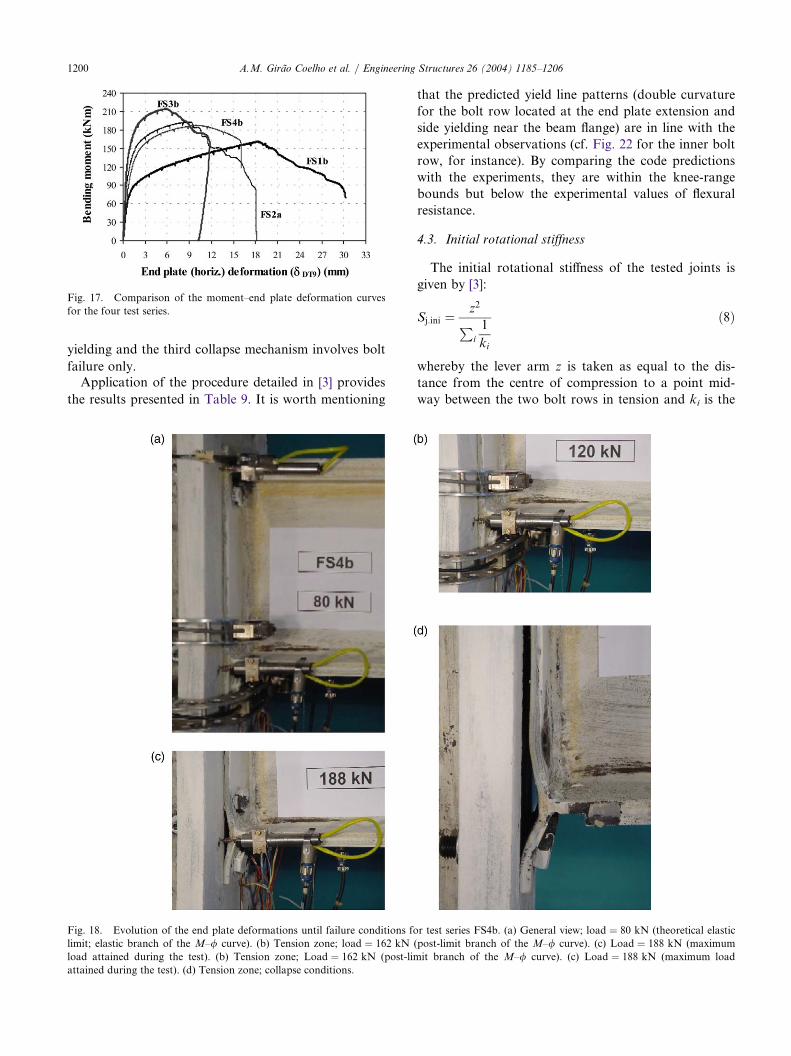
end plate and bolts are the main sources of connection
deformability. Fig. 18 illustrates the evolution of the
end plate deformation response with the applied loadfor the specific case of FS4b and Figs. 18(d) and 19compare the collapse conditions for the four test types.
A comparative analysis of the influence of the endplate deformability over the connection rotationalbehaviour is plotted in the graph of Fig. 20. For seriesFS2, FS3 and FS4 where the bolts mainly determinefailure, either by fracture or by stripping, the shape ofthe curves is identical. In series FS1 where end platecracking and weld fracture are engaged in the collapsemode, the shape of the curve is slightly different. Evenso, these curves clearly demonstrate that the ratiobetween end plate deformation behaviour is higher forlower end plate thickness values and lower steel grades.
Finally, Fig. 21 shows an alternative procedure forcomputation of the connection deformation from thereadings of the horizontal LVDTs, in the compressionand tension zone of the end plate (e.g. specimen FS1a).As expected, the agreement between both procedures isexcellent.
3.3.2. Yield line patternsFig. 22 depicts the yield line patterns of the inner
tension bolt #3 for specimens FS1b and FS2b at col-lapse conditions. These patterns could be sketched withthe painting of the specimens with chalk. Clearly, forseries FS1 the yielding of the end plate in this areaspreads to the compression bolt, whilst for FS2, with athicker plate, there is a small amount of plasticity inthe end plate.
3.3.3. Bolt elongation behaviourThe experimental results demonstrate that the two
rows of tension bolts carry unequal forces (Fig. 23): theinner tension bolts carry a larger proportion of theload than the outer bolts. This conclusion is also sup-ported by the graphs shown in Fig. 24 that comparesthe ratio between the bolt elongation, db and the gapend plate–column flange. This ratio increases for theinner tension bolts. The graphs also highlight the influ-ence of the bolt tension deformation on the overallbehaviour with the increase of tp and steel grade. Thisconclusion is in line with the above observations.
4. Discussion of test results
4.1. Introduction
Eurocode 3 [3] gives quantitative rules for the predic-tion of the joint flexural plastic resistance and initialrotational stiffness. These structural properties are eval-uated below by using the actual geometrical character-istics from Table 2 and the mechanical properties fromTables 5 and 6. Also, the recommendations on rotationcapacity are verified to investigate if there is enough
Fig. 14. Moment–rotation curves for the four test series. (a) Series
FS1. (b) Series FS2. (c) Series FS3. (d) Series FS4.
A.M. Girao Coelho et al. / Engineering Structures 26 (2004) 1185–1206 1199
rotation capacity according to the code. The provisionsare compared with the test results.
4.2. Plastic flexural resistance
According to Eurocode 3 [3], the joint plastic flexuralresistance is evaluated as follows:
Mj:Rd ¼X2
r¼1
hrFtr:Rd ð7Þ
where hr is the distance of the r-th bolt row from thecentre of compression, located at the mid thickness ofthe beam flange in compression and Ftr.Rd is the effec-tive tension resistance of bolt row r. As the overall con-nection behaviour is dominated by the end plate andbolts, the computation of Ftr.Rd relies on the T-stubidealization of the tension zone that can fail according
to three possible plastic collapse mechanisms. Type-1
mechanism is characterized by complete flange yield-
ing, Type-2 corresponds to bolt failure with flange
Table 8
Main characteristics of the moment–rotation curves
Test ID R
esistance [kNm] Stiffness [kNm/mrad] Rotation [mrad]K
nee-range
Mj.Rd M
max Sj.ini S j.p-l R atioSj:ini=Sj:p-l
/
Mmax /CdFS1a 6
5–112 105.60ð/MRd¼ 5:81 mradÞ
1
42.76 18.19(R2¼ 0:9717)
0
(R
.842¼ 0:9384)
2
1.55 6 1.55 68.91ðM/Cd¼ 127:71 kNmÞ
FS1b 6
8–120 109.30ð/MRd¼ 6:49 mradÞ
1
61.17 16.84(R2¼ 0:9921)
0
(R
.742¼ 0:9681)
2
2.78 7 7.05 111.22ðM/Cd¼ 70:29 kNmÞ
FS2aa 1
20–174 165.65ð/MRd¼ 7:08 mradÞ
1
93.06 23.39(R2¼ 0:9925)
0
(R
.842¼ 0:8611)
2
7.93 4 1.72 82.88ðM/Cd¼ 66:00 kNmÞ
FS2ba 1
17–181 170.22ð/MRd¼ 7:74 mradÞ
1
97.31 22.00(R2¼ 0:9968)
0
(R
.922¼ 0:8405)
2
3.91 4 0.30 60.89ðM/Cd¼ 147:93 kNmÞ
FS3aa 1
12–186 172.27ð/MRd¼ 7:47 mradÞ
2
02.91 23.23(R2¼ 0:9905)
1
(R
.812¼ 0:8629)
1
2.82 2 5.00 42.76ðM/Cd¼ 108:16 kNmÞ
FS3ba 1
22–200 192.66ð/MRd¼ 8:94 mradÞ
2
14.35 21.56(R2¼ 0:9972)
1
(R
.032¼ 0:8003)
2
0.96 2 9.99 48.74ðM/Cd¼ 153:10 kNmÞ
FS4a 1
10–170 165.60ð/MRd¼ 10:24 mradÞ
1
85.32 16.18(R2¼ 0:9936)
0
(R
.782¼ 0:8004)
2
0.61 3 7.70 61.69ðM/Cd¼ 150:25 kNmÞ
FS4b 1
10–170 163.52ð/MRd¼ 9:53 mradÞ
1
87.67 17.15(R2¼ 0:9956)
0
(R
.742¼ 0:8681)
2
3.29 4 3.85 64.24ðM/Cd¼ 158:09 kNmÞ
Fig. 15. Comparison of the moment–rotation curves for the four
test series.
Fig. 16. End plate deformation in the tension zone for several speci-
mens. (a) Comparison of the responses for the two devices (DT9,
DT10) for tests FS1b and FS4a. (b) Comparison of the responses for
the two tests from series FS1 (deformations from DT9).
1200 A.M. Girao Coelho et al. / Engineering Structures 26 (2004) 1185–1206
yielding and the third collapse mechanism involves bolt
failure only.Application of the procedure detailed in [3] provides
the results presented in Table 9. It is worth mentioning
that the predicted yield line patterns (double curvature
for the bolt row located at the end plate extension and
side yielding near the beam flange) are in line with the
experimental observations (cf. Fig. 22 for the inner bolt
row, for instance). By comparing the code predictions
with the experiments, they are within the knee-range
bounds but below the experimental values of flexural
resistance.
4.3. Initial rotational stiffness
The initial rotational stiffness of the tested joints is
given by [3]:
Sj:ini ¼z2
Pi
1
ki
ð8Þ
whereby the lever arm z is taken as equal to the dis-
tance from the centre of compression to a point mid-
way between the two bolt rows in tension and ki is the
Fig. 17. Comparison of the moment–end plate deformation curves
for the four test series.
n of the end plate deformations until failure conditions for test series FS4b. (a) General view; load ¼ 80 kN (
Fig. 18. Evolutio theoretical elasticlimit; elastic branch of the M–/ curve). (b) Tension zone; load ¼ 162 kN (post-limit branch of the M–/ curve). (c) Load ¼ 188 kN (maximum
load attained during the test). (b) Tension zone; Load ¼ 162 kN (post-limit branch of the M–/ curve). (c) Load ¼ 188 kN (maximum load
attained during the test). (d) Tension zone; collapse conditions.

A.M. Girao Coelho et al. / Engineering Structures 26 (2004) 1185–1206 1201
the end plate deformations at failure conditions for test series FS1-3. (a) Specimen FS1a. (b) S
Fig. 19. Comparison of pecimen FS2a. (c) Speci-men FS3b.
Fig. 20. Comparison of the ratio end plate deformation vs. connec-
tion rotation for the four test series.
Fig. 21. Comparison of the moment–rotation curve for test FS1a by
using alternative definitions of connection rotation.

1202 A.M. Girao Coelho et al. / Engineering Structures 26 (2004) 1185–1206
stiffness coefficient for joint component i. For a single-sided beam-to-column joint with bolted end plate con-nection, the stiffness coefficients that have to be takeninto account are those related to the column web in
shear (k1) and in transverse compression (k2) and an
equivalent stiffness coefficient keq that represents the
basic components related to the bolt rows in tension.
The latter coefficient is evaluated as follows [3]:
keq ¼P
r keff ;rhrz
ð9Þ
with:
keff ;r ¼1Pi
1
ki;r
: ð10Þ
and is based on the stiffness coefficients for the column
web in tension, the column flange in bending, the end
plate in bending and the bolts in tension. ki,r is the stiff-
ness coefficient representing component i relative to
bolt row r. For simplicity, z is taken as equal to the
distance from the centre of compression to a point
midway between the two bolt rows in tension [3].Table 10 sets out the predicted values for the initial
stiffness and compares them with the experiments. The
ratio between the predicted values and the experiments
shows that Eurocode [3] overestimates this property.
The differences may derive from the fact that the
expression as presented in the code was calibrated for a
certain range of joints. The particular joints that were
tested were not ‘balanced’, i.e. there was a much
weaker component than the remaining. This situation
is unlikely to occur in common joints for which the
expression was calibrated.
4.4. Rotation capacity
The experimental values of rotation capacity and
corresponding ductility indexes for the various tests are
set out in Table 11. It can be easily seen that test FS1,
which employs a thinner end plate and steel grade
S355, presents higher ductility than the remaining tests.
Fig. 22. Yield line patterns around the inner tension bolt at collapse
conditions (e.g. specimens FS1b and FS2b). (a) Specimen FS1b. (b)
Specimen FS2b.
Fig. 23. Bolt elongation behaviour (e.g. specimen FS4b).

A.M. Girao Coelho et al. / Engineering Structures 26 (2004) 1185–1206 1203
Application of the Eurocode 3 guidelines to the char-acterization of the rotation capacity [3]—cf. Section.1—shows that the first condition is guaranteed for allspecimens (the joint moment resistance is governed bythe resistance of the end plate in bending), whilst thesecond condition (Eq. (1)) is only fulfilled for speci-mens FS1 (Table 12). Though these recommendationsare only valid for steel grades up to S460, they werealso applied to series FS4 that includes end plates fromgrade S690.
Since the various specimens were designed to concen-trate most of the deformability on the tension zone(end plate side) that is idealized as a T-stub, the analy-sis of this elemental part as a standalone configurationin terms of deformation behaviour is also carried out.The experimental deformation behaviour of this regionis characterized from the LVDTs readings (Table 13)and is directly related to the T-stub deformation. Thevalues taken for further considerations are those fromLVDT DT9. The force acting at the T-stub web, F0, iscomputed as follows:
F0 ¼M
hb � tfbð11Þ
whereby hb is the beam section height and tfb is thebeam flange thickness. The corresponding componentductility indexes are also evaluated (Table 13). Theyreflect the same tendency as the previous results forglobal rotations (Table 11).
Naturally, the T-stub tested in isolation does notcompletely reflect this real behaviour when insertedinto a more complex joint. However, the results for theisolated T-stub must be comparable to those from thejoint for the T-stub model for the tension region to bevalid. Bearing that in mind, a comparative analysis ofthe average ductility indexes is summarized in Table 14.These average values are those corresponding to Mj.Rd
or F0.Rd, as appropriate. The upper and lower varia-tions of the indexes (winf and wsup) are also indicated asa percentage value. The results from the correspondingisolated T-stubs from reference [15] are also reported.Although the experimental definition of the knee-rangebounds is very sensitive, particularly the lower bound,the results extracted from the global joint rotation andthe end plate T-stub for rotation capacity are withinacceptable agreement. Further comparisons with theisolated T-stubs (where possible) confirms this state-ment.
5. Conclusions
Tests on 8 extended end plate moment connectionswere conducted under static loading. All specimenswere designed to trigger failure in the end plate rather
Fig. 24. Comparison of the ‘‘nondimensional’’ bolt elongation
behaviour for the four specimen types. (a) Bolt #1. (b) Bolt #2.
(c) Bolt #3. (d) Bolt #4.

1204 A.M. Girao Coelho et al. / Engineering Structures 26 (2004) 1185–1206
than in the beam or the column. The following conclu-sions can be drawn from the test programme:
1. The joint moment resistance increases with anincrease of end plate thickness and with the yieldstress of the plate.
2. The joint initial rotational stiffness also increaseswith the end plate thickness, but the sensitivity to
Table 9
Evaluation of the resistance of the test specimens (the experimental values correspond to the average of the two tests per connection detail)
Test ID R
ow 1 Row 2 Mj.Rd(kNm)
R
[
atio
theory/experiments]
h1 (mm) Ft1.Rd (kN) P lastic mode h2 (mm) F t2.Rd (kN) Plastic modeFS1 3
34.52 83.86 T ype-1 244.49 2 02.34 Type-1 7 7.52 0 .72FS2 3
35.26 176.07 T ype-1 245.28 2 97.87 Type-2 1 32.09 0 .79FS3 3
35.34 274.06 T ype-2 245.20 3 89.01 Type-2 1 87.29 1 .03FS4 3
34.76 161.16 T ype-1 244.81 2 87.94 Type-2 1 24.44 0 .76Table 10
Evaluation of the initial rotational stiffness of the test specimens (the experimental values correspond to the average of the two tests per connec-
tion detail)
Test ID k
eff.1(kN/mm)
k
(
eff.2kN/mm)
k
(k
eqN/mm)
k
(
1kN/mm)
k
(k
2N/mm)
z
(mm)
S
(k
j.iniNm/mrad)
Ratio
[theory/experiments]
FS1
225.023 3 33.57 5 41.95 2 718.64 4 867.62 289.51 3 4.66 1.98FS2
375.03 4 53.37 8 16.22 2 717.60 4 983.72 289.62 4 6.76 2.06FS3 2
453.12 4 96.04 9 42.50 2 711.5 5 052.06 290.27 5 1.76 2.31FS4
202.18 3 15.65 5 00.25 2 710.23 4 857.34 290.41 3 2.77 1.97Table 11
Evaluation of the joint ductility indexes
Test ID R
otation values at the KR[mrad]
Ductility indexes at Mmax
Ductility indexes at failure/KR.inf
/MRd/ KR.sup /Mmaxw
j.inf wj.Rd w j.sup /Cd w j.inf wj.Rd w j.supFS1a 3
.0 5.81 1 7.5 61.55 2 0.52 10.59 3 .52 68.91 2 2.97 11.86 3 .94FS1b 4
.2 6.49 2 5.0 77.05 1 8.35 11.87 3 .08 111.22 2 6.48 17.14 4 .45FS2a 6
.5 7.08 2 0.0 41.72 6 .42 5.89 2 .09 82.88 1 2.75 11.71 4 .14FS2b 6
.3 7.74 2 0.5 40.30 6 .40 5.21 1 .97 60.89 9.67 7.87 2 .97FS3a 5
.5 7.42 1 5.0 25.00 4 .55 3.37 1 .67 42.76 7.77 5.75 2 .85FS3b 5
.5 8.94 1 8.0 29.99 5 .45 3.35 1 .67 48.74 8.86 5.45 2 .71FS4a 6
.9 10.24 2 1.0 37.70 5 .46 3.69 1 .80 61.69 8.94 6.04 2 .94FS4b 6
.9 9.53 2 1.6 43.85 6 .36 4.60 2 .03 64.24 9.31 6.74 2 .97Table 12
Verification of the recommendations for rotation capacity
Test ID t
p (mm) Maximumtp (mm)
FS1 1
0.40 11.80 Y esFS2 1
5.01 11.75 N oFS3 2
0.02 11.76 N oFS4 1
0.06 8.25 N oTable 13
Evaluation of the components end plate and bolts ductility indexes
Test ID D
eformation values at the KR[mm]
Ductility indexes at F0.max
Ductility indexes at failureDKR.inf D
F0:RdD KR.sup DF0:maxw
0.inf w0.Rd w 0.sup Dmax w 0.inf w 0.Rd w 0.supFS1a 0
.50 0 .70 3 .86 16.56 3 3.13 23.66 4 .29 19.28 3 8.56 2 7.54 4 .99FS1b 0
.90 1 .00 4 .40 18.44 2 0.48 18.44 4 .19 30.23 3 3.59 3 0.23 6 .87FS2a 0
.70 0 .80 2 .74 8.98 1 2.83 11.23 3 .28 18.06 2 5.80 2 2.58 6 .59FS2b 0
.80 0 .90 2 .92 9.01 1 1.26 10.01 3 .08 14.55 1 8.19 1 6.17 4 .98FS3a 0
.47 0 .75 1 .73 4.75 1 0.11 6.33 2 .75 10.34 2 2.00 1 3.79 5 .98FS3b 0
.49 0 .75 2 .39 5.87 1 1.98 7.83 2 .46 11.77 2 4.02 1 5.69 4 .92FS4a 1
.15 1 .30 5 .35 8.47 7.36 6.51 1 .58 15.28 1 3.28 1 1.75 2 .86FS4b 0
.96 1 .30 3 .44 10.04 1 0.46 7.72 2 .92 16.03 1 6.69 1 2.33 4 .66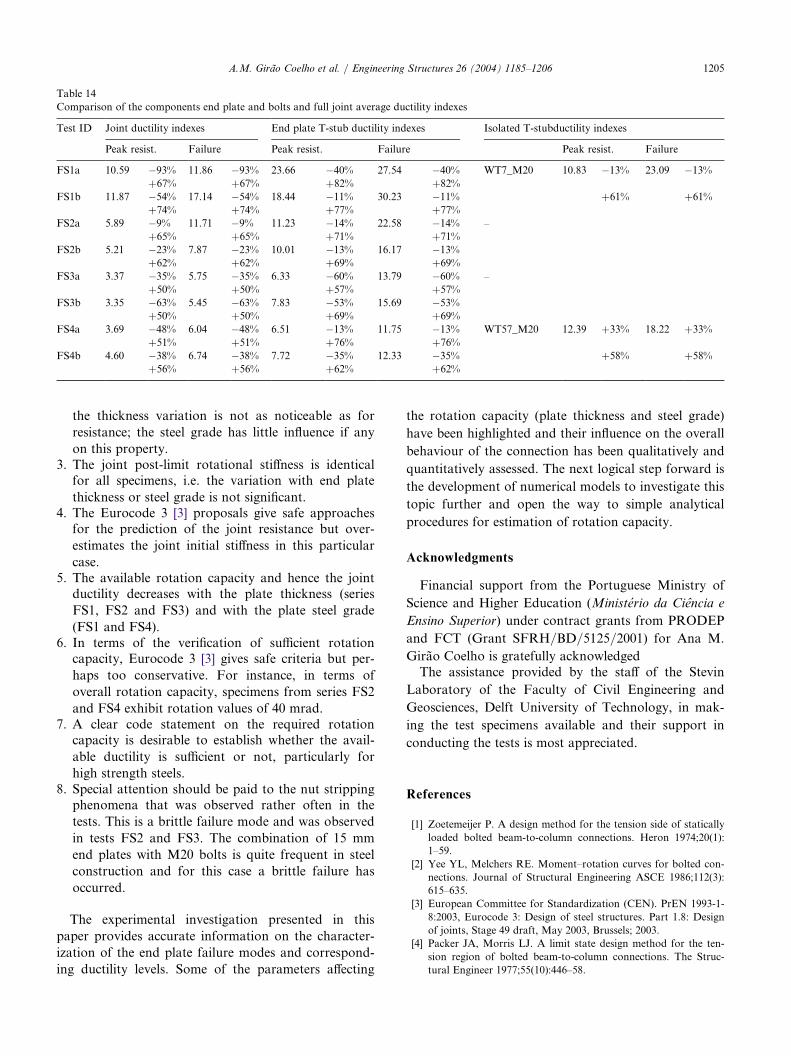
A.M. Girao Coelho et al. / Engineering Structures 26 (2004) 1185–1206 1205
the thickness variation is not as noticeable as for
resistance; the steel grade has little influence if any
on this property.3. The joint post-limit rotational stiffness is identical
for all specimens, i.e. the variation with end plate
thickness or steel grade is not significant.4. The Eurocode 3 [3] proposals give safe approaches
for the prediction of the joint resistance but over-
estimates the joint initial stiffness in this particular
case.5. The available rotation capacity and hence the joint
ductility decreases with the plate thickness (series
FS1, FS2 and FS3) and with the plate steel grade
(FS1 and FS4).6. In terms of the verification of sufficient rotation
capacity, Eurocode 3 [3] gives safe criteria but per-
haps too conservative. For instance, in terms of
overall rotation capacity, specimens from series FS2
and FS4 exhibit rotation values of 40 mrad.7. A clear code statement on the required rotation
capacity is desirable to establish whether the avail-
able ductility is sufficient or not, particularly for
high strength steels.8. Special attention should be paid to the nut stripping
phenomena that was observed rather often in the
tests. This is a brittle failure mode and was observed
in tests FS2 and FS3. The combination of 15 mm
end plates with M20 bolts is quite frequent in steel
construction and for this case a brittle failure has
occurred.
The experimental investigation presented in this
paper provides accurate information on the character-
ization of the end plate failure modes and correspond-
ing ductility levels. Some of the parameters affecting
the rotation capacity (plate thickness and steel grade)
have been highlighted and their influence on the overall
behaviour of the connection has been qualitatively and
quantitatively assessed. The next logical step forward is
the development of numerical models to investigate this
topic further and open the way to simple analytical
procedures for estimation of rotation capacity.
Acknowledgments
Financial support from the Portuguese Ministry of
Science and Higher Education (Ministerio da Ciencia e
Ensino Superior) under contract grants from PRODEP
and FCT (Grant SFRH/BD/5125/2001) for Ana M.
Girao Coelho is gratefully acknowledgedThe assistance provided by the staff of the Stevin
Laboratory of the Faculty of Civil Engineering and
Geosciences, Delft University of Technology, in mak-
ing the test specimens available and their support in
conducting the tests is most appreciated.
References
[1] Zoetemeijer P. A design method for the tension side of statically
loaded bolted beam-to-column connections. Heron 1974;20(1):
1–59.
[2] Yee YL, Melchers RE. Moment–rotation curves for bolted con-
nections. Journal of Structural Engineering ASCE 1986;112(3):
615–635.
[3] European Committee for Standardization (CEN). PrEN 1993-1-
8:2003, Eurocode 3: Design of steel structures. Part 1.8: Design
of joints, Stage 49 draft, May 2003, Brussels; 2003.
[4] Packer JA, Morris LJ. A limit state design method for the ten-
sion region of bolted beam-to-column connections. The Struc-
tural Engineer 1977;55(10):446–58.
Table 14
Comparison of the components end plate and bolts and full joint average ductility indexes
Test ID J
oint ductility indexes End plate T-stub ductility indexes Isolated T-stubductility indexesPeak resist. F
ailure P eak resist. F ailure P eak resist. FailureFS1a 1
0.59 �93% 1 1.86 � 93% 2 3.66 � 40% 2 7.54 � 40% W T7_M20 1 0.83 � 13% 23.09 � 13%+67%
+67% +82% +82%FS1b 1
1.87 �54% 1 7.14 � 54% 1 8.44 � 11% 3 0.23 � 11% +61% +61%+74%
+74% +77% +77%FS2a 5
.89 �9% 1 1.71 � 9% 1 1.23 � 14% 2 2.58 � 14% –+65%
+65% +71% +71%FS2b 5
.21 �23% 7 .87 � 23% 1 0.01 � 13% 1 6.17 � 13%+62%
+62% +69% +69%FS3a 3
.37 �35% 5 .75 � 35% 6 .33 � 60% 1 3.79 � 60% –+50%
+50% +57% +57%FS3b 3
.35 �63% 5 .45 � 63% 7 .83 � 53% 1 5.69 � 53%+50%
+50% +69% +69%FS4a 3
.69 �48% 6 .04 � 48% 6 .51 � 13% 1 1.75 � 13% W T57_M20 1 2.39 + 33% 18.22 + 33%+51%
+51% +76% +76%FS4b 4
.60 �38% 6 .74 � 38% 7 .72 � 35% 1 2.33 � 35% +58% +58%+56%
+56% +62% +62%
1206 A.M. Girao Coelho et al. / Engineering Structures 26 (2004) 1185–1206
[5] Jaspart J.P. Etude de la semi-rigidite des noeuds poutre-colonne
et son influence sur la resistance et la stabilite des ossatures en
acier. PhD thesis (in French). University of Liege, Liege; 1991.
[6] Bursi OS, Jaspart JP. Benchmarks for finite element modelling
of bolted steel connections. Journal of Constructional Steel
Research 1997;43(1):17–42.
[7] Faella C, Piluso V, Rizzano G. Experimental analysis of bolted
connections: snug versus preloaded bolts. Journal of Structural
Engineering ASCE 1998;124(7):765–74.
[8] Gebbeken N, Wanzek T. Benchmark experiments for numerical
simulations of T-stubs. In: K. S. Virdi (editor), Numerical simu-
lation of semi-rigid connections by the finite element method,
COST C1. Report of working group 6—Numerical simulation.
Brussels; 1999. p. 61–70.
[9] Swanson JA, Leon RT. Bolted steel connections: tests on T-stub
components. Journal of Structural Engineering ASCE
2000;126(1):50–6.
[10] Piluso V, Faella C, Rizzano G. Ultimate behavior of bolted T-
stubs. I: theoretical model. Journal of Structural Engineering
ASCE 2001;127(6):686–93.
[11] Piluso V, Faella C, Rizzano G. Ultimate behavior of bolted T-
stubs. II: model validation. Journal of Structural Engineering
ASCE 2001;127(6):694–704.
[12] Girao Coelho AM, Simoes da Silva L. Numerical evaluation of
the ductility of a bolted T-stub connection. In: Chan SL, Teng
JG, Chung KF, editors. Advances in steel structures.
Proceedings of the Third International Conference (ICASS’02)
Hong Kong. 2002, p. 277–84.
[13] Girao Coelho AM, Bijlaard F, Simoes da Silva L. On the defor-
mation capacity of beam-to-column bolted connections. Eur-
opean Convention for Constructional Steelwork—Technical
Comittee 10, Structural Connections (ECCS-TC10), Document
ECCS-TWG 10.2-02-003; 2002.
[14] Girao Coelho AM, Bijlaard F, Simoes da Silva L. On the
behaviour of bolted end plate connections modelled by welded
T-stubs. In: Lamas A, Simoes da Silva L, editors. Steel
strucutres. Proceedings of the Third European Conference
(Eurosteel) Coimbra. 2002, p. 907–18.
[15] Girao Coelho AM, Bijlaard F, Gresnigt N, Simoes da Silva L.
Experimental assessment of the behaviour of bolted T-stub con-
nections made up of welded plates. Journal of Constructional
Steel Research 2004;60:269–311.
[16] Weynand K, Jaspart JP, Steenhuis M. The stiffness model of
revised Annex J of Eurocode 3. In: Bjorhovde R, Colson A,
Zandonini R, editors. Connections in steel structures III.
Proceedings of the Third international Workshop on connec-
tions Trento. 1995, p. 441–52.
[17] Zoetemeijer P. Summary of the research on bolted beam-to-col-
umn connections. Report 25-6-90-2. Delft University of Tech-
nology, Faculty of Civil Engineering, Stevin Laboratory—Steel
Structures; 1990.
[18] Jaspart JP. Contributions to recent advances in the field of steel
joints, Column bases and further configurations for bema-to-col-
umn joints and beam splices. Aggregation thesis. University of
Liege, Liege; 1997.
[19] Swanson JA. Characterization of the strength, stiffness and duc-
tility behavior of T-stub connections. PhD dissertation, Georgia
Institute of Technology, Atlanta, USA; 1999.
[20] Faella C, Piluso V, Rizzano G. Structural semi-rigid connections—
theory, design and software. Boca Raton, USA: CRC Press; 2000.
[21] Kuhlmann U, Kuhnemund F. Rotation capacity of steel joints:
verification procedure and component tests. In: Baniotopoulos
CC, Wald F, editors. The paramount role of joints into the
reliable response of structures. Proceedings of the NATO
advanced research workshop. Nato Science series. Dordrecht:
Kluwer Academic Publishers; 2000, p. 363–72.
[22] Kuhlmann U, Kuhnemund F. Ductility of semi-rigid steel joints.
In: Ivanyi M, editor. Stability and ductility of steel structures
(SDSS 2002). Proceedings of the International Colloquium
Budapest, Hungary. 2002, p. 363–70.
[23] Beg D, Zupancic, Vayas I. On the rotation capacity of moment
connections. Journal of Constructional Steel Research 2004;60:
601–620.
[24] European Committee for Standardization (CEN). PrEN
10025:2000E: hot rolled products of structural steels, September
2000, Brussels; 2000.
[25] European Committee for Standardization (CEN). EN 10204:-
1995E: Metallic products, October 1995, Brussels; 1995.
[26] RILEM draft recommendation. Tension testing of metallic
structural materials for determining stress-strain relations under
monotonic and uniaxial tensile loading. Materials and Structures
1990;23:35–46.
[27] Gioncu V, Mazzolani FM. Ductility of seismic resistant
steel structures. London: Spon Press; 2002.
[28] International Standard ISO 898-1:1999 (E). Mechanical proper-
ties of fasteners made of carbon steel and alloy steel—Part 1:
bolts, screws and studs, August 1999, Switzerland; 1999.
[29] Weynand K. Sicherheits-und Wirtsschaftlichkeitsuntersuchungen
zur anwendung nachgiebiger anschlusse im stahlbau. PhD thesis
(in German). University of Aachen, Aachen; 1996.
[30] Simoes da Silva L, Santiago A, Vila Real P. Post-limit stiffness
and ductility of end plate beam-to-column steel joints. Compu-
ters and Structures 2002;80:515–31.
[31] Kuhlmann U, Davison JB, Kattner M. Structural systems and
rotation capacity. In: Maquoi R, editor. Control of the semi-
rigid behaviour of civil engineering structural connections. Pro-
ceedings of the International Conference Liege, Belgium. 1998,
p. 167–76.