experimental and numerical investigation of airflow and temperature distribution in a prototype cold...
TRANSCRIPT
International Journal of Mechanical Engineering and Technology (IJMET), ISSN 0976 – 6340(Print),
ISSN 0976 – 6359(Online), Volume 5, Issue 4, April (2014), pp. 123-137 © IAEME
123
EXPERIMENTAL AND NUMERICAL INVESTIGATION OF AIRFLOW AND
TEMPERATURE DISTRIBUTION IN A PROTOTYPE COLD STORAGE
Qasim S. Mahdi, Husam Mahdi Hadi*
Department of Mechanical Engineering, College of Engineering,
Al-Mustansiriyah University
ABSTRACT
Airflow and temperature distribution inside a cold store are investigated using experimental
and computational fluid dynamic using CFX 14.5. In the present work a prototype cold storage for
meat has been designed. Temperature distributions were determined for different storage
temperature, -2°C, -10°C, -20°C and -21°C, inside empty cold store experimentally. The Air
temperature distribution also been determined for storage temperatures -20°C and -21°C inside
loaded cold storage with 10.8kg. The Mean air velocity distribution also been measured for empty
cold store, by using a hot wire anemometer. Navier-Stokes equations, and the turbulence is taken into
account using a standard εκ− model, incompressible, symmetric cold store used to analysis the
loaded and empty cold storage and the meat are presented as a solid domain with variable
thermophysical properties as a function of temperature. Air flow distribution results in the three
levels (bottom, medium and top) for empty cold store with relative error between experimentally and
numerically equal to 20%. The relative error between the experimental and numerical for
temperature distributions inside empty cold storage equal to 13%. Correlations have been developed
for modeling the evaporator unit in numerical simulation, where the total error between the
experimental results and the correlation that used in numerical is 8.8%.
Keywords: Cold Store; Air Distribution; Temperature Distribution; CFX; Correlations for Modeling
the Evaporator Unit.
INTERNATIONAL JOURNAL OF MECHANICAL ENGINEERING
AND TECHNOLOGY (IJMET)
ISSN 0976 – 6340 (Print)
ISSN 0976 – 6359 (Online)
Volume 5, Issue 4, April (2014), pp. 123-137 © IAEME: www.iaeme.com/ijmet.asp
Journal Impact Factor (2014): 7.5377 (Calculated by GISI)
www.jifactor.com
IJMET
© I A E M E
International Journal of Mechanical Engineering and Technology (IJMET), ISSN 0976 – 6340(Print),
ISSN 0976 – 6359(Online), Volume 5, Issue 4, April (2014), pp. 123-137 © IAEME
124
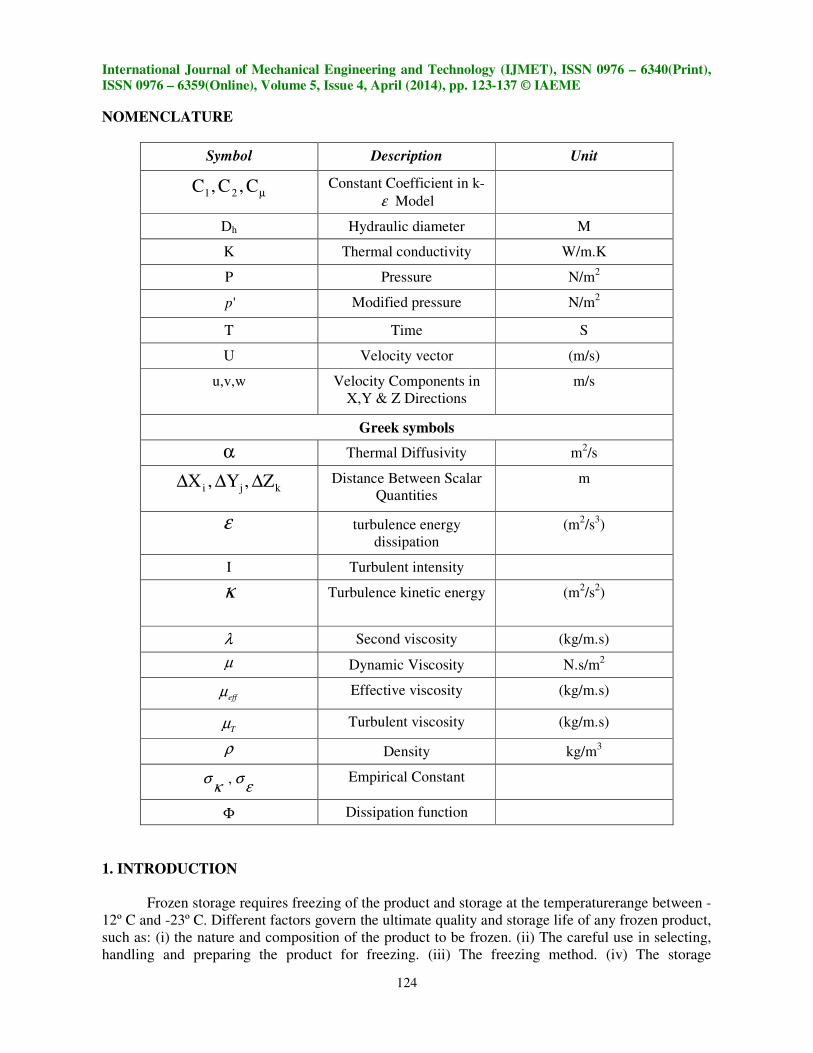
NOMENCLATURE
Unit Description Symbol
Constant Coefficient in k-
ε Model µC,C,C 21
M Hydraulic diameter Dh
W/m.K Thermal conductivity K
N/m2 Pressure P
N/m2
Modified pressure 'p
S Time T
(m/s) Velocity vector U
m/s
Velocity Components in
X,Y & Z Directions
u,v,w
Greek symbols
m2/s Thermal Diffusivity α
m
Distance Between Scalar
Quantities kji Z,Y,X ∆∆∆
(m2/s
3) turbulence energy
dissipation
ε
Turbulent intensity I
(m2/s
2) Turbulence kinetic energy κ
(kg/m.s) Second viscosity λ
N.s/m2 Dynamic Viscosity µ
(kg/m.s) Effective viscosity effµ
(kg/m.s) Turbulent viscosity Tµ
kg/m3 Density ρ
Empirical Constant ε
σκ
σ ,
Dissipation function Φ
1. INTRODUCTION
Frozen storage requires freezing of the product and storage at the temperaturerange between -
12 º C and -23 º C. Different factors govern the ultimate quality and storage life of any frozen product,
such as: (i) the nature and composition of the product to be frozen. (ii) The careful use in selecting,
handling and preparing the product for freezing. (iii) The freezing method. (iv) The storage

International Journal of Mechanical Engineering and Technology (IJMET), ISSN 0976 – 6340(Print),
ISSN 0976 – 6359(Online), Volume 5, Issue 4, April (2014), pp. 123-137 © IAEME
125
conditions [1]. Therefore, the main aim in designing a storage system is to ensure a uniform targeted
temperature and humidity in the bulk of storage product. The temperature distributions inside the
cold store depend on the air flow distribution, where theydependon the product, the cooling medium,
the geometry and characteristic of the cooling room.
They are several studies on the experimental and numerical investigation of air flow,
temperature such as:
M.L. Hoang et al. [2] investigated theairflow inside a cold store using CFX package. The
airflow model is based on the steady state incompressible, Reynolds-averaged Navier-Stokes
equations.The standard as well as the Renormalization Group (RNG) version of the k- Ɛ model is
investigated. Also, the finite volume method of discretization is used.Validation was performed by
comparisons of numerical and experimental data on vertical profiles of air velocity magnitudes. The
accuracy was 26% for the standard k–Ɛ model and 28.5% for the RNG.
A transient three-dimensional CFD model was developed by H.B. Nahor et al. [3] to
calculate the velocity, temperature and moisture distribution in an existing empty and loaded cool
store. An average accuracy of 22% on the velocity magnitudes inside the empty cold store was
achieved and the predicted temperature distribution found more uniform than the predicted results. In
the loaded cold store, an average accuracy of 20% on the velocity magnitudes was observed. Serap
Akdemir and Selcuk Arin[4] studied the spatial distribution of the ambient temperature, relative
humidity and air velocity in cold store. Their results are achieved at ceiling, medium and floor level
in the cold store and for different storage temperatures (0 ºC, 1 ºC, 2 ºC and 3 ºC). Mapping software
was presented to show the variability. Also, they indicated that the spatial distribution of the
temperature and the relative humidity was not uniform in the cold store. Bjorn Margeirsson and
Sigurjon Arason [5] investigated the temperature monitoring in both cold stores and containers
which are used for storage and transportation of frozen fish products. Numerical modeling of airflow
and temperature distribution in one of the cold store was performed using the CFD code Fluent for
both steady and unsteady.Seyed Majid Sajadiye et al. [6] used a multi-scale three-dimensional
CFDcode fluent model, which predicts the airflow, heat and mass transfer in a typical full loaded
cool storage. The model was validated against experiments by means of velocity, product
temperature, and product weight loss measurements in cool storage. The errors of about 23.2% and
9.1% were achieved for velocity magnitude prediction in the cool storage and the product weight loss
after 54 days of cooling in the loaded cool storage, respectively.
2. MODELING
2.1. Physical model The dimensions of the simulated cold store are100cm × 100cm × 100cm and the air cooling
fan dimensionsare74.5 cm × 40 cm × 14.3 cm. The door of the cold store located at the middle of the
front wall with dimensions, 57cm width, 67cm height and 5cm thickness. The structure of the cold
store is made from polyurethane insulation layer, 10 cm thickness, and the dimensions of the cold
store from inside are 80 cm × 80 cm × 80 cm.
2.2. Mathematical model To simplify the model, a number of assumptions were made:
Transient condition as analysis type, total time (1800 second) and times steps (10 second) for
empty cold store and steady state with 370 iterations for loading cold store; Negligible the natural
convection; No heat flow through the door and walls; The Boussinesq model was not adopted; Three
dimensional, Incompressible flow; The radiation between the side walls is ignored; Turbulence
medium intensity equal (5%) and The air flow is assumed as steady turbulent state.

International Journal of Mechanical Engineering and Technology (IJMET), ISSN 0976 – 6340(Print),
ISSN 0976 – 6359(Online), Volume 5, Issue 4, April (2014), pp. 123-137 © IAEME
126
According to the above assumption, the following equations for air inside cold store are given [7,8]:
( )
)9(3.1;0.1;92.12
;44.11
;09.0
)8(3.0
2/3,2)(
2
3
)7(2
21)(
)6()(
)5(2
)4(2)(2)(
2)(2)(2)(2)(2)(2
)3()()()()(
)2(2'
)1(0
=====
×=×=
−
∂
∂
+∂
∂
∂
∂=
∂
∂
∂
∂−
∂
∂+
∂
∂
−
∂
∂
+∂
∂
∂
∂=
∂
∂
∂
∂−
∂
∂+
∂
∂
=
+
∂
∂+
∂
∂+
∂
∂+
∂
∂+
∂
∂+
∂
∂+
∂
∂+
∂
∂+
∂
∂
=Φ
Φ++−=+∂
∂
∇+∂
∂−=
∂
∂+
∂
∂
=
∂
∂+
∂
∂+
∂
∂+
∂
∂
εσ
κσ
µµµ
ε
ρκ
εµκ
εµ
ε
εσ
µερ
ρε
ρεµκ
κσ
µκρ
ρκ
ε
κρ
µµ
νλµ
ννρνρ
µρ
ρρ
CCC
hD
kIUk
C
ix
jU
jx
iU
jx
iU
C
jx
T
jxj
U
jxt
ix
jU
jx
iU
jx
iU
Tj
x
T
jxj
U
jxt
CT
Udi
y
w
z
v
x
w
z
u
x
v
y
u
z
w
y
v
x
u
stateof
Equations
gradTkdiUdipTUdit
TEnergy
U ieffx i
pU jU i
x jt
U i
z
w
y
v
x
u
tContinuity
2.3. Initial Boundary Condition The initialization of the model is important for convergence. If the initial conditions are poor,
then it takes longer to converge or it may even result in divergence. In the present work the initial
conditions are:
1- The Cartesian velocity components (U=0, V=0 and W=0) all in m/s.
2- Relative pressure (0) Pa.
3- All variable are initiated for different temperature dependent on the initial experimental
temperature for each case as follows:
a- The initial temperature inside the empty cold store is 30 º C.
b- The initial temperature inside the loaded cold store is 32 º C and 35ºC for six meats distributed
in three levels.
2.4. Boundary conditions
The air velocity and temperature inlet boundary condition a, which are suggested 3.2m/s and
( evaporatorfromOutletT ) respectively for empty cold store, and 3.2m/s and -21 º C for loaded cold store, are
used in the present work. Where the velocity and temperature open boundary condition are
determined experimentally. These include velocity type Cartesian with insert automatic, with value
(U=0 m/s, V=0 m/s and W=1.78 m/s), the opening temperature ( evaporatortoInletT ) for empty cold store

International Journal of Mechanical Engineering and Technology (IJMET), ISSN 0976 – 6340(Print),
ISSN 0976 – 6359(Online), Volume 5, Issue 4, April (2014), pp. 123-137 © IAEME
127
and the opening temperature -21 º C for loaded cold store. Also, the other side inside the cold store,
which is symmetry in a boundary condition, is considered the other half of evaporator fan and trays.
All empirical equations are obtained using the multi-regression analysis technique and then
submitted as an expression in CFX, which depends mainly upon the experimental measurements,
from the inlet and outlet temperature of the evaporator. The empirical formulae of the outlet and inlet
temperature from evaporator as a function of time t are respectively:
sec]/[]sec/[6612763.0
sec]/[002296065.09077291.0][18583.27
]sec/[10719398103.1]sec/[10083517582.8
]sec/[10254451794.1]sec/[10033018813.5
sec]/[60548222298.0][3769572.305
55144411
337225
mVmK
tKTKT
tKtK
tKtK
tKKT
evapratorofback
evaporatorfromOutletevaporatortoInlet
evaporatorfromOutlet
××+
×−×+=
××+××−
××+××−
×−=
−−
−−
Tetrahedral mesh was generated using (3262752) elements, (663589) nodes to empty cold
store and (4475661) elements, (771219) nodes for loading cold store.
3. EXPERIMENTAL WORK
Cold storage has been designed and constructed depends on the provided materials and
equipment to achieve the freezing temperature below -20ºC. The outside and inside volumes of the
cold store are 1m3 and 0.512m
3, respectively, as shown in figure (1-a). Hermetic sealed
compressorsand air cooled condenser was located on the outside of the cold store. Force convection
evaporator was put on the ceiling of the cold storage as shown in figure (1-b),this unit has two fans
and the air velocity for each fan is 3.2m/s. After builds the cold store and before started the
experimental work the temperature distribution in and out from evaporator has been measured as
shown in figure (2).Also the other thermocouples are fixed at different levels, as shown in figure (3-
a). These have the capability to monitor the temperature in case of empty store and in case of loaded
store, see figure (3-a). The data are saved in SD card for the three 12 channel data logger that used in
the present work. The work interested in monitoring the inside and outside temperature, and the
relative humidity in the cold store.
(a) (b)
Figure (1): (a) cold storage and (b) The evaporator of the present design

International Journal of Mechanical Engineering and Technology (IJMET), ISSN 0976 – 6340(Print),
ISSN 0976 – 6359(Online), Volume 5, Issue 4, April (2014), pp. 123-137 © IAEME
128
Figure (2): Temperature in and out from the evaporator
(a) (b)
Figure (3): thermocouple distribution in three levels for empty cold store at (a) and loaded cold store
at (b)
4. RESULTS AND DISCUSSION
4.1. Experimental results
4.1.1. Temperature distribution
In the present work an experimental cold store was designed, built and operated to determine
the spatial distribution of the air velocity and air temperature. Since the temperature distribution is a
function of location and time, several cases have been implemented for temperature distribution for
empty and loaded storage which can bedescribed as follows:

International Journal of Mechanical Engineering and Technology (IJMET), ISSN 0976 – 6340(Print),
ISSN 0976 – 6359(Online), Volume 5, Issue 4, April (2014), pp. 123-137 © IAEME
129
4.1.1.1. Empty cold store
The air temperatures were determined at three levels located at different height ( 3cm, 28cm
and 53cm) inside the cold store and at different storage temperatures, -2°C, -10°C, -20°C and -21°C
respectively, as shown previously in figure (3-a).
The air temperature was varied between-2.5°C and 2.8°C for -2°C storage temperature, -
10.9°C and -7.8°C for -10°C storage temperature, -21.1°C and -18.3°C for -20°C storage
temperature, and -24.3°C and-20.1°C for -21°C storage temperature, respectively.
In the case of storage temperature -21°C, the temperature inside the cold store was 32°C and
the relative humidity was 32%. It takes 29 minutes to reach therequired storage temperature and then
the system pause due to the presence order, ON-OFF thermostat. The operation started again when
the temperature reached -17°C, due to differential temperature 4=∆T °C, and controlled by using
the thermostat.The air temperature distributions are measured during the operation of the system for
different runs. For each run the data are recorded by 12 channel data logger inside the cold store for
24 locations, six positions distributed in the center of each wall, as shown in figure (4-a), and 18
positions distributed in the air for three levels, as shown in figure (4-b). All temperatures are
recorded with a 2 minute elapse time.
(a) (b)
Figure (4): The measured temperature distribution as a function of time in the cold store for storage
temperature -21°C (a) 6 thermocouples distributed at the center of each wall. (b) 18 thermocouples
distributed on three levels in the air. (See figure (3-a))
4.1.1.2. Loaded cold store At the present work a 10.8 kg of meat, dimension 18cm×11cm×3cm, has been used and
frozen at the cold store. As shown in figure (3-b) thermocouples are distributed and arranged on
three levels within the loaded cold store. The air temperatures are measured at these three levels in
the loaded cold store for different storage temperatures -20°C and 21°C, where the measured air
temperatures are varied between -23.6°C and -20.5°C, for -20°C storage temperature, and -23.7°C
and -22.3°C, for -21° C storage temperature, respectively.
In the case of storage temperature -21°C, the temperature inside the cold store was 37°C and
the relative humidity was 34%. Took the time to reach therequired storage temperature was 62.5
minutes.By using thermocouples and read the temperature by 12 channel data logger inside the cold
store for 24 locations, six thermocouples are distributed in the center of each wall, as shown in figure
(5-a), and 18 are distributed in the air for three levels during each test, as shown in figure (5-b). The
temperature is recorded with 10 minutes time interval.

International Journal of Mechanical Engineering and Technology (IJMET), ISSN 0976 – 6340(Print),
ISSN 0976 – 6359(Online), Volume 5, Issue 4, April (2014), pp. 123-137 © IAEME
130
The temperature is recorded with 10 minutes time interval.
Six parts (two for each level) of meat distributed in the left half of the store. Each part have
0.9kg, distributed in the three levels, inside the cold store, and the other half assumed symmetric to
the left one, where (1M, 2M, 3M, 4M, 5M and 6M) referred to the locations of meat inside the cold
store, see figure (3-b) . The thermocouples are inserted inside each part of the meat with
(9cm×5.5cm×1.5cm) fixed locations. The initial temperature in the core of meat, at 1M, 2M, 3M,
4M, 5M and 6M locations, began from 33.9°C, 31.7°C, 34.8°C, 35.2°C, 31.8 °C and 36.5°C
gradually.
(a) (b) Figure (5): The measured temperature distribution as a function of time in the cold store for storage
temperature -21°C (a) 6 thermocouples distributed at the center of each wall. (b) 18 thermocouples
distributed on three levels in the air. (See figure (3-b))
4.1.2. Air velocity The air velocity from the two fans is same in the evaporator, so the flow pattern is
symmetrical in the cold store. Test make for finding the airflow distributions (Note that the points of
airflow distribution are shown in figure (6-a)) inside empty cold store for local air velocity by using a
hot wire anemometer, as shown in figure (7). The reason for non-uniform air temperature
distributions is the bad spatial distribution of air velocity generated by evaporator fan.
Each of velocities is normal to the six faces of parallelepiped of interest
),,,,( 212121 ZZyyXX VandVVVVV . The mean velocity V was then calculated using equation (12):
)12()()()( 2
2
2
2
2
2212121
LZZyyXX VVVVVV
V+++ ++=
The results from the equation above are shown in figure (6-b).
The figures(6-b and 7) show the air velocity distributions are the best at the top level, due to
exposure to the higher air velocity, and the best points in the lower level are (1,2 and 1M). Also, one
can see from these figures the medium level has less airflow distributions and this explains the bad
temperature distribution in this area.

International Journal of Mechanical Engineering and Technology (IJMET), ISSN 0976
ISSN 0976 – 6359(Online), Volume 5, Issue
Figure (6): air velocity distribution
(a), and Mean velocity distributionsby using a hot wire anemometer at (b)
Figure (7): the airflow distributions for
using a hot wire anemometer ((i) at x
4.2. Numerical results
4.2.1. Air flow and temperature distribution inside empty cold store for transient simulationThe initial temperature inside the cold store was 30°C for Air at 25 °C.
distributions, in a form of contours maps
transient.It takes 4 hours and 52 minutes to reach below
store.The air temperatures were determined at three levels located at different height, 5cm, 30cm and
55cm respectively inside the cold store, where three ZX
figure (8-a, 8-b,8-c) and after accumulating time steps
has been determined at different points, the locations of t
the results of the temperature distribution at these points are shown in figure (
Three dimensional ε−K turbulent models are used to simulate the air distribution in the
cold store. Figures (10-a, 10-b and 1
(10cm, 20cm and 30cm) respectively, inside the cold store.It is observed that the high velocity zones
were concentrated between the ceiling fan, from the inlet with constan
coils, at the back of the evaporator with constant velocity 1.78 m/s, and the approximation average
air velocity at the top, medium and bottom levels are
International Journal of Mechanical Engineering and Technology (IJMET), ISSN 0976
6359(Online), Volume 5, Issue 4, April (2014), pp. 123-137 © IAEME
131
air velocity distribution points for empty cold store by using a hot wire anemometer at
y distributionsby using a hot wire anemometer at (b)
the airflow distributions for the three levels in the cold storeand at different directions by
using a hot wire anemometer ((i) at x-direction, (ii) at y-direction and (iii) at z
distribution inside empty cold store for transient simulationThe initial temperature inside the cold store was 30°C for Air at 25 °C.
distributions, in a form of contours maps and charts, are presented in figures (
takes 4 hours and 52 minutes to reach below -21°C inside the simulation of cold
The air temperatures were determined at three levels located at different height, 5cm, 30cm and
spectively inside the cold store, where three ZX-planes are in the same locations,
accumulating time steps equal to 30 minutes. The air temperature also
has been determined at different points, the locations of these points are the same of figure (
temperature distribution at these points are shown in figure (9).
turbulent models are used to simulate the air distribution in the
0-c) show as the velocity vectors in YZ-planes at different length
(10cm, 20cm and 30cm) respectively, inside the cold store.It is observed that the high velocity zones
were concentrated between the ceiling fan, from the inlet with constant velocity 3.2m/s, and cooling
evaporator with constant velocity 1.78 m/s, and the approximation average
air velocity at the top, medium and bottom levels are 0.55 m/s, 0.283 m/s and 0.303
International Journal of Mechanical Engineering and Technology (IJMET), ISSN 0976 – 6340(Print),
by using a hot wire anemometer at
y distributionsby using a hot wire anemometer at (b)
the three levels in the cold storeand at different directions by
direction and (iii) at z-direction)
distribution inside empty cold store for transient simulation The initial temperature inside the cold store was 30°C for Air at 25 °C. The temperature
and charts, are presented in figures (8) and (9) with
21°C inside the simulation of cold
The air temperatures were determined at three levels located at different height, 5cm, 30cm and
planes are in the same locations, as shown in
The air temperature also
hese points are the same of figure (3-a) and
turbulent models are used to simulate the air distribution in the
planes at different length
(10cm, 20cm and 30cm) respectively, inside the cold store.It is observed that the high velocity zones
t velocity 3.2m/s, and cooling
evaporator with constant velocity 1.78 m/s, and the approximation average
m/s respectively.

International Journal of Mechanical Engineering and Technology (IJMET), ISSN 0976 – 6340(Print),
ISSN 0976 – 6359(Online), Volume 5, Issue 4, April (2014), pp. 123-137 © IAEME
132
(a) (b)
(c)
Figure (8): Temperature distribution inside empty cold store at accumulate time step 30 minute
located at: (a) top level, (b) medium level and (c) bottom level
Figure (9): Air temperature distribution as a function of time in the cold store for 18 points
distributed on three levels

International Journal of Mechanical Engineering and Technology (IJMET), ISSN 0976 – 6340(Print),
ISSN 0976 – 6359(Online), Volume 5, Issue 4, April (2014), pp. 123-137 © IAEME
133
(a) (b)
(c)
Figure (10): velocity vectors distribution at different locations in YZ plane: ((a) at x=10cm, (b) at
x=20cm and (c) at x=30cm) inside empty cold store
4.2.2. Airflow and air temperature distribution inside loaded cold store for steady state
simulation
The initial temperature inside the cold store was 35°C for Air at 25 °C, The temperature and
airflow distribution in a form of contour maps are presented in figures (11) and (13) with steady
state. It takes 370 iterations to reach whole cold store under -20°C inside the simulation of cold store.
The air temperatures were determined at three levels located at different height (5cm, 30cm and
55cm ) inside the cold store, three ZX- planes at the same locations, as shown in figures (11-a,11-b
and 11-c).
The Air velocity vector distribution also has been determined at different length in a form of
YZ-planes at the same locations, as shown in figures (12-a, 12-b and 12-c). It is observed that the
high velocity zones were concentrated between the ceiling fan, from the inlet with constant velocity
3.2m/s, and cooling coils, at the back of the evaporator with constant velocity 1.78 m/s. The
approximation of the average air velocity at the top, medium and bottom levels are 0.603 m/s, 0.377
m/s and 0.366 m/s respectively.

International Journal of Mechanical Engineering and Technology (IJMET), ISSN 0976 – 6340(Print),
ISSN 0976 – 6359(Online), Volume 5, Issue 4, April (2014), pp. 123-137 © IAEME
134
(a) (b)
(c)
Figure (11): Temperature distribution inside loaded cold store located at (a) top level, (b) medium
level and (c) bottom level
(a) (b)
(c)
Figure (12): velocity vectors distribution at different locations at YZ- plane: ((a) at x=10cm,
(b) at x=20cm and (c) at x=30cm) inside empty cold store

International Journal of Mechanical Engineering and Technology (IJMET), ISSN 0976 – 6340(Print),
ISSN 0976 – 6359(Online), Volume 5, Issue 4, April (2014), pp. 123-137 © IAEME
135
4.3. Comparison between experimental and numerical results
Temperature and air flow distribution inside empty cold store
The temperature distribution results in the three levels (bottom, medium and top) for empty
cold store as shown in the figures (13-i, 13-ii and 13-iii) respectively. Average of the relative error
between experimental and numerical air temperature distribution is equal to 13%. Air flow
distribution results in the three levels (bottom, medium and top) for empty cold store as shown in the
figure (14) with relative error between experimentally and numerically equal to 20%.
(i) (ii)
(iii)
Figure (13): Comparison between experimental and numerical for air temperature distribution inside
empty cold store: (i) Bottom level, (ii) Medium level and (iii) top level

International Journal of Mechanical Engineering and Technology (IJMET), ISSN 0976 – 6340(Print),
ISSN 0976 – 6359(Online), Volume 5, Issue 4, April (2014), pp. 123-137 © IAEME
136
Figure (14): Comparison between experimental and numerical for air velocity distribution inside
empty cold store: (i) Numerical and (ii) Experimental
4.4. CONCLUSIONS From the present work results for the airflow and temperature distribution in a cold store,
different distinguish conclusions have been pointed out:
1- From the analysis of the variation of the air velocity at the middle and bottom of the cold store,
it was found that the variation is less than the top level of cold store because the evaporator was
placed at the top level of cold store.
2- The numerical results show the average air velocity for empty cold store at the top, medium
and bottom levels are 0.55 m/s, 0.283 m/s and 0.303 m/s respectively. Also, they show the
average air velocity for loading cold store at the top, medium and bottom levels 0.603 m/s,
0.377 m/s and 0.366 m/s respectively.
3- The air velocity strongly influences the performance of the unit. If the air velocity is too low
the necessary refrigerating effect and the correct storage temperature cannot be guaranteed. If
air velocity is too high the air stream becomes more turbulent thus increasing heat transfer with
the environment and the correct storage temperature can be guaranteed.
4- The two fans operate in normal conditions and therefore, the flow pattern is symmetrical inside
the cold store.
5- The air stacks appeared inside empty and loaded cold storage in several points; first stack
introduced should be close to the evaporator with minimum and maximum velocity equal to
0.038 m/sec and 0.431 m/sec for empty cold store, 0.08m/sec and 0.587 m/sec for loading cold
store respectively. Other stack appeared two more in empty store and four more in loaded store
with minimum and maximum velocity range equal to 0.025 m/sec and 0.46 m/sec for empty
store, 0.019 m/sec and 0.718 m/sec for loading store respectively.
REFERENCE
[1] Roy J. Dossat, "Principle of Refrigeration", second Edition, John Wiley and sons, 1981.
[2] M.L. Hoang et al ,"Analysis of the air flow in a cold store by means of computational fluid
dynamics", International Journal of Refrigeration, vol. 23 No. 2, pp. 127-140, 2000.
[3] H.B. Nahor, M.L. Hoang, P. Verboven,"CFD model of the airflow, heat and mass transfer in
cool stores", International Journal of Refrigeration, Vol. 28, Issue 3, pp. 368–380, 2005.
[4] SERAP AKDEMIR and SELCUK ARIN,"Spatial Variabilty of Ambient Temperature,
Relative Humidity and Air velocity in a Cold Store", Journal of Central European
Agriculture, vol. 7, No.1, pp. 101-110, 2006.
International Journal of Mechanical Engineering and Technology (IJMET), ISSN 0976 – 6340(Print),
ISSN 0976 – 6359(Online), Volume 5, Issue 4, April (2014), pp. 123-137 © IAEME
137
[5] Bjorn Margeirsson and Sigurjon Arason, "Temperature monitoring and CFD modelling of a
cold storage", Ph.D. Thesis, University of Iceland, 2008.
[6] Seyed Majid Sajadiye, Hojat Ahmadi, Seyed Mostafa Hosseinalipour, Seyed Saeid
Mohtasebi, Mohammad Layeghi, Younes Mostofi, Amir Raja, "Evaluation of a Cooling
Performance of a Typical Full Loaded Cool Storage Using Mono-scale CFD Simulation",
Vol. 6, No. 1, 2012.
[7] ANSYS CFX Help (2012), Turbulence and Wall Function Theory, Two Equation Turbulence
Models, Release 14.5.
[8] Jones W. P. and Launders B. E., "The Predicition of Laminarization with a Two-Equation
Model of Turbulence", Int. J. Heat and Mass Transfer 15, 301-314, 1972.
[9] Gunwant D.Shelake, Harshal K. chavan, Prof. R. R. Deshmukh and Dr. S. D. Deshmukh,
“Model for Prediction of Temperature Distribution in Workpiece for Surface Grinding using
FEA”, International Journal of Advanced Research in Engineering & Technology (IJARET),
Volume 3, Issue 2, 2012, pp. 207 - 213, ISSN Print: 0976-6480, ISSN Online: 0976-6499.
[10] Ambeprasad S. Kushwaha, Dhiraj K. Patil, Vinaykumar J. Pandey, Sandeepkumar K. Yadav
and Tushar S. Suryawanshi, “Thermal Analysis of Heat Sink (Variable Shield Profile) Used
in Electronic Cooling using CFD Analysis”, International Journal of Mechanical Engineering
& Technology (IJMET), Volume 5, Issue 3, 2014, pp. 114 - 121, ISSN Print: 0976 – 6340,
ISSN Online: 0976 – 6359.
[11] N.S.Venkatesh Kumar and Prof. K. Hema Chandra Reddy, “CFD Investigation of Ceiling
Shape on Airflow Distribution for a Generic 2-D Room Model with and Without Passive
Control”, International Journal of Mechanical Engineering & Technology (IJMET), Volume
5, Issue 1, 2014, pp. 10 - 25, ISSN Print: 0976 – 6340, ISSN Online: 0976 – 6359.