experimental analysis of shale for evaluating shale drilling fluid
TRANSCRIPT
____________________________________________________________________________________________ *Corresponding author: E-mail: [email protected];
British Journal of Applied Science & Technology 4(35): 4878-4907, 2014
ISSN: 2231-0843
SCIENCEDOMAIN international www.sciencedomain.org
Experimental Analysis of Shale for Evaluating Shale Drilling Fluid Interaction in Agbada
Formation
Okoro Emeka Emmanuel1 and Adewale Dosunmu1*
1Department of Petroleum and Gas, University of Port Harcourt, P.M.B. 5323 Port Harcourt,
Rivers State, Nigeria.
Authors’ contributions
This work was carried out in collaboration between all authors. Author OEE designed the study, performed the statistical analysis, wrote the protocol, and wrote the first draft of the
manuscript and managed literature searches. Authors AD and OEE managed the analyses of the study and literature searches. All authors read and approved the final manuscript.
Article Information
DOI: 10.9734/BJAST/2014/12754
Editor(s): (1) Verlicchi Paola, Department of Engineering, University of Ferrara, Via Saragat 1, Ferrara, Italy.
(2) Chien-Jen Wang, Department of Electrical Engineering, National University of Tainan, Tainan, Taiwan. Reviewers:
(1) Anonymous, University of Pécs, Hungary. (2) Kigho Moses Oghenejoboh, Department of Chemical Engineering, Delta State University, Abraka, Oleh
Campus, P.M.B. 22 Oleh – Nigeria. (3) Anonymous, Gadjah Mada University, Yogyakarta, Indonesia.
Complete Peer review History: http://www.sciencedomain.org/review-history.php?iid=691&id=5&aid=6274
Received 16th
July 2014 Accepted 4
th September 2014
Published 29th
September 2014
ABSTRACT
Aims: To characterize the shale samples from Agbada formation and to develop an inhibitive water-based mud for the shale types. Study Design: Experimental. Place and Duration of Study: Department of Petroleum, University of Port Harcourt Rivers State, Agbada Formation Niger-Delta Region, between March 2011 and August 2012.
Original Research Article
British Journal of Applied Science & Technology, 4(35): 4878-4907, 2014
4879
Methodology: This study includes the determination of shale properties such as mineralogy, cation exchange capacity, native moisture content and total organic carbon content of the shale samples collected from two wells in Agbada Field. It also involves the establishment of an adsorption isotherm for the shale and the modeling of these isotherms using the Guggenheim, Anderson and Deboer model. Results: Based on the results of the dispersion and swelling tests, 3% Bentonite + 1% Potassium Chloride (KCl) were selected as the promising fluid. Well A exhibited the Type II isotherm which is common to most shale while Well B showed the Type V isotherm. Adsorption isotherm model predictions were in agreement with experimental observations. The samples from the wells exhibited dispersion after testing with deionized water. For Well A and B, 3% Bentonite + 1% Potassium Chloride (KCl) inhibits and yielded higher shale percent recovery values from dispersion tests. Conclusion: It was observed from adsorption isotherm models that the total organic carbon content is not a significant factor in the adsorptive and dispersive behaviors exhibited by the shale samples.
Keywords: Mineralogy; adsorption isotherm; dispersion test and swelling test.
ABBREVIATIONS a = activity, aw = water activity, BET = Brunauer, Emmett and Teller C = constant C = Guggenheim constant °C = degree Celsius CEC = Cation Exchange Capacity, Meq/100g Solid °F = degree Fahrenheit GAB = Guggenheim, Anderson, and DeBoer ∆hc = specific bonding enthalpy of water monolayer, J/Kg ∆hk = mean specific bonding enthalpy of the water multilayer, J/Kg ∆hs,mono = specific sorption enthalpy of water monolayer, J/Kg ∆hvap = specific vaporization enthalpy of water monolayer, J/Kg ∆hs, multi = mean specific sorption enthalpy of water multilayer, J/g K = sorption energies if multiple layers of molecule K = temperature dependent constant Ko = adjustable parameter accounting for temperature effect ∆L = change in shale length, in L = original length of shale sample, in MC = moisture content, % Meq/100g = milliequivalent weights of methylene blue per 100g of solid N = spring factor NMC = native Moisture Content, % OBM = oil-Based Mud P = pressure Po = gas saturation pressure P/Po = relative vapor pressure Pπ = swelling pressure Pads = adsorptive Pressure PHPA = partially hydrolyzed polyacrylamide
Galley Pr oof
British Journal of Applied Science & Technology, 4(35): 4878-4907, 2014
4880
R = universal gas constant, J/Kg/K T = temperature, K TOC = Total Organic Content, % Wi = initial weight, g Wf = final weight, g Wc = weight of carbon removed by ashing, g Ws = weight of shale before experimental procedure, g Wu = weight of undispersed shale, g Ww = weight of water removed by drying, g Wg = weight of water gained by the shale sample, g WBM = Water-Based Mud XRD = X-Ray Diffraction Analysis
Greek symbols θ = fraction of available active sites θ300 = dial reading at 300 rpm θ600 = dial reading at 600 rpm ε = percent linear swell, % τ = shear stress, lbf/ft
2
τo = yield stress, lbf/100ft2
µp = plastic viscosity, cp γ = shear rate, 1/s
1. INTRODUCTION Wellbore instability in shale formations has been a significant problem in the petroleum industry for over a century. It is estimated that this problem costs the oil industry about 1 billion US dollars each year and it is also responsible for about 10 to 20% of the total drilling cost of well [1]. It is believed that the main cause of shale instability stems from unfavorable interactions between the drilling mud and shale formations [2]. Shale instability is generally caused by pore pressure changes and mechanical property alterations around the wellbore, induced by both chemical and hydraulic effects. All of these alterations are caused by water and ion movement into or out of the shale formations. Chenevert [3] showed that differences in water activity could cause an Osmotic flux of water into or out of the shale. Models based on chemical potential and hydraulic pressure developed by Osisanya [4], Mody and Hale [5], Osisanya and Chenevert [6] and further expanded on by Van Oort et al. [7] have indicated the complexity of theoretical analysis of driving forces and mechanisms that govern shale stability in the borehole. Osisanya and Chenevert [6], note that if ions are added to a water-base drilling fluid; the total water activity is lowered and water movement into the shale is reduced due to osmotic effects. This effect is not long lasting because ions are not completely restricted to the wellbore fluid by semi-permeable membrane. But for oil-base mud, a very efficient membrane exists; thus, very little ion transfer occurs. The causes of wellbore instability are often classified into either Mechanical (for example, failure of the rock around the hole because of high stresses, low rock strength or inappropriate drilling practice) or Chemical effects which arise from damaging interaction between the rock, generally shale, and the drilling fluid. These may be as a result of lack of a readily definable and irrefutable technical method to measure the interactions between drilling fluids and shale or the earlier assumption that shale’s are ideal semi-permeable
British Journal of Applied Science & Technology, 4(35): 4878-4907, 2014
4881
membranes. Depending on the shale type, water adsorption may lead to various reactions such as swelling, cuttings dispersion and increase in pore pressure creating wellbore instability to varying degrees [3]. Common failures that occur from shale instability include; Sloughing, Caving, stuck pipe and bit balling.
1.1 LITERATURE REVIEW Several literary works have been published with the intent to clarify the uncertainties surrounding shale-fluid interaction. The study of shale fluid interactions gained momentum in the seventies after a series of publications by Chenevert revealed the importance of drilling fluid activity in the successful inhibition of shale formations. In his first paper, Chenevert [3] experimentally tested a wide range of shales expanding the little database of knowledge of shale characteristics. He determined the aqueous activity of the shales by developing adsorption isotherms relating their aqueous activities to their water contents. He discovered that all shales, including hard illitic shales thought to initially be inert, showed some reaction when immersed in water. Furthermore, at equal activities, shales with higher clay contents showed an increased weight percent of water adsorbed. O’Brien and Chenevert [8] characterized shales with major laboratory procedures. X-Ray diffraction analyses revealed the shale composition while adsorption isotherms generated showed hydrational tendencies. Various fluids tested using the swelling and dispersion tests showed the supremacy of potassium mud in limiting swelling and instability. Osisanya [4], Osisanya and Chenevert [6] also concluded that shale is a ‘leaky’ membrane and no longer a semi-permeable membrane as originally proposed by Chenevert [3]. Ewy and Morton [9] assessed the efficiency of four Water Base Muds (WBMs) with varying activities to reduce pore pressure build up. Results of the study show the presence of two physical phenomena - osmotic membrane and physical plugging of the pore spaces. All mud used showed less swelling than the base case brine. In order to have the best possible results during laboratory testing, shale taken at the rig site and laboratory samples was preserved. This step is extremely important to maintain the original properties of the shale and thereby obtain results that are reliable. Poor preservation can alter the properties of the shale and cause artifacts. An incorrect preservation environment would produce poor results and wrong conclusions of gathered data. The shale used during the laboratory testing was originally cored at a depth of 2005-2006 ft and 3462.91-3464 ft; and preserved at the rig site in polyethylene bags covered by heavy duty plastic.
2. MATERIALS AND METHODS
2.1 Experimental Details It consists of two major experiments. These are shale characterization and shale-drilling fluid interaction experiments. Characterization tests provide knowledge on the composition and properties of the shale while the shale-drilling fluid interaction tests give information on the shale’s reactivity in various fluids through dispersion and swelling tests.
2.2 Experimental Procedure The experimental studies involve the following:
1. Characterization of shale samples through mineralogy, total organic content, native
Galley Pr oof
British Journal of Applied Science & Technology, 4(35): 4878-4907, 2014
4882
moisture content, and Cation exchange capacity 2. Development of adsorption isotherms for the shale samples 3. Development and evaluation of various water-based fluid against shale samples by
performing dispersion tests under atmospheric conditions and elevated temperatures of 120°F as well as swelling tests under atmospheric conditions
2.2.1 Shale test sample characterization The shale samples were characterized using the following methods [10]:
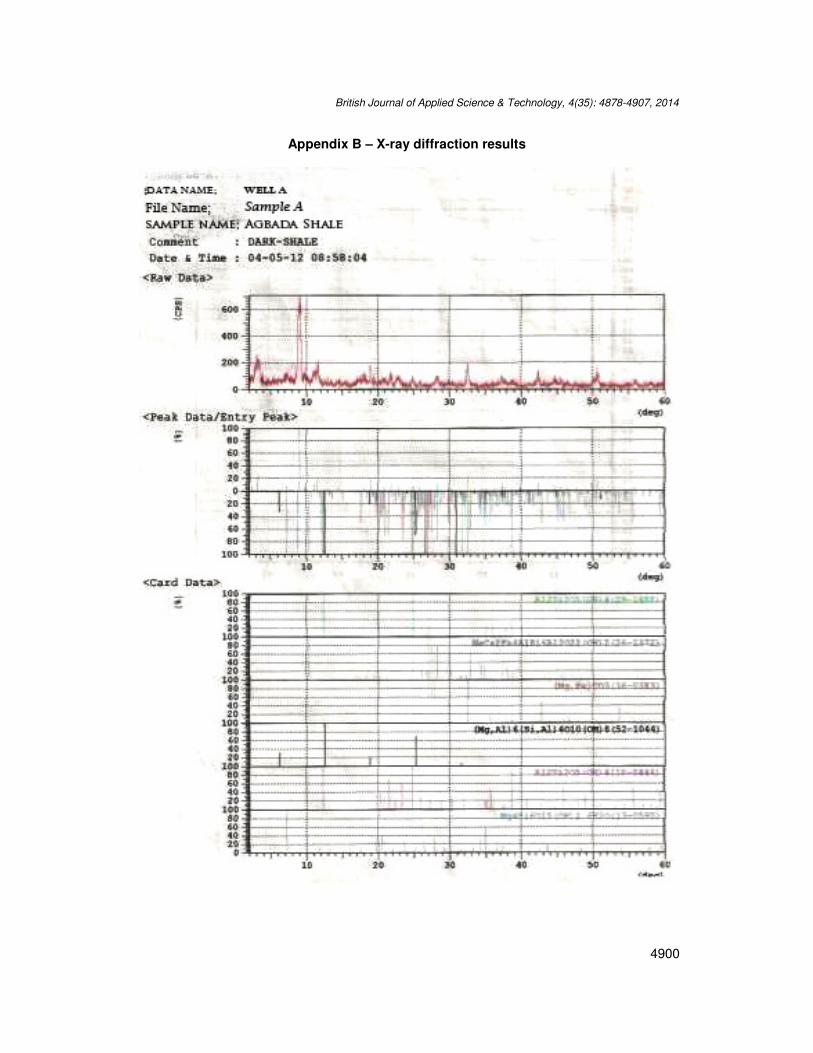
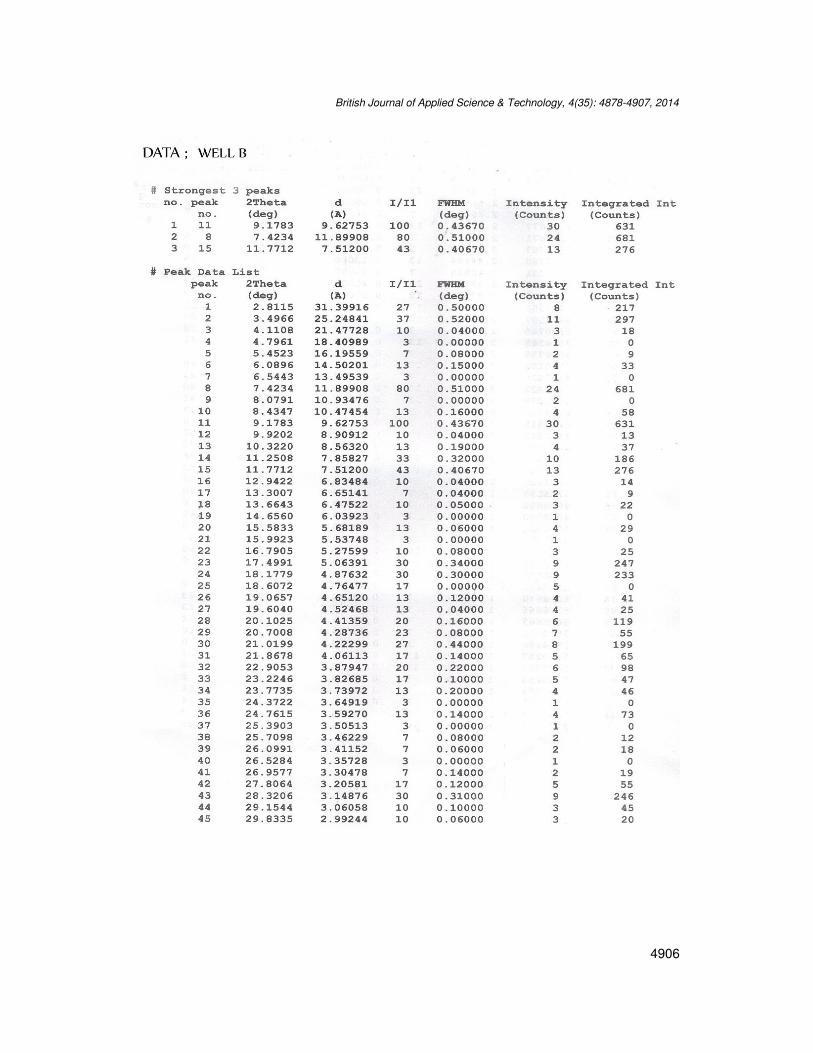
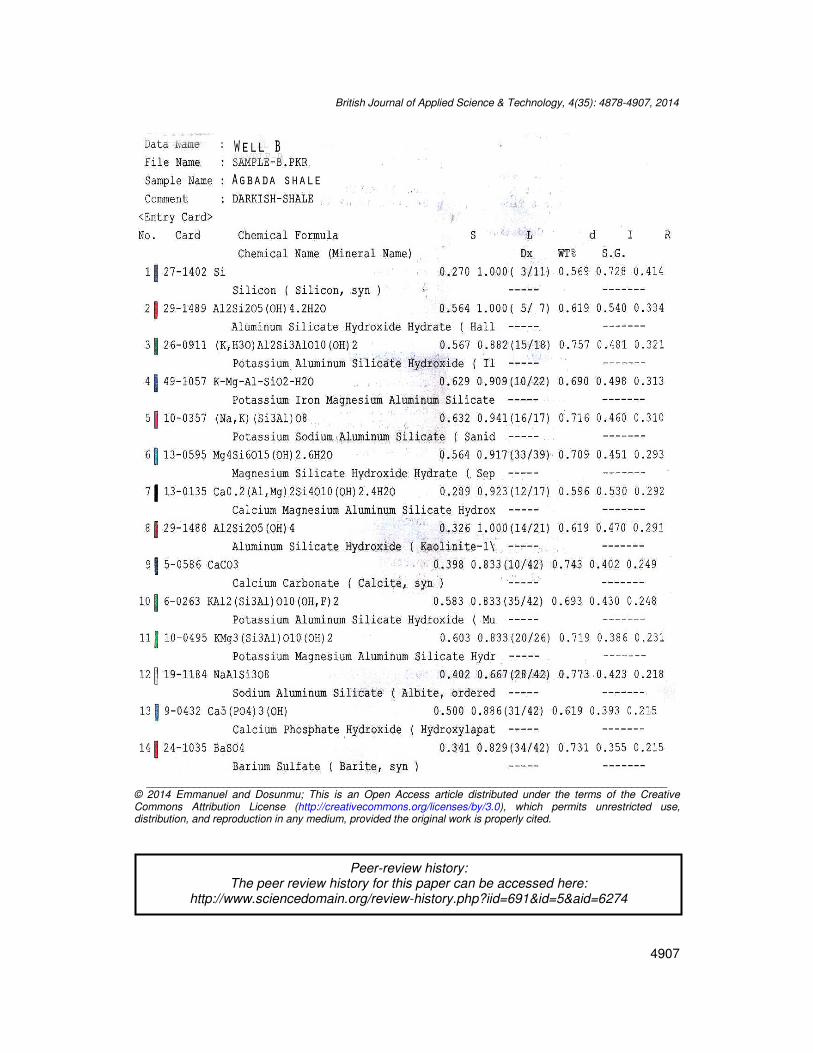
2.2.1.1 Total organic carbon content – low temperature asher Total Organic Carbon Content (TOC) is the quantity of carbon associated with organic matter. Organic matter is formed from decaying vegetation and other metabolic activities of living organisms. Shale, being a sedimentary rock formed partly from the deposition of organic material, has organic matter present within its structure. TOC content can be determined using various methods such as high temperature combustion, photo-oxidation, and high temperature catalytic oxidation. The main principle utilized by these methods is the oxidation reaction to remove carbon. Carbolite Sheffield low temperature asher was used in this study. 2.2.1.2 Mineralogy analysis – chemical analysis and X-ray diffraction Shale mineralogy analysis is used to identify the type and relative amounts of minerals present in shale samples. For this study, X-ray Fluorescence analysis (XRF) and X-Ray Diffraction were used for elemental compositional analysis. X-ray fluorescence analyses were done using a very small amount of about one gram of dried solids, but 80g was submitted. An X-ray diffraction analysis requires expensive instrumentation (DX-27Min) and a knowledgeable analyst trained in the operation of the instrument and interpretation of the data and the results obtained are in Appendix B. Owing to limitations of obtaining pure standards and the crystalline nature of some samples, the X-ray fluorescence data is only semi - quantitative for the mineralogical composition of the shale. 2.2.1.3 Native moisture content – oven Native moisture content is the amount of water present in shale as received in the laboratory after the removal of coatings for preservation. It is unique to each type of shale and the environment in which it is located. The following discussion presents the method used to obtain the native moisture content and water activity of the shales used in our study. We obtained Five (5) cubical shale samples and the initial weight of each shale sample was designated (wi). ). The shale samples were dried by placing them in an oven at 200°F for 24 hours, then the weight of each dry shale sample was measured (wd). The native moisture content of all 5 shale samples was averaged and used as the average native moisture content for the shale type. 2.2.1.4 Cation exchange capacity – methylene blue test The occurrence of isomorphous substitution and the subsequent adsorption of a cation in clays cause a disparity in their stability. The adsorbed cation is held loosely by the crystal structure and can readily be exchanged for another cation, thus the term cation exchange capacity (CEC). In the presence of water, the cations voluntarily undergo substitution by
British Journal of Applied Science & Technology, 4(35): 4878-4907, 2014
4883
hydrogen or hydronium ions present. This results in a high affinity for water molecules which can cause alteration of the shale’s physical properties. The methylene blue test is the simplest and most common test used in the drilling industry. The test results are reported in units of meq/100g (milliequivalent weights of methylene blue/100g of dry clay). The CEC of the shales were determined using the methylene blue method. This method involves the titration of clay suspensions using the methylene blue dye. Methylene blue is an organic dye that readily displaces exchangeable cations present in the clay minerals. As it replaces these cations, it is absorbed into the clay particles. 2.2.2 Fluid design and test matrix One of the main objectives of this study is to develop a water based mud that will minimize shale dispersion and swelling for the shale samples obtained. Each shale formation requires a unique drilling fluid for effective inhibition. This is achieved by providing cation exchange with the clays in the shale, the K
+ or Ca
2+ commonly replace the Sodium ion [Na
+] associated
with the clay in the shale; creating a more stable rock that is better able to resist hydration [4]. The fluid design is based on common oilfield materials. They include three salts: Potassium Chloride (KCl), Calcium Chloride (CaCl2) and Sodium Chloride (NaCl); as well as Bentonite. The salts were used to reduce the fluids chemical potential. Water, Soda Ash, PAC-L and PAC-R, Caustic Soda and Barite. Three mud systems formulated are shown in Table 1 below.
Table 1. Compositions of developed test fluids
S/N Mud system Composition
1
KCl-Bentonite Mud 3% Bentonite + 1% KCl 3% Bentonite + 0.3% KCl
2 CaCl2-Bentonite Mud 3% Bentonite + 1% CaCl2 3% Bentonite + 0.3% CaCl2
3 NaCl-Bentonite Mud 3% Bentonite + 1% NaCl 3% Bentonite + 0.3% NaCl
Base Fluid = Water (350Ml) + 0.20g NaOH, Density = 8.70lb/gal
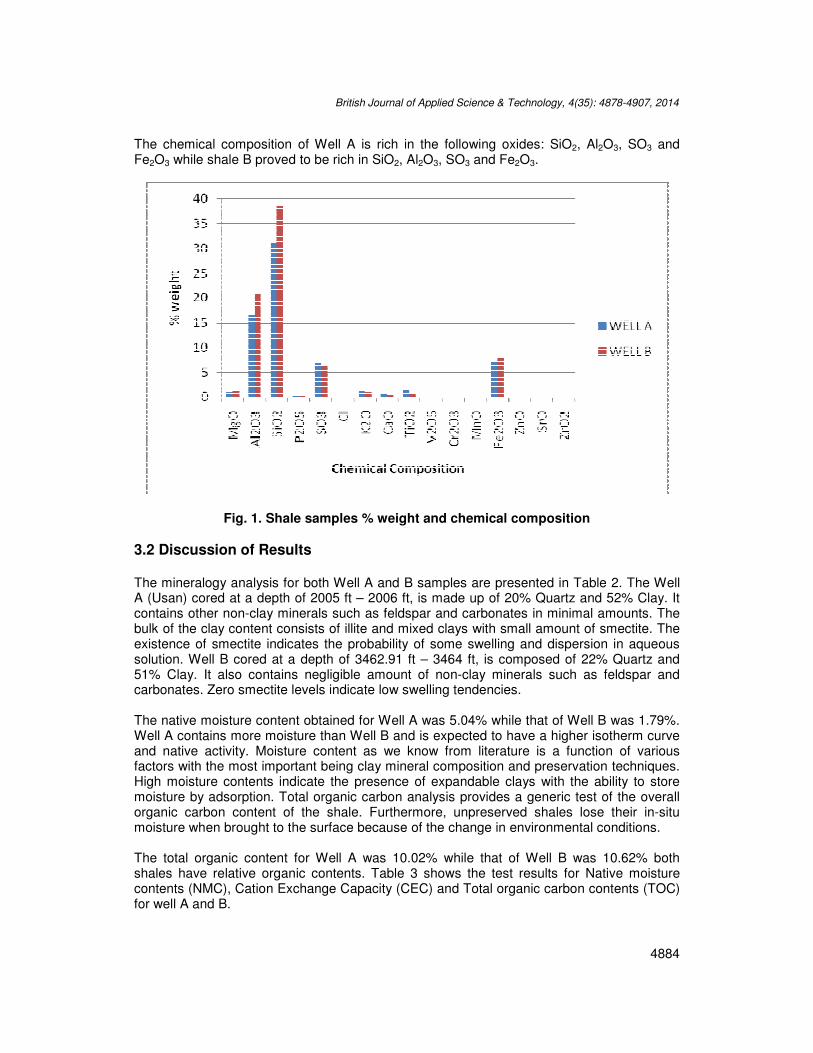
3. RESULTS AND DISCUSSION 3.1 Results Mineralogical analysis indicates the relative quantities of compounds present in a shale. Clay and non-clay minerals are usually present in shales. The type of clay present is an indication of the degree of hydration experienced by the shale. It can also be used to estimate the severity of wellbore instability issues that may arise. X-ray fluorescence (XRF) characterization was performed to know the chemical compositions of the minerals that are present in both Wells. The data given in Fig. 1 show that the aluminum and silicon oxides are present in major quantities while other minerals are present in trace amount. In both shale samples there exist concentration of Magnesium and Calcium in oxide fraction, which could be connected with character of their matrix and their origin. Magnesium could create mixed hydroxide minerals with other cations like Zinc, Manganese, Aluminum and iron, which influence mobility and bioaccumulation. The content of Calcium in the shale samples could be connected with a presence of clay and high content of organic matter.
Galley Pr oof
British Journal of Applied Science & Technology, 4(35): 4878-4907, 2014
4884
The chemical composition of Well A is rich in the following oxides: SiO2, Al2O3, SO3 and Fe2O3 while shale B proved to be rich in SiO2, Al2O3, SO3 and Fe2O3.
Fig. 1. Shale samples % weight and chemical composition
3.2 Discussion of Results The mineralogy analysis for both Well A and B samples are presented in Table 2. The Well A (Usan) cored at a depth of 2005 ft – 2006 ft, is made up of 20% Quartz and 52% Clay. It contains other non-clay minerals such as feldspar and carbonates in minimal amounts. The bulk of the clay content consists of illite and mixed clays with small amount of smectite. The existence of smectite indicates the probability of some swelling and dispersion in aqueous solution. Well B cored at a depth of 3462.91 ft – 3464 ft, is composed of 22% Quartz and 51% Clay. It also contains negligible amount of non-clay minerals such as feldspar and carbonates. Zero smectite levels indicate low swelling tendencies. The native moisture content obtained for Well A was 5.04% while that of Well B was 1.79%. Well A contains more moisture than Well B and is expected to have a higher isotherm curve and native activity. Moisture content as we know from literature is a function of various factors with the most important being clay mineral composition and preservation techniques. High moisture contents indicate the presence of expandable clays with the ability to store moisture by adsorption. Total organic carbon analysis provides a generic test of the overall organic carbon content of the shale. Furthermore, unpreserved shales lose their in-situ moisture when brought to the surface because of the change in environmental conditions. The total organic content for Well A was 10.02% while that of Well B was 10.62% both shales have relative organic contents. Table 3 shows the test results for Native moisture contents (NMC), Cation Exchange Capacity (CEC) and Total organic carbon contents (TOC) for well A and B.
British Journal of Applied Science & Technology, 4(35): 4878-4907, 2014
4885
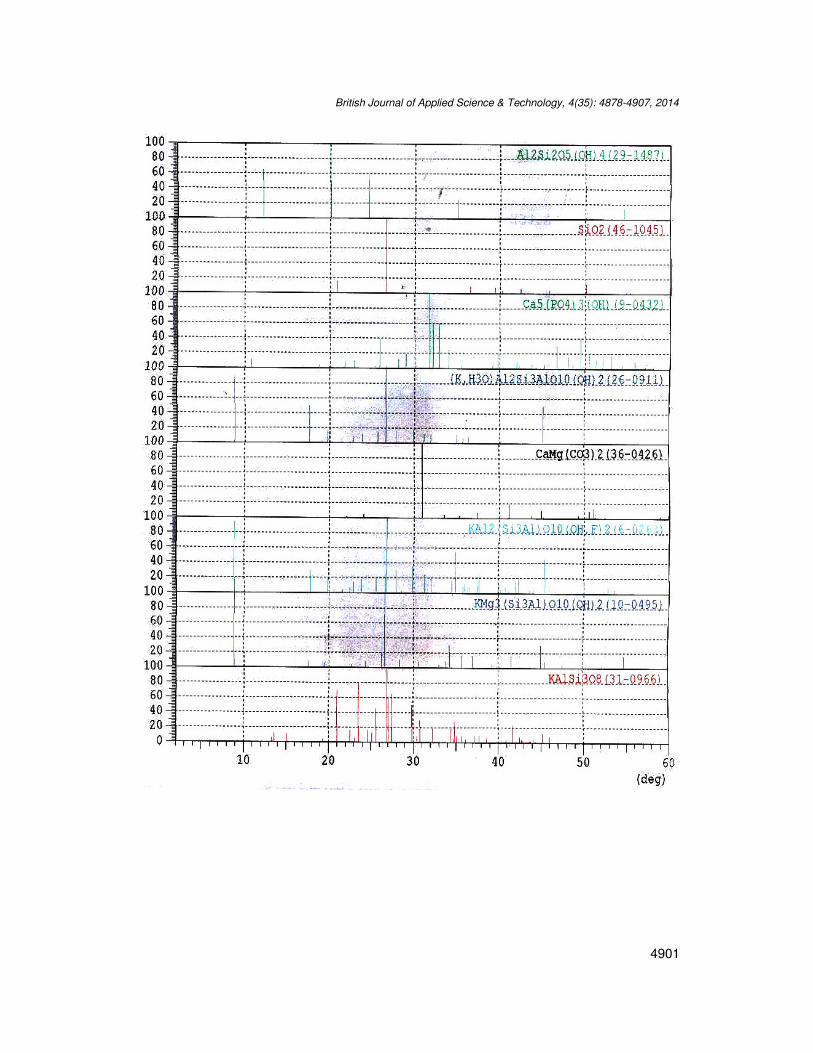
Table 2. Shale sample mineralogy using X-ray diffraction
Analysis Well A Well B
Depth (ft) 2005 - 2006 3462.91 - 3464 Clay content (Wt %) Illite 14.90 17.10 Kaolinite 10.10 6.40 Smectite 2.90 0 Halloysite 4.70 7.60 Mixed layer 19.30 20.10 Total clay content 51.90 51.20 Non-clay mineral content (Wt %) Quartz 20.20 21.90 Carbonates 8.05 10.10 Feldspar 8.80 10.80 Apatite 4.60 5.30 Dolomite 6.40 1
Table 3. Native moisture content, cation exchange capacity (CEC) and total organic
content values
Parameters Well A Well B
Native moisture content (% weight) 5.04 1.79 Total organic content (%) 10.02 10.62 Cation exchange capacity (CEC) (Meq/100g of Solid) 4.20 3.15
The cation exchange capacity (CEC) of shales is a measure of the intensity of the negative charge environment between clay platelets and hence co-ions electrical exclusion property of shales. High cation exchange capacity indicates strong electrical repulsion of anions; therefore, the cation exchange capacity should influence the shale membrane efficiency [11]. The higher the CEC, the more reactive the shale. Cation Exchange Capacity test show that Well A has CEC value of 4.20 Meq/100g of solid while Well B has CEC value of 3.15 Meq/100g of solid. The CEC values of both shales are below moderately reactive shales and greater than non-reactive sand stone and limestone. A low CEC value in the range of 1 to 10 Meq/100g can still be problematic if the small amount of clays present swell and cause the shale to break apart. Table 3 shows the result for the cation exchange capacity (CEC) of the shales. Both shales showed a large amount of interchangeable cation C
2+, which gives these
shale samples a low reactivity profile.
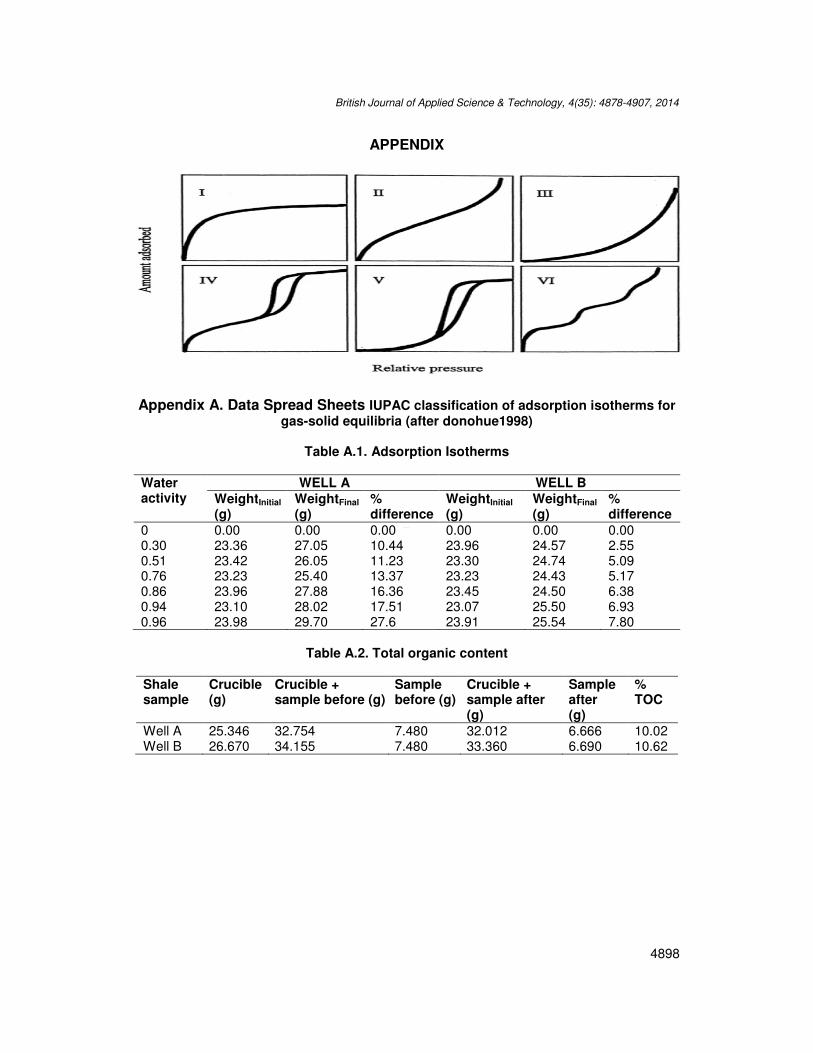
3.3 Adsorption Isotherms and Modeling Adsorption isotherms provide information on a material’s water content at certain equilibrium conditions. The behavior of a shale sample under these conditions can directly be related to its hydration and swelling potential. The isotherm can also give information on the expandable clay content of the shale. Two pieces of information are needed from the adsorption isotherm in order to make these conclusions. First, the shape of the adsorption isotherm, for compositionally and structurally similar clays; the shape of the adsorption isotherm should approximately be similar to one of the already established isotherms (Appendix A, Table A.1). Second, the amount of moisture adsorbed that is expressed on the y-axis of the curve shows which shale is more likely to hydrate [10].
Galley Pr oof
British Journal of Applied Science & Technology, 4(35): 4878-4907, 2014
4886
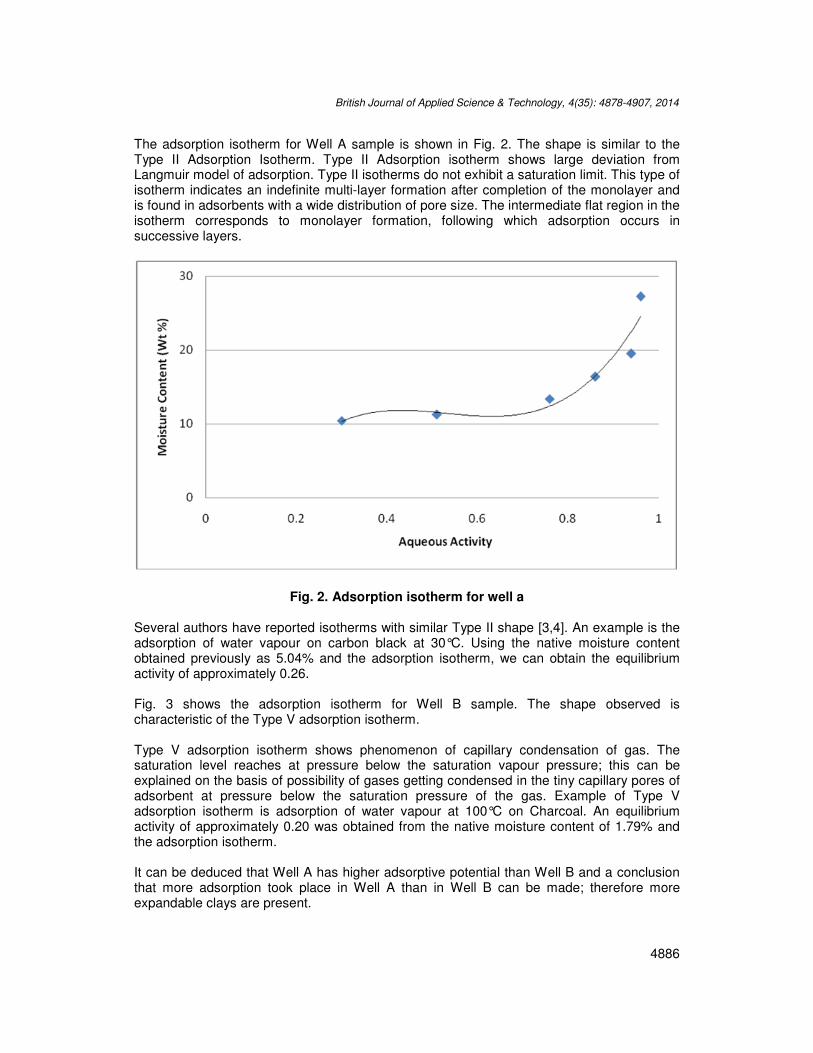
The adsorption isotherm for Well A sample is shown in Fig. 2. The shape is similar to the Type II Adsorption Isotherm. Type II Adsorption isotherm shows large deviation from Langmuir model of adsorption. Type II isotherms do not exhibit a saturation limit. This type of isotherm indicates an indefinite multi-layer formation after completion of the monolayer and is found in adsorbents with a wide distribution of pore size. The intermediate flat region in the isotherm corresponds to monolayer formation, following which adsorption occurs in successive layers.
Fig. 2. Adsorption isotherm for well a
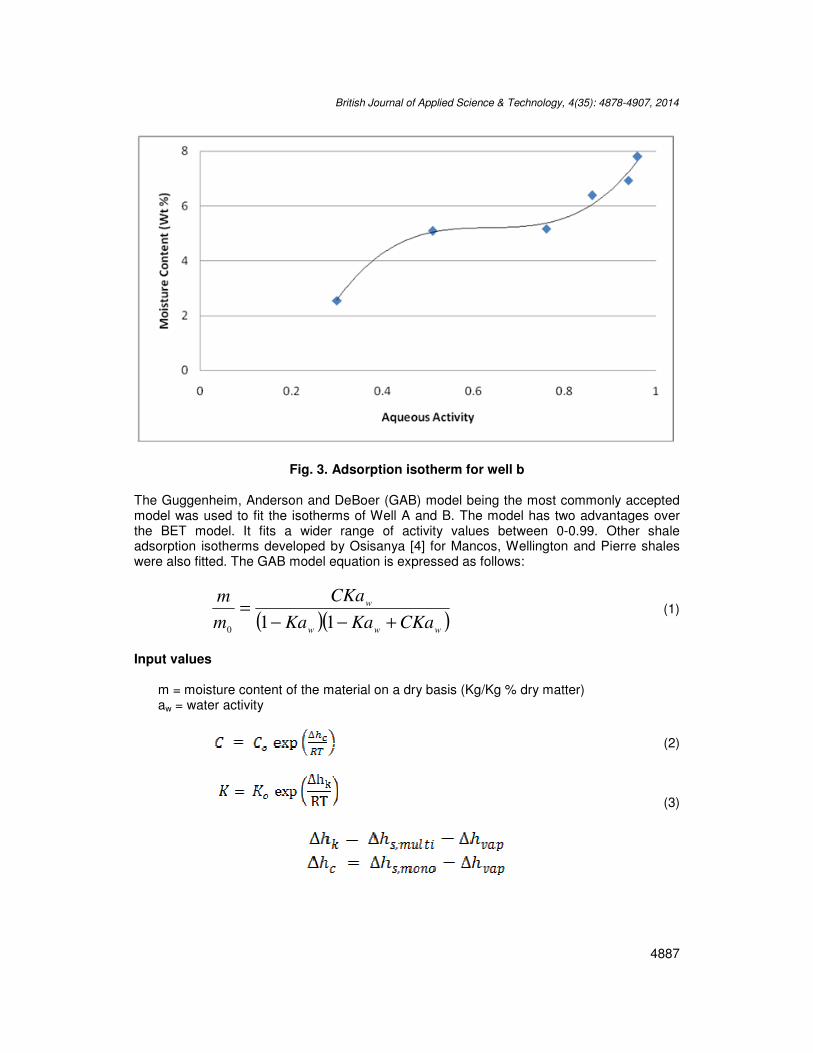
Several authors have reported isotherms with similar Type II shape [3,4]. An example is the adsorption of water vapour on carbon black at 30°C. Using the native moisture content obtained previously as 5.04% and the adsorption isotherm, we can obtain the equilibrium activity of approximately 0.26. Fig. 3 shows the adsorption isotherm for Well B sample. The shape observed is characteristic of the Type V adsorption isotherm. Type V adsorption isotherm shows phenomenon of capillary condensation of gas. The saturation level reaches at pressure below the saturation vapour pressure; this can be explained on the basis of possibility of gases getting condensed in the tiny capillary pores of adsorbent at pressure below the saturation pressure of the gas. Example of Type V adsorption isotherm is adsorption of water vapour at 100°C on Charcoal. An equilibrium activity of approximately 0.20 was obtained from the native moisture content of 1.79% and the adsorption isotherm. It can be deduced that Well A has higher adsorptive potential than Well B and a conclusion that more adsorption took place in Well A than in Well B can be made; therefore more expandable clays are present.
British Journal of Applied Science & Technology, 4(35): 4878-4907, 2014
4887
Fig. 3. Adsorption isotherm for well b The Guggenheim, Anderson and DeBoer (GAB) model being the most commonly accepted model was used to fit the isotherms of Well A and B. The model has two advantages over the BET model. It fits a wider range of activity values between 0-0.99. Other shale adsorption isotherms developed by Osisanya [4] for Mancos, Wellington and Pierre shales were also fitted. The GAB model equation is expressed as follows:
( )( )www
w
CKaKaKa
CKa
m
m
+−−=
110
(1)
Input values
m = moisture content of the material on a dry basis (Kg/Kg % dry matter) aw = water activity
(2)
(3)
Galley Pr oof
British Journal of Applied Science & Technology, 4(35): 4878-4907, 2014
4888
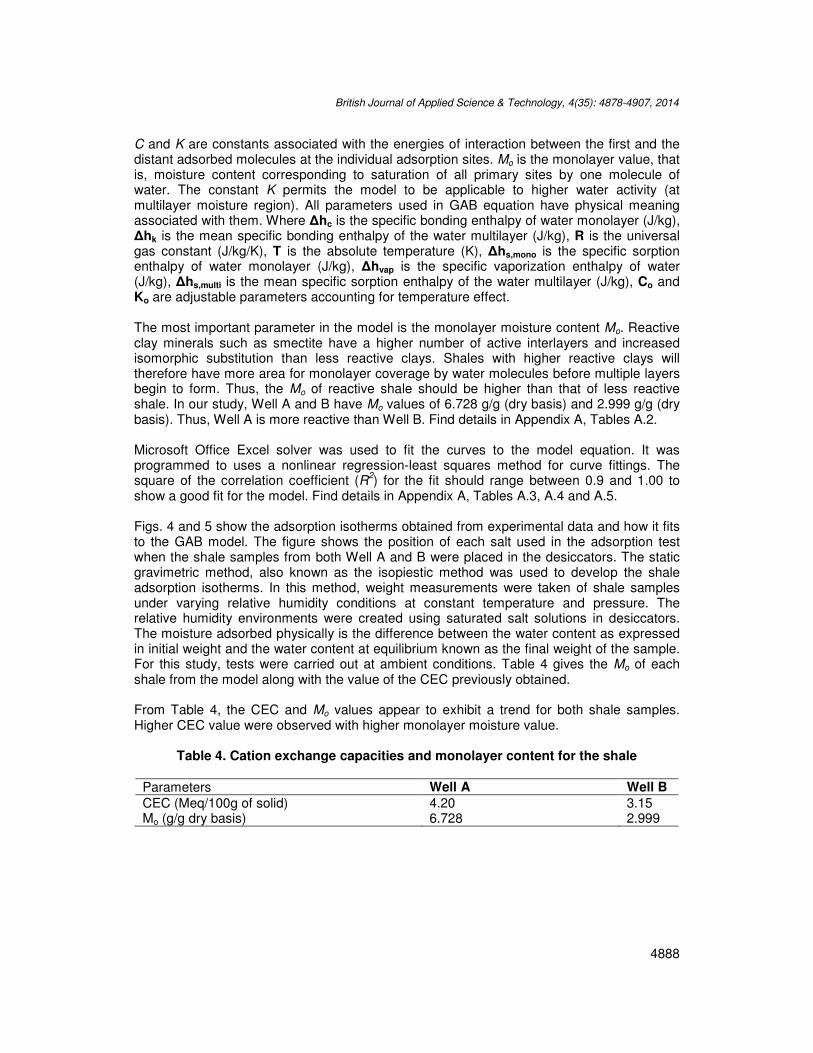
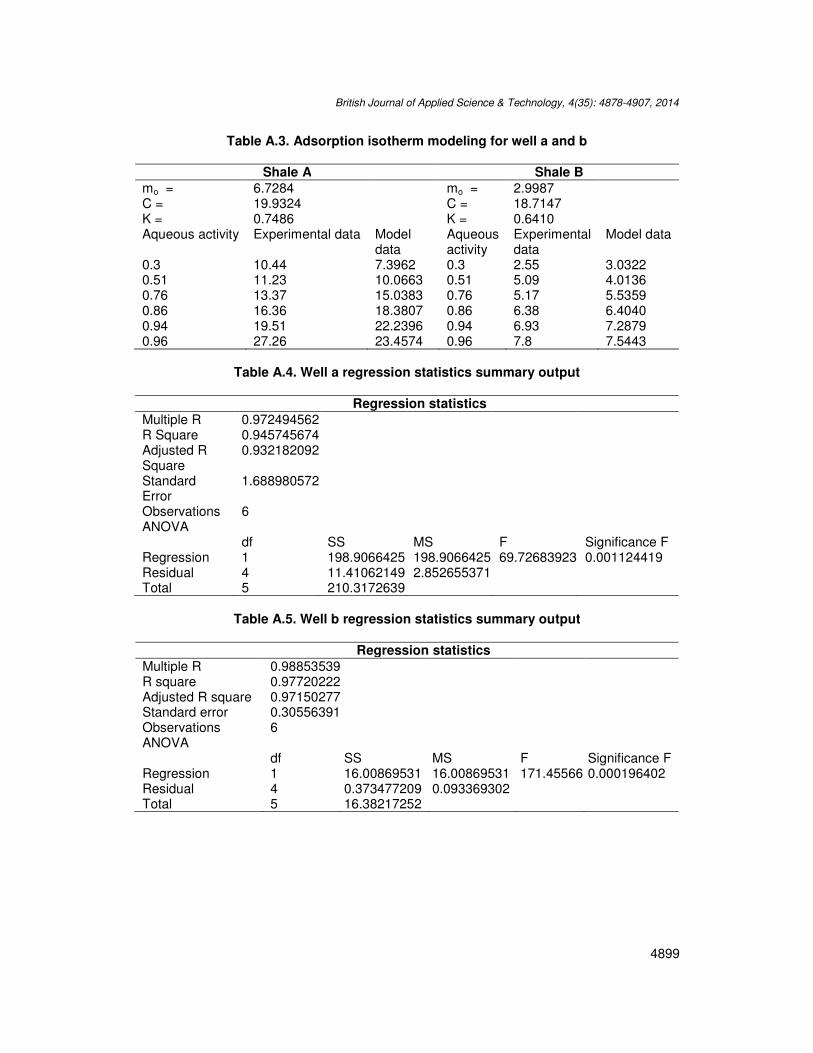
C and K are constants associated with the energies of interaction between the first and the distant adsorbed molecules at the individual adsorption sites. Mo is the monolayer value, that is, moisture content corresponding to saturation of all primary sites by one molecule of water. The constant K permits the model to be applicable to higher water activity (at multilayer moisture region). All parameters used in GAB equation have physical meaning associated with them. Where ∆hc is the specific bonding enthalpy of water monolayer (J/kg), ∆hk is the mean specific bonding enthalpy of the water multilayer (J/kg), R is the universal gas constant (J/kg/K), T is the absolute temperature (K), ∆hs,mono is the specific sorption enthalpy of water monolayer (J/kg), ∆hvap is the specific vaporization enthalpy of water (J/kg), ∆hs,multi is the mean specific sorption enthalpy of the water multilayer (J/kg), Co and Ko are adjustable parameters accounting for temperature effect. The most important parameter in the model is the monolayer moisture content Mo. Reactive clay minerals such as smectite have a higher number of active interlayers and increased isomorphic substitution than less reactive clays. Shales with higher reactive clays will therefore have more area for monolayer coverage by water molecules before multiple layers begin to form. Thus, the Mo of reactive shale should be higher than that of less reactive shale. In our study, Well A and B have Mo values of 6.728 g/g (dry basis) and 2.999 g/g (dry basis). Thus, Well A is more reactive than Well B. Find details in Appendix A, Tables A.2. Microsoft Office Excel solver was used to fit the curves to the model equation. It was programmed to uses a nonlinear regression-least squares method for curve fittings. The square of the correlation coefficient (R
2) for the fit should range between 0.9 and 1.00 to
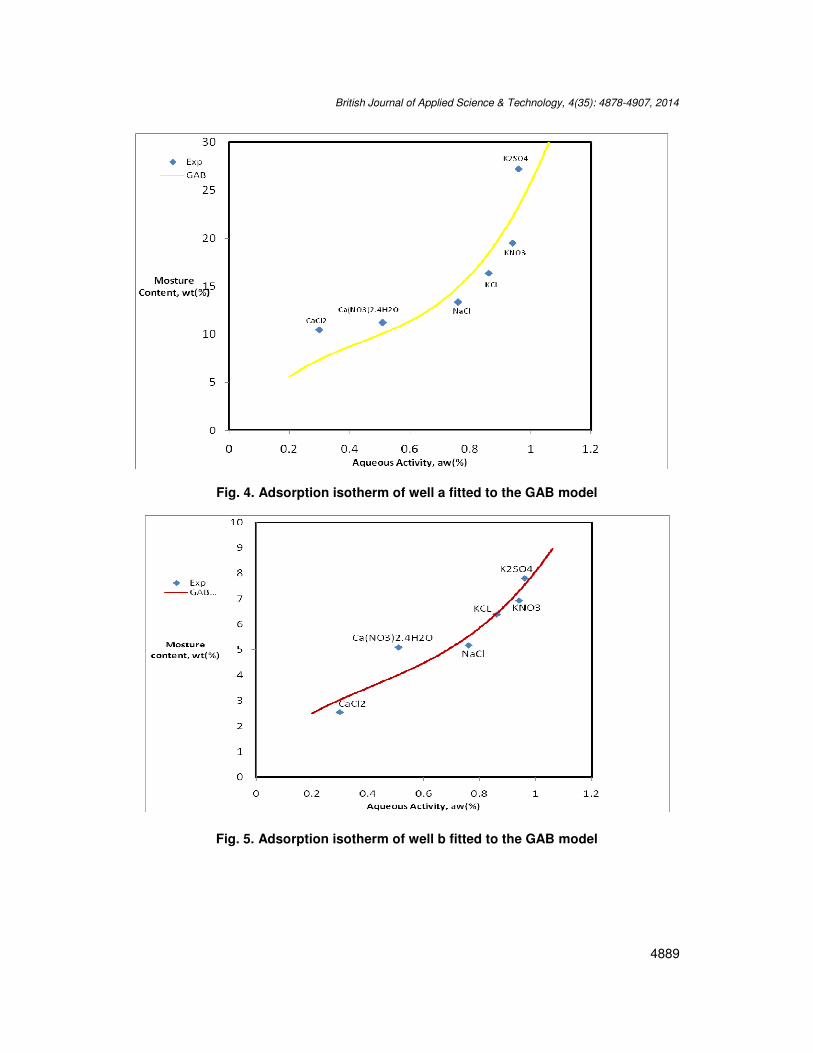
show a good fit for the model. Find details in Appendix A, Tables A.3, A.4 and A.5. Figs. 4 and 5 show the adsorption isotherms obtained from experimental data and how it fits to the GAB model. The figure shows the position of each salt used in the adsorption test when the shale samples from both Well A and B were placed in the desiccators. The static gravimetric method, also known as the isopiestic method was used to develop the shale adsorption isotherms. In this method, weight measurements were taken of shale samples under varying relative humidity conditions at constant temperature and pressure. The relative humidity environments were created using saturated salt solutions in desiccators. The moisture adsorbed physically is the difference between the water content as expressed in initial weight and the water content at equilibrium known as the final weight of the sample. For this study, tests were carried out at ambient conditions. Table 4 gives the Mo of each shale from the model along with the value of the CEC previously obtained. From Table 4, the CEC and Mo values appear to exhibit a trend for both shale samples. Higher CEC value were observed with higher monolayer moisture value.
Table 4. Cation exchange capacities and monolayer content for the shale
Parameters Well A Well B
CEC (Meq/100g of solid) 4.20 3.15 Mo (g/g dry basis) 6.728 2.999
British Journal of Applied Science & Technology, 4(35): 4878-4907, 2014
4889
Fig. 4. Adsorption isotherm of well a fitted to the GAB model
Fig. 5. Adsorption isotherm of well b fitted to the GAB model
Galley Pr oof
British Journal of Applied Science & Technology, 4(35): 4878-4907, 2014
4890
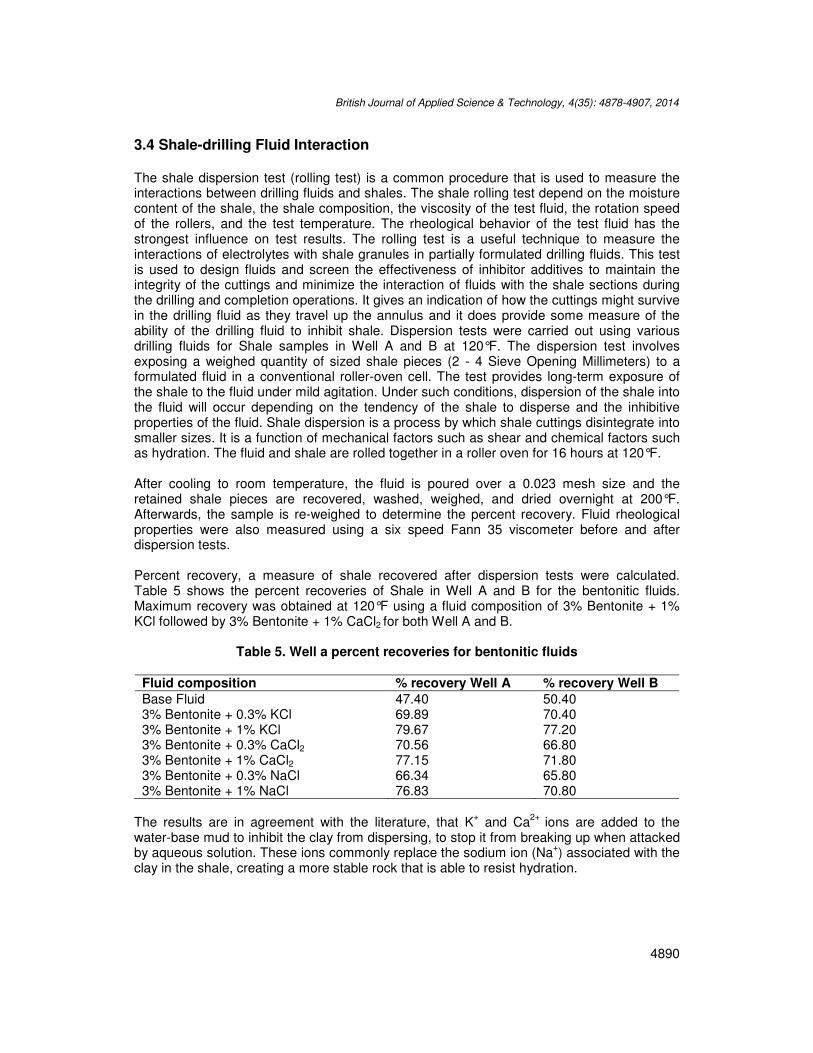
3.4 Shale-drilling Fluid Interaction The shale dispersion test (rolling test) is a common procedure that is used to measure the interactions between drilling fluids and shales. The shale rolling test depend on the moisture content of the shale, the shale composition, the viscosity of the test fluid, the rotation speed of the rollers, and the test temperature. The rheological behavior of the test fluid has the strongest influence on test results. The rolling test is a useful technique to measure the interactions of electrolytes with shale granules in partially formulated drilling fluids. This test is used to design fluids and screen the effectiveness of inhibitor additives to maintain the integrity of the cuttings and minimize the interaction of fluids with the shale sections during the drilling and completion operations. It gives an indication of how the cuttings might survive in the drilling fluid as they travel up the annulus and it does provide some measure of the ability of the drilling fluid to inhibit shale. Dispersion tests were carried out using various drilling fluids for Shale samples in Well A and B at 120°F. The dispersion test involves exposing a weighed quantity of sized shale pieces (2 - 4 Sieve Opening Millimeters) to a formulated fluid in a conventional roller-oven cell. The test provides long-term exposure of the shale to the fluid under mild agitation. Under such conditions, dispersion of the shale into the fluid will occur depending on the tendency of the shale to disperse and the inhibitive properties of the fluid. Shale dispersion is a process by which shale cuttings disintegrate into smaller sizes. It is a function of mechanical factors such as shear and chemical factors such as hydration. The fluid and shale are rolled together in a roller oven for 16 hours at 120°F. After cooling to room temperature, the fluid is poured over a 0.023 mesh size and the retained shale pieces are recovered, washed, weighed, and dried overnight at 200°F. Afterwards, the sample is re-weighed to determine the percent recovery. Fluid rheological properties were also measured using a six speed Fann 35 viscometer before and after dispersion tests. Percent recovery, a measure of shale recovered after dispersion tests were calculated. Table 5 shows the percent recoveries of Shale in Well A and B for the bentonitic fluids. Maximum recovery was obtained at 120°F using a fluid composition of 3% Bentonite + 1% KCl followed by 3% Bentonite + 1% CaCl2 for both Well A and B.
Table 5. Well a percent recoveries for bentonitic fluids
Fluid composition % recovery Well A % recovery Well B
Base Fluid 47.40 50.40 3% Bentonite + 0.3% KCl 69.89 70.40 3% Bentonite + 1% KCl 79.67 77.20 3% Bentonite + 0.3% CaCl2 70.56 66.80 3% Bentonite + 1% CaCl2 77.15 71.80 3% Bentonite + 0.3% NaCl 66.34 65.80 3% Bentonite + 1% NaCl 76.83 70.80
The results are in agreement with the literature, that K
+ and Ca
2+ ions are added to the
water-base mud to inhibit the clay from dispersing, to stop it from breaking up when attacked by aqueous solution. These ions commonly replace the sodium ion (Na
+) associated with the
clay in the shale, creating a more stable rock that is able to resist hydration.
British Journal of Applied Science & Technology, 4(35): 4878-4907, 2014
4891
The results show that the mud with high concentration inhibit the shale samples more from dispersion and this account for higher value in Percentage Recovery of these muds. The dispersion is a function of changes in structure of the shale matrix and in the bound and crystalline water caused by the hydration of the cores. Further analysis of the dispersion tests involved the measurement of the fluid rheology before and after the tests. Values of shear stress (τ) and shear rate (γ) were calculated using the following equations: For shear stress,
τ = 0.01066 x θi x N (4) Where,
τ = shear stress (lbf / ft2)
= dial reading at ith rpm
N = spring factor = 1 For shear rate,
γ = 1.703 x RPM (5)
Where,
γ = shear rate (1 / s) RPM = viscometer rotational speed
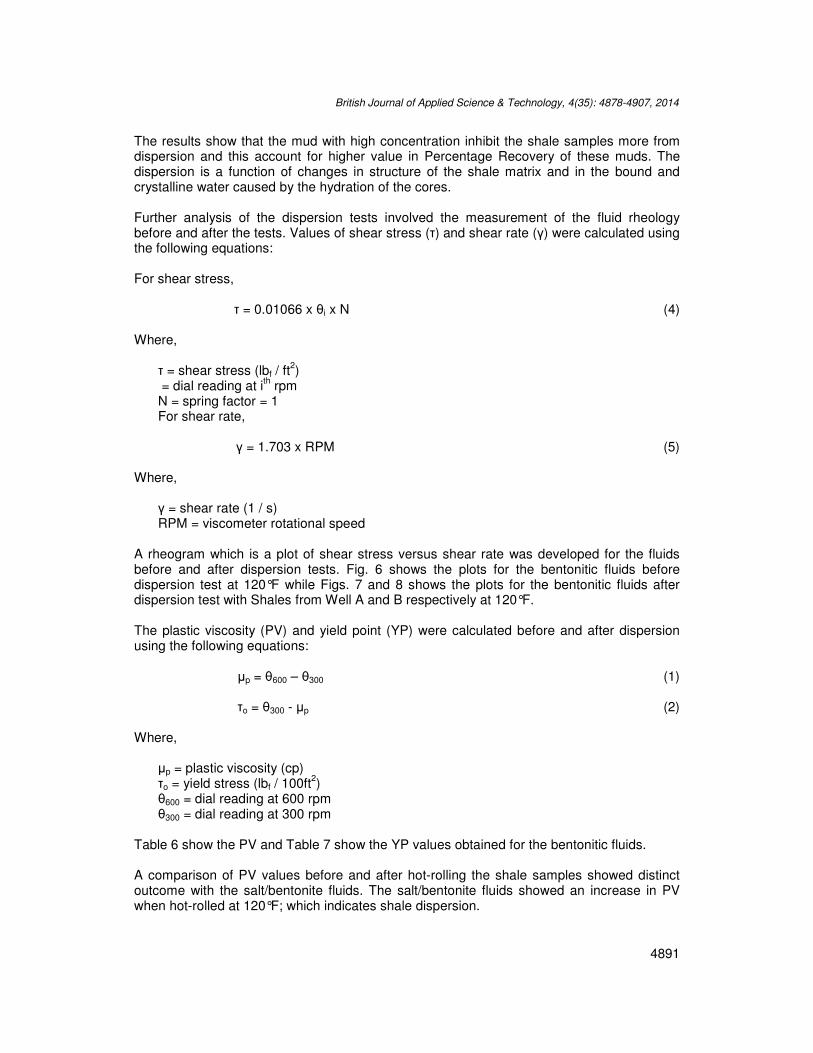
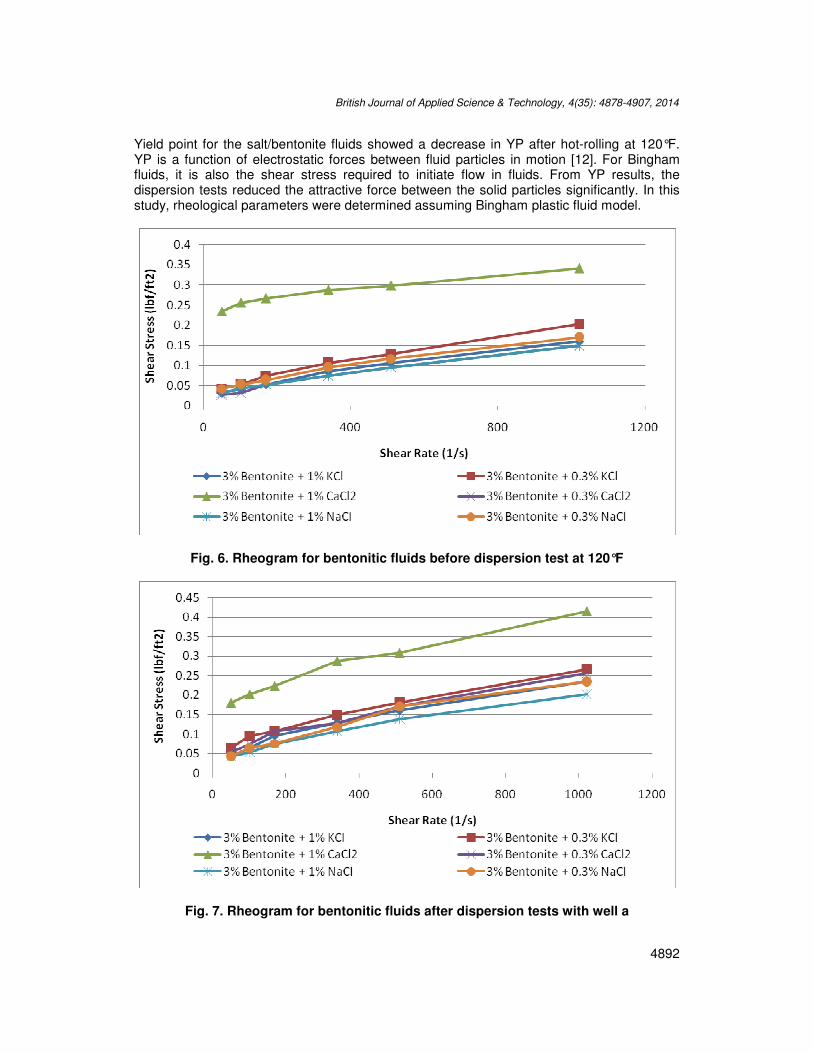
A rheogram which is a plot of shear stress versus shear rate was developed for the fluids before and after dispersion tests. Fig. 6 shows the plots for the bentonitic fluids before dispersion test at 120°F while Figs. 7 and 8 shows the plots for the bentonitic fluids after dispersion test with Shales from Well A and B respectively at 120°F. The plastic viscosity (PV) and yield point (YP) were calculated before and after dispersion using the following equations:
µp = θ600 – θ300 (1)
τo = θ300 - µp (2) Where,
µp = plastic viscosity (cp) τo = yield stress (lbf / 100ft
2)
θ600 = dial reading at 600 rpm θ300 = dial reading at 300 rpm
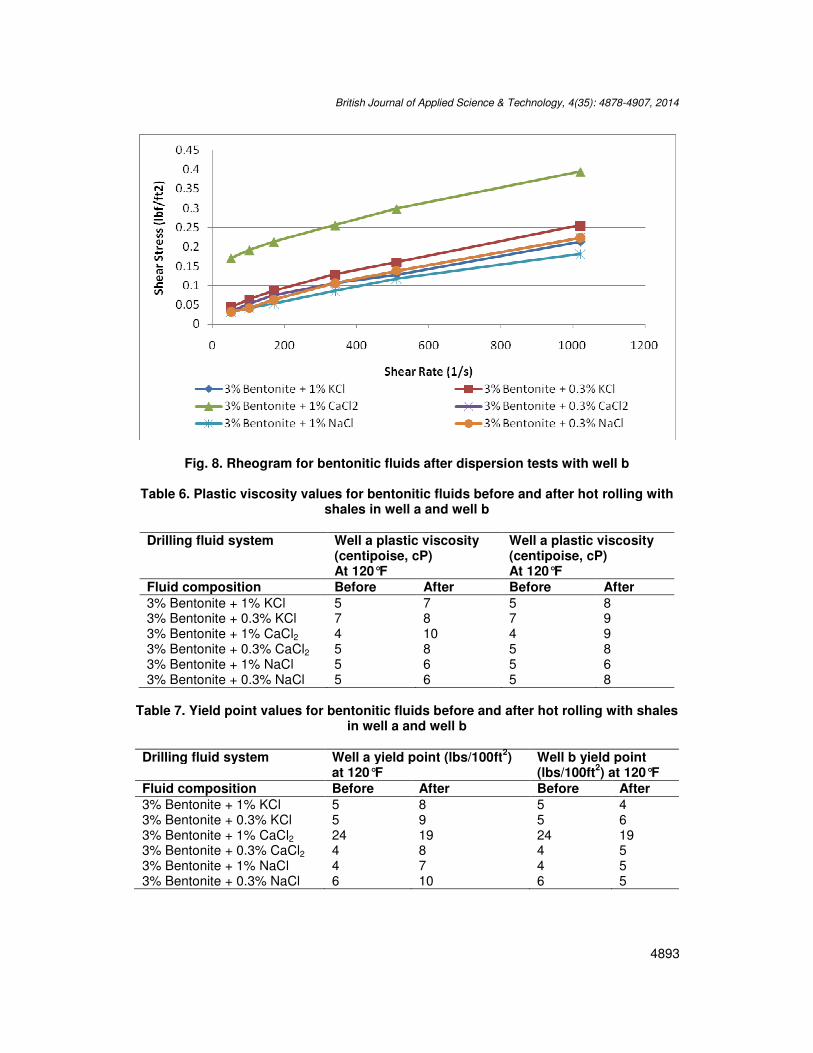
Table 6 show the PV and Table 7 show the YP values obtained for the bentonitic fluids. A comparison of PV values before and after hot-rolling the shale samples showed distinct outcome with the salt/bentonite fluids. The salt/bentonite fluids showed an increase in PV when hot-rolled at 120°F; which indicates shale dispersion.
Galley Pr oof
British Journal of Applied Science & Technology, 4(35): 4878-4907, 2014
4892
Yield point for the salt/bentonite fluids showed a decrease in YP after hot-rolling at 120°F. YP is a function of electrostatic forces between fluid particles in motion [12]. For Bingham fluids, it is also the shear stress required to initiate flow in fluids. From YP results, the dispersion tests reduced the attractive force between the solid particles significantly. In this study, rheological parameters were determined assuming Bingham plastic fluid model.
Fig. 6. Rheogram for bentonitic fluids before dispersion test at 120°F
Fig. 7. Rheogram for bentonitic fluids after dispersion tests with well a
British Journal of Applied Science & Technology, 4(35): 4878-4907, 2014
4893
Fig. 8. Rheogram for bentonitic fluids after dispersion tests with well b Table 6. Plastic viscosity values for bentonitic fluids before and after hot rolling with
shales in well a and well b
Drilling fluid system Well a plastic viscosity (centipoise, cP) At 120°F
Well a plastic viscosity (centipoise, cP) At 120°F
Fluid composition Before After Before After
3% Bentonite + 1% KCl 5 7 5 8 3% Bentonite + 0.3% KCl 7 8 7 9 3% Bentonite + 1% CaCl2 4 10 4 9 3% Bentonite + 0.3% CaCl2 5 8 5 8 3% Bentonite + 1% NaCl 5 6 5 6 3% Bentonite + 0.3% NaCl 5 6 5 8
Table 7. Yield point values for bentonitic fluids before and after hot rolling with shales
in well a and well b
Drilling fluid system Well a yield point (lbs/100ft2)
at 120°F Well b yield point (lbs/100ft
2) at 120°F
Fluid composition Before After Before After
3% Bentonite + 1% KCl 5 8 5 4 3% Bentonite + 0.3% KCl 5 9 5 6 3% Bentonite + 1% CaCl2 24 19 24 19 3% Bentonite + 0.3% CaCl2 4 8 4 5 3% Bentonite + 1% NaCl 4 7 4 5 3% Bentonite + 0.3% NaCl 6 10 6 5
Galley Pr oof
British Journal of Applied Science & Technology, 4(35): 4878-4907, 2014
4894
The percent recoveries shown can only be used as a comparison between the fluids represented in this study.
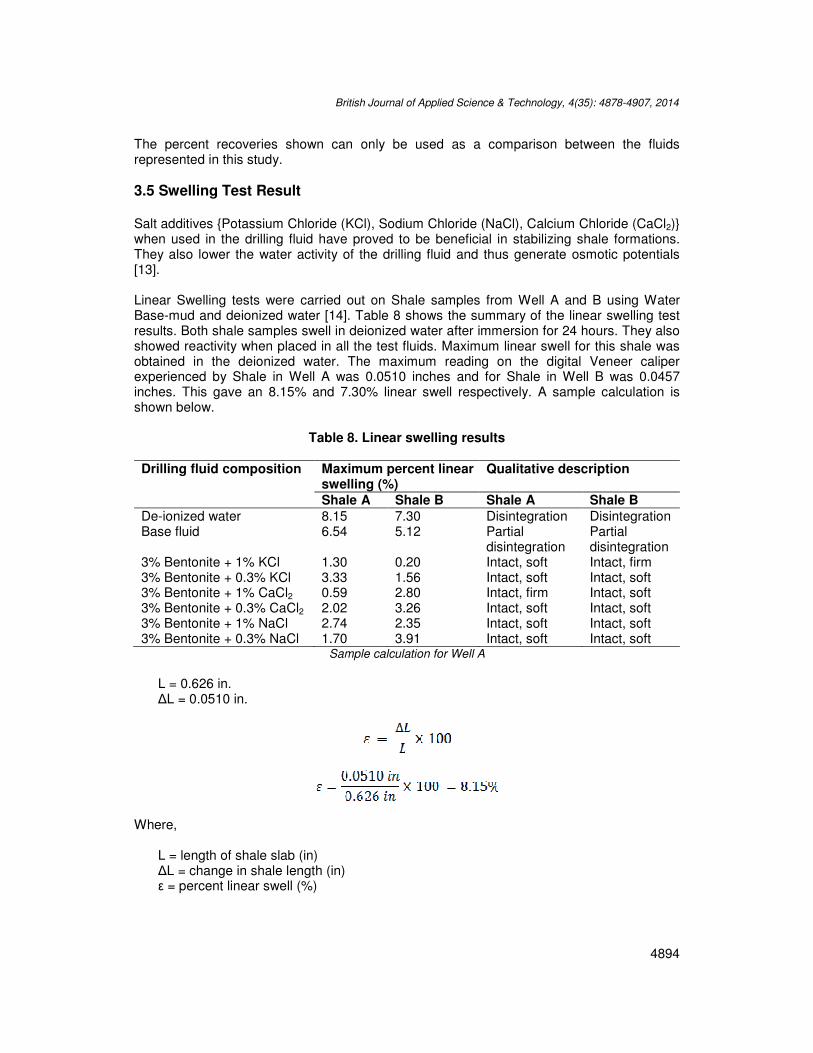
3.5 Swelling Test Result Salt additives {Potassium Chloride (KCl), Sodium Chloride (NaCl), Calcium Chloride (CaCl2)} when used in the drilling fluid have proved to be beneficial in stabilizing shale formations. They also lower the water activity of the drilling fluid and thus generate osmotic potentials [13]. Linear Swelling tests were carried out on Shale samples from Well A and B using Water Base-mud and deionized water [14]. Table 8 shows the summary of the linear swelling test results. Both shale samples swell in deionized water after immersion for 24 hours. They also showed reactivity when placed in all the test fluids. Maximum linear swell for this shale was obtained in the deionized water. The maximum reading on the digital Veneer caliper experienced by Shale in Well A was 0.0510 inches and for Shale in Well B was 0.0457 inches. This gave an 8.15% and 7.30% linear swell respectively. A sample calculation is shown below.
Table 8. Linear swelling results
Drilling fluid composition Maximum percent linear
swelling (%) Qualitative description
Shale A Shale B Shale A Shale B
De-ionized water 8.15 7.30 Disintegration Disintegration Base fluid 6.54 5.12 Partial
disintegration Partial disintegration
3% Bentonite + 1% KCl 1.30 0.20 Intact, soft Intact, firm 3% Bentonite + 0.3% KCl 3.33 1.56 Intact, soft Intact, soft 3% Bentonite + 1% CaCl2 0.59 2.80 Intact, firm Intact, soft 3% Bentonite + 0.3% CaCl2 2.02 3.26 Intact, soft Intact, soft 3% Bentonite + 1% NaCl 2.74 2.35 Intact, soft Intact, soft 3% Bentonite + 0.3% NaCl 1.70 3.91 Intact, soft Intact, soft
Sample calculation for Well A
L = 0.626 in. ∆L = 0.0510 in.
Where,
L = length of shale slab (in) ∆L = change in shale length (in) ε = percent linear swell (%)
British Journal of Applied Science & Technology, 4(35): 4878-4907, 2014
4895
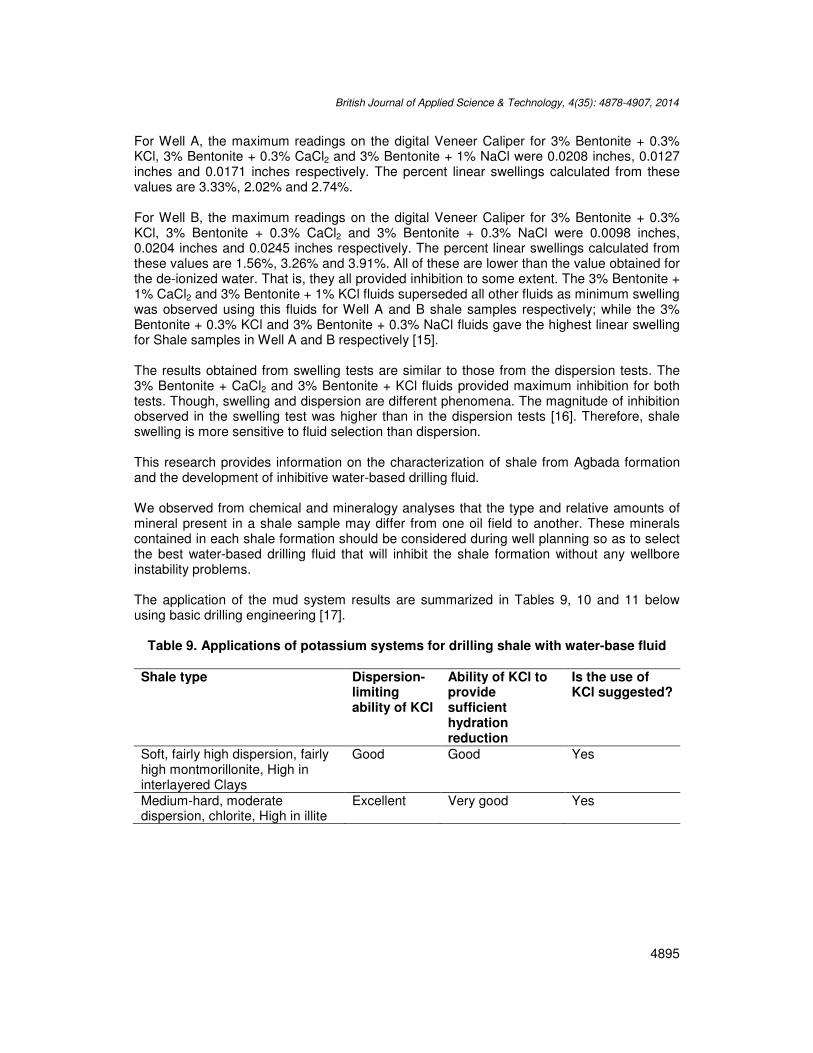
For Well A, the maximum readings on the digital Veneer Caliper for 3% Bentonite + 0.3% KCl, 3% Bentonite + 0.3% CaCl2 and 3% Bentonite + 1% NaCl were 0.0208 inches, 0.0127 inches and 0.0171 inches respectively. The percent linear swellings calculated from these values are 3.33%, 2.02% and 2.74%. For Well B, the maximum readings on the digital Veneer Caliper for 3% Bentonite + 0.3% KCl, 3% Bentonite + 0.3% CaCl2 and 3% Bentonite + 0.3% NaCl were 0.0098 inches, 0.0204 inches and 0.0245 inches respectively. The percent linear swellings calculated from these values are 1.56%, 3.26% and 3.91%. All of these are lower than the value obtained for the de-ionized water. That is, they all provided inhibition to some extent. The 3% Bentonite + 1% CaCl2 and 3% Bentonite + 1% KCl fluids superseded all other fluids as minimum swelling was observed using this fluids for Well A and B shale samples respectively; while the 3% Bentonite + 0.3% KCl and 3% Bentonite + 0.3% NaCl fluids gave the highest linear swelling for Shale samples in Well A and B respectively [15]. The results obtained from swelling tests are similar to those from the dispersion tests. The 3% Bentonite + CaCl2 and 3% Bentonite + KCl fluids provided maximum inhibition for both tests. Though, swelling and dispersion are different phenomena. The magnitude of inhibition observed in the swelling test was higher than in the dispersion tests [16]. Therefore, shale swelling is more sensitive to fluid selection than dispersion. This research provides information on the characterization of shale from Agbada formation and the development of inhibitive water-based drilling fluid. We observed from chemical and mineralogy analyses that the type and relative amounts of mineral present in a shale sample may differ from one oil field to another. These minerals contained in each shale formation should be considered during well planning so as to select the best water-based drilling fluid that will inhibit the shale formation without any wellbore instability problems. The application of the mud system results are summarized in Tables 9, 10 and 11 below using basic drilling engineering [17].
Table 9. Applications of potassium systems for drilling shale with water-base fluid
Shale type Dispersion-limiting ability of KCl
Ability of KCl to provide sufficient hydration reduction
Is the use of KCl suggested?
Soft, fairly high dispersion, fairly high montmorillonite, High in interlayered Clays
Good Good Yes
Medium-hard, moderate dispersion, chlorite, High in illite
Excellent Very good Yes
Galley Pr oof
British Journal of Applied Science & Technology, 4(35): 4878-4907, 2014
4896
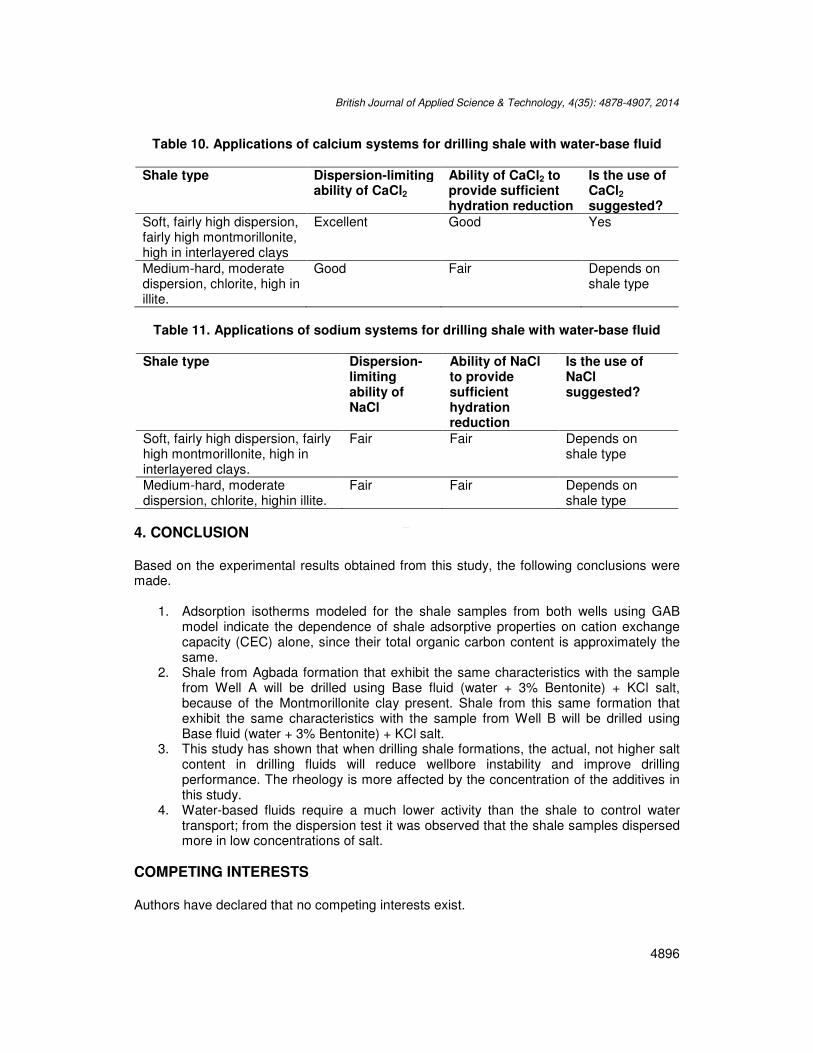
Table 10. Applications of calcium systems for drilling shale with water-base fluid
Shale type Dispersion-limiting ability of CaCl2
Ability of CaCl2 to provide sufficient hydration reduction
Is the use of CaCl2 suggested?
Soft, fairly high dispersion, fairly high montmorillonite, high in interlayered clays
Excellent Good Yes
Medium-hard, moderate dispersion, chlorite, high in illite.
Good Fair Depends on shale type
Table 11. Applications of sodium systems for drilling shale with water-base fluid
Shale type Dispersion-limiting ability of NaCl
Ability of NaCl to provide sufficient hydration reduction
Is the use of NaCl suggested?
Soft, fairly high dispersion, fairly high montmorillonite, high in interlayered clays.
Fair Fair Depends on shale type
Medium-hard, moderate dispersion, chlorite, highin illite.
Fair Fair Depends on shale type
4. CONCLUSION Based on the experimental results obtained from this study, the following conclusions were made.
1. Adsorption isotherms modeled for the shale samples from both wells using GAB model indicate the dependence of shale adsorptive properties on cation exchange capacity (CEC) alone, since their total organic carbon content is approximately the same.
2. Shale from Agbada formation that exhibit the same characteristics with the sample from Well A will be drilled using Base fluid (water + 3% Bentonite) + KCl salt, because of the Montmorillonite clay present. Shale from this same formation that exhibit the same characteristics with the sample from Well B will be drilled using Base fluid (water + 3% Bentonite) + KCl salt.
3. This study has shown that when drilling shale formations, the actual, not higher salt content in drilling fluids will reduce wellbore instability and improve drilling performance. The rheology is more affected by the concentration of the additives in this study.
4. Water-based fluids require a much lower activity than the shale to control water transport; from the dispersion test it was observed that the shale samples dispersed more in low concentrations of salt.
COMPETING INTERESTS Authors have declared that no competing interests exist.
British Journal of Applied Science & Technology, 4(35): 4878-4907, 2014
4897
REFERENCES 1. Chenevert ME. Shale alteration by water adsorption. Journal of Petroleum
Technology. Paper presented at SPE/ISRM 78162, Rock Mechanics Conference, Texas; 2002.
2. Oort EV. New flat-rheology Synthetic-Based mud for improved deep water drilling. Paper SPE 90987, presented at the SPE annual Technical conference and exhibition, Houston, Texas, USA; 2003.
3. Chenevert ME. Shale Control ith balanced activity oil muds, JPT Trans AIME. 1970;249:1309-1316.
4. Osisanya SO. Experimental studies of wellbore stability in shale formations, Ph.D Dissertation. The University of Texas at Austin; 1991.
5. Mody FK, Hale AH. A borehole stability model to couple the mechanics and chemistry of drilling fluid shale interaction. SPE/IADC 25728, SPE/IADC Drilling conference, Amsterdam; 1993.
6. Chenevert ME, Osisanya SO. Shale swelling at elevated temperature and pressure. Presented at the 33
rd Symposium in Rock Mechanics, Santa Fe, New Mexico; 1996.
7. Oort VE, Hale AH, Mody FK, Roy S. Critical parameters in modeling the chemical aspects of Borehole stability in shales and in designing improved water-based shale drilling fluids. SPE 28309, paper presented at the SPE annual conference, New Orleans; 1996.
8. O’Brien DE, Chenevert ME. Stabilizing sensitive shales with inhibited Potassium based drilling fluids. Journal of Petroleum Technology. 1973;255.
9. Ewy R, Morton E. Wellbore stability performance of water base mud additives. Journal of petroleum Technology; 2008.
10. Kehinde Adesoye. Shale characterization for evaluating shale-drilling fluid interaction. University of Oklahoma, MSc. Thesis; 2009.
11. Keijzer THJS, Kleingeld PJ, Loch JPG. Chemical osmosis in compacted clayey material and the prediction of water transport. Engineering Geology. 1999:53:151-159.
12. Roscoe Moss Company. Handbook of ground water development. New York, John Wiley and Sons. 1990;439.
13. O’Brien DE, Chenevert ME. Shale control with balanced activity oil continuous muds. Journal of Petroleum Technology; 1973.
14. Al-Awad NJ, Smart BGD. Characterization of shale-drilling fluid interaction mechanisms related to wellbore instability. J. King Saud Univ. Eng. Sci. 1996;8(2):187-215.
15. Osisanya SO. Practical Approach to solving wellbore instability problems. 50th
anniversary of the SPE Distinguished Lecturer program. 16. Yu M, Chenevert ME, Sharma MM. Chemical-mechanical wellbore instability model in
shales. Journal of Petroleum Science & Technology; 2002. 17. Bourgoyne AT, Millheim KK, Chenevert ME, Young FS. Applied drilling engineering.
2nd
ed. Society of petroleum Engineers, Callister, W.D; 1991.
Galley Pr oof
British Journal of Applied Science & Technology, 4(35): 4878-4907, 2014
4898
APPENDIX
Appendix A. Data Spread Sheets IUPAC classification of adsorption isotherms for gas-solid equilibria (after donohue1998)
Table A.1. Adsorption Isotherms
Water activity
WELL A WELL B
WeightInitial (g)
WeightFinal (g)
% difference
WeightInitial (g)
WeightFinal (g)
% difference
0 0.00 0.00 0.00 0.00 0.00 0.00 0.30 23.36 27.05 10.44 23.96 24.57 2.55 0.51 23.42 26.05 11.23 23.30 24.74 5.09 0.76 23.23 25.40 13.37 23.23 24.43 5.17 0.86 23.96 27.88 16.36 23.45 24.50 6.38 0.94 23.10 28.02 17.51 23.07 25.50 6.93 0.96 23.98 29.70 27.6 23.91 25.54 7.80
Table A.2. Total organic content
Shale sample
Crucible (g)
Crucible + sample before (g)
Sample before (g)
Crucible + sample after (g)
Sample after (g)
% TOC
Well A 25.346 32.754 7.480 32.012 6.666 10.02 Well B 26.670 34.155 7.480 33.360 6.690 10.62
British Journal of Applied Science & Technology, 4(35): 4878-4907, 2014
4899
Table A.3. Adsorption isotherm modeling for well a and b
Shale A Shale B
mo = 6.7284 mo = 2.9987 C = 19.9324 C = 18.7147 K = 0.7486 K = 0.6410 Aqueous activity Experimental data Model
data Aqueous activity
Experimental data
Model data
0.3 10.44 7.3962 0.3 2.55 3.0322 0.51 11.23 10.0663 0.51 5.09 4.0136 0.76 13.37 15.0383 0.76 5.17 5.5359 0.86 16.36 18.3807 0.86 6.38 6.4040 0.94 19.51 22.2396 0.94 6.93 7.2879 0.96 27.26 23.4574 0.96 7.8 7.5443
Table A.4. Well a regression statistics summary output
Regression statistics
Multiple R 0.972494562 R Square 0.945745674 Adjusted R Square
0.932182092
Standard Error
1.688980572
Observations 6 ANOVA df SS MS F Significance F Regression 1 198.9066425 198.9066425 69.72683923 0.001124419 Residual 4 11.41062149 2.852655371 Total 5 210.3172639
Table A.5. Well b regression statistics summary output
Regression statistics
Multiple R 0.98853539 R square 0.97720222 Adjusted R square 0.97150277 Standard error 0.30556391 Observations 6 ANOVA df SS MS F Significance F Regression 1 16.00869531 16.00869531 171.45566 0.000196402 Residual 4 0.373477209 0.093369302 Total 5 16.38217252
Galley Pr oof
British Journal of Applied Science & Technology, 4(35): 4878-4907, 2014
4900
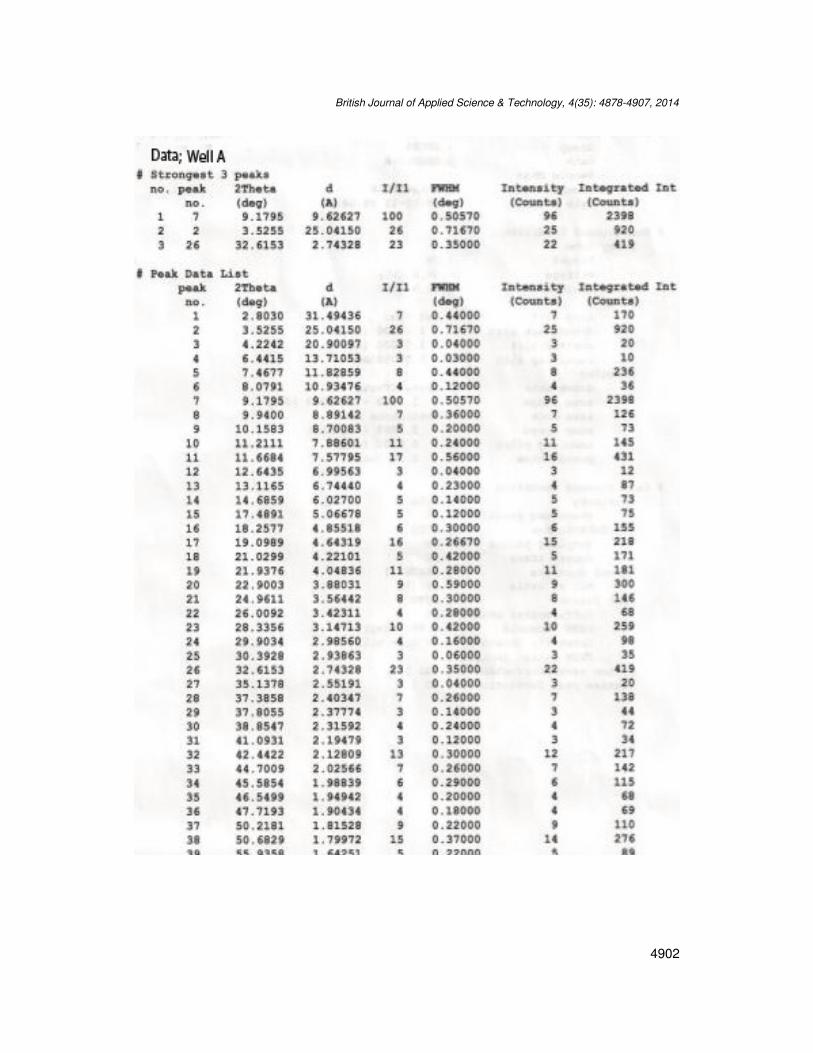
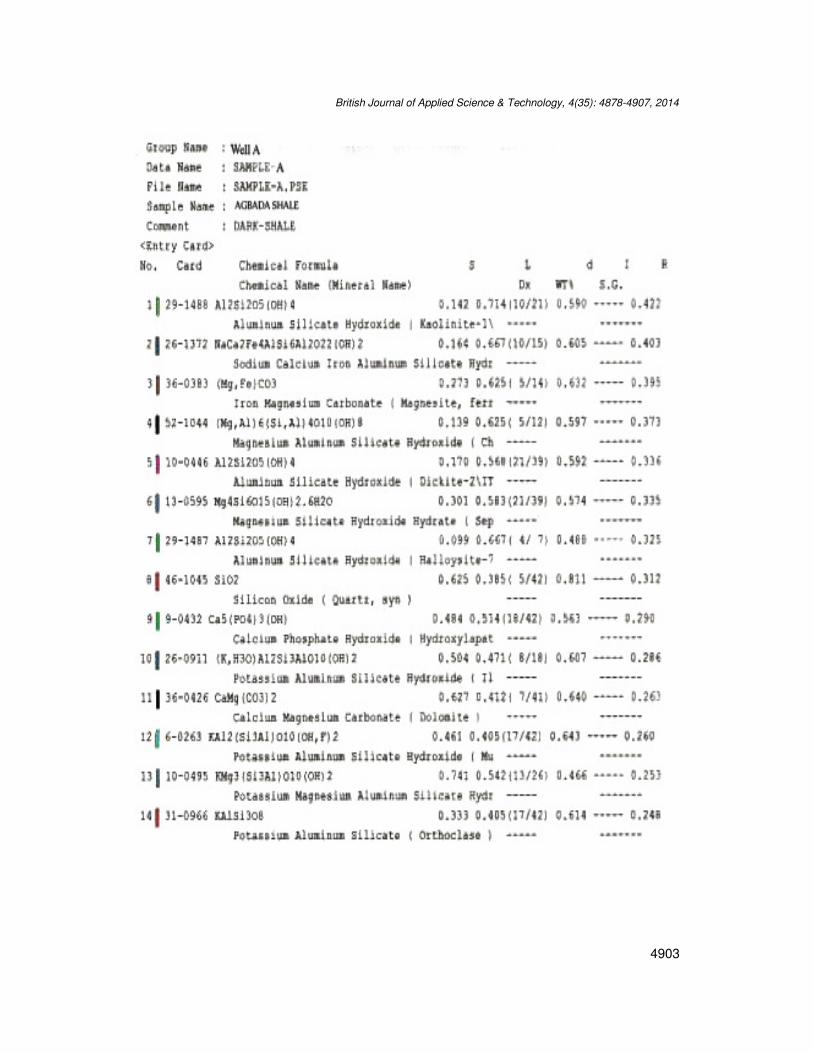
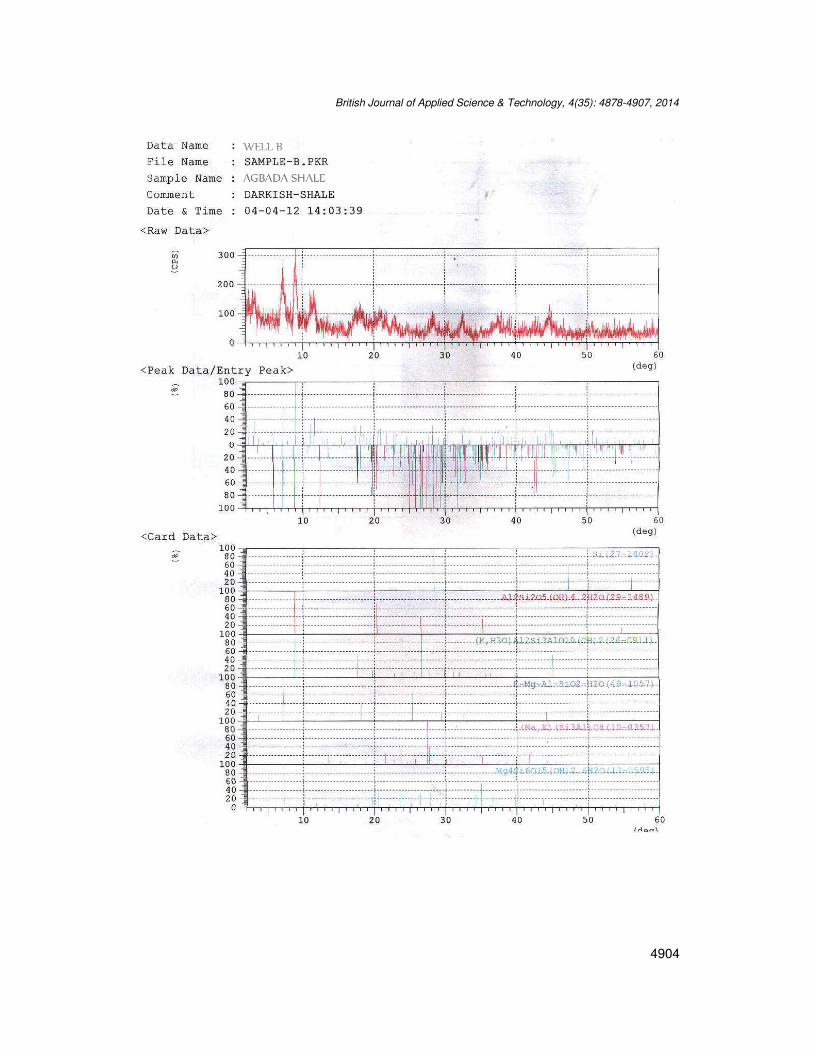
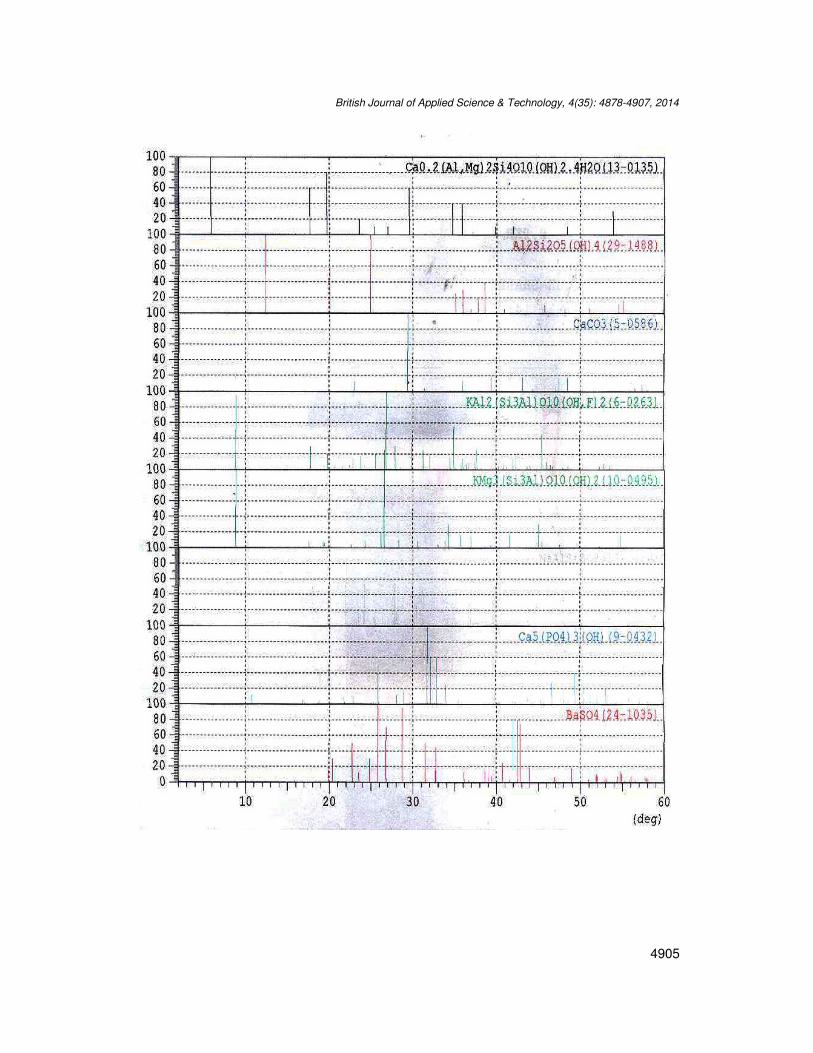
Appendix B – X-ray diffraction results
British Journal of Applied Science & Technology, 4(35): 4878-4907, 2014
4901
Galley Pr oof
British Journal of Applied Science & Technology, 4(35): 4878-4907, 2014
4902
British Journal of Applied Science & Technology, 4(35): 4878-4907, 2014
4903
Galley Pr oof
British Journal of Applied Science & Technology, 4(35): 4878-4907, 2014
4904
British Journal of Applied Science & Technology, 4(35): 4878-4907, 2014
4905
Galley Pr oof
British Journal of Applied Science & Technology, 4(35): 4878-4907, 2014
4906
British Journal of Applied Science & Technology, 4(35): 4878-4907, 2014
4907
________________________________________________________________________________________
© 2014 Emmanuel and Dosunmu; This is an Open Access article distributed under the terms of the Creative Commons Attribution License (http://creativecommons.org/licenses/by/3.0), which permits unrestricted use, distribution, and reproduction in any medium, provided the original work is properly cited.
Peer-review history: The peer review history for this paper can be accessed here:
http://www.sciencedomain.org/review-history.php?iid=691&id=5&aid=6274