experimental analysis of an original type … · 2010-01-13 · basic idea was to construct and...
TRANSCRIPT

FACTA UNIVERSITATIS Series: Architecture and Civil Engineering Vol. 7, No 1, 2009, pp. 43 - 55 DOI: 10.2298/FUACE0901043V
EXPERIMENTAL ANALYSIS OF AN ORIGINAL TYPE OF STEEL SPACE TRUSS NODE JOINT
UDC 624.014.2:024.075.24:64.072.22(045)
Todor Vacev1, Srđan Kisin2, Slobodan Ranković3 1MIN Institute Niš, Serbia, E-mail: [email protected]
2Faculty of Technical Sciences, Novi Sad, Serbia, E-mail: [email protected] 3Faculty of Civil Engineering and Architecture, Niš, Serbia, E-mail: [email protected]
Abstract. In the paper is presented experimental analysis of an original type of node joint for a steel space truss. The joint sample was loaded by spatial set of forces that simulate real condition of the structure with eight balanced member forces (4 chord and 4 diagonal members), up to structure failure. It was realized in a specially designed test facility. Tested node joint samples were made in real scale, according to the model originated after FE analysis and optimization. Basic idea was to construct and test a node joint that can be made in average technology conditions, without special tools and requirements. Besides, results of a stress-strain FE analysis are presented and comparison of the two analyses is given for the most critical regions of the node joint. Values of measured and calculated strains across model samples and characteristic measuring points are presented.
Key words: Experimental analysis, node joint, space truss, finite element analysis
1. INTRODUCTION
Space trusses, especially the steel ones, belong into cost-effective and wide used structures, with variety of advantages regarding other structural systems (plane trusses, beams and frames, plates and shells, etc.). The node joint figures as a dominant element in its assemblage, and features of the system mainly depend of it. There are many accepted and largely patented node joints (MERO [12], NODUS [2], UNISTRUT [8], etc.). Aim of this research was to design as simple and cost-effective node joint as possible, fulfilling the conditions of bearing capacity and functionality. Thereat, optimization of mass and stress-strain state should be performed, so that manufacturing demands stay at minimum.
Practical test of behaviour of such structure type may be done in real STS1 [3], [4], [5], [6], [10], or, more often, using laboratory methods [5], [6], [7], [9], [11]. In this case,
Received January 30,2009 1 Space truss structure
T. VACEV, S. KISIN, S. RANKOVIĆ 44
one STS joint was isolated and subjected to equal axial forces in all available connec-tions, for spatially disposed members. The test facility and experimental procedure were aimed to represent as truly as possible the real conditions of loading and bolt connections of the node joint together with the members. However, in real conditions there are many factors that cannot be predicted with certainty, such are: imperfections in material and connections, imprecision of shape and dimensions, and uneven bearing in bolt connections.
2. CHARACTERISTICS OF THE TESTED NODE JOINT
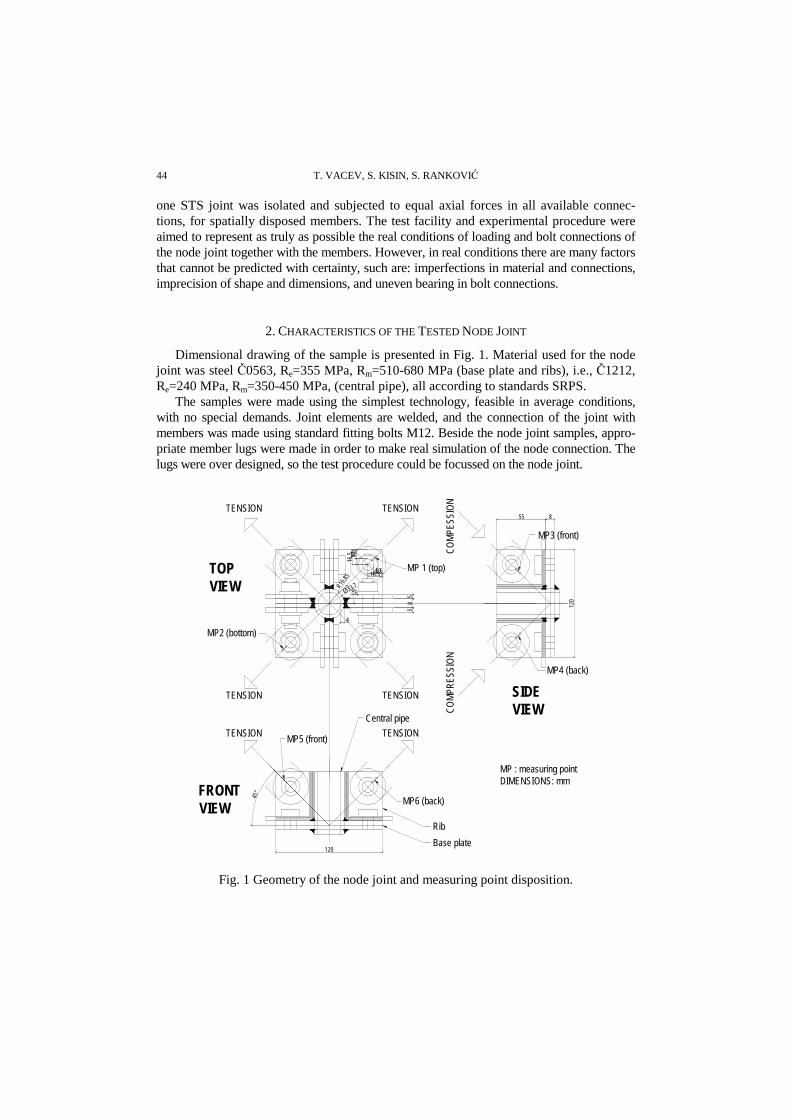
Dimensional drawing of the sample is presented in Fig. 1. Material used for the node joint was steel Č0563, Re=355 MPa, Rm=510-680 MPa (base plate and ribs), i.e., Č1212, Re=240 MPa, Rm=350-450 MPa, (central pipe), all according to standards SRPS.
The samples were made using the simplest technology, feasible in average conditions, with no special demands. Joint elements are welded, and the connection of the joint with members was made using standard fitting bolts M12. Beside the node joint samples, appro-priate member lugs were made in order to make real simulation of the node connection. The lugs were over designed, so the test procedure could be focussed on the node joint.
TOPVIEW 45°
6.51016.5
6.51016
.5
R16.8
5
Ø33.7
TENSION TENSION
TENSION TENSION
TENSION TENSION
COMP
ESSI
ONCO
MPRE
SSIO
N
SIDEVIEW
FRONTVIEW
MP 1 (top)
MP2 (bottom)
MP3 (front)
MP4 (back)
MP5 (front)
MP6 (back)
MP : measuring pointDIMENSIONS: mm
120
120
55 8
58
5
Base plate
Central pipe
4
Rib
45°
Fig. 1 Geometry of the node joint and measuring point disposition.

Experimental Analysis of an Original Type of Steel Space Truss Node Joint 45
3. EXPERIMENTAL SET-UP
Disposition of the test facility with appropriate auxiliary devices is presented in Fig. 2. The test facility is consisted of a horizontal octagonal ring and two mutually orthogonal vertical semi-octagonal rings. In such way, application of STS member forces in required directions was enabled. Conceptually, the test facility represents half of a sphere in whose centre is placed the node joint, where all forces of one node of an imagined STS con-verge. The test facility was equipped with devices specially intended for application of tension forces (Fig. 2b). Load application was obtained using a hydraulic jack with ca-pacity of 8x100 kN, and force application was registered by dynamometer (Fig. 2b, c).
Fig. 2. a) Disposition of the test facility b) auxiliary device and operating cylinder of the
hydraulic jack; c) detail of the position of the jack cylinder and the dynamometer.
Four samples were tested, all with identical load constellation: all horizontal (chord) members tensioned, two diagonals tensioned, and two compressed. Thus the samples were subjected dominantly to tension forces, and that represents a more unfavourable case, ac-cording to the FE analysis. Applied forces were theoretically balanced, which was con-firmed during the experiment. Disposition of the measuring points on samples was made based on FE analysis, and it is presented in Fig. 1. High calculated stress gradients around the bolt holes represented a complicating condition for measuring due to the small dimen-sions of the samples, although an effort was made to encompass those phenomena as well as possible choosing the measuring point locations and applied strain gage base length. The testing regime had static character, which was in accordance with exploiting condi-tions for the STS. Load increment was 5 kN, and maximum values of the applied forces across samples were 76, 55, 65, 70 kN (for sample 1, 2, 3, 4, respectively). Measuring of strains in characteristic points was obtained using strain gages with base length of 3 mm (type: HBM LY 3/120), using an adequate adhesive (Z-70). The data were registered by measuring and acquisition system HBM SPIDER 8, along with use of a PC computer and CATMAN software. The results were processed by MS EXCELL software, which gave the force-strain correlation.
c a
b

T. VACEV, S. KISIN, S. RANKOVIĆ 46
It must be noticed that the position of the sample No. 1 in the test facility deviated of the generally planned, regarding the disposition of the strain gages and member forces: namely, the node joint was rotated around its vertical axis (central pipe) by 90°. Thus the holes on the ribs scheduled for tension were compressed, and vice versa. Therefore the strain gages on the joint ribs measured strains in the bolt hole part "behind" the force, i.e., practically the least stressed parts of the holes. This was a check and a confirmation of the assumption that stress and strain concentrations were maximal in the part of the bolt hole in the force direction and minimal on the opposite side of the hole.
4. TEST RESULTS
For the illustration of the testing progress and results, the sample No. 4 was chosen as a representative. Applied forces for this sample were in range of 0-70 kN. The diagram force-strain is presented in Fig. 3. During the test, the strain gage at MP2 failed, due to a physical damage.
JOINT No. 4 - STRAIN DIAGRAMS
-8500-8000-7500-7000-6500-6000-5500-5000-4500-4000-3500-3000-2500-2000-1500-1000
-5000
5001000
0
500
1000
1500
2000
2500
3000
3500
4000
4500
5000
5500
6000
6500
7000
7500
FORCE (daN)
MIC
RO
-STR
AIN
S
MP1 MP3 MP4 MP5 MP6 Fig. 3 Joint sample No. 4. Force-strain diagram.
One may notice that the deformations of the structure, and so the measured strains are not uniformly distributed across measuring points. Reason for this is because all members, i.e., bolt connections and corresponding measuring points did not accept and transfer the applied load simultaneously. All of this is consequence of the relative imperfection of the node joint, the connections, and the test facility itself, which did not possess the ability of precise centring in space.
The diagram flow shows two distinctive segments – the first one, with slower rate, which approximately corresponds to the linear domain, and the second, with faster increase of strains, which corresponds to the nonlinear, i.e., plastic domain. Behaviour of the other samples generally follows the same pattern with deviations of specific measuring points, either because of failure of some strain gages, or because of non-uniform engagement of all connections.

Experimental Analysis of an Original Type of Steel Space Truss Node Joint 47
In the Fig. 4a is visible the difference in the degree of deformation (ovalization) of the bolt connections, i.e., holes on the base plate, though all members were tensioned by equal forces in two mutually orthogonal directions. This is a consequence of the already mentioned imperfection in load transfer. In the Fig. 4b and 4c essentially the same phenomenon is depicted, while here one pair of members (holes) is compressed (Fig. 4b), and the other tensioned (Fig. 4c). In one of the tensioned holes on the rib rupture occurred, at force of 70 kN (Fig. 4c), which leaded to the conclusion that the case of tensioned stressing was critical in such kind of connection.
Fig. 4 Sample No. 4 after testing: a) base plate; b) compressed ribs; c) tensioned ribs; d) rupture of the joint.
Disposition of the measuring points on the joint and values of bolt hole deformations are given in Fig. 5. One may notice significant elongation (ovalization) at all holes in the force direction. Note: half-cylinders in the bolt holes are fictional and they served in the FE analysis for load application.
Fig. 5 Sample no. 4. Measuring points in the model and measured deformations
of the bolt holes [mm]. Legend: ∅|| = hole diameter parallel to the force direction; ∅⊥ = hole diameter orthogonal to the force direction.
a
b
c d
∅|| = 15.6 ∅⊥ = 13.0
MP3(front) ∅|| = 13.5 ∅⊥ = 13.0
MP1(top) ∅|| = 14.7 ∅⊥ = 13.1
∅|| = 15.6 ∅⊥ = 13.2
MP2(bottom) ∅|| = 14.5 ∅⊥ = 13.2
MP5(front) ∅|| = 16.1 ∅⊥ = 13.3
MP6(back) ∅|| = kidanje ∅⊥ = (13.3)
MP4(back) ∅|| = 13.5 ∅⊥ = 13.4
T. VACEV, S. KISIN, S. RANKOVIĆ 48
5. FINITE ELEMENT ANALYSIS RESULTS
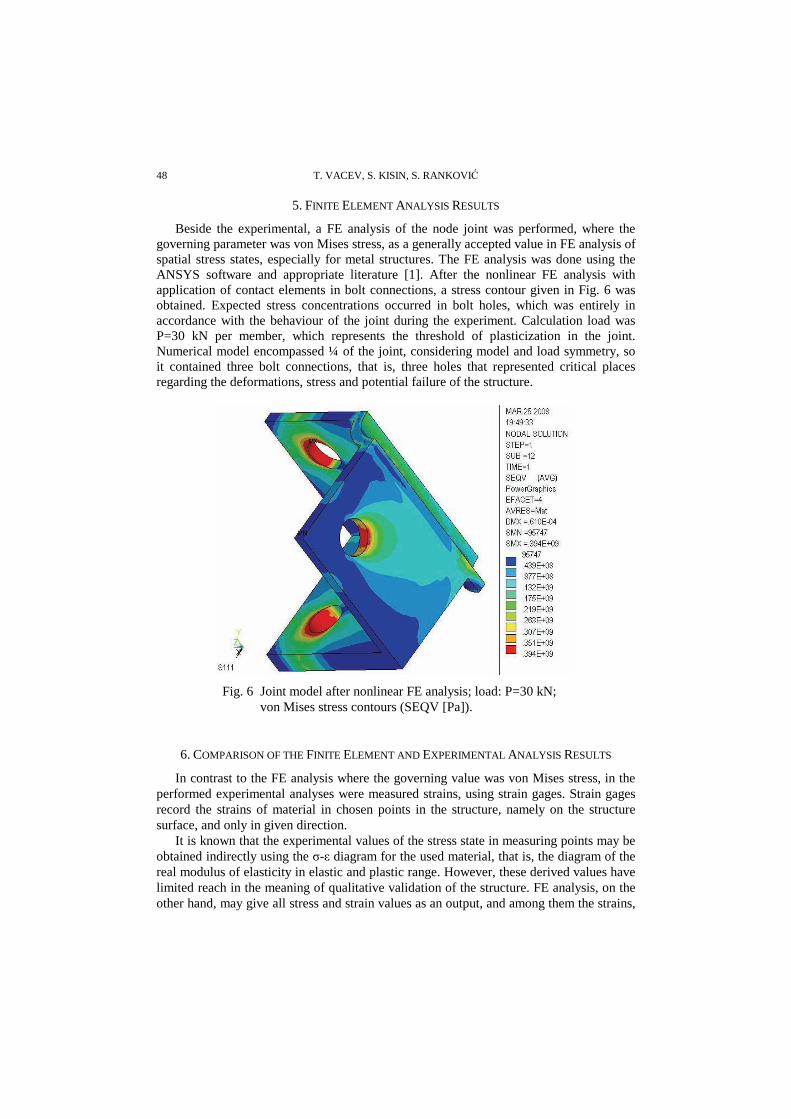
Beside the experimental, a FE analysis of the node joint was performed, where the governing parameter was von Mises stress, as a generally accepted value in FE analysis of spatial stress states, especially for metal structures. The FE analysis was done using the ANSYS software and appropriate literature [1]. After the nonlinear FE analysis with application of contact elements in bolt connections, a stress contour given in Fig. 6 was obtained. Expected stress concentrations occurred in bolt holes, which was entirely in accordance with the behaviour of the joint during the experiment. Calculation load was P=30 kN per member, which represents the threshold of plasticization in the joint. Numerical model encompassed ¼ of the joint, considering model and load symmetry, so it contained three bolt connections, that is, three holes that represented critical places regarding the deformations, stress and potential failure of the structure.
Fig. 6 Joint model after nonlinear FE analysis; load: P=30 kN;
von Mises stress contours (SEQV [Pa]).
6. COMPARISON OF THE FINITE ELEMENT AND EXPERIMENTAL ANALYSIS RESULTS
In contrast to the FE analysis where the governing value was von Mises stress, in the performed experimental analyses were measured strains, using strain gages. Strain gages record the strains of material in chosen points in the structure, namely on the structure surface, and only in given direction.
It is known that the experimental values of the stress state in measuring points may be obtained indirectly using the σ-ε diagram for the used material, that is, the diagram of the real modulus of elasticity in elastic and plastic range. However, these derived values have limited reach in the meaning of qualitative validation of the structure. FE analysis, on the other hand, may give all stress and strain values as an output, and among them the strains,

Experimental Analysis of an Original Type of Steel Space Truss Node Joint 49
too. It is significant that strains in the FE analysis may be tracked continuously, from the elastic domain up to the full plasticization, and across the whole volume of the structure, also. Due to the cited reasons, strain as a common and governing value was established for the comparative analysis of calculated and experimental, that is, measured parameters.
In the following text are given presentations for every of the three joint holes that corre-spond to the measuring points from the experiment (base plate, compressed rib, tensioned rib). For every measuring point a local coordinate system was established, where the princi-pal direction of the local coordinate axis (X) was parallel to the member force direction.
For the purpose of comparison of calculated and experimental model, a new FE analysis was done, with incremental load increase of 5 kN, which corresponded to the load increase during the experiment, all up to the final value of 90 kN. In the following tables are presented results of this analysis for load values of 30 and 60 kN, in the measuring points MP1/MP2 (base plate), MP3/MP4 (compressed rib); MP5/MP6 (tensioned rib) - (tables T1, T2, T3, respectively). Contour presentations of the results are given for the elastic and plastic strain component, as well as for the resultant – total strain. Extreme strain values of in the legends are negative (compression), which means that in the critical zones compacting of material occurs.
In the Table T1 are presented calculated strains from the FE analysis, and in the Fig. 7 is presented diagram of the force-strain relation from the experimental analysis, for the holes on the base plate (measuring point MP1), for all the four examined joints.
Table 1. Calculated strains in the vicinity of the hole on the base plate (MP1, MP2)
P(kN) Elastic strain Plastic strain Total strain
30
60
Comparing the results from the diagrams we conclude that the shape of the experi-mental curves is globally very similar to the calculated one. Quantitatively, measured val-ues deviated more or less from the calculated (strains of the joint No. 2 are almost identi-cal to the calculated). Further, one may notice that measured values of strains are almost always lower than the calculated ones, considering the absolute value. This has a favour-able conclusion as a consequence: numerical method gives greater values of strains, that is, deformations, thus the FE analysis of the structure is on the safe side. In other words, the real structure shows greater bearing capacity than the calculated one.

T. VACEV, S. KISIN, S. RANKOVIĆ 50
MEASURED VS. CALCULATED STRAINS - MEASURING PT. MP1
-12000-11500-11000-10500-10000-9500-9000-8500-8000-7500-7000-6500-6000-5500-5000-4500-4000-3500-3000-2500-2000-1500-1000
-5000
500
0
500
1000
1500
2000
2500
3000
3500
4000
4500
5000
5500
6000
6500
7000
FORCE (daN)
MIC
RO
-STR
AIN
S
MP1 - JOINT 1 MP1-JOINT 2 MP1- JOINT 3 MP1-JOINT 4 CALCULATED STRAINS Fig. 7 Comparative presentation of the force-strain diagram of the calculated
and measured values (holes on the base plate - MP1).
There follows comparison of the calculated and measured strains for the holes on the compressed rib (Table 2, Fig. 8, 9), that is, measuring points MP3/MP4, again for all the four examined joints. Notices and conclusions are very similar to those for the holes on the base plate. Here too, the shapes of the experimental curves are alike to the calculated ones, for the samples No. 2 and 4. The results for the sample No. 1 were not valid due to the reasons explained above.
Table 2. Calculated strains in the vicinity of the hole on the compressed rib (MT3, MT4) P(kN) Elastic strain Plastic strain Total strain
30
60
Here we must remark that the strain gage in measuring point MP3 showed a reversible course in one segment – decrease of strains during the force increase. Such anomaly may only be effect of irregular position of the assemblage member-lug-joint, i.e., correspond-

Experimental Analysis of an Original Type of Steel Space Truss Node Joint 51
ing member of the test facility was not fully engaged in load transfer. All this is again in favour of the already presented notice about imperfections in the whole system.
MEASURED VS. CALCULATED STRAINS - MEASURING PT. MP3
-12500-12000-11500-11000-10500-10000
-9500-9000-8500-8000-7500-7000-6500-6000-5500-5000-4500-4000-3500-3000-2500-2000-1500-1000-500
0500
0
500
1000
1500
2000
2500
3000
3500
4000
4500
5000
5500
6000
6500
7000
7500
8000
FORCE (daN)
MIC
RO
-STR
AIN
S
MP3 - JOINT 1 MP3-JOINT 2 MP3- JOINT 3 MP3-JOINT 4 CALCULATED STRAINS Fig. 8 Comparative presentation of the force-strain diagram of the calculated
and measured values (holes on the compressed rib – MP3).
MEASURED VS. CALCULATED STRAINS - MEASURING PT. MP4
-12500-12000-11500-11000-10500-10000
-9500-9000-8500-8000-7500-7000-6500-6000-5500-5000-4500-4000-3500-3000-2500-2000-1500-1000
-5000
500
0
500
1000
1500
2000
2500
3000
3500
4000
4500
5000
5500
6000
6500
7000
7500
8000
FORCE (daN)
MIC
RO
-STR
AIN
S)
MP4 - JOINT 1 MP4-JOINT 2 MP4- JOINT 3 MP4-JOINT 4 CALCULATED STRAINS Fig. 9 Comparative presentation of the force-strain diagram of the calculated
and measured values (holes on the compressed rib – MP4).
Quantitative analysis of the valid samples (No. 2 and 4) delivers similar results as in the holes on the base plate, so, here too the measured strain values are mainly greater than the calculated ones. We may say again that actual situation regarding the estimation of the bearing capacity of the joint is favourable: numerical method here too gives greater strain values, i.e., deformations, and therefore again the FE analysis of the structure is on the safe side.

T. VACEV, S. KISIN, S. RANKOVIĆ 52
Finally, in the Table 3 are given the values of the calculated strains, and in the Fig. 10 diagrams of the force-strain measurement for the holes on the tensioned rib, i.e., measuring points MP5/MP6, for all the four examined joints.
Table 3. Calculated strains in the vicinity of the hole on the tensioned rib (MP5, MP6) P(kN) Elastic strain Plastic strain Total strain
30
60
If we compare the calculated curve force-strain for the measuring point MP5 with the experimental curves (Fig. 10) we may notice that the joint No. 4 shows good agreement of results, with repeated fact that measured strain values are lower than the calculated ones, so we again have the phenomenon that the FE analysis is on the safe side. Therefore, here too the bearing capacity of the joint is greater than the calculated one. If we make the same comparison for the joints No. 2 and 3 we notice that starting sections of the experi-mental curves follow the calculation curve up to the force of approx. 20 kN, and then measured strains increase abruptly to 8000 micro-strains, at force of 35 kN.
MEASURED VS. CALCULATED STRAINS - MEASURING PT. MP5
-14500-14000-13500-13000-12500-12000-11500-11000-10500-10000-9500-9000-8500-8000-7500-7000-6500-6000-5500-5000-4500-4000-3500-3000-2500-2000-1500-1000
-5000
500
0
500
1000
1500
2000
2500
3000
3500
4000
4500
5000
5500
6000
6500
7000
7500
8000
FORCE (daN)
MIC
RO
-STR
AIN
S)
MP5 - JOINT 1 MP5-JOINT 2 MP5- JOINT 3 MP5-JOINT 4 CALCULATED STRAINS Fig. 10 Comparative presentation of the force-strain diagram of the calculated
and measured values (holes on the tensioned rib – MP5).

Experimental Analysis of an Original Type of Steel Space Truss Node Joint 53
MEASURED VS. CALCULATED STRAINS - MEASURING PT. MP6
-14500-14000-13500-13000-12500-12000-11500-11000-10500-10000-9500-9000-8500-8000-7500-7000-6500-6000-5500-5000-4500-4000-3500-3000-2500-2000-1500-1000
-5000
500
0
500
1000
1500
2000
2500
3000
3500
4000
4500
5000
5500
6000
6500
7000
7500
8000
FORCE (daN)
MIC
RO
-STR
AIN
S
MP6 - JOINT 1 MP6-JOINT 4 CALCULATED STRAINS Fig. 11 Comparative presentation of the force-strain diagram of the calculated and
measured values (holes on the tensioned rib – MP5).
Considering the measuring point MP6, Fig. 11, one valid experimental result is available, and that is the curve force-strain for the joint sample No. 4. Agreement of the experimental curve is almost ideal up to the value of approx. 30 kN, and after that measured strains here too rise faster than the calculated ones, so that value of 8000 micro-strains is reached at force of 40 kN. Effects of unequal force application are visible in this sample, too.
Considering the disposition of the measuring points on the experimental samples (Fig. 1) and the data from the numerical model (Tables T2, T3, T4), one may establish the following correlation of the measuring points position and the values of calculated and measured strains, which is presented in Table T5:
Table 5. Comparison of the calculated and measured strains in characteristic measuring points
Calculated strains Measured strains (mean values) No. Numerical FE model
Experimental sample –
measuring points 30 kN 60 kN 30 kN 60 kN
1 Hole on the base plate (tensioned)
MP1, MP2 2245 9227 1233 7800
2 Hole on the rib (compressed)
MP3, MP4 1972 7686 1575 5383
3 Hole on the rib (tensioned)
MP5, MP6 1921 8734 4025 8000

T. VACEV, S. KISIN, S. RANKOVIĆ 54
7. CONCLUSIONS OF THE EXPERIMENTAL ANALYSIS
Based on the performed investigations in experimental and numerical domain certain conclusions were made, which are given in the following text.
Although the number of the tested samples was not large (4), it afforded essential data about the behaviour of the suggested node joint, and enabled comparisons with the theo-retical results. The test facility and devices were conceived in such a way to enable testing of an isolated truss node, as in the elastic domain (calculating force of 30 kN per member), so in the plastic domain, up to rupture (maximum force of 76 kN). Since the load transfer from the test facility, auxiliary devices and lugs to the node joint itself was not ideal, some deviations in sample deformations occurred (i.e., asymmetry), in which case occurrence of adaptation of connections was registered, especially pronounced in plastic domain.
Of course, even in real conditions such irregularities in loading are possible, and thus the result dissipation too, as across the measuring points, as well as across the different samples. Maximal measured strains of 8000 micro-strains represent extremely high values for the used material (steel Č0563), which gives stress value in measuring points σ=1680 MPa for nominal modulus of elasticity for steel E=2.1E11 MPa. At the same time it means that ultimate strength (Rm=510-680 MPa) in the measuring points of the sample would be significantly exceeded, which would consequently lead to failure. These phe-nomena, however, occur in a very small volume of material, so their influence has strictly local character. Besides, at such high stressing local plasticization occurs, whereby the modulus of elasticity significantly decreases, so the stresses are practically substantially lower, too, and there is no failure.
Global deformations of the samples were not visually registered, while the local ones, in the bolt holes, were strongly pronounced in all samples. Regularity of local deforma-tions was noticed, in such a way that tensioned holes underwent significantly greater ovalization (diameter elongation in force direction) than the compressed ones, which was in agreement with the behaviour of the numerical model. Comparison of the measured and calculated strains shows good agreement for the most of the valid measuring points. As a very important observation we emphasize that strains obtained by FE analysis in most cases had greater values than the experimental ones, which indicated that samples gener-ally show greater bearing capacity than the calculated model. Therefore, the calculation stays on the safe side (η = εcalc / εmeas > 1), which represents one of the basic parameters in quality evaluation of the structure. Practically, the FE analysis gives the upper bound of results regarding the strains, i.e., stresses.
For further investigations it would be significant to examine the behaviour of the sug-gested node joint and a space truss structure (STS) in real structural assemblage (in situ). In that way, one could make consideration of this structural element in a broader way, with varying of parameters that are essential for an STS (span, construction depth, re-straint conditions, load, etc.).
REFERENCES 1. ANSYS - Software Manual, 2004 2. Georgijevski, V., Lake metalne konstrukcije, "Građevinska knjiga", Beograd, 1990. 3. Kim, J. W., Kim J. J., Rhew, H. J., "Analysis and experiment for the formation and ultimate load testing
of a hypar space truss", Journal of Constructional Steel Research 62 (2006) 189–193
Experimental Analysis of an Original Type of Steel Space Truss Node Joint 55
4. Kim, J. W., Lee, Y. H., Doh, J. H., "Analysis and test for shaping formation of space truss by means of cable-tensioning", Oxford Brookes University, 2007
5. Liew, J. Y. R., Lee, B.H., "Experimental study on reciprocal prism (RP) grid for space structures", Journal of Constructional Steel Research 59 (2003) 1363–1384
6. Lopez A., Puente I., Serna M. A., "Numerical model and experimental tests on single-layer latticed domes with semi-rigid joint", Computers and Structures 85 (2007) 360–374
7. Pang, N.L., Zhao, X.L., Mashiri, F.R., Dayawansa, P. "Full-size testing to determine stress concentration factors of dragline tubular joints", Engineering Structures 31 (2009) 43-56
8. Pearce Structures Literature: An Introduction to Space Frames, References: Space Grid Structures by John Borrego, The Design of Building Structures by Wolfgang Schueller (pp521–563), The MIT Press, 1972
9. Reynolds, G. A., Feria, V. A., Curtis, G. N., Hackbarth, D. R., Sehic, A.; Gossamer Space Frames, Inc., Jet Propulsion Laboratory, California Institute of Technology, "Co-axial joint technology applied to antenna backup structure"
10. Sheikh, A., "New space truss system—from concept to implementation", Engineering Structures 22 (2000) 1070–1085
11. Tong, L., Gu, M., Chen, Y., Zhou, L., Sun, J., Chen, Y., Lin, Y., Lin, G., "Strength of tubular welded joints of roof trusses in Shanghai Qizhong Tennis Center", Front. Archit. Civ. Eng. China 2008, 2(1): 30–36
12. www.novumstructures.com.
EKSPERIMENTALNA ANALIZA ORIGINALNOG REŠENJA ČVORNE SPOJNICE ČELIČNE PROSTORNE REŠETKE
Todor Vacev, Srđan Kisin, Slobodan Ranković
U radu je prikazana eksperimentalna analiza originalnog rešenja čelične čvorne spojnice prostorne rešetke. Uzorak spojnice je opterećivan prostornim rasporedom sila koji simulira realno stanje u konstrukciji sa 8 uravnoteženih sila u štapovima (4 pojasna i 4 dijagonalna štapa), sve do loma konstrukcije. Ovo je realizovano u posebno konstruisanom ispitnom ramu. Ispitivani uzorci čvorne spojnice izrađeni su u pravoj veličini, prema modelu nastalom nakon MKE analize i optimizacije. Osnovna ideja je bila da se konstruiše i ispita čvorna spojnica koja se može izraditi u prosečnim tehnološkim uslovima - bez primene posebnih alata i zahteva. Osim toga, dati su rezultati MKE naponsko-deformacijske analize i izvršena uporedna analiza rezultata u najkritičnijim zonama čvorne spojnice. Prikazane su vrednosti merenih i računskih dilatacija po uzorcima i karakterističnim mernim mestima.
Ključne reči: Eksperimentalna analiza, čvorna spojnica, prostorna rešetka, analiza konačnih elemenata