experiment #1. math reviewblogs.nvcc.edu/alchm/files/2019/01/chm112_labs_fall2018.pdf ·...
TRANSCRIPT
Experiment #1. Math Review
A. Scientific notation and Significant Figures
While entering a number in scientific notation in your calculator, look for the ‘EE’ or the ‘exp’ key on your calculator. For example using the TI3-XA, one would enter 6.023 x 10²³ as 6.023 EE 23. Using a TI-84 plus, the same number would be entered as 6.023 2nd EE 23. Using a TI-89, the same number would be entered as 6.023 EE 23 Practice entering the following numbers in your calculator
a) 2.303 x 10¹² b) 9.11 x 10⁻³¹ c) 2.3 x 10³
Rules for Counting Significant Figures: Example # S. F.
1. All nonzero integers are significant. 421.1 4 2. Leading zeros are never significant. 0.0034 2 3. Captive zeros are always significant. 205 3 4. Trailing zeros in a decimal number are significant. 25.0 3 5. Trailing zeros in a number with no decimal are not significant. 400 1
Exponential /Scientific Notation:
The number of significant figures in a number written in exponential notation is easily determined as the leading and trailing zeros are removed. Examples:
Decimal Exponential/Scientific notation # S. F. 0.0034 3.4 x 10 - 3 2 400 4 x 10 2 1 0.000505 5.05 x 10 - 4 3 530000 5.3 x 10 5 2 0.0100 1.00 x 10 - 2 3
Rules for sig figs in mathematical operations
• Multiplication and division • The final answer must have the same number of sig figs as the number having the least sig figs
• Addition and subtraction • The final answer must have the same number of decimal places as the number with the least decimal places
Rules for Rounding:
1. In a calculation carry all of the significant figures through to the final result, then round to the correct number of significant figure based upon the data with the smallest number of significant figures.
2. If the digit to be removed is <5, the preceding digit remains unchanged. (25.44 rounds to 25.4) 3. If the digit to be removed is ≥ 5, then the preceding digit is incremented by 1. (25.46 rounds to 25.5)
B. Logarithms to the base 10 (log) and Natural Logarithms (ln, to the base e)
Logarithms are the opposite of exponentials.
For example: Since 102 = 100, we can write log 102 = 2 or log 100 = 2
Since 100 = 1, then log 1=0. Similarly, e0 = 1, therefore ln 1 = 0
elnx = x or lnex = x Similarly, log10x = x or 10log x = x
Look for the log and the 10x key on your calculator to get the log and the antilog of a number. Similarly, become
familiar with the ln and ex key on your calculator.
Example: If log x = 2, then x = 102 Ex: If ln x = 5, then x = e5
Some basic rules for logarithms are:
log(a*b) = log a + Log b
log log loga
a bb
log am = m log a
ln (a*b) = ln a + ln b
ln ln lna
a bb
ln am = m ln a
C. Graphs
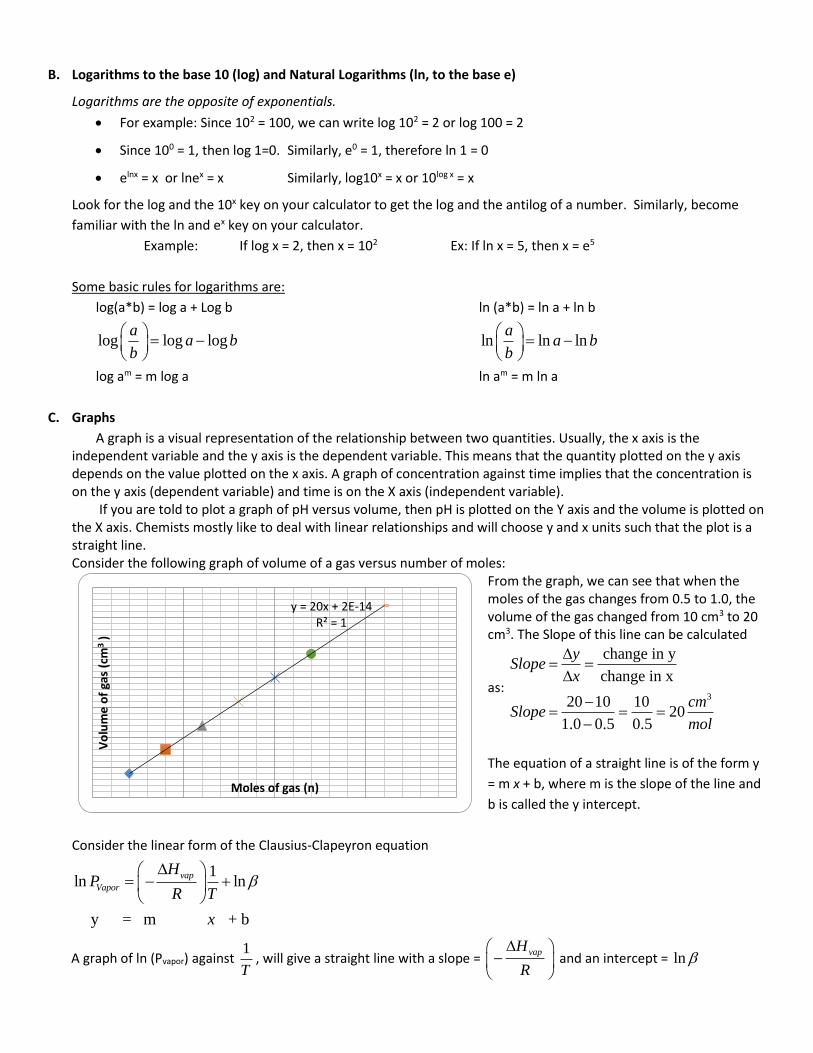
A graph is a visual representation of the relationship between two quantities. Usually, the x axis is the independent variable and the y axis is the dependent variable. This means that the quantity plotted on the y axis depends on the value plotted on the x axis. A graph of concentration against time implies that the concentration is on the y axis (dependent variable) and time is on the X axis (independent variable). If you are told to plot a graph of pH versus volume, then pH is plotted on the Y axis and the volume is plotted on the X axis. Chemists mostly like to deal with linear relationships and will choose y and x units such that the plot is a straight line. Consider the following graph of volume of a gas versus number of moles:
From the graph, we can see that when the moles of the gas changes from 0.5 to 1.0, the volume of the gas changed from 10 cm3 to 20 cm3. The Slope of this line can be calculated
as: 3
change in y
change in x
20 10 1020
1.0 0.5 0.5
ySlope
x
cmSlope
mol
The equation of a straight line is of the form y
= m x + b, where m is the slope of the line and
b is called the y intercept.
Consider the linear form of the Clausius-Clapeyron equation
1ln ln
y = m + b
vap
Vapor
HP
R T
x
A graph of ln (Pvapor) against 1
T, will give a straight line with a slope =
vapH
R
and an intercept = ln
y = 20x + 2E-14R² = 1
Vo
lum
e o
f ga
s (c
m3
)
Moles of gas (n)
Name_________________________
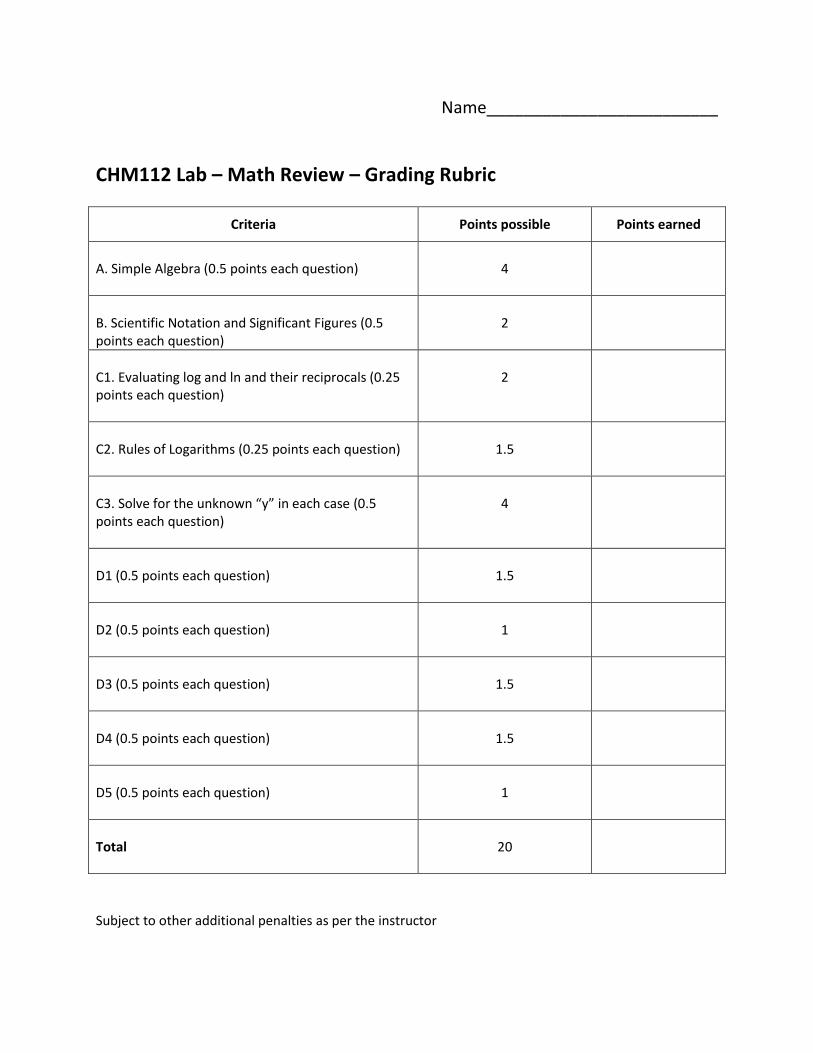
CHM112 Lab – Math Review – Grading Rubric
Criteria Points possible Points earned
A. Simple Algebra (0.5 points each question)
4
B. Scientific Notation and Significant Figures (0.5 points each question)
2
C1. Evaluating log and ln and their reciprocals (0.25 points each question)
2
C2. Rules of Logarithms (0.25 points each question)
1.5
C3. Solve for the unknown “y” in each case (0.5 points each question)
4
D1 (0.5 points each question)
1.5
D2 (0.5 points each question)
1
D3 (0.5 points each question)
1.5
D4 (0.5 points each question)
1.5
D5 (0.5 points each question)
1
Total
20
Subject to other additional penalties as per the instructor

CHM 112: Math Review Name ________________________
A. Simple Algebra
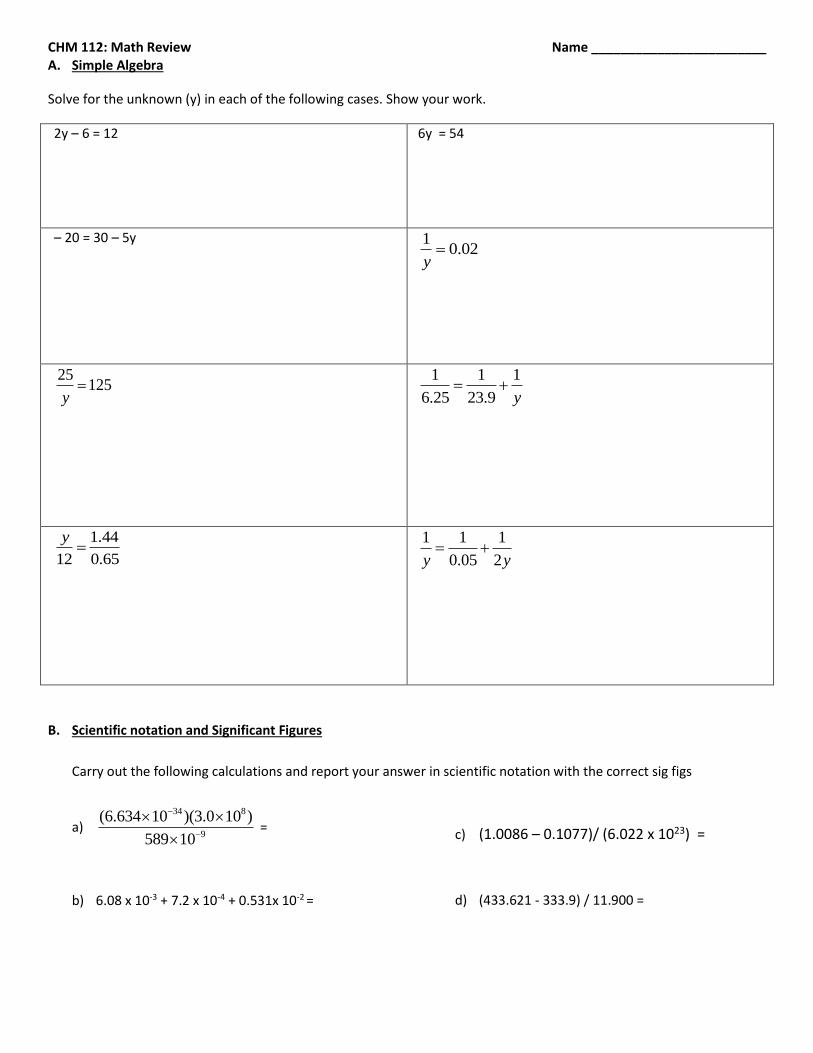
Solve for the unknown (y) in each of the following cases. Show your work.
2y – 6 = 12
6y = 54
– 20 = 30 – 5y
10.02
y
25125
y
1 1 1
6.25 23.9 y
1.44
12 0.65
y
1 1 1
0.05 2y y
B. Scientific notation and Significant Figures
Carry out the following calculations and report your answer in scientific notation with the correct sig figs
a) 34 8
9
(6.634 10 )(3.0 10 )
589 10
=
b) 6.08 x 10⁻³ + 7.2 x 10⁻⁴ + 0.531x 10-2 =
c) (1.0086 – 0.1077)/ (6.022 x 10²³) =
d) (433.621 - 333.9) / 11.900 =
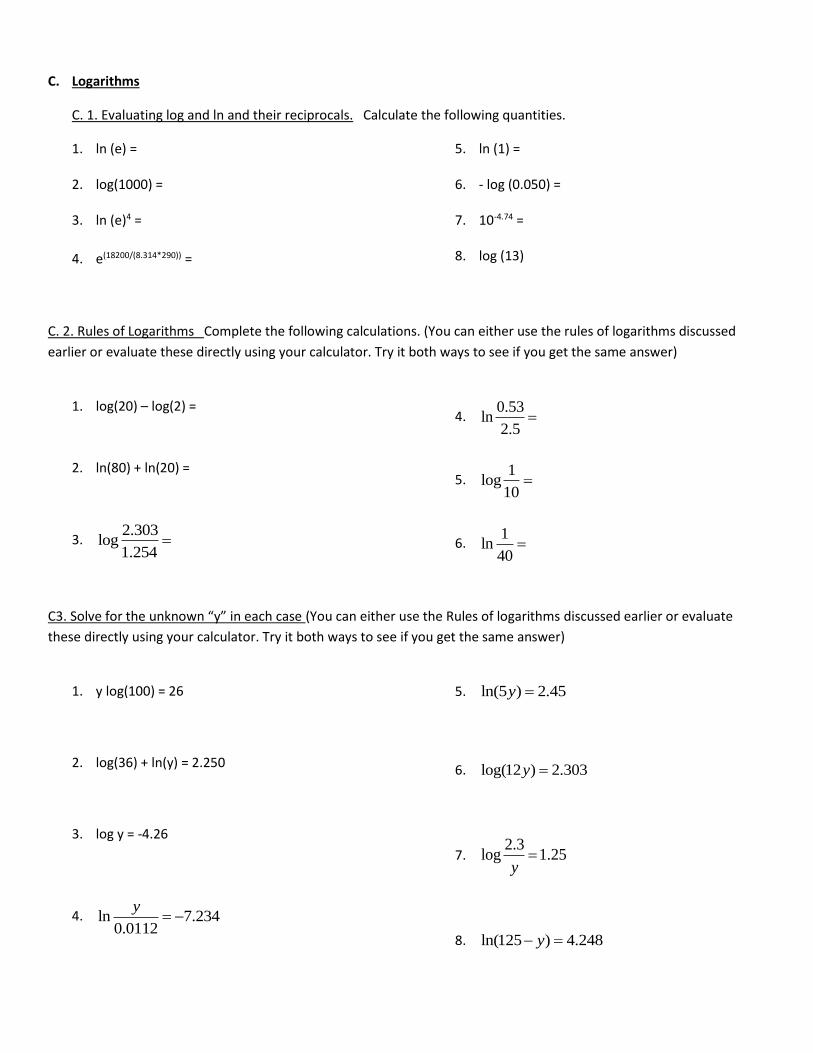
C. Logarithms
C. 1. Evaluating log and ln and their reciprocals. Calculate the following quantities.
1. ln (e) =
2. log(1000) =
3. ln (e)4 =
4. e(18200/(8.314*290)) =
5. ln (1) =
6. - log (0.050) =
7. 10-4.74 =
8. log (13)
C. 2. Rules of Logarithms Complete the following calculations. (You can either use the rules of logarithms discussed
earlier or evaluate these directly using your calculator. Try it both ways to see if you get the same answer)
1. log(20) – log(2) =
2. ln(80) + ln(20) =
3. 2.303
log1.254
4. 0.53
ln2.5
5. 1
log10
6. 1
ln40
C3. Solve for the unknown “y” in each case (You can either use the Rules of logarithms discussed earlier or evaluate
these directly using your calculator. Try it both ways to see if you get the same answer)
1. y log(100) = 26
2. log(36) + ln(y) = 2.250
3. log y = -4.26
4. ln 7.2340.0112
y
5. ln(5 ) 2.45y
6. log(12 ) 2.303y
7. 2.3
log 1.25y
8. ln(125 ) 4.248y

D. Graphs
D1. Complete the following table by comparing each equation to the equation of a straight line.
Equation Slope Is the slope positive or
negative? Intercept
y = 310. x + 18.5
y = - 255 x + 1.003
y= -1.203 + 0.17 x
D2. Consider the equation y = 0.035 x + 0.125
a. What will be the value of y when x = 4.5?
b. What is the value of x when y = 0.654
D3. Complete the following table by comparing each of the equations to y = m x + b
Equation What is plotted on the y axis?
What is plotted on the x axis?
Slope Intercept
[A]t = [A]0 – k t
1ln lnaE
k AR T
0
1 1
[ ] [ ]t
k tA A
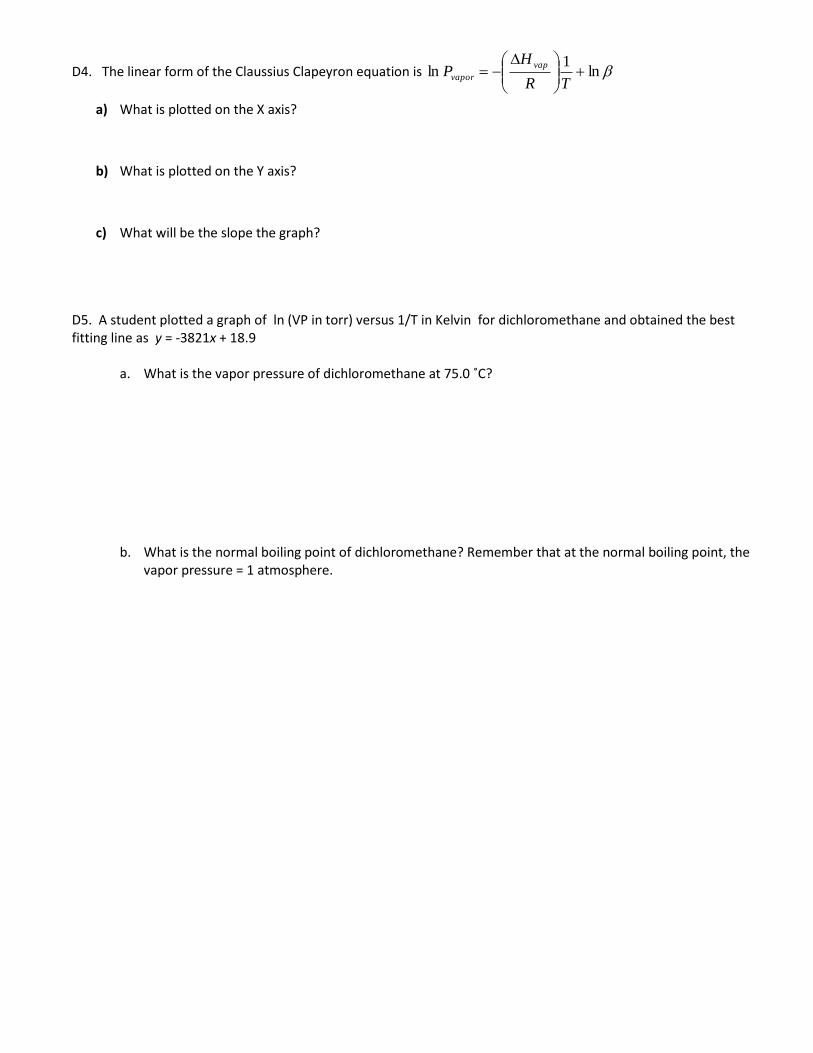
D4. The linear form of the Claussius Clapeyron equation is ln1
ln
TR
HP
vap
vapor
a) What is plotted on the X axis?
b) What is plotted on the Y axis?
c) What will be the slope the graph?
D5. A student plotted a graph of ln (VP in torr) versus 1/T in Kelvin for dichloromethane and obtained the best fitting line as y = -3821x + 18.9
a. What is the vapor pressure of dichloromethane at 75.0 ˚C?
b. What is the normal boiling point of dichloromethane? Remember that at the normal boiling point, the vapor pressure = 1 atmosphere.
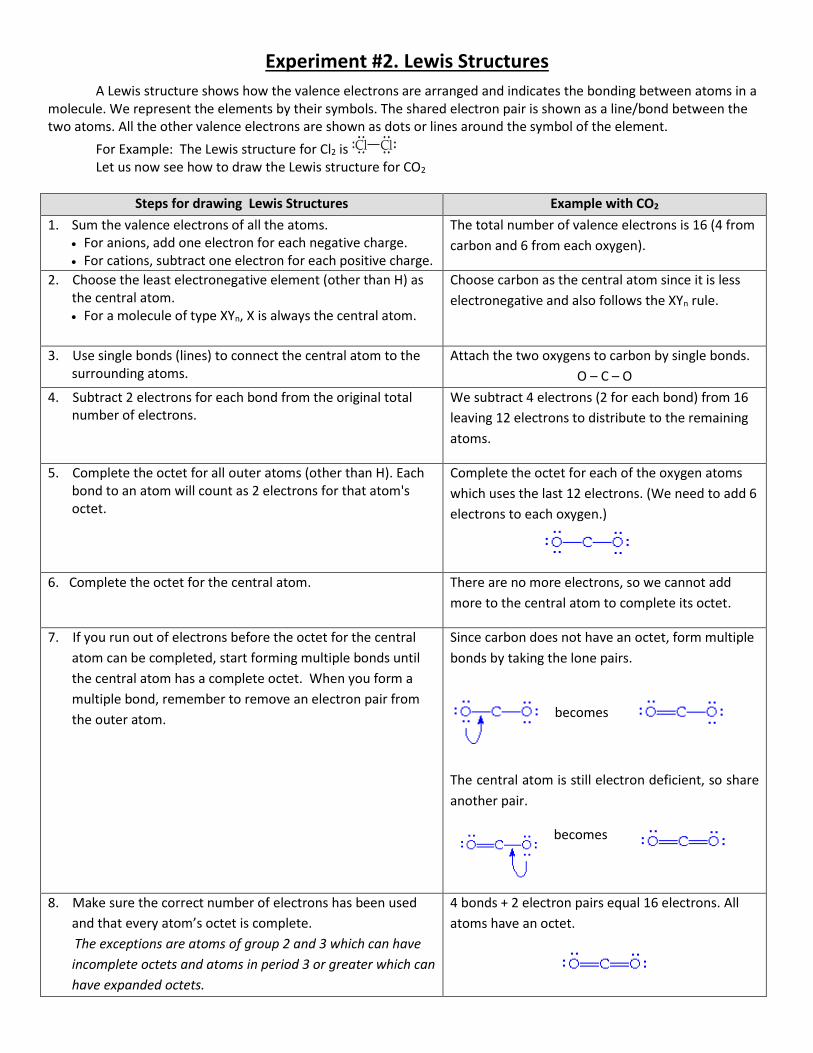
Experiment #2. Lewis Structures
A Lewis structure shows how the valence electrons are arranged and indicates the bonding between atoms in a molecule. We represent the elements by their symbols. The shared electron pair is shown as a line/bond between the two atoms. All the other valence electrons are shown as dots or lines around the symbol of the element.
For Example: The Lewis structure for Cl2 is Let us now see how to draw the Lewis structure for CO2
Steps for drawing Lewis Structures Example with CO2
1. Sum the valence electrons of all the atoms. For anions, add one electron for each negative charge. For cations, subtract one electron for each positive charge.
The total number of valence electrons is 16 (4 from
carbon and 6 from each oxygen).
2. Choose the least electronegative element (other than H) as the central atom. For a molecule of type XYn, X is always the central atom.
Choose carbon as the central atom since it is less
electronegative and also follows the XYn rule.
3. Use single bonds (lines) to connect the central atom to the surrounding atoms.
Attach the two oxygens to carbon by single bonds.
O – C – O
4. Subtract 2 electrons for each bond from the original total number of electrons.
We subtract 4 electrons (2 for each bond) from 16
leaving 12 electrons to distribute to the remaining
atoms.
5. Complete the octet for all outer atoms (other than H). Each bond to an atom will count as 2 electrons for that atom's octet.
Complete the octet for each of the oxygen atoms
which uses the last 12 electrons. (We need to add 6
electrons to each oxygen.)
6. Complete the octet for the central atom. There are no more electrons, so we cannot add
more to the central atom to complete its octet.
7. If you run out of electrons before the octet for the central
atom can be completed, start forming multiple bonds until
the central atom has a complete octet. When you form a
multiple bond, remember to remove an electron pair from
the outer atom.
Since carbon does not have an octet, form multiple
bonds by taking the lone pairs.
becomes
The central atom is still electron deficient, so share
another pair.
becomes
8. Make sure the correct number of electrons has been used
and that every atom’s octet is complete.
The exceptions are atoms of group 2 and 3 which can have
incomplete octets and atoms in period 3 or greater which can
have expanded octets.
4 bonds + 2 electron pairs equal 16 electrons. All
atoms have an octet.
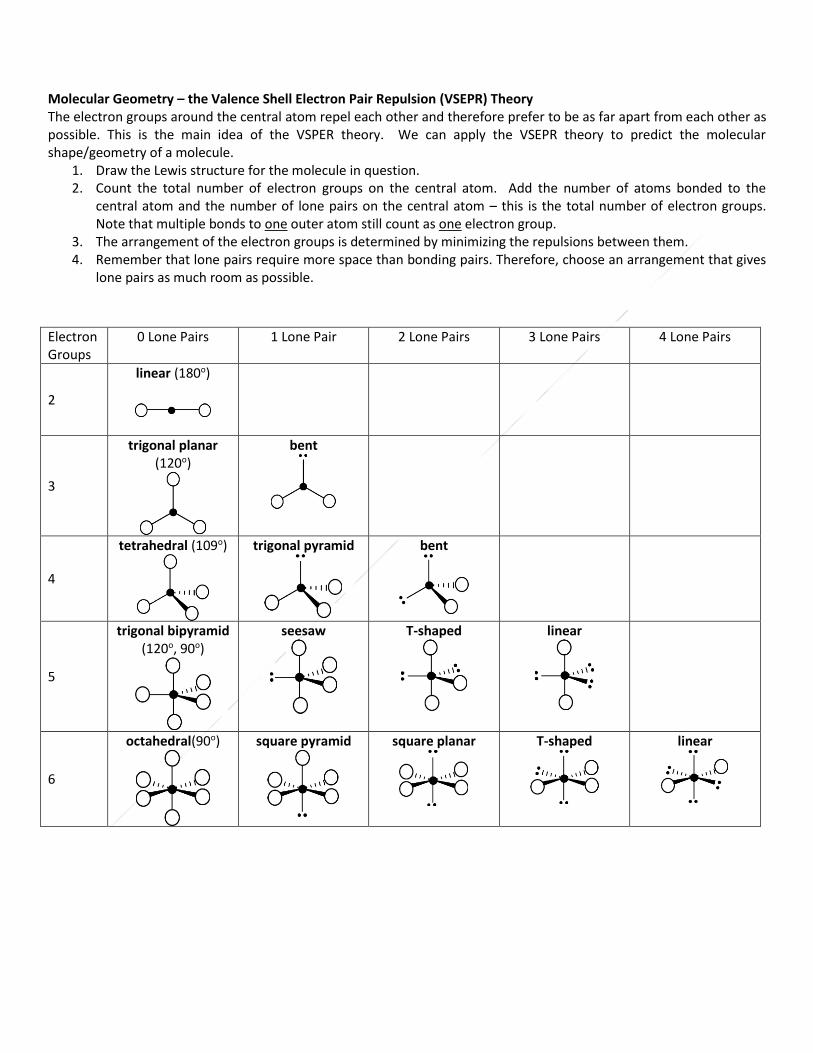
Molecular Geometry – the Valence Shell Electron Pair Repulsion (VSEPR) Theory The electron groups around the central atom repel each other and therefore prefer to be as far apart from each other as possible. This is the main idea of the VSPER theory. We can apply the VSEPR theory to predict the molecular shape/geometry of a molecule.
1. Draw the Lewis structure for the molecule in question. 2. Count the total number of electron groups on the central atom. Add the number of atoms bonded to the
central atom and the number of lone pairs on the central atom – this is the total number of electron groups. Note that multiple bonds to one outer atom still count as one electron group.
3. The arrangement of the electron groups is determined by minimizing the repulsions between them. 4. Remember that lone pairs require more space than bonding pairs. Therefore, choose an arrangement that gives
lone pairs as much room as possible.
Electron Groups
0 Lone Pairs 1 Lone Pair 2 Lone Pairs 3 Lone Pairs 4 Lone Pairs
2
linear (180o)
3
trigonal planar (120o)
bent
4
tetrahedral (109o)
trigonal pyramid
bent
5
trigonal bipyramid (120o, 90o)
seesaw
T-shaped
linear
6
octahedral(90o)
square pyramid
square planar
T-shaped
linear
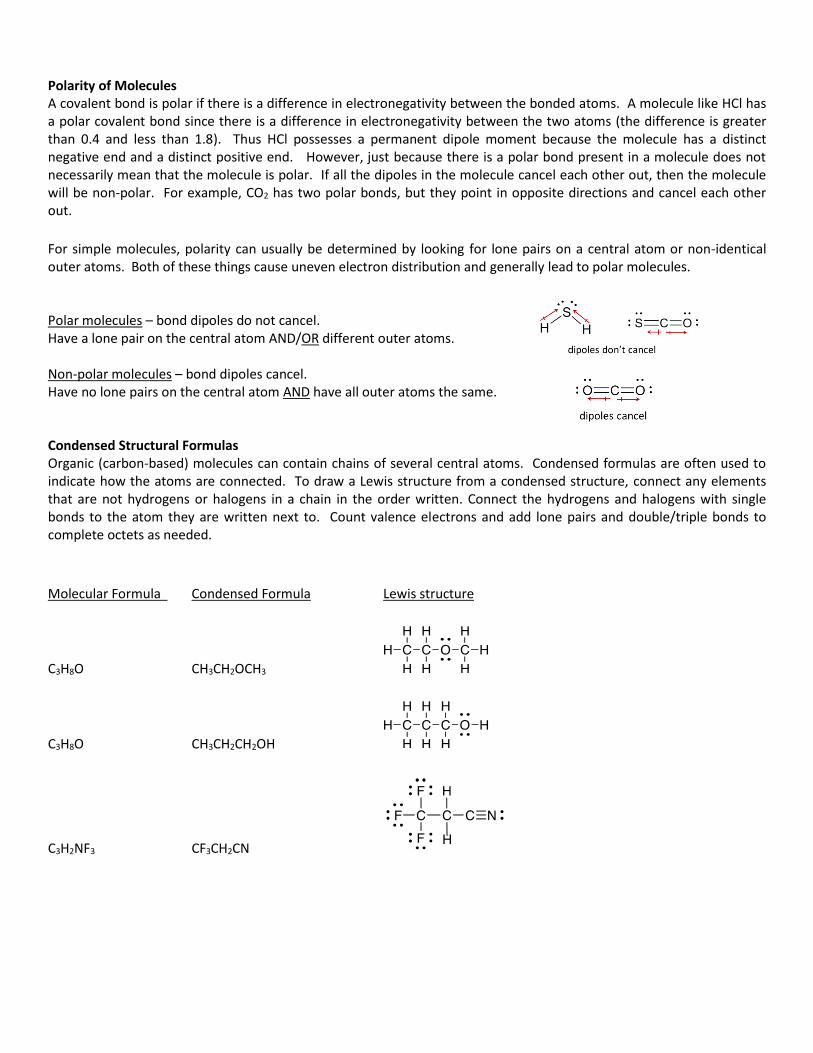
Polarity of Molecules A covalent bond is polar if there is a difference in electronegativity between the bonded atoms. A molecule like HCl has a polar covalent bond since there is a difference in electronegativity between the two atoms (the difference is greater than 0.4 and less than 1.8). Thus HCl possesses a permanent dipole moment because the molecule has a distinct negative end and a distinct positive end. However, just because there is a polar bond present in a molecule does not necessarily mean that the molecule is polar. If all the dipoles in the molecule cancel each other out, then the molecule will be non-polar. For example, CO2 has two polar bonds, but they point in opposite directions and cancel each other out.
For simple molecules, polarity can usually be determined by looking for lone pairs on a central atom or non-identical outer atoms. Both of these things cause uneven electron distribution and generally lead to polar molecules. Polar molecules – bond dipoles do not cancel. Have a lone pair on the central atom AND/OR different outer atoms. Non-polar molecules – bond dipoles cancel. Have no lone pairs on the central atom AND have all outer atoms the same. Condensed Structural Formulas Organic (carbon-based) molecules can contain chains of several central atoms. Condensed formulas are often used to indicate how the atoms are connected. To draw a Lewis structure from a condensed structure, connect any elements that are not hydrogens or halogens in a chain in the order written. Connect the hydrogens and halogens with single bonds to the atom they are written next to. Count valence electrons and add lone pairs and double/triple bonds to complete octets as needed.
Molecular Formula Condensed Formula Lewis structure
C3H8O CH3CH2OCH3
C3H8O CH3CH2CH2OH
C3H2NF3 CF3CH2CN

Name_________________________
CHM112 Lab – Lewis Structures – Grading Rubric
Subject to additional penalties at the discretion of the instructor.
Criteria
Points possible
Points earned
Question 1 (1.33 points each question)
8
Question 2 (1 point each question)
4
Question 3 (1 point each question)
2
Question 4 (1 point each question)
4
Question 5 (1 points each question)
2
Total
20

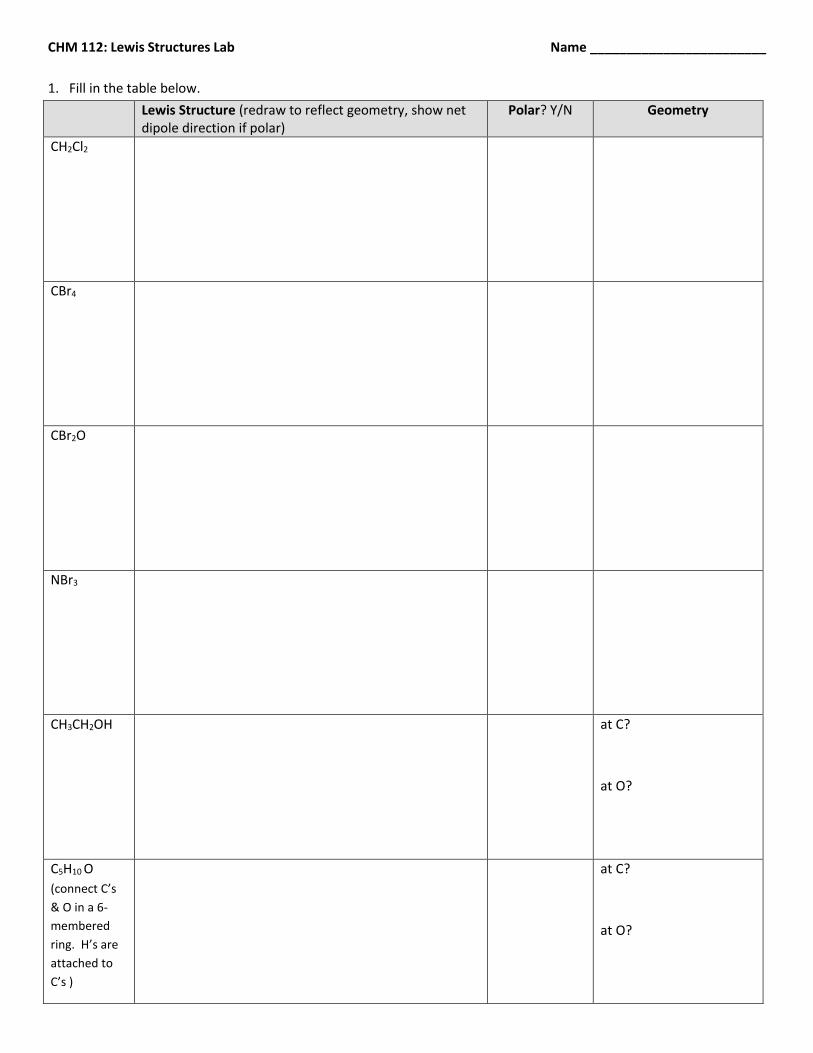
CHM 112: Lewis Structures Lab Name ________________________
1. Fill in the table below.
Lewis Structure (redraw to reflect geometry, show net dipole direction if polar)
Polar? Y/N Geometry
CH2Cl2
CBr4
CBr2O
NBr3
CH3CH2OH
at C?
at O?
C5H10 O
(connect C’s
& O in a 6-
membered
ring. H’s are
attached to
C’s )
at C?
at O?

2. Draw the Lewis Structures of each of the following acids: (These structures, like most acids, have each H attached to
one of the oxygens.
(A) H2SO4 (B) HIO2
(C) H3PO3 (D) CF3CO2H (Both O atoms are attached to second C)
3. Draw the Lewis Structure for these anions. Each anion is a conjugate base of an acid.
(E) HCO3─ (H attached to one of the O’s) (F) SO3
2─
4. Weak bases frequently contain N: (nitrogen with a lone pair of electrons). Draw the Lewis Structure for each of the following weak bases.
(A) NH3 (B) CH3CONH2 (Connectivity is )
(C) CH3NH2 (D) C5H5N (six membered ring made of C and N, Hs attached to
Cs)
5. Draw the Lewis structures of the following cations. Each cation is the conjugate acid of a weak base:
(A) NH4+ (B) CH3NH2CH3
+
Experiment #3. Graphing with Excel
Study the "Graphing with Excel" instructions that have been provided. Additional help with learning to
use Excel can be found on several web sites, including http://www.ncsu.edu/labwrite/res/gt/gt-menu.html. The "help"
function of Excel also can be useful to answer specific questions. Note that Excel can eliminate the need to make
manual calculations – for example, in this exercise, instead of using a calculator to find the natural log (ln) values, simply
type the following in the cell where the ln data is to be put: =ln(x1), where x is the column and 1 is the row of the cell
containing the data you want to take the natural log of. Similarly, to obtain the reciprocal of the temperature data,
simply type the following in the cell where you want the reciprocal: =1/x1, where x is the column and 1 is the row of the
cell containing the temperature data you want to take the reciprocal of. You can use the cut and paste functions to copy
formulas such as this into the other cells in the column so you don't have to retype the formula each time – Excel will
automatically enter the corresponding VP or T data from the same row. If you take some time to practice, Excel can
become a very powerful tool for you.
Relationship of Vapor Pressure to Temperature: Developing the Clausius-Clapeyron Equation
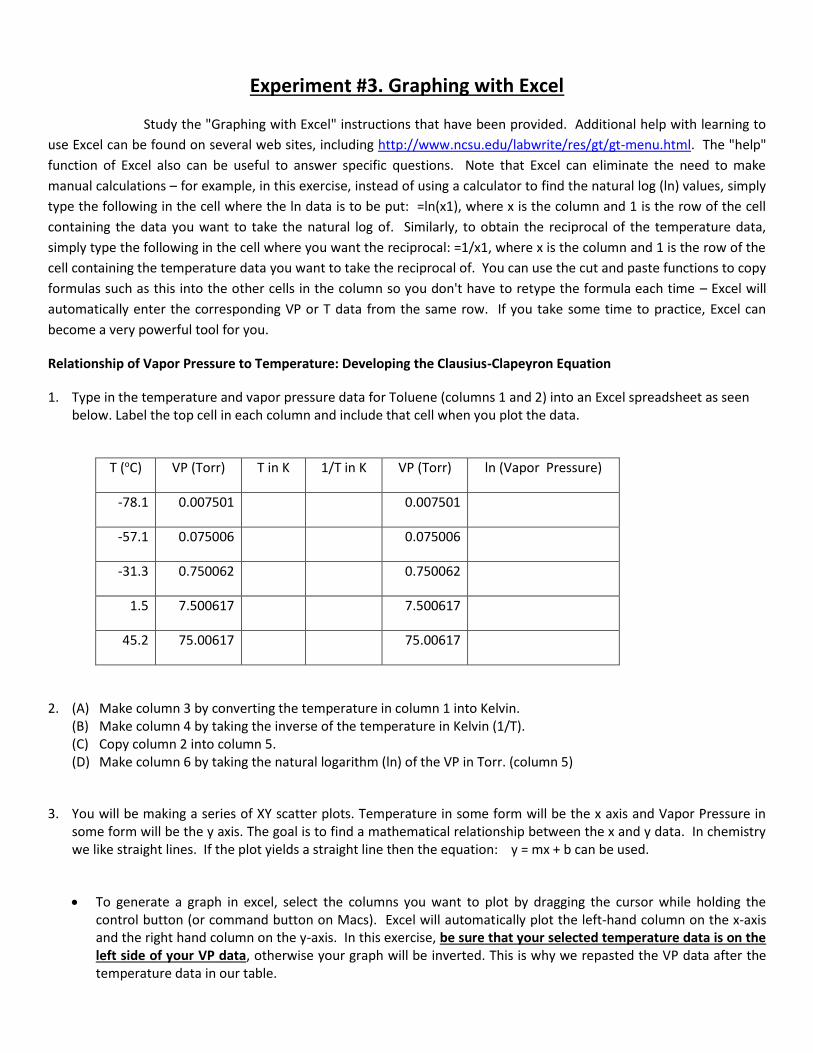
1. Type in the temperature and vapor pressure data for Toluene (columns 1 and 2) into an Excel spreadsheet as seen below. Label the top cell in each column and include that cell when you plot the data.
T (oC) VP (Torr) T in K 1/T in K VP (Torr) ln (Vapor Pressure)
-78.1 0.007501 0.007501
-57.1 0.075006 0.075006
-31.3 0.750062 0.750062
1.5 7.500617 7.500617
45.2 75.00617 75.00617
2. (A) Make column 3 by converting the temperature in column 1 into Kelvin. (B) Make column 4 by taking the inverse of the temperature in Kelvin (1/T). (C) Copy column 2 into column 5. (D) Make column 6 by taking the natural logarithm (ln) of the VP in Torr. (column 5)
3. You will be making a series of XY scatter plots. Temperature in some form will be the x axis and Vapor Pressure in some form will be the y axis. The goal is to find a mathematical relationship between the x and y data. In chemistry we like straight lines. If the plot yields a straight line then the equation: y = mx + b can be used.
To generate a graph in excel, select the columns you want to plot by dragging the cursor while holding the control button (or command button on Macs). Excel will automatically plot the left-hand column on the x-axis and the right hand column on the y-axis. In this exercise, be sure that your selected temperature data is on the left side of your VP data, otherwise your graph will be inverted. This is why we repasted the VP data after the temperature data in our table.

Once the appropriate data are highlighted, choose the type of graph you want to generate in Excel. In this class we will always graph using the Marked Scatter Plot option in Excel. Do not choose plot options that have lines. When we want lines on our Excel graphs we will add them using the trendline feature.
You are not finished! The graph automatically generated by Excel is never correctly formatted for submission in a science course. Below are features of a good graph. Be sure any graph you turn in for this class adheres to these guidelines. Each version of excel has different ways to change graph formatting. If your version is different from the one in the lab video on the CHM112 website, you may need to use your help button to learn how to make these changes.
o Give the graph a descriptive title. Don’t just repeat the information in the axes titles. Pressure vs Temperature…for what? Look in the instructions above to find what substance this data is for. Your title should describe what the experiment was about.
o Label axes with the type of unit and the unit itself. For example: Temperature (oC). o Axes should be at the bottom and left of the graph – not in the middle of the data. o Remove the legend if it provides no information. Most Excel versions default to having legends for
every graph. If you are only plotting one set of data per graph, the legend contributes nothing – get rid of it.
o Change the start and end points of each axis so that the data takes up the majority of the graph. Excel usually defaults to having both axes start at zero. This often leads to the graph having a lot of white space, which we do not want. Change the minimum value of each axis so that it starts just below your lowest data point.
o Add a trendline when appropriate. If you want to find a mathematical relationship in the data, be sure to include a trendline and to check the box to display the equation on the chart. You can also choose to display the R2 value. The closer the value of R2 is to 1, the better the fit. You will add trendlines to all three graphs in the exercise.
o Add more gridlines when appropriate. In this exercise we are only concerned with the trendline, but in some labs you will need to estimate a value off the graph after printing. If this is the case, be sure to add enough gridlines so that you can accurately estimate your value. If you need to read a value to the nearest 0.1 mL, but your x-axis only has gridlines every 5 mL, your estimate will be poor.
o Print your graphs at a reasonable size. Usually about ½ page is appropriate. Also print the spreadsheet when asked.
With the data in your tables, generate and print the following graphs as well as your spreadsheet data and attach
them to this lab.
(A) Plot VP vs T in K. Add trendlines (both linear and exponential) and display the equations for both trendlines
on the chart.
(B) Plot VP vs 1/T in K. Add trendlines (both linear and exponential) and display the equations on the chart.
(C) Plot ln(VP) vs 1/T in K. Add a linear trendline and display the equation on the chart.
Name_________________________
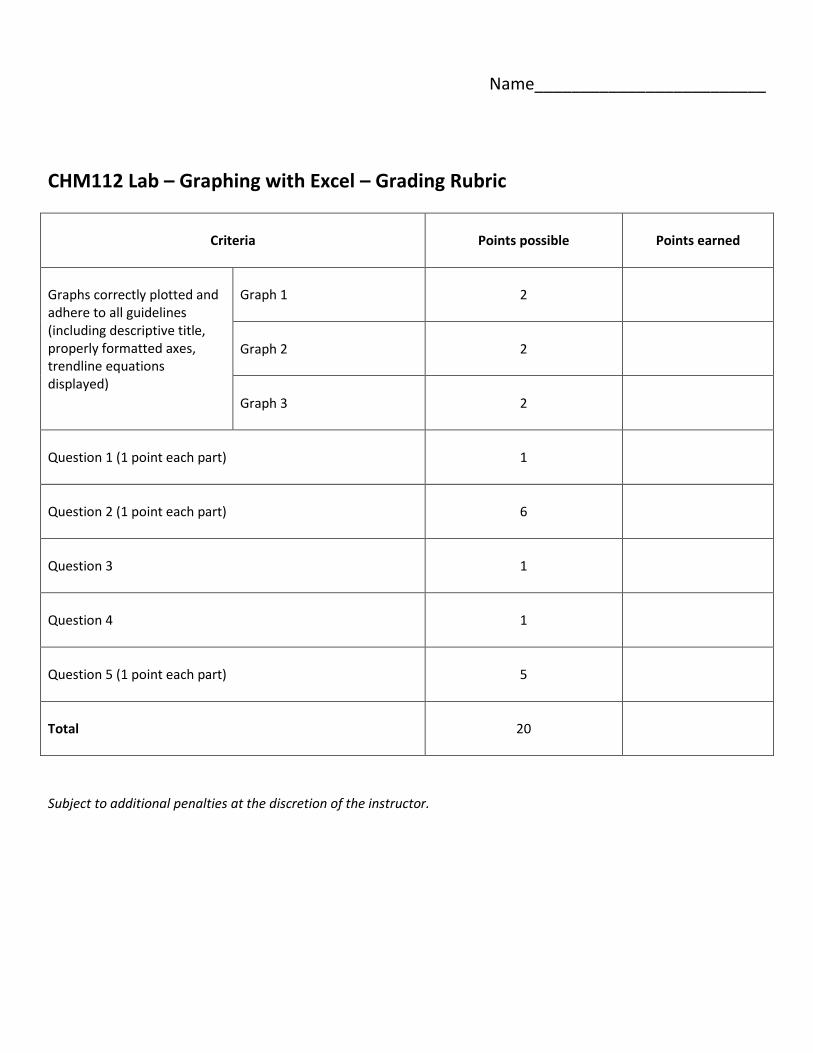
CHM112 Lab – Graphing with Excel – Grading Rubric
Criteria
Points possible
Points earned
Graphs correctly plotted and adhere to all guidelines (including descriptive title, properly formatted axes, trendline equations displayed)
Graph 1
2
Graph 2
2
Graph 3
2
Question 1 (1 point each part)
1
Question 2 (1 point each part)
6
Question 3
1
Question 4
1
Question 5 (1 point each part)
5
Total
20
Subject to additional penalties at the discretion of the instructor.

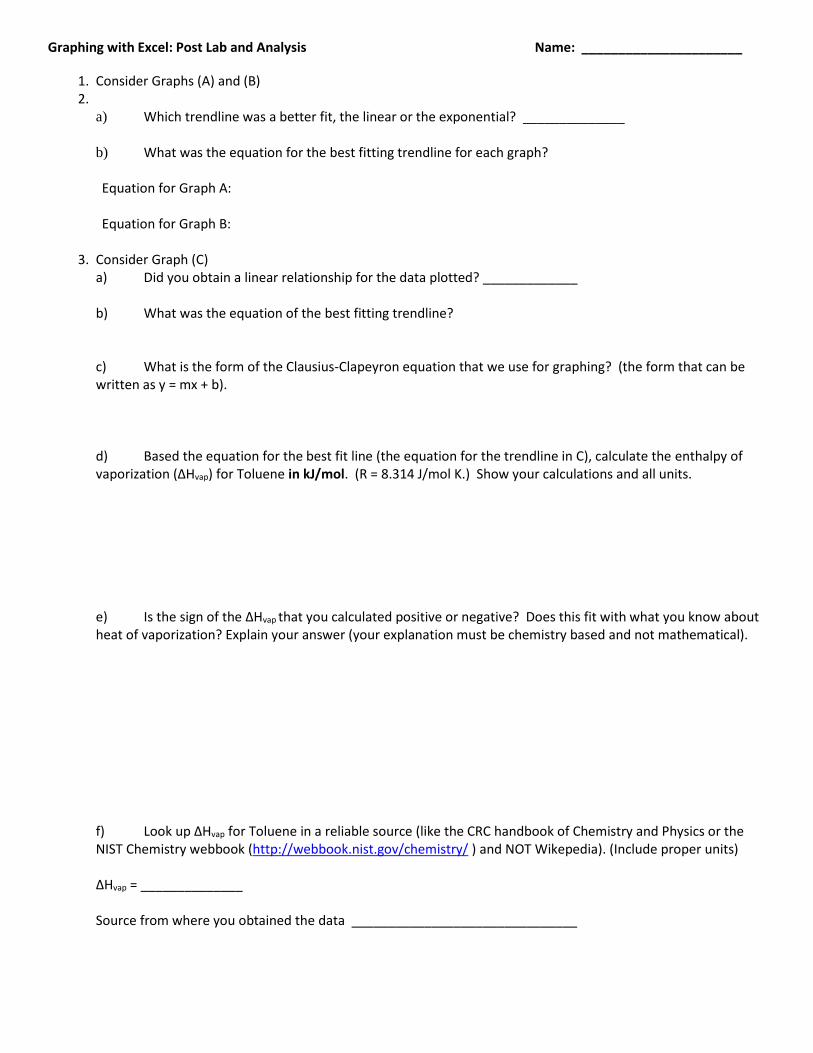
Graphing with Excel: Post Lab and Analysis Name: ______________________
1. Consider Graphs (A) and (B) 2.
a) Which trendline was a better fit, the linear or the exponential? ______________
b) What was the equation for the best fitting trendline for each graph? Equation for Graph A: Equation for Graph B:
3. Consider Graph (C)
a) Did you obtain a linear relationship for the data plotted? _____________ b) What was the equation of the best fitting trendline?
c) What is the form of the Clausius-Clapeyron equation that we use for graphing? (the form that can be written as y = mx + b).
d) Based the equation for the best fit line (the equation for the trendline in C), calculate the enthalpy of vaporization (ΔHvap) for Toluene in kJ/mol. (R = 8.314 J/mol K.) Show your calculations and all units.
e) Is the sign of the ΔHvap that you calculated positive or negative? Does this fit with what you know about heat of vaporization? Explain your answer (your explanation must be chemistry based and not mathematical).
f) Look up ΔHvap for Toluene in a reliable source (like the CRC handbook of Chemistry and Physics or the NIST Chemistry webbook (http://webbook.nist.gov/chemistry/ ) and NOT Wikepedia). (Include proper units) ΔHvap = ______________ Source from where you obtained the data _______________________________
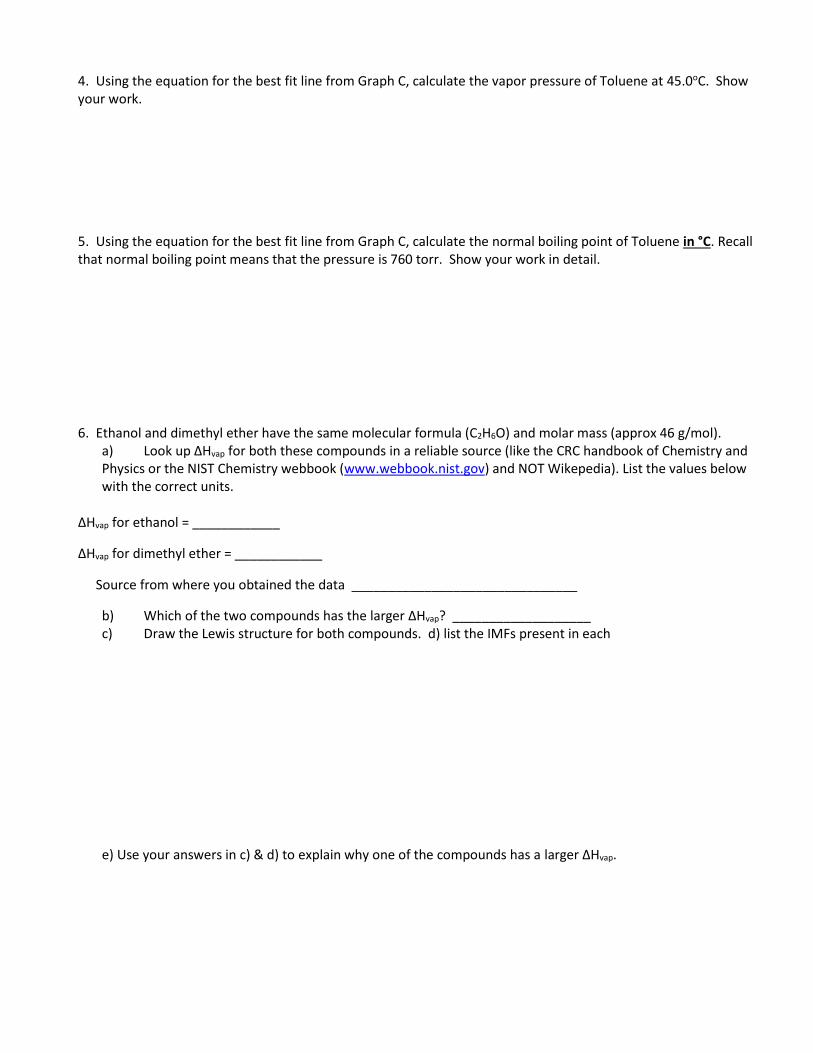
4. Using the equation for the best fit line from Graph C, calculate the vapor pressure of Toluene at 45.0oC. Show your work.
5. Using the equation for the best fit line from Graph C, calculate the normal boiling point of Toluene in °C. Recall that normal boiling point means that the pressure is 760 torr. Show your work in detail.
6. Ethanol and dimethyl ether have the same molecular formula (C2H6O) and molar mass (approx 46 g/mol). a) Look up ΔHvap for both these compounds in a reliable source (like the CRC handbook of Chemistry and Physics or the NIST Chemistry webbook (www.webbook.nist.gov) and NOT Wikepedia). List the values below with the correct units.
ΔHvap for ethanol = ____________
ΔHvap for dimethyl ether = ____________
Source from where you obtained the data _______________________________
b) Which of the two compounds has the larger ΔHvap? ___________________ c) Draw the Lewis structure for both compounds. d) list the IMFs present in each
e) Use your answers in c) & d) to explain why one of the compounds has a larger ΔHvap.
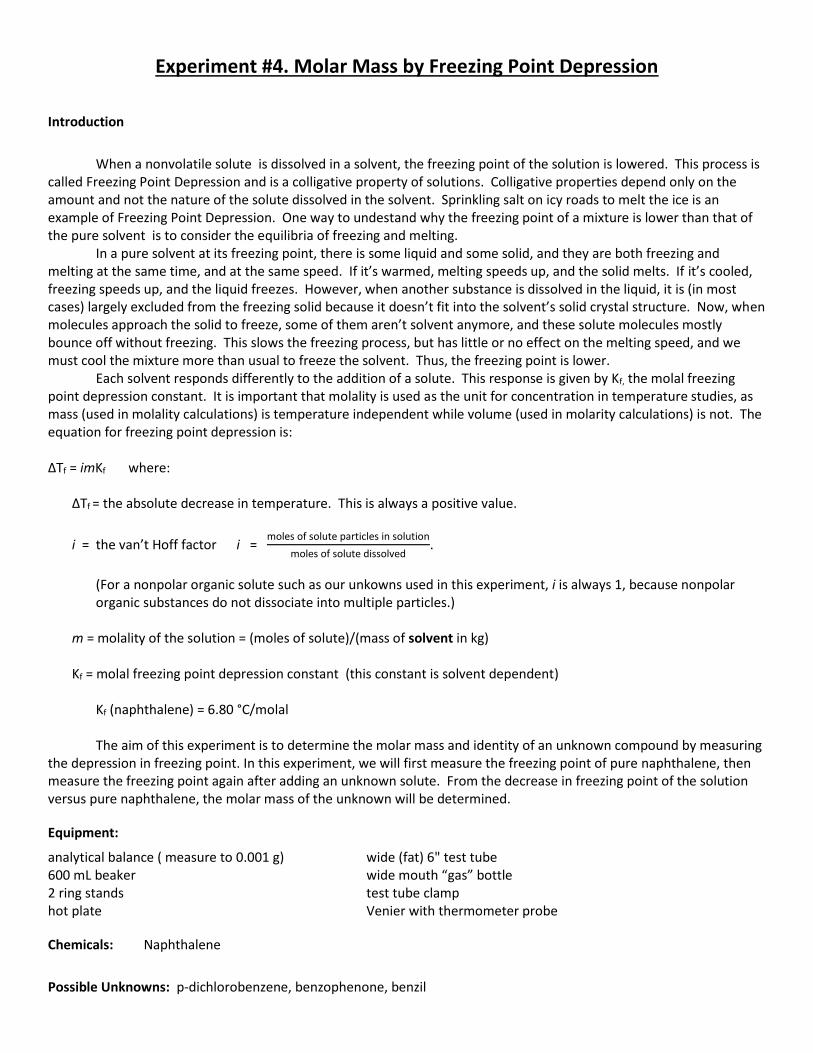
Experiment #4. Molar Mass by Freezing Point Depression
Introduction
When a nonvolatile solute is dissolved in a solvent, the freezing point of the solution is lowered. This process is called Freezing Point Depression and is a colligative property of solutions. Colligative properties depend only on the amount and not the nature of the solute dissolved in the solvent. Sprinkling salt on icy roads to melt the ice is an example of Freezing Point Depression. One way to undestand why the freezing point of a mixture is lower than that of the pure solvent is to consider the equilibria of freezing and melting. In a pure solvent at its freezing point, there is some liquid and some solid, and they are both freezing and melting at the same time, and at the same speed. If it’s warmed, melting speeds up, and the solid melts. If it’s cooled, freezing speeds up, and the liquid freezes. However, when another substance is dissolved in the liquid, it is (in most cases) largely excluded from the freezing solid because it doesn’t fit into the solvent’s solid crystal structure. Now, when molecules approach the solid to freeze, some of them aren’t solvent anymore, and these solute molecules mostly bounce off without freezing. This slows the freezing process, but has little or no effect on the melting speed, and we must cool the mixture more than usual to freeze the solvent. Thus, the freezing point is lower. Each solvent responds differently to the addition of a solute. This response is given by Kf, the molal freezing point depression constant. It is important that molality is used as the unit for concentration in temperature studies, as mass (used in molality calculations) is temperature independent while volume (used in molarity calculations) is not. The equation for freezing point depression is: ΔTf = imKf where:
ΔTf = the absolute decrease in temperature. This is always a positive value.
i = the van’t Hoff factor i = moles of solute particles in solution
moles of solute dissolved.
(For a nonpolar organic solute such as our unkowns used in this experiment, i is always 1, because nonpolar organic substances do not dissociate into multiple particles.)
m = molality of the solution = (moles of solute)/(mass of solvent in kg) Kf = molal freezing point depression constant (this constant is solvent dependent) Kf (naphthalene) = 6.80 °C/molal
The aim of this experiment is to determine the molar mass and identity of an unknown compound by measuring the depression in freezing point. In this experiment, we will first measure the freezing point of pure naphthalene, then measure the freezing point again after adding an unknown solute. From the decrease in freezing point of the solution versus pure naphthalene, the molar mass of the unknown will be determined.
Equipment:
analytical balance ( measure to 0.001 g) wide (fat) 6" test tube 600 mL beaker wide mouth “gas” bottle 2 ring stands test tube clamp hot plate Venier with thermometer probe
Chemicals: Naphthalene
Possible Unknowns: p-dichlorobenzene, benzophenone, benzil

Procedure
Determining the Freezing Point of Naphthalene
1. Using a plastic weighing boat, weigh between 4.5 and 5.5 g of naphthalene to the nearest 0.001 g. Record this mass on the data sheet and place the naphthalene into a dry fat 6" test tube.
2. Place a hot plate on the base of the stand. Place a 600 mL (or a similar size) beaker on the hot plate. Add ~ 300 mL of water to the beaker and suspend the test tube in the beaker using a test tube clamp. Check that the water level in the beaker is above the level of the mixture in the test tube. 3. Now place the wire stirrer and a thermometer in the test tube, so that the loop of the stirrer surrounds the
thermometer. Heat the water until the naphthalene melts (heat to at least 95C). Do not stir until the naphthalene melts.
4. Measure the temperature of the melted naphthalene. This is the temperature at time zero. Start the stopwatch. Quickly remove the test tube from the hot water. Place the test tube into a wide mouth bottle. (Be sure to keep the water hot, since you will need it again.)
5. Gently stir the naphthalene with the wire stirrer and record the temperature (to the nearest 0.2 C) of the liquid every 30 seconds. Stir gently as you take your readings (be sure not to poke the bottom of the test tube, as it can break easily). Continue to take readings until about half the liquid has frozen/solidified. The naphthalene inside the test tube will be like ‘slush’.
Determining the Freezing Point of a Mixture
6. Using a plastic boat, weigh between 0.5 and 0.6 g of the unknown compound to the nearest 0.001 g. Your instructor may assign you the unknown. Follow your professor’s instructions. Record the mass and number or letter of the unknown on the data sheet and place the unknown in the test tube containing your original sample of naphthalene. Do not stir at this time. 7. Using the same sample, now with the unknown in it: melt and solidify the mixture, recording a second set of data with the same procedure as you used for the pure naphthalene.
8. When you have completed the experiment, cafefully follow the…
Cleanup procedure as outlined below: A. Warm the test tube in the hot water bath until all of the mixture has melted and all you have is a liquid in the
test tube. B. Remove the thermometer and stirrer and wipe them clean using a paper towel wetted with acetone.
DO NOT THROW THIS PAPER TOWEL IN THE TRASH. Place the paper towel in plexiglass contaminated paper bin in the waste hood.
C. Pour the molten naphthalene mixture into the specified waste container. (lift the red lid before pouring) DO NOT POUR THE LIQUID INTO THE SINK !!!
D. Rinse the test tube with small amounts (2 mL) of acetone, pouring this waste solution into the appropriate waste container until the test tube is clean.
Have we mentioned that you will not pour anything from this lab down the sink?!?

9. Plot a graph of temperature versus time for each data set. Guidelines for graphing:
Use a scatter plot without lines in excel.
Do not add a trend line. You will draw two lines by hand after printing.
Give the graph a descriptive title. For example “Pressure versus Temperature of Gas in a Weather Balloon”, not just “Pressure vs Temperature”.
Label the axes with the type of unit (ex: pressure, temperature, time) and the unit itself (ex: atm, oC, s)
Number the axes so that the data takes up most of the graph. For most axes, it is not appropriate to start at zero.
Insert gridlines at least every 1oC otherwise it will be difficult to interpret the temperature at the line intersection of your hand drawn lines.
Print your graphs so that each one takes up at least a half a page. You will not be able to accurately interpret the freezing point on tiny graphs.
These plots are cooling curves – they show how temperature falls over time as the sample loses energy to the surroundings. During phase changes, the temperature will plateau. The phase change from liquid to solid is exothermic. As this phase change occurs, all energy loss goes to this transformation, not to changing the temperature. In an idealized sample, the temperature will not drop again until all the liquid has been converted to solid. Example 1 shows what this would look like, and this is also how cooling curves in your textbook will look. The freezing point of the sample is the temperature of the plateau. However, in lab, some naphthalene evaporates as the experiment procedes, so we do got get idealized graphs like Example 1, we get graphs that look like Example 2. The temperature stays relatively steady during the phase change, but it drops off at a slow rate. Determining the freezing point of a sample.
Determine which data points represent pure liquid cooling (the steeper part of the curve). Using a straight edge, draw an estimated best fit line for those data points.
The rest of the data points (with the shallow slope) represent the liquid to solid phase change. Using a straight edge, draw an estimated best fit line for these data points.
The intersection of the two lines is your freezing point. Estimate its value to the nearest 0.2oC

Name_________________________
CHM112 Lab – Molar Mass by Freezing Point Depression – Grading Rubric
Criteria Points possible Points earned
Lab Performance
Printed lab handout and rubric was brought to lab
3
Safety and proper waste disposal procedures observed
2
Followed procedure correctly without depending too much on instructor or lab partner
3
Work space and glassware was cleaned up
1
Lab Report
Calculations for molar mass shown clearly with units.
2
Graph 1 & 2 (titled, axis labeled, gridlines every 1o, data takes up majority of graph, two lines hand drawn on each, freezing point clearly labeled.)
4
Question 1
1
Question 2
3
Question 3
1
Total
20
Subject to additional penalties as per the instructor.

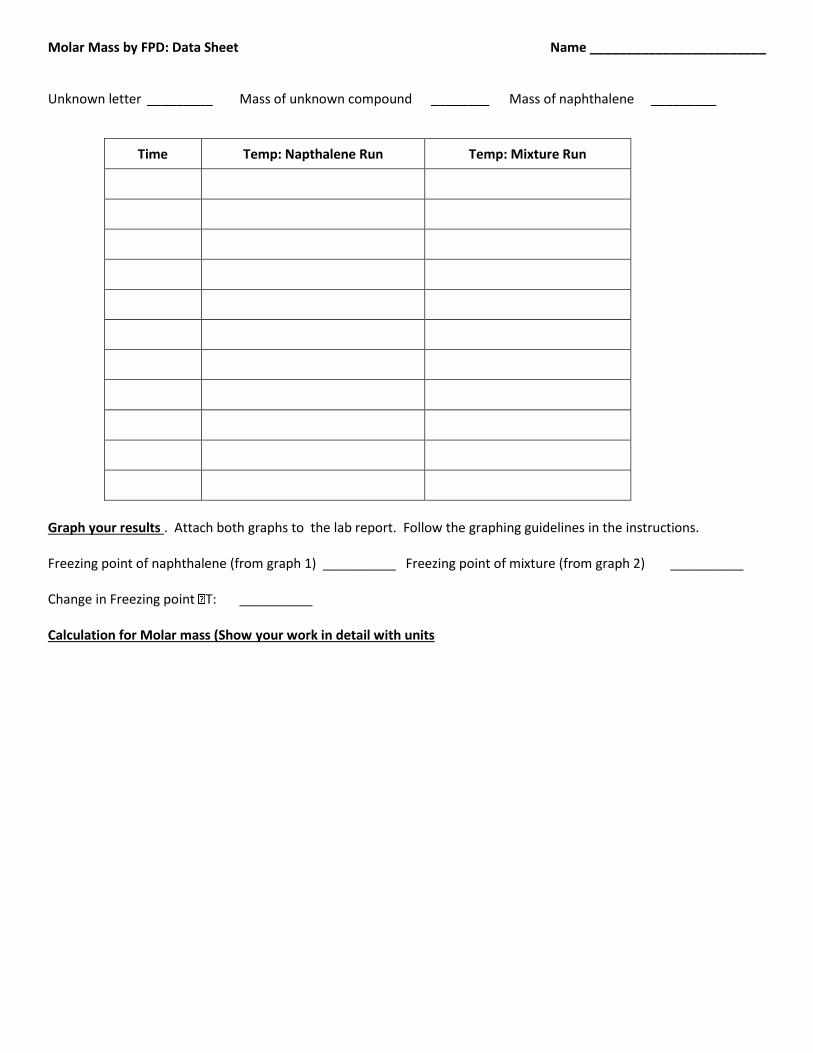
Molar Mass by FPD: Data Sheet Name ________________________
Unknown letter _________ Mass of unknown compound ________ Mass of naphthalene _________
Time Temp: Napthalene Run Temp: Mixture Run
Graph your results . Attach both graphs to the lab report. Follow the graphing guidelines in the instructions. Freezing point of naphthalene (from graph 1) __________ Freezing point of mixture (from graph 2) __________ Change in Freezing point T: __________ Calculation for Molar mass (Show your work in detail with units

1. Look up the formulas and molar masses of all the possible unknowns (p-dichloro benzene, Benzophenone, Benzil) from a reliable source (CRC handbook or the NIST web book) and list them below. Based on your results, what is your unknown? Explain clearly the reason for your choice.
2. Find the structures of naphthalene and your unknown (based on your answer in 1). a) Draw the Lewis structures for
each. Include all bonds and lone pairs. b) State which intermolecular forces are present in naphthalene and your
unknown. c) Explain why your unknown dissolves in naphthalene based on your answer to b).
3. Compare the molar mass that you obtained from your experiment to the correct molar mass for your unknown.
Calculate the percent error.
percent error = (|actual value-experimental value|
actual value) ×100%

Experiment #5. Iodine Clock Reaction Part 1 Introduction In this experiment you will determine the Rate Law for the following oxidation-reduction reaction:
2 H+ (aq) + 2 I— (aq) + H2O2 (aq) I 2 (aq) + 2 H2O (l) (1)
The rate or speed of the reaction is dependent on the concentrations of iodide ion (I-) and hydrogen peroxide,
H2O2. (The spectator ions are left off the reaction.) Therefore, we can write the Rate Law (concentration dependence) for the reaction as:
Rate = k [I]x [H2O2]y (2)
Where: x is the order of the reaction in I-, y is the order of the reaction in H2O2, and k is the rate constant.
The temperature dependence of the rate is seen in k – that is, there is a separate value of k for each
temperature at which the reaction takes place. The temperature must therefore be held constant to accurately calculate x, y and k. Since the Rate Law is empirical, we have to go to the lab to make measurements that will enable these values to be calculated. The rate will be measured for the reaction near time = 0, so that few products been formed and there will be no reverse reaction. The concentrations of iodide and hydrogen peroxide will be varied and the rates compared to find each order (i.e., the exponents x and y). This is the Method of Initial Rates and it will be used to find x, y and k.
As with a lot of kinetics, the concentration of reactants or products at any instant is difficult to measure directly, so in this lab the rate will be determined indirectly. We have a very handy test for the presence of one of the products, iodine (I2), namely starch. Starch reacts with iodine to form a blue/black colored complex. Unfortunately as soon as any iodine is produced it will react to make the complex and the solution will turn blue/black instantaneously. Thus, using starch as an indicator by itself would not be of much help. It confirms that some amount of I2 is being formed, but it tells us nothing about what we are trying to measure - the rate (how long it takes to produce a given quantity of I2.)
To get around this problem we will introduce a side reaction that will remove the initial I2 that is produced by
our main reaction. This will prevent the solution from turning black long enough so that we can make some time measurements. We will use the following side reaction:
I2 (aq) + 2 S2O3 2— (aq) 2 I—
(aq) + S4O6 2— (aq) (3)
S2O3
2—, thiosulfate ion , reacts with I2 which prevents the solution from turning blue/black. How will this help? Since we have carefully measured the amount of thiosulfate (a small amount that will run out fairly quickly), we know exactly how much iodine it will take to react with this thiosulfate. Once the small amount thiosulfate has completely reacted, I2 will start to build up in the solution. As soon as the thiosulfate runs out, I2 will react with the starch and the solution will turn blue/black. By putting in this "time delay", we can now calculate the rate at which I2 is being formed. The rate of reaction is equal to the change in concentration divided by the change in time. The change in time will be the time it takes for the solution to turn dark. We will calculate the change in concentration in I2 based on the amount of thiosulfate added. Using the known volume and molarity, we can calcuate moles of thiosulfate (S2O3
2—). Based on stoichiometry, we can calculate the moles of I2 : according to equation (3), 2 moles of thiosulfate react with every 1 mole of I2, this gives us the change in moles, however for the rate formula we need change in concentration. Divide the moles of I2 reacted by the total volume to find the change in molarity. Rate = [∆I2] /∆t (4)

Equipment
Three 125 or 250 mL Erlenmeyer flasks Three 100 or 150 mL beakers 10 ml and 5 ml Pipettes Thermometer Stop watch or other time keeper
One bin of chemicals per group that will contain:
0.050 M KI 0.050 M NaCl 0.010 M Na2S2O3 0.050 M H2O2
1.0 M H2SO4 1% starch solution
Disposal: All mixtures Spill/Disposal B1 (down the sink)
Procedure:
1. Before coming to lab, complete the initial concentration table below showing all work. Initial concentrations are not the concentration of the solutions you start with (i.e. not 0.050M for I- and H2O2). Initial concentrations are the concentration of species in the final total volume of contents of the Erlenmeyer plus beaker for each run (see tables in steps 4 & 6). Determine initial concentrations using the formula M1V1 = M2V2. M1 and V1 are the molarity and volume of the solutions added, V2 is the total volume of the Erlenmeyer plus beaker. Copy these initial values onto the table in the data sheet.
Run [ I—] (initial) [H2O2] (initial)
1 (Flask 1 + beaker 1)
(15.0 mL)(0.050M) = (42.5 ml)(M2) Solving for M2, we get [ I—] (initial)= 0.018 M
2 (Flask 2 + beaker 2)
3 (Flask 3 + beaker 3)
2. Clean and mostly dry three Erlenmeyer flasks. Label them 1, 2 and 3. 3. Obtain a bin of chemicals for your group. Use only these chemicals for all of your runs. Use fresh pipettes for each
solution. Rinse pipette twice with the solution that you will be measuring and keep this prepared pipette with the corresponding solution.
4. Add the amounts of the solutions below to prepare each flask. The chemicals must be added in the order listed (top
to bottom).
Flask #1 Flask #2 Flask #3
0.050 M KI 15.0 mL 15.0 mL 7.5 mL
1% Starch 5.0 mL 5.0 mL 5.0 mL
0.010 M Na2S2O3 2.5 mL 2.5 mL 2.5 mL
1 M H2SO4 5.0 mL 5.0 mL 5.0 mL
0.050 M NaCl 0 0 7.5 mL
Note: The NaCl solution is added so that the ionic strength of and volume of each solution is the same.
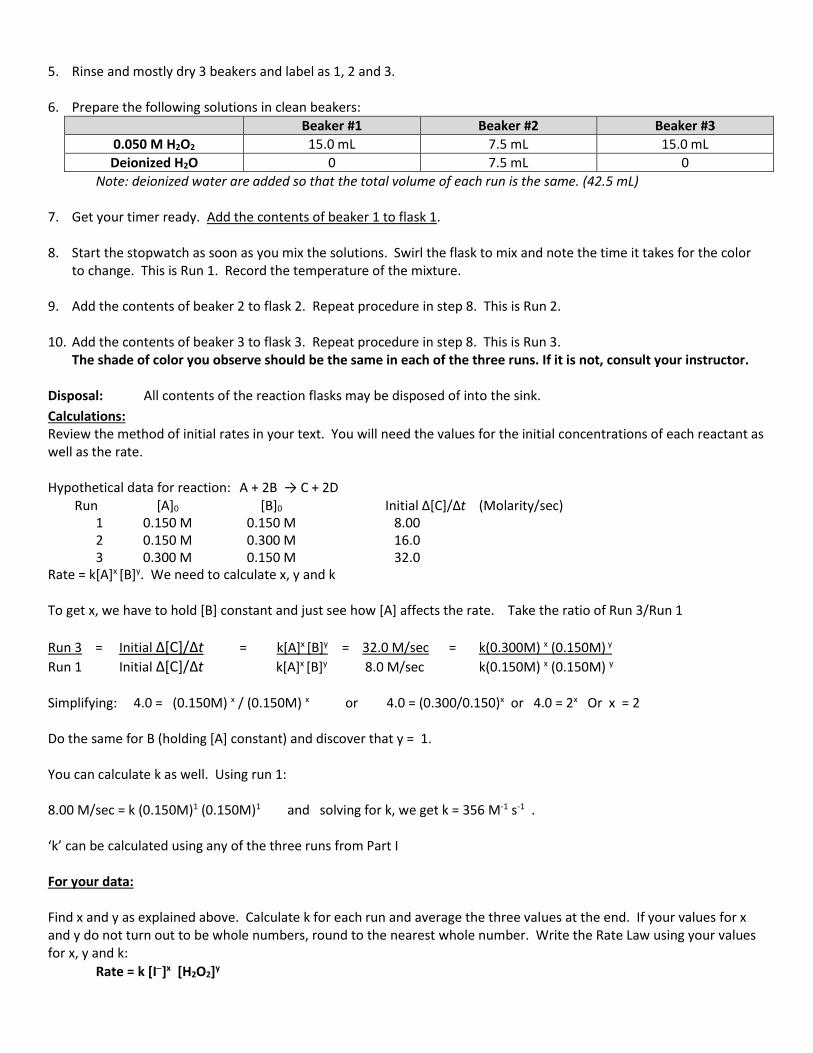
5. Rinse and mostly dry 3 beakers and label as 1, 2 and 3. 6. Prepare the following solutions in clean beakers:
Beaker #1 Beaker #2 Beaker #3
0.050 M H2O2 15.0 mL 7.5 mL 15.0 mL
Deionized H2O 0 7.5 mL 0
Note: deionized water are added so that the total volume of each run is the same. (42.5 mL)
7. Get your timer ready. Add the contents of beaker 1 to flask 1. 8. Start the stopwatch as soon as you mix the solutions. Swirl the flask to mix and note the time it takes for the color
to change. This is Run 1. Record the temperature of the mixture. 9. Add the contents of beaker 2 to flask 2. Repeat procedure in step 8. This is Run 2. 10. Add the contents of beaker 3 to flask 3. Repeat procedure in step 8. This is Run 3.
The shade of color you observe should be the same in each of the three runs. If it is not, consult your instructor.
Disposal: All contents of the reaction flasks may be disposed of into the sink.
Calculations: Review the method of initial rates in your text. You will need the values for the initial concentrations of each reactant as well as the rate. Hypothetical data for reaction: A + 2B → C + 2D Run [A]0 [B]0 Initial ∆[C]/∆t (Molarity/sec) 1 0.150 M 0.150 M 8.00
2 0.150 M 0.300 M 16.0 3 0.300 M 0.150 M 32.0 Rate = k[A]x [B]y. We need to calculate x, y and k To get x, we have to hold [B] constant and just see how [A] affects the rate. Take the ratio of Run 3/Run 1
Run 3 = Initial ∆[C]/∆t = k[A]x [B]y = 32.0 M/sec = k(0.300M) x (0.150M) y
Run 1 Initial ∆[C]/∆t k[A]x [B]y 8.0 M/sec k(0.150M) x (0.150M) y Simplifying: 4.0 = (0.150M) x / (0.150M) x or 4.0 = (0.300/0.150)x or 4.0 = 2x Or x = 2 Do the same for B (holding [A] constant) and discover that y = 1. You can calculate k as well. Using run 1: 8.00 M/sec = k (0.150M)1 (0.150M)1 and solving for k, we get k = 356 M-1 s-1 . ‘k’ can be calculated using any of the three runs from Part I For your data: Find x and y as explained above. Calculate k for each run and average the three values at the end. If your values for x and y do not turn out to be whole numbers, round to the nearest whole number. Write the Rate Law using your values for x, y and k:
Rate = k [I]x [H2O2]y

Name_________________________
CHM112 Lab – Iodine Clock Reaction Part 1 – Grading Rubric
Criteria Points possible Points earned
Lab Performance
Printed lab handout and rubric was brought to lab
3
Initial concentrations completed before coming to lab.
2
Safety and proper waste disposal procedures observed
2
Followed procedure correctly without depending too much on instructor or lab partner
3
Work space and glassware was cleaned up
1
Lab Report
Calculations for change in molarity (work shown) 1
Rate law calculations 2
Rate constant calculations 2
Question 1 0.5
Question 2 1
Question 3 1.5
Question 4 1
Total
20
Subject to additional penalties at the discretion of the instructor.

Iodine Clock Reaction Part 1: Data Sheet Name ___________________
Show your calculations for moles of I2 reacted: (find through moles of S2O32-)
Show your calculation for molarity of I2 reacted [∆I2]: (divide moles reacted by total reaction volume)
Run Temp(oC) Initial [ I-] M Initial [H2O2] M ReactionTime (in s)
∆t Reaction Rate (in Ms-1)
= [∆I2] / ∆t
1
2
3
Show calculations for x and y: (Include appropriate units, attach a separate sheet if necessary.) x = ______ y = _______ (round to the nearest whole number) Rate Law : __________________________ Show calculations for k: k (run 1) = __________ k (run 2) = __________ k (run 3) = __________ Average k = __________
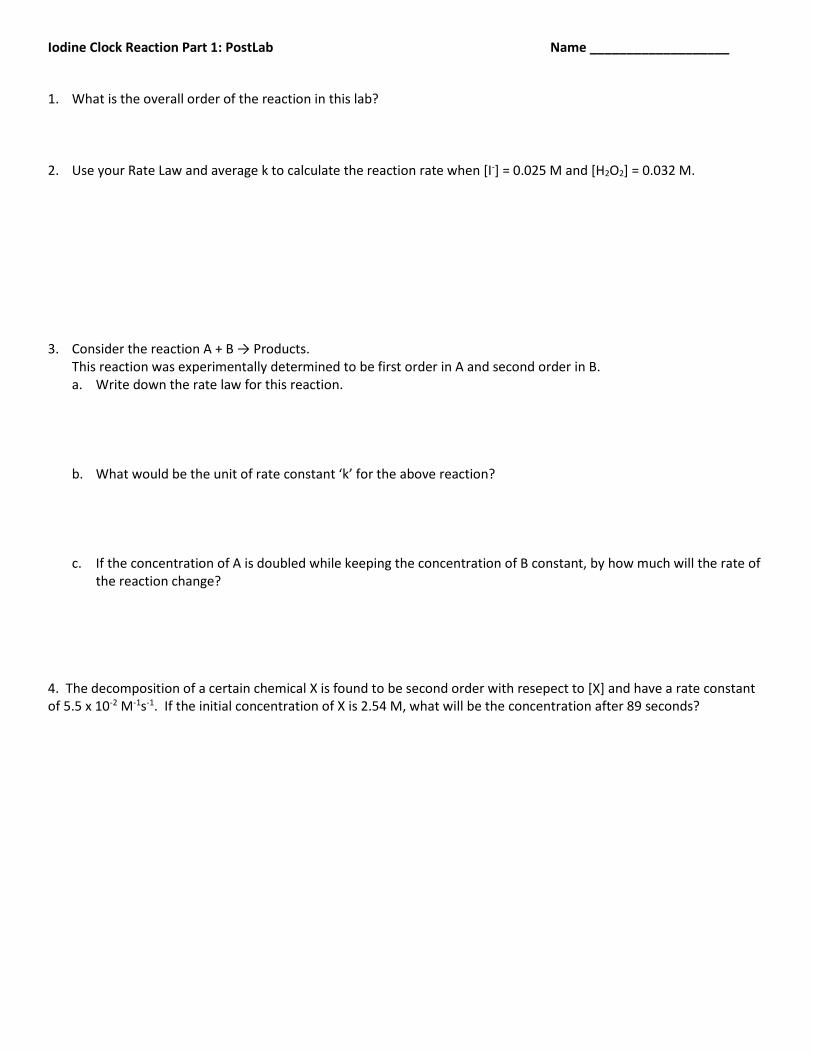
Iodine Clock Reaction Part 1: PostLab Name ___________________
1. What is the overall order of the reaction in this lab? 2. Use your Rate Law and average k to calculate the reaction rate when [I-] = 0.025 M and [H2O2] = 0.032 M.
3. Consider the reaction A + B → Products.
This reaction was experimentally determined to be first order in A and second order in B. a. Write down the rate law for this reaction.
b. What would be the unit of rate constant ‘k’ for the above reaction?
c. If the concentration of A is doubled while keeping the concentration of B constant, by how much will the rate of the reaction change?
4. The decomposition of a certain chemical X is found to be second order with resepect to [X] and have a rate constant of 5.5 x 10⁻² M-1s-1. If the initial concentration of X is 2.54 M, what will be the concentration after 89 seconds?

Experiment #6. Iodine Clock Reaction Part 2
Introduction
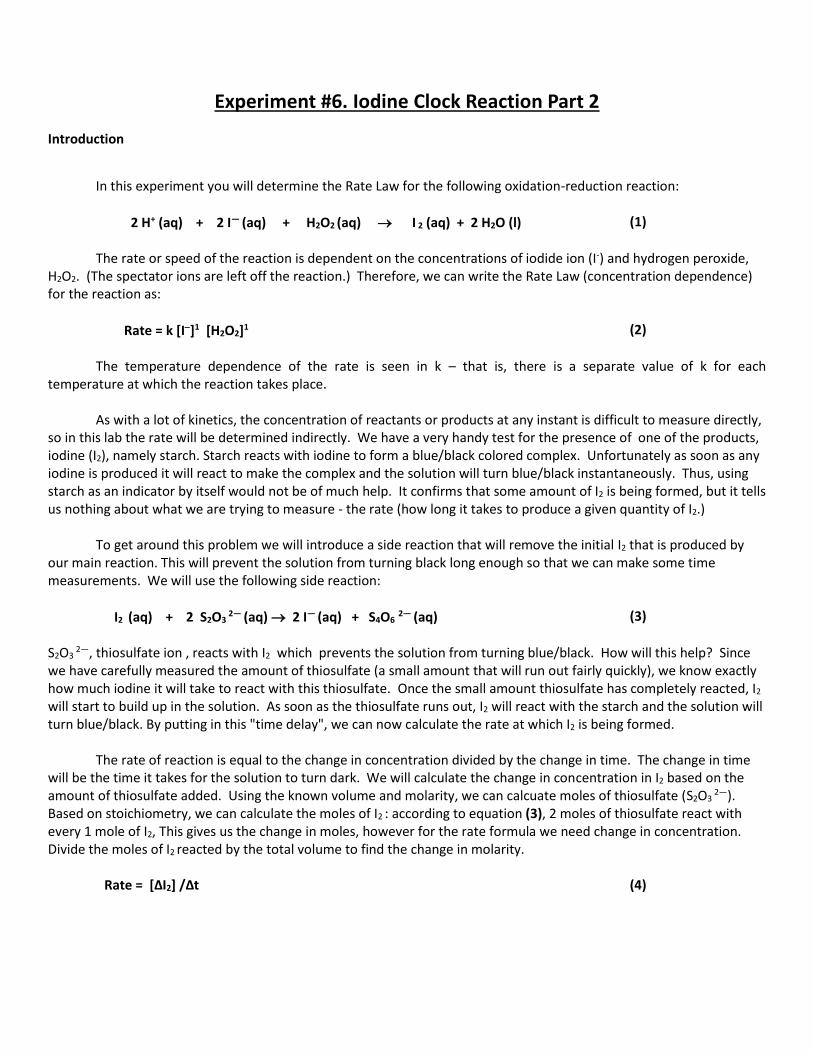
In this experiment you will determine the Rate Law for the following oxidation-reduction reaction:
2 H+ (aq) + 2 I— (aq) + H2O2 (aq) I 2 (aq) + 2 H2O (l) (1)
The rate or speed of the reaction is dependent on the concentrations of iodide ion (I-) and hydrogen peroxide,
H2O2. (The spectator ions are left off the reaction.) Therefore, we can write the Rate Law (concentration dependence) for the reaction as:
Rate = k [I]1 [H2O2]1 (2)
The temperature dependence of the rate is seen in k – that is, there is a separate value of k for each
temperature at which the reaction takes place.
As with a lot of kinetics, the concentration of reactants or products at any instant is difficult to measure directly, so in this lab the rate will be determined indirectly. We have a very handy test for the presence of one of the products, iodine (I2), namely starch. Starch reacts with iodine to form a blue/black colored complex. Unfortunately as soon as any iodine is produced it will react to make the complex and the solution will turn blue/black instantaneously. Thus, using starch as an indicator by itself would not be of much help. It confirms that some amount of I2 is being formed, but it tells us nothing about what we are trying to measure - the rate (how long it takes to produce a given quantity of I2.)
To get around this problem we will introduce a side reaction that will remove the initial I2 that is produced by
our main reaction. This will prevent the solution from turning black long enough so that we can make some time measurements. We will use the following side reaction:
I2 (aq) + 2 S2O3 2— (aq) 2 I—
(aq) + S4O6 2— (aq) (3)
S2O3
2—, thiosulfate ion , reacts with I2 which prevents the solution from turning blue/black. How will this help? Since we have carefully measured the amount of thiosulfate (a small amount that will run out fairly quickly), we know exactly how much iodine it will take to react with this thiosulfate. Once the small amount thiosulfate has completely reacted, I2 will start to build up in the solution. As soon as the thiosulfate runs out, I2 will react with the starch and the solution will turn blue/black. By putting in this "time delay", we can now calculate the rate at which I2 is being formed. The rate of reaction is equal to the change in concentration divided by the change in time. The change in time will be the time it takes for the solution to turn dark. We will calculate the change in concentration in I2 based on the amount of thiosulfate added. Using the known volume and molarity, we can calcuate moles of thiosulfate (S2O3
2—). Based on stoichiometry, we can calculate the moles of I2 : according to equation (3), 2 moles of thiosulfate react with every 1 mole of I2, This gives us the change in moles, however for the rate formula we need change in concentration. Divide the moles of I2 reacted by the total volume to find the change in molarity. Rate = [∆I2] /∆t (4)

Equipment
Three 125 or 250 mL Erlenmeyer flasks Three 100 or 150 mL beakers 10 ml and 5 ml Pipettes Thermometer Stop watch or other time keeper Hot water bath Ice bath
One bin of chemicals per group that will contain:
0.050 M KI 0.010 M Na2S2O3 0.050 M H2O2
1.0 M H2SO4 (Spill : B1) 1% starch solution
Disposal: All mixtures Spill/Disposal B1 (down the sink)
Procedure:
11. Before coming to lab, complete the initial concentration table below showing all work. Determine initial concentrations using the formula M1V1 = M2V2. Note that since we are changing temperature, concentration will be kept constant. Copy these values onto the table in the data sheet.
Run [ I—] (initial) [H2O2] (initial)
1 (Flask 1 + beaker 1)
2 (Flask 2 + beaker 2)
3 (Flask 3 + beaker 3)
12. Clean and mostly dry three Erlenmeyer flasks. Label them 1, 2 and 3. 13. Obtain a bin of chemicals for your group. Use only these chemicals for all of your runs. Use fresh pipettes for each
solution. Rinse pipette twice with the solution that you will be measuring and keep this prepared pipette with the corresponding solution.
14. Add the amounts of the solutions below to prepare each flask. The chemicals must be added in the order listed (top
to bottom).
Flask #1 Flask #2 Flask #3
0.050 M KI 15.0 mL 15.0 mL 15.0 mL
1% Starch 5.0 mL 5.0 mL 5.0 mL
0.010 M Na2S2O3 2.5 mL 2.5 mL 2.5 mL
1 M H2SO4 5.0 mL 5.0 mL 5.0 mL
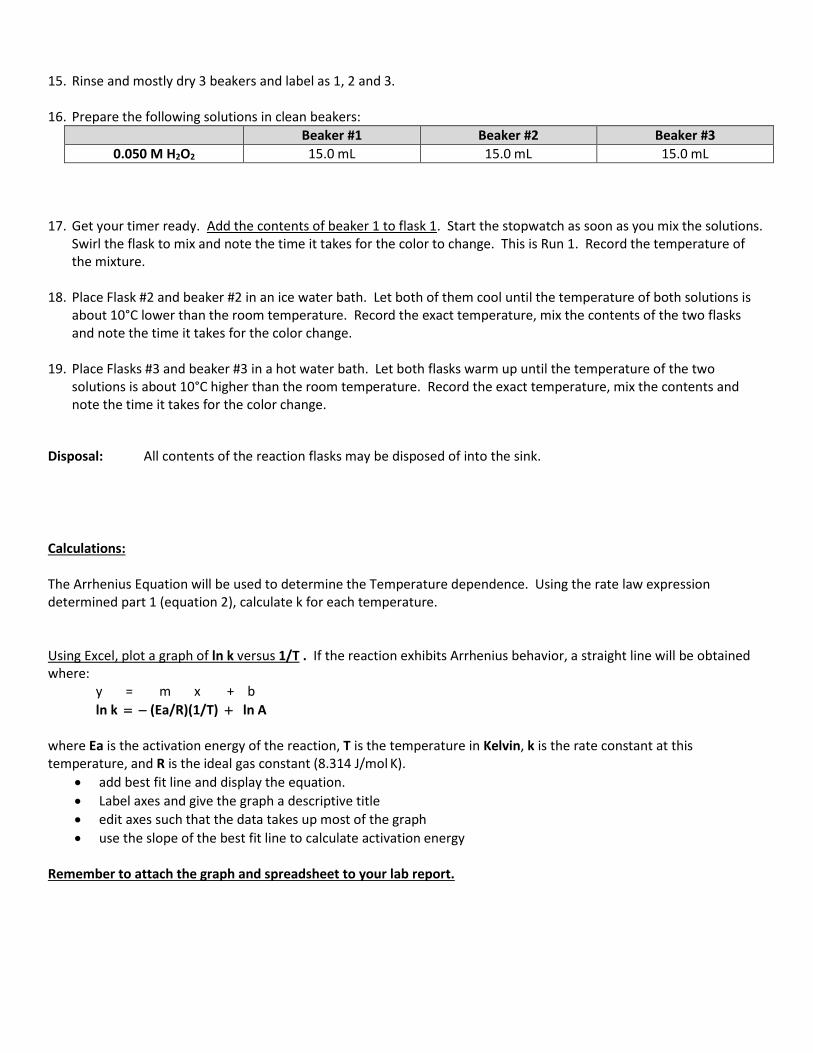
15. Rinse and mostly dry 3 beakers and label as 1, 2 and 3. 16. Prepare the following solutions in clean beakers:
Beaker #1 Beaker #2 Beaker #3
0.050 M H2O2 15.0 mL 15.0 mL 15.0 mL
17. Get your timer ready. Add the contents of beaker 1 to flask 1. Start the stopwatch as soon as you mix the solutions.
Swirl the flask to mix and note the time it takes for the color to change. This is Run 1. Record the temperature of the mixture.
18. Place Flask #2 and beaker #2 in an ice water bath. Let both of them cool until the temperature of both solutions is
about 10°C lower than the room temperature. Record the exact temperature, mix the contents of the two flasks and note the time it takes for the color change.
19. Place Flasks #3 and beaker #3 in a hot water bath. Let both flasks warm up until the temperature of the two
solutions is about 10°C higher than the room temperature. Record the exact temperature, mix the contents and note the time it takes for the color change.
Disposal: All contents of the reaction flasks may be disposed of into the sink.
Calculations: The Arrhenius Equation will be used to determine the Temperature dependence. Using the rate law expression determined part 1 (equation 2), calculate k for each temperature. Using Excel, plot a graph of ln k versus 1/T . If the reaction exhibits Arrhenius behavior, a straight line will be obtained where: y = m x + b
ln k (Ea/R)(1/T) ln A where Ea is the activation energy of the reaction, T is the temperature in Kelvin, k is the rate constant at this temperature, and R is the ideal gas constant (8.314 J/mol K).
add best fit line and display the equation.
Label axes and give the graph a descriptive title
edit axes such that the data takes up most of the graph
use the slope of the best fit line to calculate activation energy Remember to attach the graph and spreadsheet to your lab report.


Name_________________________
CHM112 Lab – Iodine Clock Reaction Part 2 – Grading Rubric
Criteria Points possible Points earned
Lab Performance
Printed lab handout and rubric was brought to lab
3
Initial concentrations completed before coming to lab.
2
Safety and proper waste disposal procedures observed
2
Followed procedure correctly without depending too much on instructor or lab partner
3
Work space and glassware was cleaned up
1
Lab Report
Calculations for reaction rate and rate constant
3
Graph & spreadsheet attached (trendline displayed, follows guidelines in lab instructions)
3
Calculations for activation energy
1
Question 1
1
Question 2
1
Total
20
Subject to additional penalties at the discretion of the instructor.

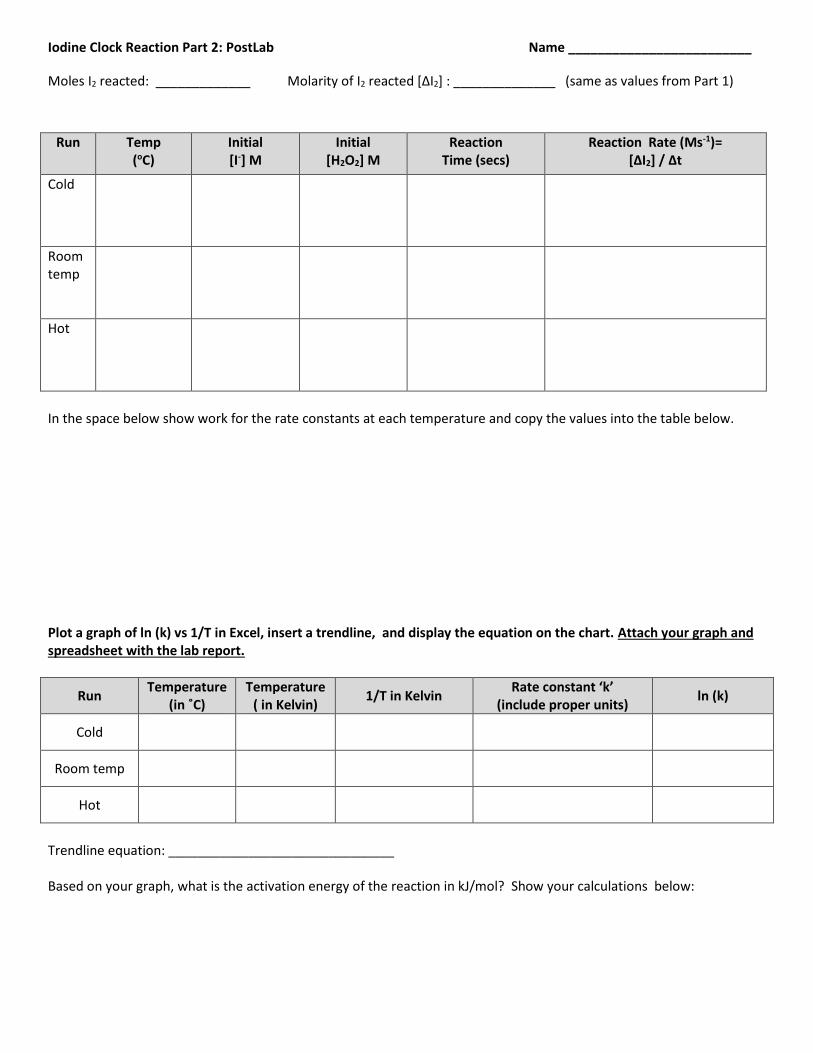
Iodine Clock Reaction Part 2: PostLab Name _________________________
Moles I2 reacted: _____________ Molarity of I2 reacted [∆I2] : ______________ (same as values from Part 1)
Run Temp (oC)
Initial [I-] M
Initial [H2O2] M
Reaction Time (secs)
Reaction Rate (Ms-1)= [∆I2] / ∆t
Cold
Room temp
Hot
In the space below show work for the rate constants at each temperature and copy the values into the table below.
Plot a graph of ln (k) vs 1/T in Excel, insert a trendline, and display the equation on the chart. Attach your graph and spreadsheet with the lab report.
Run Temperature
(in ˚C) Temperature
( in Kelvin) 1/T in Kelvin
Rate constant ‘k’ (include proper units)
ln (k)
Cold
Room temp
Hot
Trendline equation: _______________________________ Based on your graph, what is the activation energy of the reaction in kJ/mol? Show your calculations below:
1. If the actual value for the activation energy is 53 kJ/mole, using your calculated value for Ea, calculate the percent error.
2. Using your Arrhenius Plot and the best fit equation calculate the value for your rate constant at 85.0 °C.

Experiment #7. Determination of an Equilibrium Constant
Introduction
It is frequently assumed that reactions go to completion, that all of the reactants are converted into products. Most chemical reactions do not go to completion because they are equilibrium systems where the reaction proceeds in both directions. As the reactants are used up, the rate of the forward reaction decreases. Conversely, as the concentrations of the products increase, the rate of the reverse reaction increases. Eventually, the rate of the forward reaction equals the rate of the reverse reaction and the concentrations of the reactants and the products stay constant. The system has reached a state of dynamic equilibrium. At equilibrium, both the forward and reverse reactions are occuring, but no net change is observed. Consider the general reaction:
aA bB ⇌ cC dD where a,b,c and d are the stoiochiometric coefficicents.
( 1 )
Experimental evidence shows that the ratio of products to reactants (with each product and reactant expressed as a molar concentration and raised to its stiochiometric coefficient) is a constant for a reaction that has reached equilibrium. This constant, which is different for each chemical reaction, is known as the equilibrium constant and is designated with the letter K. There is a separate value of K for each temperature at which the reaction occurs. Thus, at equilibrium, the equilibrium constant K is equal to:
K =
C D
A B
c d
a b
( 2 )
where the brackets [ ] imply molarity and the exponents are the stoichiometric coeffients of the balanced chemical equation. The equilibrium constant measures the extent to which a chemical reaction occurs. The larger the value for K, the greater the tendency for the reaction to go to completion is and the more products will be formed relative to the reactants. In this experiment you will determine the equilibrium constant for the following reaction: (Spectator ions are not shown.) Fe 3+ (aq) + SCN- (aq) ⇌ FeSCN 2+ (aq) ( 3 )
K
SCNFe
FeSCN3
2
( 4 )
Solutions of Fe3+ and SCN- will be mixed and will react to form some FeSCN 2+. The initial amounts of Fe3+ and
SCN- can be calculated. The equilibrium concentration of FeSCN 2+ will be found using its spectroscopic properties – how much light it absorbs at a specific wavelength. FeSCN 2+ is a blood red complex that absorbs the blue-green wavelengths of visible light. Its absorbance is directly proportional to its concentration. The absorbance (a measure of the amount of light absorbed) will be measured by a spectrophotometer. Solutions to be measured are placed in cuvettes; these are square tubes have minimal absorbance in the wavelength range of the spectrophotometer.

A cuvette for measuring light absorption. It is usually made of quartz or plastic. On some, two of the sides are frosted.
For a solution placed in a 1 cm cuvette, the absorbance, A, is equal to the “extinction
coefficient”, ε (epsilon), times the molar concentration, C. The value of ε is can be determined experimentally for each substance from solutions of known concentration at a particualr wavelength. ε varies with the wavelength of light. In this experiment we will be measuring absorbtion at 470 nm.
A = ε C ( 5 )
We will use a best-fit line equation to find the concentration from the absorbance measurement for each sample. Using an equilibrium (ICE) chart, the equilibrium concentrations of Fe 3+ and HSCN are then calculated. Finally, the equilibrium concentrations are put into equation ( 4 ) to find the equilibrium constant, K. Note: All of the solutions are made in 1.0M HNO3(aq), so be cautious and wear gloves.
Equipment
4 small beakers 5 cuvettes stirring rod thermometer Venier equipment and colorimeter
Chemicals
0.0020 M KSCN(aq), potassium thiocyanate (source of SCN-) 0.200 M Fe(NO3)3(aq), iron (III) nitrate dissolved in 1.0M HNO3(aq). (Source of Fe3+) 0.0020 M Fe(NO3)3(aq), iron (III) nitrate dissolved in 1.0M HNO3(aq). (Source of Fe3+)
Spill/Disposal The contents of all test tubes, cuvettes, and beakers may be disposed of in the sink. Flush with a large
volume of water.
Prelab Calculations Note: you MUST have these calculations done before coming to lab. For all 4 of the solutions you will prepare in Step 3 of the procedure, calculate [FeSCN2+]. For these solutions, assume that moles of SCN- = moles of FeSCN2+ (a large excess of Fe3+ makes the SCN- react completely). Use M1V1 = M2V2. V1 should be the volume of SCN- in that beaker, and V2 should be the total volume of everything in that beaker.
Beaker [FeSCN2+]
1
2
3
4
*You will need to enter these concentrations into Excel to make graphs for the postlab, so have these ready when you come to lab. Also, copy them into the first data table in your postlab.*

Procedure
1. Obtain 5 cuvettes. Fill one (to the mark) with distilled water. This will serve as a “blank” for calibration.
Notes for using cuvettes:
Handle cuvettes toward the top or bottom, so that the middle (where measurements are taken) stays free of fingerprints and scratches.
If there are bubbles in a filled cuvette, gently tap or knock the cuvette until the bubbles rise to the top (so they don’t interfere with the measurement).
Position the cuvette so that the measuring light passes through the clear sides (many cuvettes have frosted sides, which are bad for measuring). If you look inside the well of the colorimeter you will see two sides with holes where light passes through.
Before measuring, gently wipe the outside of each cuvette with a Kimwipe.
Use a lid to prevent spilling inside the colorimeter. Lids can be rinsed and reused.
Remember to remove the last cuvette before returning the spectrometer!
2. Obtain a Vernier Colorimeter, and connect it to a Labquest machine. Calibrate the Colorimeter with the blank:
a. Open the Colorimeter lid, insert the blank, and close the lid. b. Press the <or> button on the Colorimeter to select the 470 nm wavelength. c. Press and hold the CAL button until the red light begins to flash. Release the button. When the light stops
flashing, calibration is complete.
3. (Making standard solutions for a calibration line) Obtain 4 small beakers. Mix solutions in each beaker as shown in the table below, measuring all volumes with large, non-disposable pipets. Mix each solution thoroughly. Note: the products of this reaction begin forming immediately, but they degrade in light, so be sure to measure the absorbance of each solution within 2-5 minutes of mixing the chemicals. Beakers 1-4 are made from 0.200 M Fe(NO3)3. Beakers A,B, C are made from 0.0020M Fe(NO3)3. Do not mix these up!
Beaker 0.200 M Fe(NO3)3 (mL)
0.0020 M SCN- (mL)
Distilled H2O (mL)
1 5.0 4.0 41.0
2 5.0 3.0 42.0
3 5.0 2.0 43.0
4 5.0 1.0 44.0
4. For each beaker, rinse a cuvette with 1 mL portions of that beaker’s solution twice (discard the rinsings), then fill the cuvette to the mark with the solution. You should now have 4 filled cuvettes, one for each beaker. 5. Measure the absorbance of each cuvette solution, using the Colorimeter:
a. Open the Colorimeter lid, insert the cuvette for Beaker 1, and close the lid. As before, if the cuvette has frosted sides, be sure you insert it so that the beam passes through the clear sides.
b. Write down the absorbance for that cuvette in your first data table. (If the number never totally stops changing, then write down the number after 10-15 seconds, and move on.)
c. Repeat steps (a) and (b) for the cuvettes for Beakers 2, 3, and 4. 6. Measure and record the temperature of one of the solutions (since all the solutions are room temperature, we assume they all have the same temperature). 7. Either now, or after the experiment, plot the data from your first data table in Excel (or any other graphing program), with [FeSCN2+] on the x-axis, and absorbance on the y-axis. Add a linear trendline for the data, display the trendline equation, and write down the trendline equation below your first data table. You will need this equation for your calculations later.

8. (Making solutions for finding K) Obtain 3 more small beakers (or rinse out the previous beakers and reuse them). Mix solutions in each beaker as shown in the table below. Mix each solution thoroughly. Note: as before, the products of this reaction begin forming immediately, but they degrade in light, so be sure to measure the absorbance of each solution within 2-5 minutes of mixing the chemicals. *Please note that you are using 0.0020 M Fe(NO3)3 for these solutions, NOT the 0.200 M used previously.
Beaker 0.0020 M Fe(NO3)3 (mL)
0.0020 M SCN- (mL)
Distilled H2O (mL)
A 3.00 3.00 4.00
B 3.00 4.00 3.00
C 3.00 5.00 2.00
9. Wash out and reuse 3 of the cuvettes from the previous trials. Wash them out with distilled water. For each beaker, rinse a cuvette with 1 mL portions of that beaker’s solution twice (discard the rinsings), then fill the cuvette to the mark with the solution. You should now have 3 filled cuvettes, one for each beaker. Remember the cuvette tips at the beginning of the procedure. 10. Measure the absorbance of each solution:
d. Open the Colorimeter lid, insert the cuvette for Beaker A, and close the lid. As before, if the cuvette has frosted sides, be sure you insert it so that the beam passes through the clear sides.
e. Write down the absorbance for that cuvette in your second data table. f. Repeat steps (a) and (b) for the cuvettes for Beakers B and C. g. Use your trendline equation from step 7 to find the equilibrium concentration of [FeSCN2+]eq in beakers A, B and
C: for each beaker, plug in the absorbance as y, and solve for the x value, which is the [FeSCN2+]eq value for that
beaker.
11. Measure the temperature of one of the solutions, as before.
Disposal
The contents of all beakers, cuvettes, and pipets may be disposed of in the sink. Flush with a large volume of water.
Name_________________________
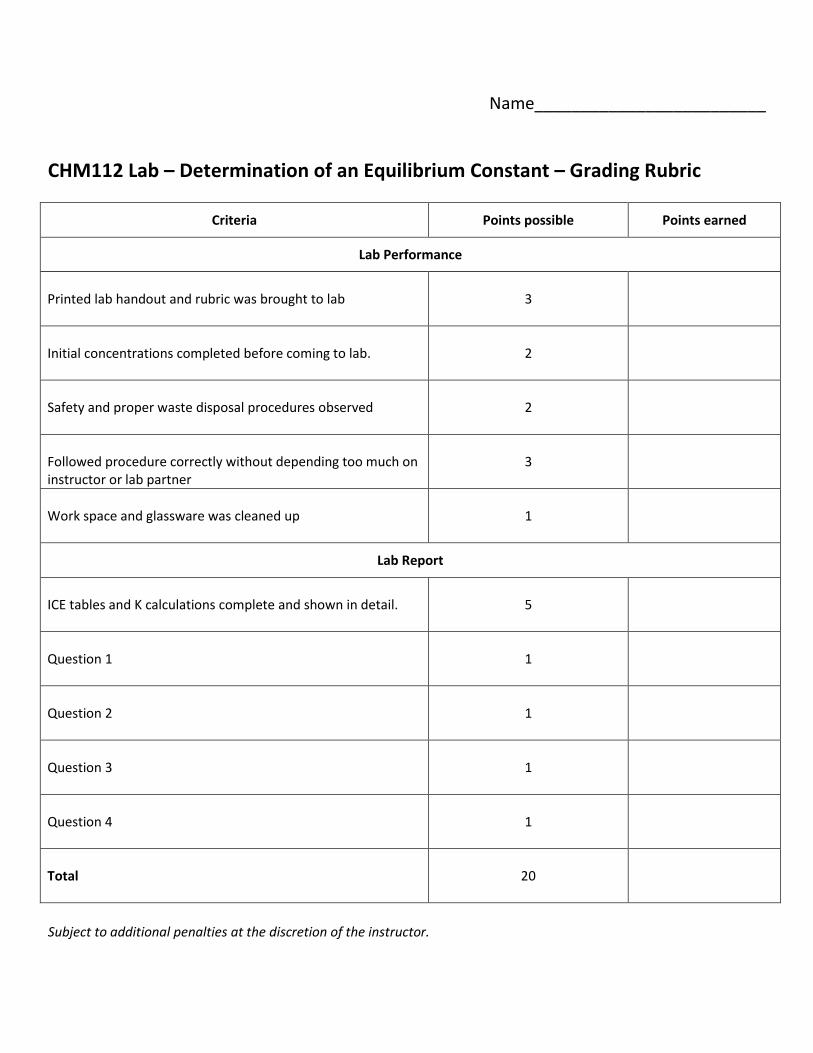
CHM112 Lab – Determination of an Equilibrium Constant – Grading Rubric
Criteria Points possible Points earned
Lab Performance
Printed lab handout and rubric was brought to lab
3
Initial concentrations completed before coming to lab.
2
Safety and proper waste disposal procedures observed
2
Followed procedure correctly without depending too much on instructor or lab partner
3
Work space and glassware was cleaned up
1
Lab Report
ICE tables and K calculations complete and shown in detail.
5
Question 1
1
Question 2
1
Question 3
1
Question 4
1
Total
20
Subject to additional penalties at the discretion of the instructor.

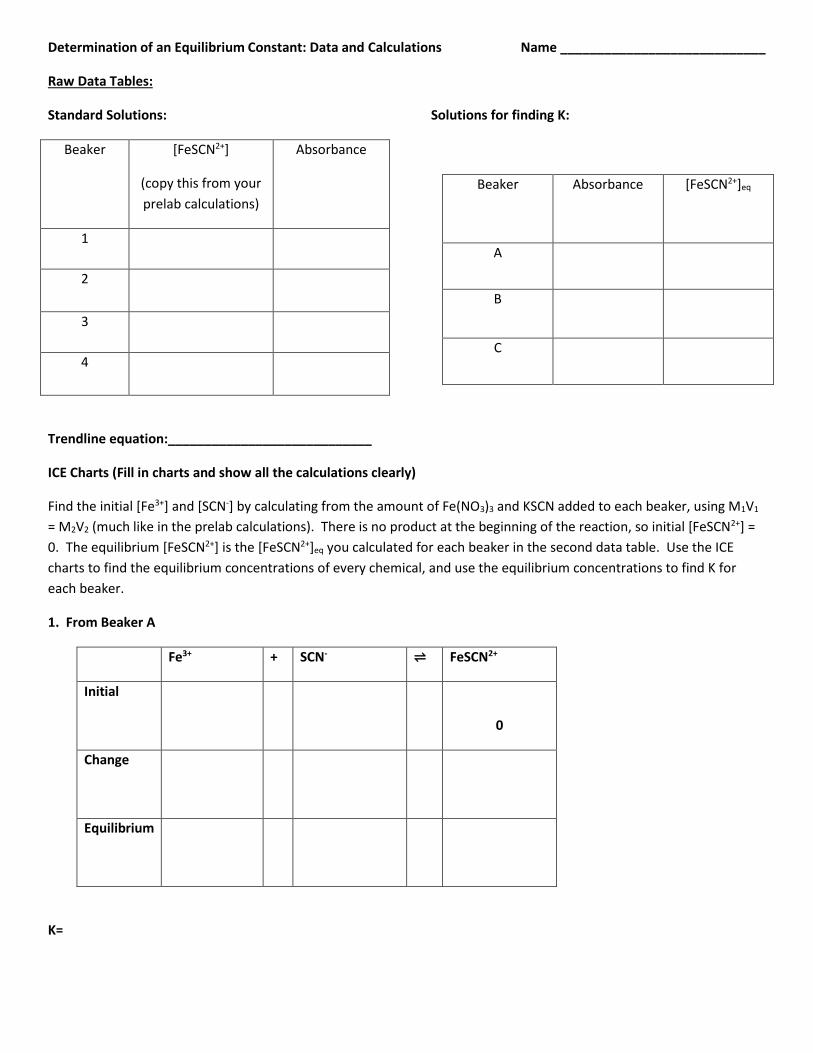
Determination of an Equilibrium Constant: Data and Calculations Name ____________________________
Raw Data Tables:
Standard Solutions: Solutions for finding K:
Beaker [FeSCN2+]
(copy this from your
prelab calculations)
Absorbance
1
2
3
4
Trendline equation:____________________________
ICE Charts (Fill in charts and show all the calculations clearly)
Find the initial [Fe3+] and [SCN-] by calculating from the amount of Fe(NO3)3 and KSCN added to each beaker, using M1V1
= M2V2 (much like in the prelab calculations). There is no product at the beginning of the reaction, so initial [FeSCN2+] =
0. The equilibrium [FeSCN2+] is the [FeSCN2+]eq you calculated for each beaker in the second data table. Use the ICE
charts to find the equilibrium concentrations of every chemical, and use the equilibrium concentrations to find K for
each beaker.
1. From Beaker A
Fe3+ + SCN- ⇌ FeSCN2+
Initial
0
Change
Equilibrium
K=
Beaker Absorbance [FeSCN2+]eq
A
B
C

2. From Beaker B
Fe3+ + SCN- ⇌ FeSCN2+
Initial
0
Change
Equilibrium
K=
3. From Beaker C
Fe3+ + SCN- ⇌ FeSCN2+
Initial
0
Change
Equilibrium
K=
Average K= __________________
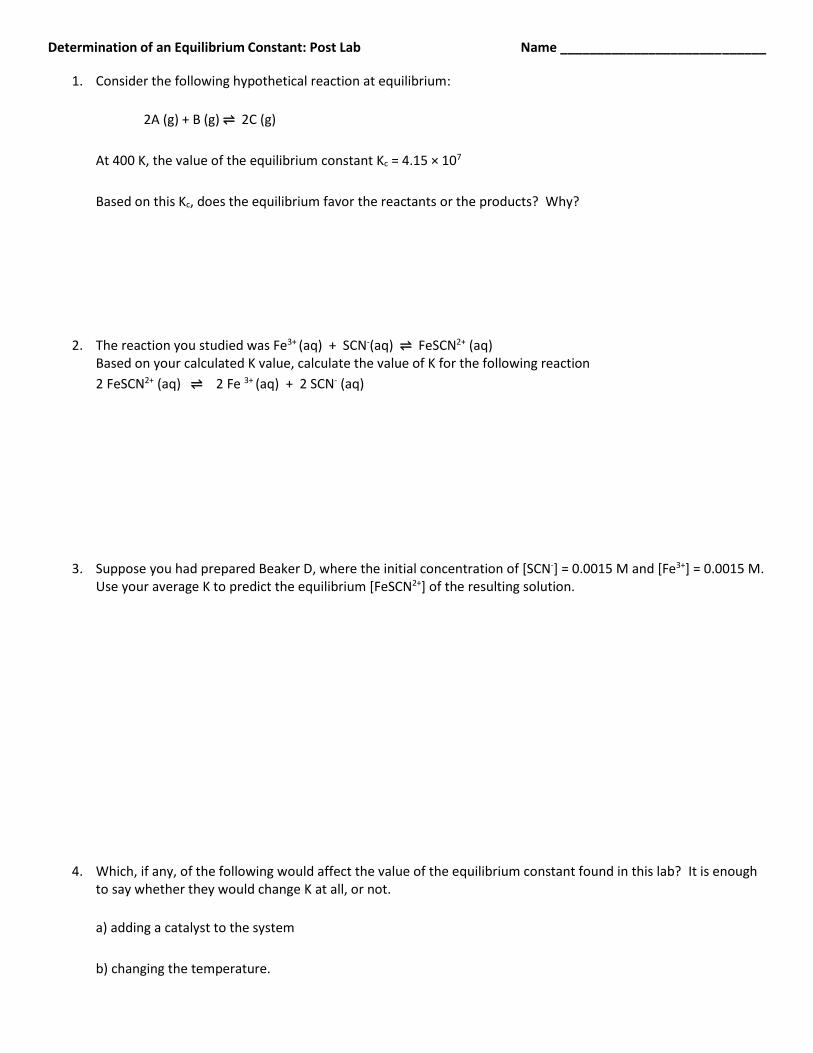
Determination of an Equilibrium Constant: Post Lab Name ____________________________
1. Consider the following hypothetical reaction at equilibrium:
2A (g) + B (g) ⇌ 2C (g)
At 400 K, the value of the equilibrium constant Kc = 4.15 × 10⁷
Based on this Kc, does the equilibrium favor the reactants or the products? Why?
2. The reaction you studied was Fe3+ (aq) + SCN-(aq) ⇌ FeSCN2+ (aq) Based on your calculated K value, calculate the value of K for the following reaction
2 FeSCN2+ (aq) ⇌ 2 Fe 3+ (aq) + 2 SCN- (aq)
3. Suppose you had prepared Beaker D, where the initial concentration of [SCN-] = 0.0015 M and [Fe3+] = 0.0015 M. Use your average K to predict the equilibrium [FeSCN2+] of the resulting solution.
4. Which, if any, of the following would affect the value of the equilibrium constant found in this lab? It is enough to say whether they would change K at all, or not.
a) adding a catalyst to the system
b) changing the temperature.

Experiment #8. LeChatelier’s Principle
Aim: To study the effect of concentration and temperature on chemical equilibrium
When the rate of the forward reaction becomes equal to the rate of the reverse reaction, we say that the
reaction is at equilibrium. We can disturb a reaction at equilibrium by changing the concentration, pressure/ volume or
temperature. According to LeChatelier’s Principle, when a system at equilibrium is disturbed by a change in
temperature, pressure or concentration, the system’s equilibrium will shift so as to counteract the effect of the
disturbance.
Consider the general equilibrium a A + b B c C + d D (1)
If we add a reactant, the equilibrium will shift towards the product side. This is because a portion of the added
reactant will be used up to form more products, until the equilibrium is re-established. If we remove a product, then to
compensate for the loss of the products, more product will be formed from the reactants and the equilibrium will shift
towards the products.
If we remove a reactant, then to compensate for the loss of the reactants, the product will decompose to form
reactants and therefore the equilibrium will shift towards the reactants. If we add a product, then the equilibrium will
shift to the reactants in order to consume the excess product.
We can also change the concentration of the reactants/products by carrying out a side reaction. For example, to
the equilibrium reaction in equation 1, we could add some compound F so that F reacts with C
c C + f F x X (2)
Due to reaction 2, the amount of C will decrease (because C is being used up in reaction 2) which means that the
equilibrium in reaction 1 will shift towards the product side to form more C.
Pressure changes can affect an equilibrium involving gases. If the pressure on the system increases (or the
volume decreases), then the equilibrium will shift towards the side with fewer total gas moles to decrease the pressure.
The opposite effect is observed when the pressure is decreased (or volume is increased). The system shifts in the
direction of the side with more gas moles to increase the pressure. Pressure can also be changed by adding an inert gas
(gas not participating in the equilibrium). However, this does not affect the equilibrium. If the pressure is
increased/decreased by adding/removing one of the gases participating in the equilibrium, then the effect will be the
same as adding /removing reactants/products.
Temperature also affects an equilibrium. An endothermic process will be favored (shifting towards the
formation of products) by an increase in temperature. An exothermic process will be favored (shifting towards the
formation of products) by a decrease in temperature.
Concentration, Pressure and Volume changes shift the equilibrium but do not change the value of the equilibrium
constant. Temperature changes, by contrast, not only shift the equilibrium but also change the value of the
equilibrium constant
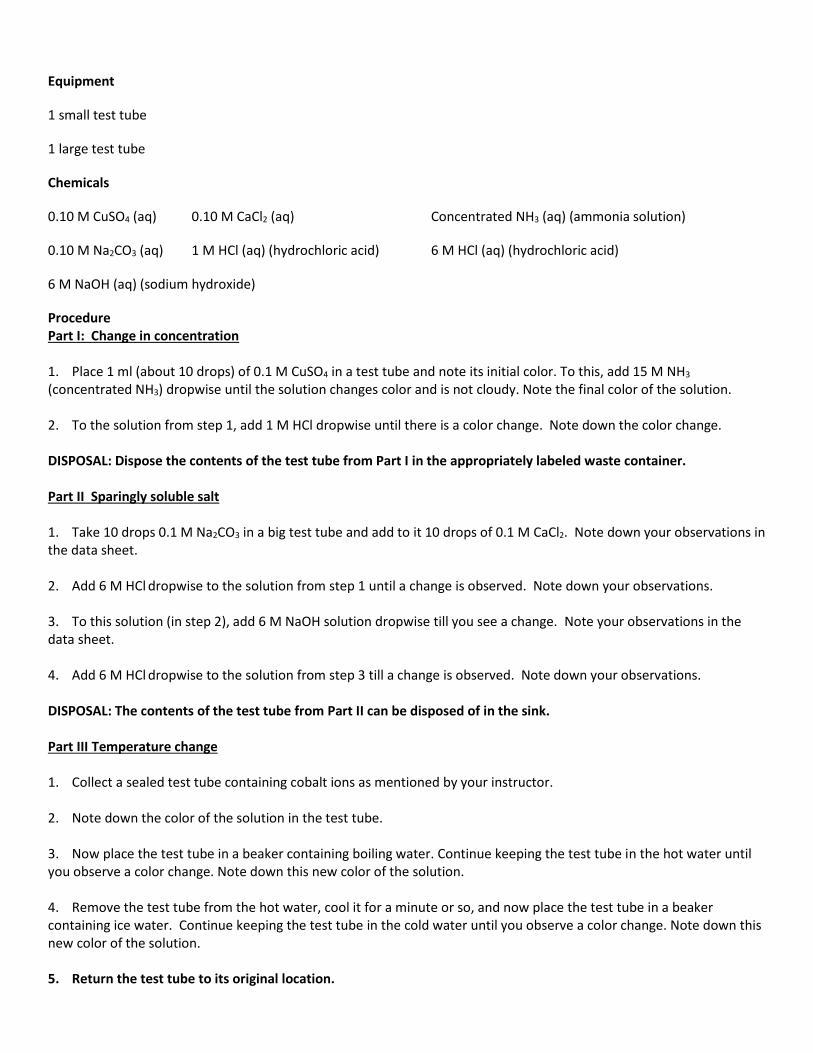
Equipment
1 small test tube
1 large test tube
Chemicals
0.10 M CuSO4 (aq) 0.10 M CaCl2 (aq) Concentrated NH3 (aq) (ammonia solution)
0.10 M Na2CO3 (aq) 1 M HCl (aq) (hydrochloric acid) 6 M HCl (aq) (hydrochloric acid)
6 M NaOH (aq) (sodium hydroxide)
Procedure Part I: Change in concentration 1. Place 1 ml (about 10 drops) of 0.1 M CuSO4 in a test tube and note its initial color. To this, add 15 M NH3 (concentrated NH3) dropwise until the solution changes color and is not cloudy. Note the final color of the solution. 2. To the solution from step 1, add 1 M HCl dropwise until there is a color change. Note down the color change. DISPOSAL: Dispose the contents of the test tube from Part I in the appropriately labeled waste container. Part II Sparingly soluble salt 1. Take 10 drops 0.1 M Na2CO3 in a big test tube and add to it 10 drops of 0.1 M CaCl2. Note down your observations in the data sheet. 2. Add 6 M HCl dropwise to the solution from step 1 until a change is observed. Note down your observations. 3. To this solution (in step 2), add 6 M NaOH solution dropwise till you see a change. Note your observations in the data sheet. 4. Add 6 M HCl dropwise to the solution from step 3 till a change is observed. Note down your observations. DISPOSAL: The contents of the test tube from Part II can be disposed of in the sink. Part III Temperature change 1. Collect a sealed test tube containing cobalt ions as mentioned by your instructor. 2. Note down the color of the solution in the test tube. 3. Now place the test tube in a beaker containing boiling water. Continue keeping the test tube in the hot water until you observe a color change. Note down this new color of the solution. 4. Remove the test tube from the hot water, cool it for a minute or so, and now place the test tube in a beaker containing ice water. Continue keeping the test tube in the cold water until you observe a color change. Note down this new color of the solution. 5. Return the test tube to its original location.

Name:___________________________
CHM112 Lab – LeChatelier’s Principle – Grading Rubric
Criteria Points possible Points earned
Lab Performance
Printed lab handout and rubric was brought to lab
3
Safety and proper waste disposal procedures observed
2
Followed procedure correctly without depending too much on instructor or lab partner
3
Work space and glassware was cleaned up
1
Lab Report
Part I: Observations correctly recorded
1
Part I: Analysis (1 pt each question), (shift direction correctly identified, reason for shift clearly explained)
2
Part II: Observations correctly recorded
1
Part II: Reactions (balanced with correct formulas, phases, and charges)
2
Part II: Analysis (1 pt each question), (shift direction correctly identified, reason for shift clearly explained)
2
Part III: Observations correctly recorded
1
Part III: Analysis (1 pt each question), (shift direction and endo/exo correctly identified, reason for shift clearly explained)
2
Total
20
Subject to additional penalties at the discretion of the instructor.

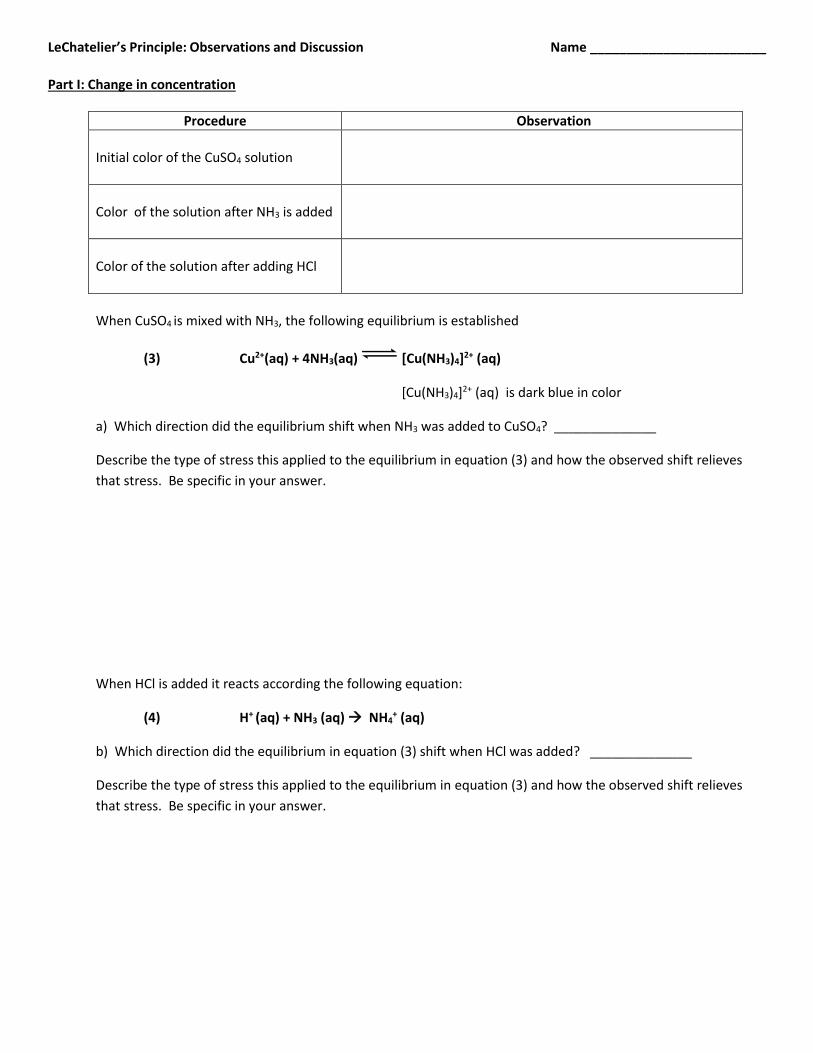
LeChatelier’s Principle: Observations and Discussion Name ________________________
Part I: Change in concentration
Procedure Observation
Initial color of the CuSO4 solution
Color of the solution after NH3 is added
Color of the solution after adding HCl
When CuSO4 is mixed with NH3, the following equilibrium is established
(3) Cu2+(aq) + 4NH3(aq) [Cu(NH3)4]2+ (aq)
[Cu(NH3)4]2+ (aq) is dark blue in color
a) Which direction did the equilibrium shift when NH3 was added to CuSO4? ______________
Describe the type of stress this applied to the equilibrium in equation (3) and how the observed shift relieves
that stress. Be specific in your answer.
When HCl is added it reacts according the following equation:
(4) H+ (aq) + NH3 (aq) NH4+ (aq)
b) Which direction did the equilibrium in equation (3) shift when HCl was added? ______________
Describe the type of stress this applied to the equilibrium in equation (3) and how the observed shift relieves
that stress. Be specific in your answer.

Part II: Sparingly Soluble Salt
Step Procedure Observation
1 Mixing 0.1 M Na2CO3 and 0.1 M CaCl2
a) Write the balanced chemical reaction taking place when Na2CO3 is mixed with CaCl2 (this is a double
replacement reaction). Include all phases and write correct product formulas.
b) Write the net ionic equation taking place for the reaction in a). (This is your equilibrium reaction)
Step Procedure Observation
2 Adding 6 M HCl
The added HCl reacts according to the following equations:
(5) 2 H+ (aq) + CO32- H2CO3 (aq) → H2O (l) + CO2(g)
c) Which direction did the equilibrium in b) shift when HCl was added? ________
Describe the type of stress this applied to the equilibrium you wrote for b) and how the observed shift relieves that stress. Be specific in your answer.

Step Procedure Observation
3 Adding 6M NaOH
4 Adding 6 M HCl
d) Explain your observations for steps 3 & 4 in terms of LeChatelier’s principle and your equilibrium from b) .
Part III: Change in Temperature
Initial color of solution in the sealed test tube
Color of the solution on heating in hot water bath
Color of the solution on cooling in ice water
The equilibrium reaction taking place in the sealed test tube is
(6) [Co(H2O)6]2+ (aq) + 4 Cl- (aq) [CoCl4]2- (aq) + 6 H2O (l)
[Co(H2O)6]2+ (aq) is pink in color [CoCl4]2- (aq) is blue in color
a) Which direction did the equilibrium in (6) shift when added to hot water? _______________ Which direction did the equilibrium in (6) shift when added to cold water? _______________
b) Based on your observations, is reaction (6) endothermic or exothermic? ________________ (hint try writing in heat as a product or reactant and see which fits)
Describe how the observed shift in a) relieves the stress (heat) applied to equilibrium (6) .


Experiment #9. Acids, Bases and pH Theory: Acids and bases are very common in chemistry and even biology. We need to be able to identify acids and bases and understand their properties. Acids are named from the Latin “acidus” meaning sour. Acid solutions have a pH less <7, turn litmus paper red and react with bases. Bases tend to taste bitter. They have a pH > 7, turn litmus paper blue and react with acids. There are three common definitions for acids: the Arrhenius definition, the Brønsted-Lowry definition, and the Lewis definition. The Arrhenius definition defines acids as substances which produce hydrogen ions (H+) in water solutions (in water, H+ really exists as hydronium (H3O+), but chemists often write just H+ anyway). The inorganic acids that we learned about in chapter 4 are Arrhenius acids. We can recognize them by the H in front of an anion with (aq). For example: HCl(aq) is an Arrhenius acid. The Brønsted-Lowry definition expands on this and defines an acid to be a proton (H+) donor. By this definition, any compound which can easily be deprotonated (lose H+) can be considered an acid. Examples include all of the Arrhenius acids as well as compounds that we may not think of as acids like water and alcohols. The Lewis definition expands this further: a Lewis acid is a substance that can accept a pair of electrons (or a lone pair) to form a covalent bond. H+ does this when it reacts with OH– to make water. The H+ accepts an electron pair from the base to bond with it. Examples of Lewis acids include all Arrhenius and Bronsted acids as well as some metal cations. An Arrhenius base produces OH– in water. A Brønsted–Lowry base is a substance that can accept H+. OH− compounds will accept H+ to make H2O, but many other compounds will accept H+ as well, such as ammonia (NH3) and amines (or any compound with a lone pair on a nitrogen (N:) ). A Lewis base donates an electron pair to form a covalent bond. CO has a lone pair and can act as a Lewis base. Please remember that concentrated strong acids and strong bases are corrosive and that some of the weak acids and bases are also hazardous! Always wear goggles when dealing with concentrated acids and bases. We know that water exists in equilibrium with hydronium and hydroxide (the autoionization of water.) H2O(l) + H2O(l) ⇄ H3O+(aq) + OH− (aq), with : Kw = [H3O+][OH−]
This is really just KC for the above reaction, but since this reaction is important for water solutions, it’s given the special Kw symbol.
At 25oC, the value of Kw is about 1.0 x 10⁻¹⁴. Kw will vary with temperature.
In pure water at 25 ⁰C, [H3O+] = 1.0 x 10⁻⁷ M and [OH−] = 1.0 x 10⁻⁷ M. If the [H3O+] > [OH−], the solution is acidic and if [OH−] > [H3O+] then the solution is basic. We can also look at the pH. We use pH because large negative exponents are inconvenient, we can use –log to simplify them. Basically, p = -log. For example, pH = - log [H+] (or, pH = - log[H3O+]) The same is true for pOH and pKw. Since p = -log, pOH = -log [OH−] and pKw = -log Kw = -log (1.0 x 10⁻¹⁴). Combining all of these, Kw = [H3O+][OH−] = 1.0 x 10⁻¹⁴ Taking –log of everything, it ends up as: pKw = pH + pOH = 14. (at 25oC)
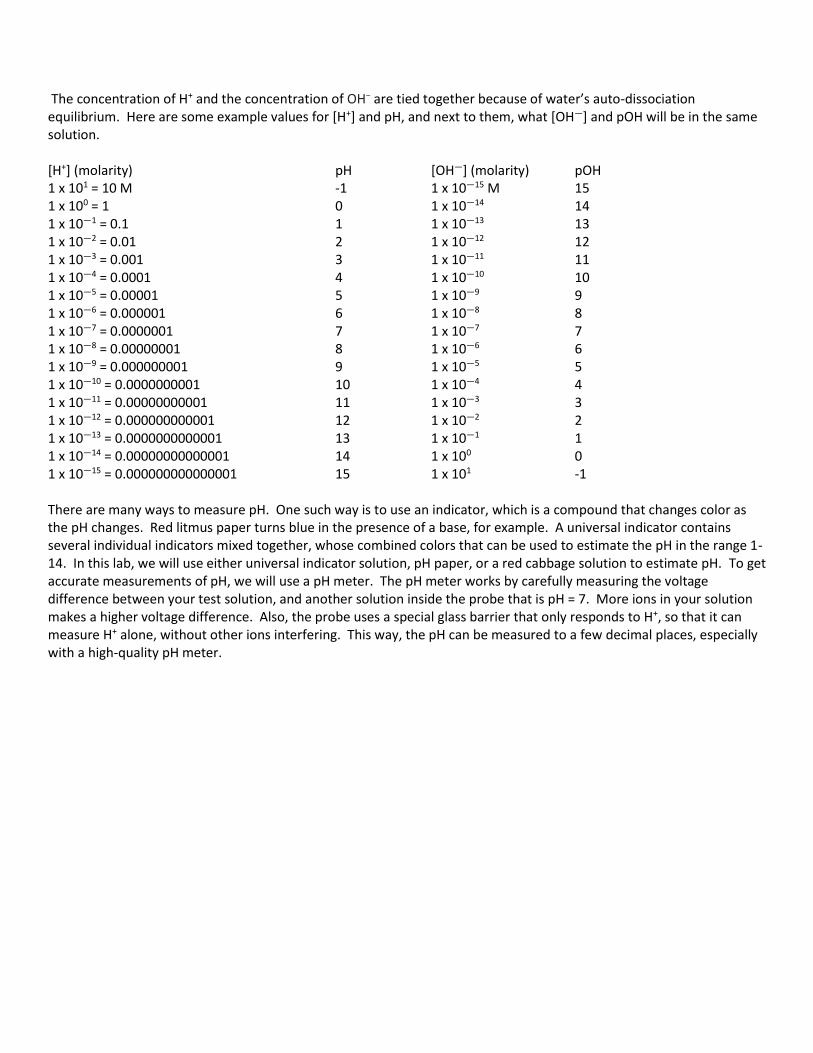
The concentration of H+ and the concentration of OH− are tied together because of water’s auto-dissociation equilibrium. Here are some example values for [H+] and pH, and next to them, what [OH—] and pOH will be in the same solution. [H+] (molarity) pH [OH—] (molarity) pOH 1 x 101 = 10 M -1 1 x 10—15 M 15 1 x 100 = 1 0 1 x 10—14 14 1 x 10—1 = 0.1 1 1 x 10—13 13 1 x 10—2 = 0.01 2 1 x 10—12 12 1 x 10—3 = 0.001 3 1 x 10—11 11 1 x 10—4 = 0.0001 4 1 x 10—10 10 1 x 10—5 = 0.00001 5 1 x 10—9 9 1 x 10—6 = 0.000001 6 1 x 10—8 8 1 x 10—7 = 0.0000001 7 1 x 10—7 7 1 x 10—8 = 0.00000001 8 1 x 10—6 6 1 x 10—9 = 0.000000001 9 1 x 10—5 5 1 x 10—10 = 0.0000000001 10 1 x 10—4 4 1 x 10—11 = 0.00000000001 11 1 x 10—3 3 1 x 10—12 = 0.000000000001 12 1 x 10—2 2 1 x 10—13 = 0.0000000000001 13 1 x 10—1 1 1 x 10—14 = 0.00000000000001 14 1 x 100 0 1 x 10—15 = 0.000000000000001 15 1 x 101 -1 There are many ways to measure pH. One such way is to use an indicator, which is a compound that changes color as the pH changes. Red litmus paper turns blue in the presence of a base, for example. A universal indicator contains several individual indicators mixed together, whose combined colors that can be used to estimate the pH in the range 1-14. In this lab, we will use either universal indicator solution, pH paper, or a red cabbage solution to estimate pH. To get accurate measurements of pH, we will use a pH meter. The pH meter works by carefully measuring the voltage difference between your test solution, and another solution inside the probe that is pH = 7. More ions in your solution makes a higher voltage difference. Also, the probe uses a special glass barrier that only responds to H+, so that it can measure H+ alone, without other ions interfering. This way, the pH can be measured to a few decimal places, especially with a high-quality pH meter.
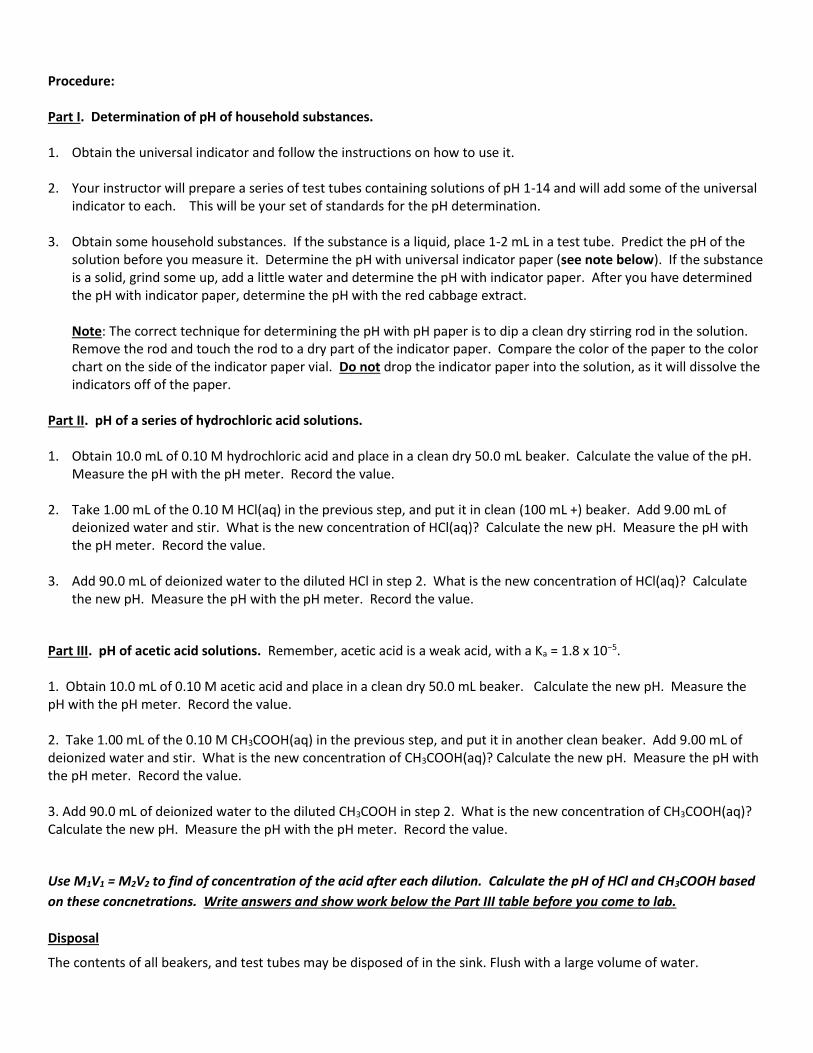
Procedure: Part I. Determination of pH of household substances. 1. Obtain the universal indicator and follow the instructions on how to use it. 2. Your instructor will prepare a series of test tubes containing solutions of pH 1-14 and will add some of the universal
indicator to each. This will be your set of standards for the pH determination.
3. Obtain some household substances. If the substance is a liquid, place 1-2 mL in a test tube. Predict the pH of the solution before you measure it. Determine the pH with universal indicator paper (see note below). If the substance is a solid, grind some up, add a little water and determine the pH with indicator paper. After you have determined the pH with indicator paper, determine the pH with the red cabbage extract.
Note: The correct technique for determining the pH with pH paper is to dip a clean dry stirring rod in the solution. Remove the rod and touch the rod to a dry part of the indicator paper. Compare the color of the paper to the color chart on the side of the indicator paper vial. Do not drop the indicator paper into the solution, as it will dissolve the indicators off of the paper.
Part II. pH of a series of hydrochloric acid solutions. 1. Obtain 10.0 mL of 0.10 M hydrochloric acid and place in a clean dry 50.0 mL beaker. Calculate the value of the pH.
Measure the pH with the pH meter. Record the value.
2. Take 1.00 mL of the 0.10 M HCl(aq) in the previous step, and put it in clean (100 mL +) beaker. Add 9.00 mL of deionized water and stir. What is the new concentration of HCl(aq)? Calculate the new pH. Measure the pH with the pH meter. Record the value.
3. Add 90.0 mL of deionized water to the diluted HCl in step 2. What is the new concentration of HCl(aq)? Calculate the new pH. Measure the pH with the pH meter. Record the value.
Part III. pH of acetic acid solutions. Remember, acetic acid is a weak acid, with a Ka = 1.8 x 10⁻⁵. 1. Obtain 10.0 mL of 0.10 M acetic acid and place in a clean dry 50.0 mL beaker. Calculate the new pH. Measure the pH with the pH meter. Record the value. 2. Take 1.00 mL of the 0.10 M CH3COOH(aq) in the previous step, and put it in another clean beaker. Add 9.00 mL of deionized water and stir. What is the new concentration of CH3COOH(aq)? Calculate the new pH. Measure the pH with the pH meter. Record the value. 3. Add 90.0 mL of deionized water to the diluted CH3COOH in step 2. What is the new concentration of CH3COOH(aq)? Calculate the new pH. Measure the pH with the pH meter. Record the value.
Use M1V1 = M2V2 to find of concentration of the acid after each dilution. Calculate the pH of HCl and CH3COOH based
on these concnetrations. Write answers and show work below the Part III table before you come to lab.
Disposal
The contents of all beakers, and test tubes may be disposed of in the sink. Flush with a large volume of water.


Name_________________________
CHM112 Lab – Acids, Bases and pH – Grading Rubric
Criteria Points possible Points earned
Lab Performance
Printed lab handout and rubric was brought to lab
3
Initial concentrations and pHs for Part III completed before coming to lab
2
Safety and proper waste disposal procedures observed
2
Followed procedure correctly without depending too much on instructor or lab partner
3
Work space and glassware was cleaned up
1
Lab Report
All observations recorded
5
Question 1
1
Question 2
1
Question 3
1
Question 4
1
Total
20
Subject to additional penalties at the discretion of the instructor.

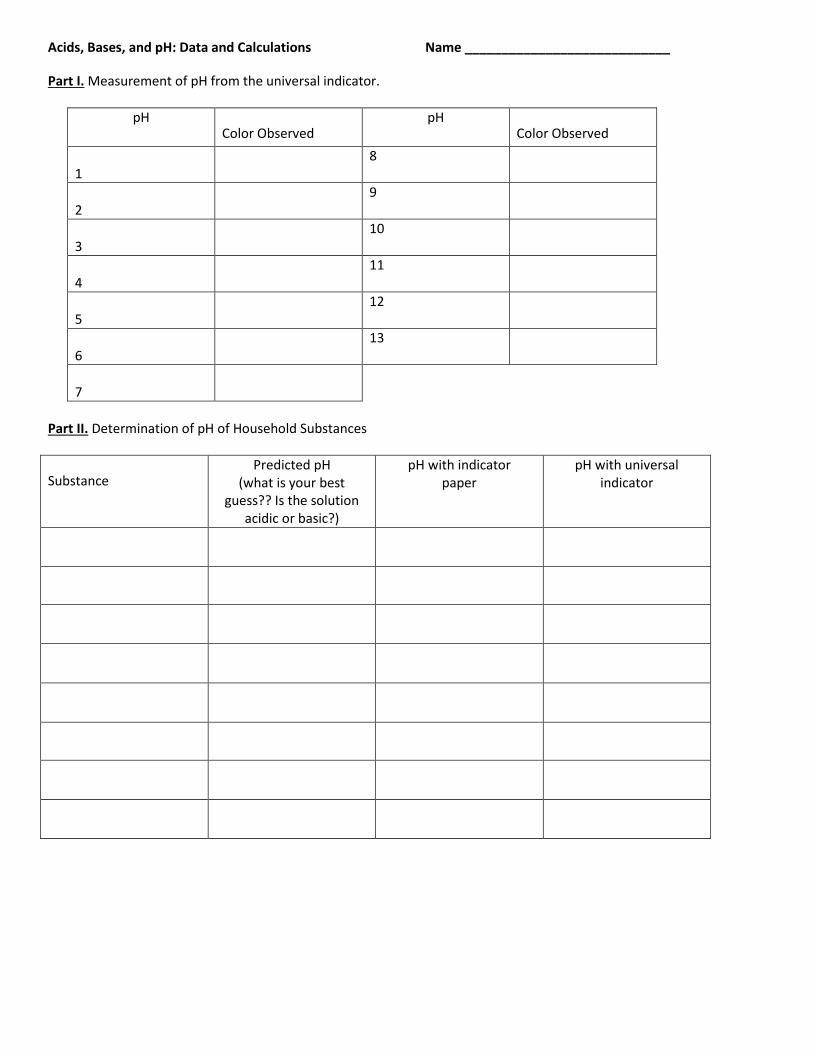
Acids, Bases, and pH: Data and Calculations Name ____________________________
Part I. Measurement of pH from the universal indicator.
pH Color Observed
pH Color Observed
1
8
2
9
3
10
4
11
5
12
6
13
7
Part II. Determination of pH of Household Substances
Substance Predicted pH
(what is your best guess?? Is the solution
acidic or basic?)
pH with indicator paper
pH with universal indicator

Part III. pH of hydrochloric acid solutions. Please calculate the pH of the original and diluted solutions before you make the measurements.
Concentration of HCl(aq) Calculated pH pH with pH meter
0.10 M
pH of acetic acid solutions. Please calculate the pH of the original and diluted solutions before you make the measurements.
Concentration of CH3COOH Calculated pH pH with pH meter
0.10 M

Acids, Bases, and pH: Post Lab Name ____________________________
1. Compare the calculated with the measured pH of the 0.10 M HCl(aq) solution. Calculate the percent error. 2. Compare the calculated with the measured pH of the 0.10 M CH3COOH (aq) solution. Calculate the percent error. 3. How did the pH of the weak and strong acid solutions differ? Did the pH values for the weak and strong acids behave the same when diluted? If not, explain why. 4. How did the predicted pH of the household chemicals compare with the pH values obtained using the indicators? What did you discover about the chemicals around you?


Experiment #10. Hydrolysis and Buffers
Introduction
Hydrolysis is a chemical reaction of a compound with water. It is different from simple dissolution. When an
ionic compound (salt) is dissolved in water, the resulting solution can be either acidic, basic or neutral depending on the
ions contained in the salt. The ions in the solution undergo hydrolysis and determine the pH of the solution. Recall that
Group IA and IIA cations (which are the conjugate acids of strong bases such a NaOH and KOH) are inert as are the
conjugate bases of the strong monoprotic acids (i.e., anions such as Cl-, I-, NO3-, etc.). These ions do not undergo
hydrolysis in water and a solution containing these ions (such as a solution of NaCl) has a neutral pH.
If the anion is the conjugate base of of a weak acid, however, it will react with the water to form a basic solution.
This is because conjugate bases of weak acids are strong enough to remove the protons from water leaving excess OH in the solution, which makes the solution basic. For example: When sodium benzoate, NaC6H5COO(s), is added to water, the salt dissociates into Na+ and C6H5COO—. Na+ is inert, but the benzoate ion reacts with water:
C6H5COO (aq) + H2O(l) C6H5COOH(aq) + OH (aq) A basic solution with a pH > 7 will result. If the cation is the conjugate acid of a weak base, then it will react with the water to form an acidic solution. For example, when the salt of methylamine, CH3NH3Cl(s), is added to water, the salt dissociates into CH3NH3
+ and Cl—. Cl— is inert, but CH3NH3
+ reacts with water to make an acidic solution with pH < 7.
CH3NH3+ (aq) + H2O(l) CH3NH2 (aq) + H3O+ (aq)
If the salt contains both the cation of a weak base and anion of a weak acid then the pH of the resulting solution will depend on the relative strengths of the related acid and base. Buffers A buffer solution is a solution that resists a change in its pH upon the addition of small quantities of either a strong acid or a strong base. Buffers are usually made by mixing a weak acid and its conjugate base, or a weak base and its conjugate acid. For example, a solution containing NH4Cl with NH3 will be a buffer solution. In this lab we will make a buffer using CH3COOH(aq) and NaCH3COO(aq). Buffers work by neutralizing the added strong acid or base. An added strong acid reacts with the base component in the buffer solution:
CH3COO (aq) + H3O+ (aq) CH3COOH(aq) + H2O This removes the hydronium ions created by the addition of the acid and changes the equilibrium amounts of the weak conjugate base (here, acetate) and its corresponding acid (here, acetic acid). This will hold the pH relatively stable. When a strong base is added to a buffer it will react with the acid component in the buffer solution:
CH3COOH(aq) + OH (aq) CH3COO (aq) + H2O
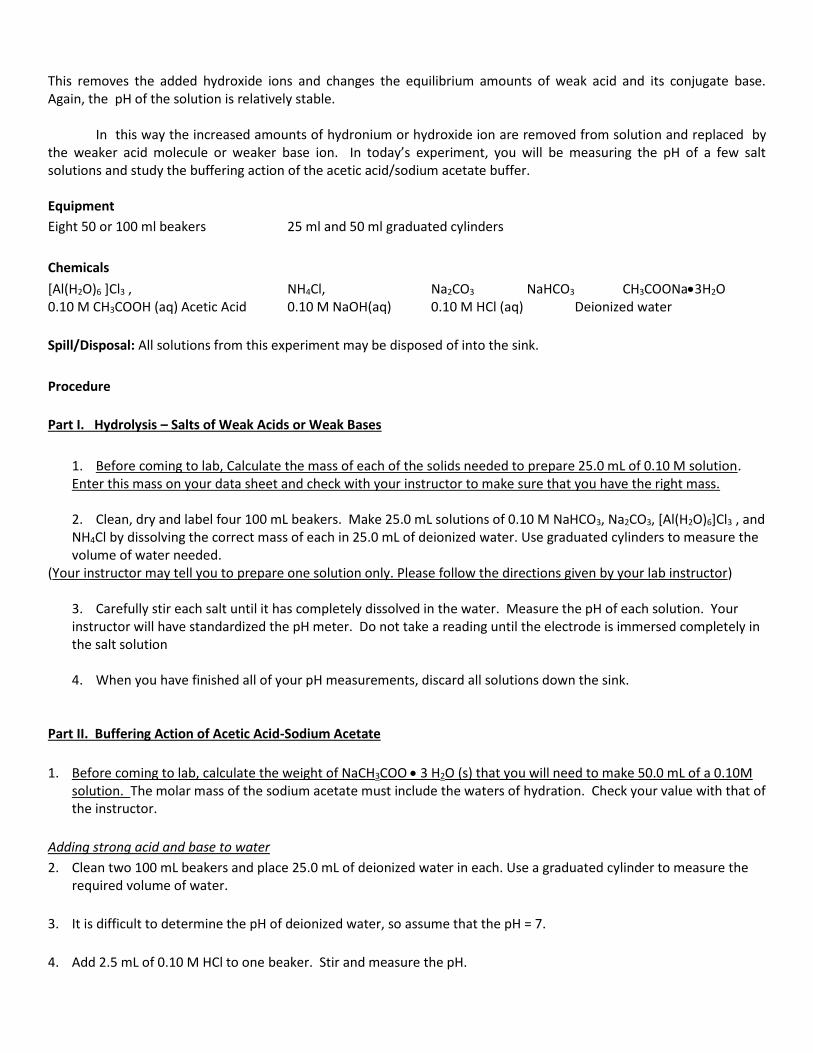
This removes the added hydroxide ions and changes the equilibrium amounts of weak acid and its conjugate base. Again, the pH of the solution is relatively stable. In this way the increased amounts of hydronium or hydroxide ion are removed from solution and replaced by the weaker acid molecule or weaker base ion. In today’s experiment, you will be measuring the pH of a few salt solutions and study the buffering action of the acetic acid/sodium acetate buffer. Equipment
Eight 50 or 100 ml beakers 25 ml and 50 ml graduated cylinders
Chemicals
[Al(H2O)6 ]Cl3 , NH4Cl, Na2CO3 NaHCO3 CH3COONa3H2O 0.10 M CH3COOH (aq) Acetic Acid 0.10 M NaOH(aq) 0.10 M HCl (aq) Deionized water
Spill/Disposal: All solutions from this experiment may be disposed of into the sink.
Procedure
Part I. Hydrolysis – Salts of Weak Acids or Weak Bases
1. Before coming to lab, Calculate the mass of each of the solids needed to prepare 25.0 mL of 0.10 M solution. Enter this mass on your data sheet and check with your instructor to make sure that you have the right mass.
2. Clean, dry and label four 100 mL beakers. Make 25.0 mL solutions of 0.10 M NaHCO3, Na2CO3, [Al(H2O)6]Cl3 , and NH4Cl by dissolving the correct mass of each in 25.0 mL of deionized water. Use graduated cylinders to measure the volume of water needed.
(Your instructor may tell you to prepare one solution only. Please follow the directions given by your lab instructor)
3. Carefully stir each salt until it has completely dissolved in the water. Measure the pH of each solution. Your instructor will have standardized the pH meter. Do not take a reading until the electrode is immersed completely in the salt solution
4. When you have finished all of your pH measurements, discard all solutions down the sink.
Part II. Buffering Action of Acetic Acid-Sodium Acetate
1. Before coming to lab, calculate the weight of NaCH3COO 3 H2O (s) that you will need to make 50.0 mL of a 0.10M solution. The molar mass of the sodium acetate must include the waters of hydration. Check your value with that of the instructor.
Adding strong acid and base to water
2. Clean two 100 mL beakers and place 25.0 mL of deionized water in each. Use a graduated cylinder to measure the required volume of water.
3. It is difficult to determine the pH of deionized water, so assume that the pH = 7.
4. Add 2.5 mL of 0.10 M HCl to one beaker. Stir and measure the pH.

5. Add 2.5 mL of 0.10 M NaOH to the other beaker. Stir and measure the pH.
Adding strong acid and base to a buffer
6. Measure 50.0 mL of 0.10 M CH3COOH (aq) (acetic acid, a weak acid) into a clean dry 100 mL beaker using a graduated cylinder.
7. Weigh out the calculated amount of NaCH3COO • 3 H2O (s) and add it to the 50.0 mL CH3COOH (aq) (acetic acid) in the beaker. Carefully stir the solution until all of the salt has dissolved. You have just prepared a buffer where the concentration of the weak acid (acetic acid) and the conjugate base (Sodium acetate) are each 0.10 M.
8. Divide the solution into two equal 25.0 mL portions and measure the pH of each portion.
9. Add 2.5 mL of 0.10 M HCl (aq) to one of the 25.0 mL portions of the buffer. Stir and measure the pH.
10. Add 2.5 mL of 0.10 M NaOH (aq) to the other 25.0 mL portion of the buffer. Stir and measure the pH.
11. When finished, discard all solutions down the sink.

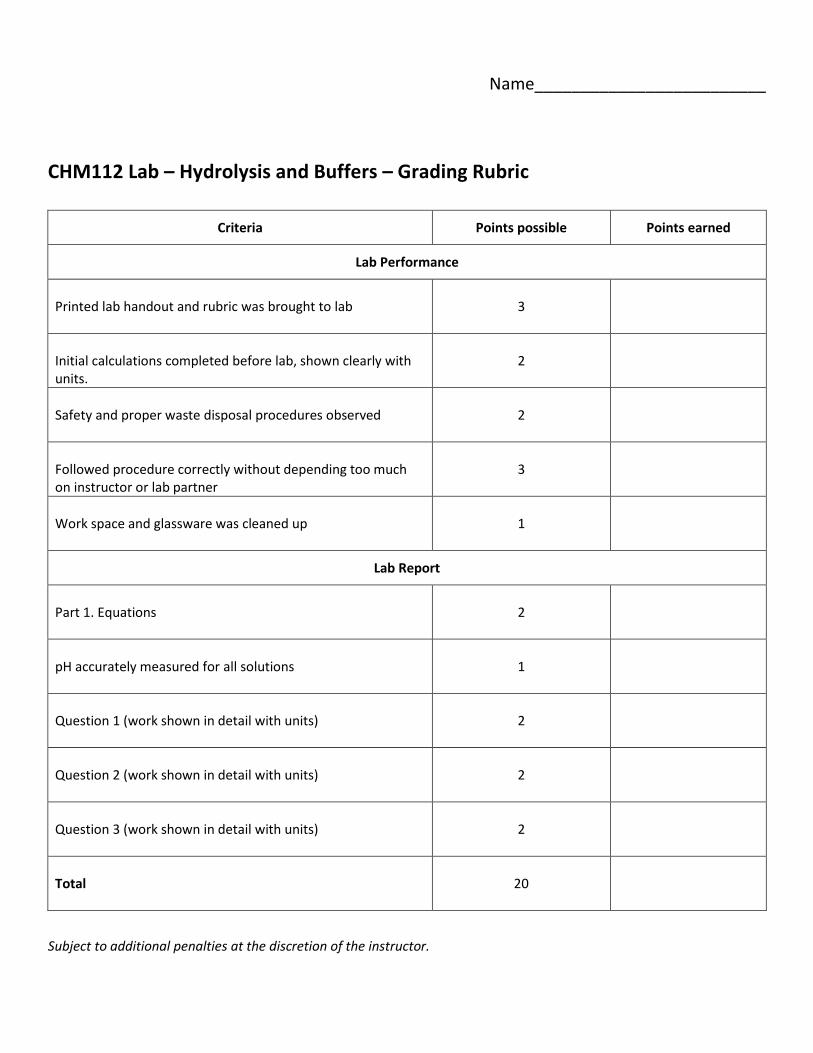
Name_________________________
CHM112 Lab – Hydrolysis and Buffers – Grading Rubric
Criteria Points possible Points earned
Lab Performance
Printed lab handout and rubric was brought to lab
3
Initial calculations completed before lab, shown clearly with units.
2
Safety and proper waste disposal procedures observed
2
Followed procedure correctly without depending too much on instructor or lab partner
3
Work space and glassware was cleaned up
1
Lab Report
Part 1. Equations
2
pH accurately measured for all solutions
1
Question 1 (work shown in detail with units)
2
Question 2 (work shown in detail with units)
2
Question 3 (work shown in detail with units)
2
Total
20
Subject to additional penalties at the discretion of the instructor.


Hydrolysis & Buffers: Post Lab Name:________________________________
Part I: Hydrolysis of salts.
Salt solution Mass of solid weighed (show calculations clearly) pH
NaHCO3
Na2CO3
NH4Cl
[Al(H2O)6 ]Cl3
Write down the hydrolysis reactions for the each of the salts. Dissociate the salt into its cation and anion and ignore the inert species. Make sure that the reaction is consistent with the measured pH. 1. NaHCO3
2. Na2CO3 3. NH4Cl 4. [Al(H2O)6 ]Cl3 Part II: Buffers
Mass of the solid NaCH3COO 3 H2O = _____________________ (calculated before coming to lab)
Solution pH
Deionized water 7
Deionized water + 2.5 mL 0.10 M HCl
Deionized water + 2.5 mL 0.10 M NaOH
Buffer (0.10 M CH3COOH w/ 0.10 M CH3COO—)
25.0 ml Buffer + 2.5 mL 0.10 M HCl
25.0 ml Buffer + 2.5 mL 0.10 M NaOH
Hydrolysis & Buffers: PostLab Name:________________________________
1. Calculate the pH of 0.10 M NH4Cl (aq). Compare this calculated pH with the pH that you measured. Is it higher, lower, the same? Calculate the % error by assuming that this calculated pH is the true value.
2. Calculate the pH of the acetic acid and sodium acetate buffer solution (look up Ka for acetic acid). Compare this pH with the measured value.
3. Calculate the pH of the buffer after NaOH (aq) has been added. (Don’t forget the addition chart and the new volume of the solution!) How does this calculated pH compare to the measured value?

Experiment # 11. Titration of a Weak Acid
Aim: To determine the molar mass, pka and the identity of an unknown weak acid by titration.
Introduction
A weak acid undergoes partial dissociation in an aquoeus solution. There exists an equilibrium between the ions and the undissociated acid molecule. The equilibrium constant for this process is Ka is the acid dissociation constant. Consider a weak monoprotic acid HA: HA (aq) + H2O (l) A—(aq) + H3O+(aq) Ka = [A—][ H3O+] [HA]
In any acid–base titration, a solution of known concentration (the titrant) is slowly added from a burette to a
solution of unknown concentration (the analyte) until the reaction is complete. The equivalence point occurs when
stoichiometrically equal amounts of the acid and base are present. A plot of pH vs volume is known as a titration curve.
When the acid HA is titrated with NaOH, the reaction taking place is:
OH— (aq) + HA(aq) → A—(aq) + H2O(l) As the titration proceeds, the nature of the solution will change.
1. Initially when no NaOH had been added, the only species in solution are the weak acid and a small amount of H3O+ and A— formed by the slight dissociation of the weak acid. The pH of the solution depends only on the molar concentration or the acid and the Ka of the acid.
2. After some NaOH(aq) has been added, but before the equivalence
point, the acid and its conjugate base will both be present in amounts that are roughly comparable. In this region of the titration the solution is a buffer. At the point in the titration where [HA] = [A—], the pH of the solution = pKa. This will occur halfway to the equivalence point in terms of the amount of NaOH added. Thus, at the "half equivalence point" or "halfway point", pH = pKa.
3. After the equivalence point, the pH of the solution depends on the NaOH in excess. 4. If the acid is polyprotic, then there will be more than one equivalence point which can be identified from the
titration curve. We can thus calculate pKa for each step for a polyprotic acid. In today’s lab, a weak acid will be titrated with a known concentration (standardized) solution of NaOH(aq) to determine the pKa, molar mass and the identity of the acid.
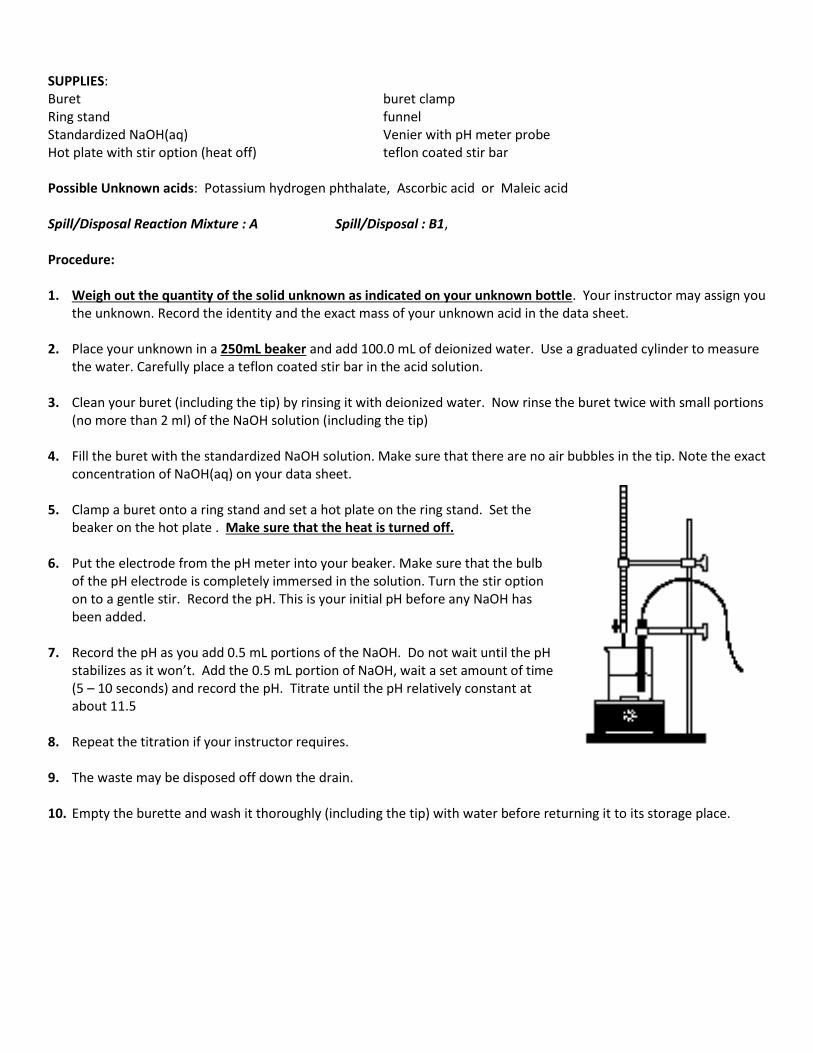
SUPPLIES: Buret buret clamp Ring stand funnel Standardized NaOH(aq) Venier with pH meter probe Hot plate with stir option (heat off) teflon coated stir bar Possible Unknown acids: Potassium hydrogen phthalate, Ascorbic acid or Maleic acid Spill/Disposal Reaction Mixture : A Spill/Disposal : B1, Procedure: 1. Weigh out the quantity of the solid unknown as indicated on your unknown bottle. Your instructor may assign you
the unknown. Record the identity and the exact mass of your unknown acid in the data sheet.
2. Place your unknown in a 250mL beaker and add 100.0 mL of deionized water. Use a graduated cylinder to measure the water. Carefully place a teflon coated stir bar in the acid solution.
3. Clean your buret (including the tip) by rinsing it with deionized water. Now rinse the buret twice with small portions
(no more than 2 ml) of the NaOH solution (including the tip)
4. Fill the buret with the standardized NaOH solution. Make sure that there are no air bubbles in the tip. Note the exact concentration of NaOH(aq) on your data sheet.
5. Clamp a buret onto a ring stand and set a hot plate on the ring stand. Set the
beaker on the hot plate . Make sure that the heat is turned off.
6. Put the electrode from the pH meter into your beaker. Make sure that the bulb of the pH electrode is completely immersed in the solution. Turn the stir option on to a gentle stir. Record the pH. This is your initial pH before any NaOH has been added.
7. Record the pH as you add 0.5 mL portions of the NaOH. Do not wait until the pH
stabilizes as it won’t. Add the 0.5 mL portion of NaOH, wait a set amount of time (5 – 10 seconds) and record the pH. Titrate until the pH relatively constant at about 11.5
8. Repeat the titration if your instructor requires.
9. The waste may be disposed off down the drain.
10. Empty the burette and wash it thoroughly (including the tip) with water before returning it to its storage place.
Name_________________________
CHM112 Lab – Titration of a Weak Acid – Grading Rubric
Criteria Points possible Points earned
Lab Performance
Printed lab handout and rubric was brought to lab
3
Safety and proper waste disposal procedures observed
2
Followed procedure correctly without depending too much on instructor or lab partner
3
Work space and glassware was cleaned up
1
Lab Report
Graph attached and follows all guidelines and includes all labels described in 1, 2, 6
2
Question 4
1
Question 5
2
Question 6 & 7
1
Question 8
1
Question 9
2
Question 10
2
Total
20
Subject to additional penalties at the discretion of the instructor.


Tritration of a Weak Acid: Data Sheet Name ________________________
Unknown acid ________ (letter or number on the unknown bottle)
Mass of the Unknown acid: _______________ Concentration of NaOH(aq): ______________
Volume NaOH added pH
Tritration of a Weak Acid: Calculations and PostLab Name ________________________
Graphing and Analysis
1. Plot the titration curve as pH vs. mL of NaOH added using a computer graphing program. Make sure you have chosen the correct X and Y axes. Include gridlines at least every 0.5 mL and 0.5 pH units, and print out a 8 ½ x 11 plot. You must attach the graph to the Lab Report.
2. Locate the equivalence point(s) on the titration curve. It is very unlikely that the equivalence point(s) will be
actual data points. You will need to either manually draw a smooth curve connecting your data points, or select the option in your graphing program that will draw the best-fit curve for you. Then find the steepest point(s) on the curve. This is/these are the equivalence point(s). Label the equivalence point(s) on the curve with the estimated volume and pH. (For polyprotic acids, label all the equivaence points.)
3. How many equivalence points does your graph show? ________________
4. Recall that at the first equivalence point, moles of acid = moles of base added.
Volume of NaOH added at the first equivalence point: __________________
Moles of NaOH added at the first equivalence point: _________________________
Volume of NaOH added at the Second equivalence point (if your unknown is polyprotic) ____________
5. Use the mass of the acid, the concentration of NaOH and the volume of NaOH added at the first equivalence
point to calculate the molar mass of the acid: (Show your work in detail and include proper units.)
Calculated molar mass of the unknown acid= _________________
6. On your graph:
Label the areas of the curve where a buffer is present.
Locate the point where pH= pKa (halfway to the equivalence point.) Label pKa on the graph. If the acid is polyprotic, label the pKa for each equivalence point on the graph.
pKa1 = _________________ pKa2 = ___________________ (from the graph)
7. Calculate Ka for your unknown acid. If your unknown is polyprotic, calculate Ka at both the equivalence points. (Show work) Ka1 = _________________ Ka2 = __________________

8. For each of the possible unknows, list their formula, if they are mono or diprotic, their molar mass and their pKa
values. (Use a reputable source such as the CRC Handbook or NIST Webook) Source of data _________________________
9. Based on the data above, what is your unknown? _________________
Explain the reasoning behing your choice. How do your pKa(s) and molar mass data compare to the literature values?
10. Calculate the initial concentration of your acid. Recall that the original volume of the solution was 0.100 L
[Acid]initial = ________________________
Using your calculated value of Ka and the initial concentration of the acid, calculate the initial pH of your acid. Set up an ICE table. You may need to use the quadratic formula.
How does this compare to your initial pH from the titration?


Experiment #12. Enthalpy of Neutralization
Introduction
In the course of most physical processes and chemical reactions there is a change in energy. In chemistry what
is normally measured is H (enthalpy change), the change in heat at constant pressure and ignoring any work done by
the reacting system. If the reaction is exothermic, heat is given off and H has a negative value. When heat is absorbed
from the surroundings during the reaction, the reaction is endothermic and H has a positive value. The change in enthalpy is a measure of the difference in energy between the bonds in the products and the bonds in the reactants. The absolute energy of a compound cannot be measured directly, but the change in enthalpy that occurs during a chemical reaction can be measured.
The reaction in today’s experiment is acid / base neutralization which is an exothermic process.
HCl (aq) + NaOH (aq) H2O (l) + NaCl (aq) + heat
The heat released by the reaction will be absorbed by the surroundings (aqueous solution). Coffee Cup Calorimetry will be employed to determine the amount of heat lost by the reaction and gained by the salt water solution. A calorimeter is simply a container used to measure the heat change. Coffee Cup Calorimetry just means that
we will be measuring heat at constant pressure, H. The heat lost by the reaction will actually be transferred to both the salt water and its surroundings (the calorimeter.) The heat capacity of the calorimeter (in this case, two Styrofoam cups) usually would be calculated first; however, we have found that the heat capacity of the cups is so small that it can be neglected.
As the First Law of Thermodynamics applies,
Heat (q) lost by the reaction + heat (q) gained by the solution = 0 or qrxn = – qsoln
To find the heat lost by the reaction we use: q = m x Cs x ΔT where: m = mass of the solution (The density of the solution is 1.04 g/mL)
Cs = specific heat capacity of the solution (3.87 J/gC) ΔT= change in temperature of the solution (Tfinal – Tinitial)
Equipment
2 Styrofoam cups (2) Thermometers
50 or 100 mL graduated cylinder Stirring rod 150 mL beaker
Chemicals
2.00 M HCl 2.00 M NaOH
Procedure
1. Rinse and dry the Styrofoam cups (calorimeter). Place one cup inside the other. Measure out 25.0 mL of 2.00 M NaOH and pour it into the calorimeter. In a clean dry 150 mL beaker, take 25.0 mL of 2.00 M HCl.
2. Determine the temperature of both the acid and the base to the nearest 0.1C. Average the temperatures. Record this average as the initial temperature Tinitial.
3. Pour the acid into the base quickly and carefully with gentle stirring. Start monitoring the temperature as soon as
the two are mixed. Continue to stir and monitor the temperature. Record the maximum temperature that the solution reaches. This is Tfinal
4. Repeat Steps 1 - 3 (above) for a second trial.
Disposal
All reactants and products may be disposed of into the sink.
Name_________________________
CHM112 Lab – Heat of Neutralization – Grading Rubric
Criteria Points possible Points earned
Lab Performance
Printed lab handout and rubric was brought to lab
3
Safety and proper waste disposal procedures observed
2
Followed procedure correctly without depending too much on instructor or lab partner
3
Work space and glassware was cleaned up
1
Lab Report
Calculations Q1-Q11 (1 point each)
11
Total
20
Subject to additional penalties at the discretion of the instructor.


Heat of Neutralization: Data Sheet Name ________________________
Calculations (Show all your work completely and clearly. Include proper units)
1. Calculate the mass of the solution for each trial (given the density of the solution is 1.04 g/ml)
2. Calculate the heat absorbed by the solution in each trial. (qsoln) qsoln (Trial 1) ____________ qsoln (Trial 2) _____________ Average qsoln _________ 3. Calculate q rxn = ____________________________ 4. Calculate the number of moles of water formed (This is the same as moles of HCl): moles of water = moles of HCl = __________________
Trial 1 Trial 2
Volume of 2.00 M HCl
Volume of 2.00 M NaOH
Volume of solution
T initial
T final
T (T final — T initial)
Specific heat capacity of NaCl solution 3.87 J/g °C 3.87 J/g °C
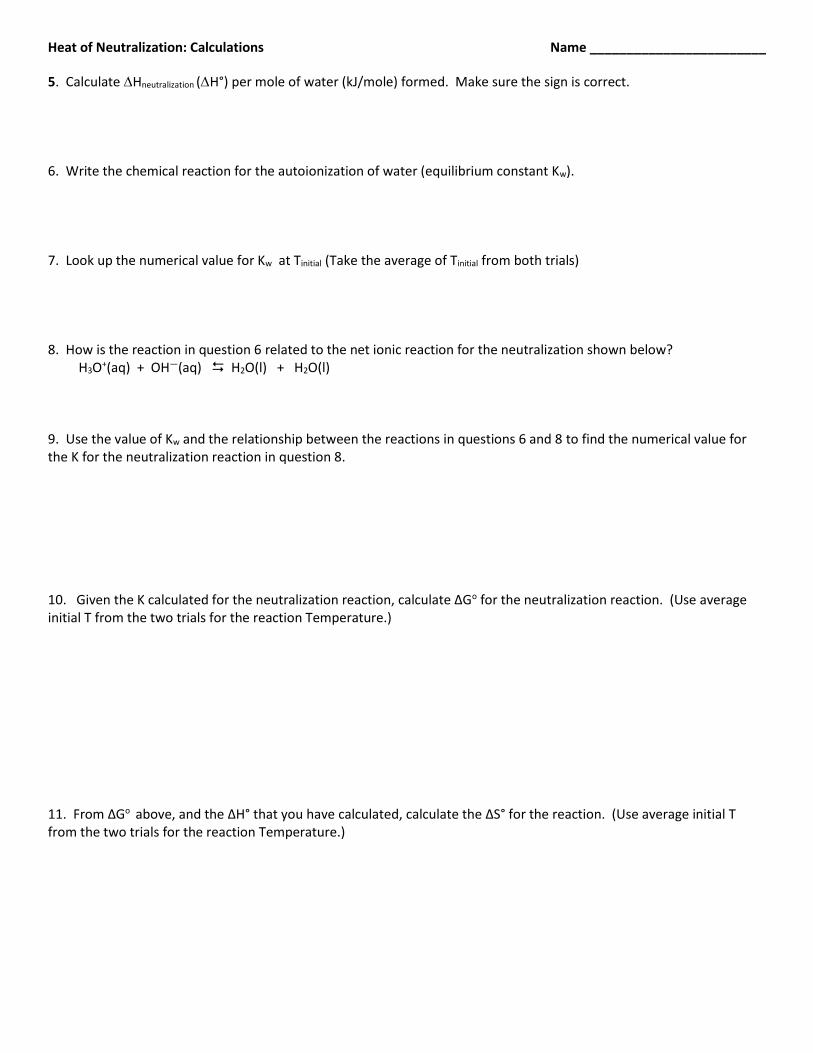
Heat of Neutralization: Calculations Name ________________________
5. Calculate Hneutralization (H°) per mole of water (kJ/mole) formed. Make sure the sign is correct.
6. Write the chemical reaction for the autoionization of water (equilibrium constant Kw). 7. Look up the numerical value for Kw at Tinitial (Take the average of Tinitial from both trials) 8. How is the reaction in question 6 related to the net ionic reaction for the neutralization shown below?
H3O+(aq) + OH—(aq) H2O(l) + H2O(l)
9. Use the value of Kw and the relationship between the reactions in questions 6 and 8 to find the numerical value for the K for the neutralization reaction in question 8.
10. Given the K calculated for the neutralization reaction, calculate ΔGo for the neutralization reaction. (Use average initial T from the two trials for the reaction Temperature.)
11. From ΔGo above, and the ΔH° that you have calculated, calculate the ΔS° for the reaction. (Use average initial T from the two trials for the reaction Temperature.)