experience versus learning: evidence from the … files/00-036_059f11b4-1d2f-4579... · experience...
TRANSCRIPT

Experience vs. Learning
1
Experience versus Learning:
Evidence from the Adoption of Minimally Invasive Cardiac Surgery
Introduction
The concept of organizational learning has long fascinated scholars from a range of
management and social science fields. The learning curve in particular has been the subject of
extensive study and discussion in the fields of operations management, economics, competitive
strategy, and technology management.1 More recently, scholars and practitioners have shown
renewed interest in learning because of its intimate link to emerging theories of core
competencies, dynamic capabilities, and resource-based views of the firm.2 Quite simply,
without learning, organizations are not likely to cultivate the unique skills and capabilities that
underlie competitive advantage. Understanding the processes by which organizations learn and
how these processes might be better managed are issues of central importance to scholars and
practitioners alike.
Learning is often equated with experience. Indeed, the terms “
“experience curve” are frequently used interchangeably. An extensive number of empirical
studies have documented the link between cumulative experience (e.g., cumulative production
volume, cumulative production time) and some measure of operational performance
improvement (e.g., cost reduction, yield improvement, productivity improvement).3 The
implications of the learning curve—that “practice makes perfect” and that first movers can enjoy
1 See, e.g., Sinclair et al. (2000), Hatch and Mowery (1998), Argote (1996), Argote et al. (1995), Gruber (1994), Jarmin (1994), Gruber (1992), Epple et al. (1991), Adler (1990), Argote et al. (1990), and Wright (1936). 2 See, e.g., Teece et al. (1997), Edmondson and Moingeon (1996), Teece and Pisano (1994), Prahalad and Hamel (1990), and Wernerfelt (1984). 3 See, e.g., Sinclair et al. (2000), Hatch and Mowery (1998), Argote (1996), Argote et al. (1995), Gruber (1994), Jarmin (1994), Gruber (1992), Epple et al. (1991), Adler (1990), Argote et al. (1990), and Wright (1936).

Experience vs. Learning
2
long-term competitive advantages—have held up remarkably well over time. In recent years,
however, researchers have begun to question the extent to which performance improvement is an
“automatic” benefit of cumulative experience versus a result of more subtle processes of
organizational learning.”4
Theories of organizational learning suggest that organizations vary in their capacity for
learning.5 This work argues that organizations facing similar changes in the environment can
learn (or fail to learn) in different ways, due to cognitive (Senge, 1990), interpersonal (Argyris
and Schon, 1978), structural (Duncan and Weiss, 1979), or managerial (Dutton and Thomas,
1984) factors. However, as most studies of learning curves have focused on detailed longitudinal
data within one or a small number of companies, or within multiple facilities owned by the same
firm (e.g., Hayes and Clark, 1986), it has been difficult to identify the effects of organization-
level learning processes that contribute to performance improvement above and beyond
experience. Further, studies involving multiple firms have included differences in technology
that make it difficult to compare learning across sites. Thus, although some studies support the
idea that learning curves differ across organizations (Dutton and Thomas, 1984; Argote and
Epple, 1990), further conceptual and empirical work is needed to better understand this
phenomenon.
In this paper, we directly investigate the possibility of differences in rates of
improvement across independently owned organizations, using data on the adoption of a
particular new technology for minimally invasive cardiac surgery. We obtained detailed data on
procedure times and other aspects of surgical performance on a sample of 660 patients who
underwent this operation at 16 institutions over the time period 1996-1998. This unique data set
4 See, e.g., Adler and Clark (1991). 5 See, e.g., Miller (1990), Senge (1990), Duncan and Weiss (1979), and Argyris Schon (1978).
Experience vs. Learning
3
allows us to estimate learning curves and to explore differences across highly similar
organizations. We predict that cardiac surgery departments will achieve benefits from cumulative
experience at different rates. In short, we propose that some organizations will undergo greater
organizational learning than others. To develop this proposition more fully, the next section of
this paper draws from relevant literature on learning and learning curves. Section III then
provides a brief overview of the particular surgical technology and procedure studied. In Section
IV, we develop and test a set of statistical models of performance improvement (in the form of
procedure time reduction). Section V probes factors contributing to differences across
institutions in the rate of learning, and Section VI discusses the implications of these results for
future research.
II. Anticipating Differences in Rates of Learning
The present study draws from three research streams: 1) learning curve studies in
industrial settings, 2) volume-outcome studies in medicine, and 3) theoretical work on
organizational learning. Although a comprehensive review of these literatures is beyond the
scope of this paper, central themes from each can be highlighted to identify an important gap in
our understanding of learning in organizations.
Learning curve studies. Few concepts in management and economics have drawn more
empirical attention than the learning curve. Starting with Wright, 1936, many studies have
demonstrated the link between cumulative experience and performance improvement and
established a fairly robust association between cumulative experience (e.g., cumulative
production volumes) and performance improvement (e.g., cost reduction) in a variety of

Experience vs. Learning
4
industrial settings, providing an empirical basis for the concept of learning-by-doing.6 Despite
the extensive body of research on learning curves, two topics have received comparatively little
attention. First—although von Hippel, 1976 and Rosenberg, 1976 have highlighted the critical
role of user learning for several technologies, “learning-by-using” has received comparatively
little empirical attention in the learning curve literature. Given the powerful influence of users in
the innovation process (von Hippel, 1982; von Hippel and Tyre, 1995), user learning curves
present an important area for research.
Second, firm and organizational level differences in slopes of learning curves have
received relatively little attention. A few studies have established the possibility that learning
curves can vary across plants or organizational sub-units within the same company (e.g., Dutton
and Thomas, 1984; Hayes and Clark, 1986). These differences were not explained by product or
technology differences, suggesting the possibility of organizational learning effects—in addition
to experience effects—as a contributor to performance improvement. In general, research has
not compared learning curves across independent organizations in the same industry. An
exception to this is Jarmin’s (1994) study of early U.S. rayon production, in which he noted that
the relationship between cumulative experience and performance improvement might differ
across producers. He analyzed learning curves for two large rayon producers and a third
composite of six small rayon producers for the years 1911-1938 and found differences in the
abilities of those firms to benefit from their own cumulative production experience. Although
this finding is limited by the very small number of firms and by the historical nature of the data,
it suggests that further research into differences in the magnitude and drivers of learning curves
across firms is worthwhile.
6 See, e.g., Sinclair et al. (2000), Hatch and Mowery (1998), Argote (1996), Argote et al. (1995), Gruber (1994), Jarmin (1994), Gruber (1992), Epple et al. (1991), Adler (1990), Argote et al. (1990), and Wright (1936).

Experience vs. Learning
5
Volume and outcomes in medicine. An extensive literature documents the effects of
cumulative experience on clinical performance in health care settings (see Luft et al., 1990, for a
comprehensive review). These studies have been consistent in finding an association between
clinical performance (e.g., lower rates of mortality) and case volume across a range of surgical
procedures.7 As in industrial settings, no attempt has been made in medical research to discern
whether all hospitals or surgical units learn at the same rate. Instead, the research presents an
implicit assumption that, after taking into account other factors, the effect of volume on clinical
outcomes is the same across institutions. Also, these studies have consistently used volume per
year as a proxy for experience, which confounds dynamic learning curve effects and static scale
economy effects. As Luft et al., 1990, point out:
Given the available data, it has been impossible to distinguish the learning effect from the scale effect. To do so, one would have to measure both the current volume and the accumulated experience of the relevant professionals and organizations (12).
Finally, studies in the medical literature have tended to examine improvement in
procedures that were in place for a number of years prior to the sampling period. As a result, this
research has not shed light on the relationship between cumulative case volumes and outcomes
during the initial adoption period when opportunities for organizational learning are likely to be
greatest. Moreover, organizational learning processes may influence performance improvement
in new procedures more than in mature medical procedures. To better understand learning
processes in organizations, we propose studying organizations soon after they have adopted new
technologies that require the development of significantly new routines and skills.
Organizational learning. In contrast to learning curve research, organizational learning
has drawn more theoretical attention than empirical analysis. Although a broadly accepted
7 For example, after controlling for the patient’s co-morbidities, the probability of death in a coronary artery bypass graft operation is significantly lower at hospitals performing 700 or more of these procedures per year (Hannan et
Experience vs. Learning
6
framework for understanding organizational learning has remained elusive (Edmondson and
Moingeon, 1998), two themes in this literature about which there is broad agreement suggest that
variance across organizations facing a similar learning opportunity is likely.
First, organizational learning is viewed as process of seeking, selecting, and adapting new
“routines” to improve performance (Nelson and Winter, 1982; Levitt and March, 1988). In any
sufficiently complex situation, there are many combinations and permutations of how a given
activity might be performed; thus, a theoretically optimal approach may exist but is likely to be
extremely difficult or even impossible to identify. New routines thus evolve through both
deliberate choice (e.g., “let’s try eliminating this step to save time”) and through more path-
dependent trial-and-error processes (Nelson and Winter, 1982). Thus, the learning process is
complex and unpredictable.
Second, the literature on organizational learning suggests that organizations have
different capacities for learning (e.g., Cohen and Levinthal, 1990; Miner and Mezias, 1996).
Learning from experience is not automatic, but rather may result from action and reflection
within the organization. Experience may provide the opportunity to learn, but a range of factors
have been posited as influences on whether this opportunity is actually exploited (Argyris and
Schon, 1978; Duncan and Weiss, 1979; Dutton and Thomas, 1984; Senge, 1990). This literature
leads us to expect that such factors as team structures, incentives, use of analytic tools for
capturing and analyzing information, and psychological safety (Edmondson, 1999) are a
moderating influence between experience and performance improvement. In summary, drawing
from three research streams, we argue that the slope of a performance improvement learning
curve in different organizations undertaking the same learning task will vary. Specifically,
organizational learning processes will allow different organizations with equivalent experience
al., 1991).
Experience vs. Learning
7
levels to exhibit different levels of performance improvement. Thus, the core proposition in this
paper is that documented performance improvements in so-called learning curves are a function
of both experience and organizational learning.
III. Research Design and Context
To investigate this proposition, we collected data from cardiac surgical units in 16
hospitals adopting a specific new technology for minimally invasive heart surgery. The
technology was developed by a private company and received FDA approval in 1996. By
holding constant the technology, the study design enables us to isolate differences in learning
rates that are due to organizational as opposed to technological factors.
This technology was particularly conducive to exploring the research proposition
presented above. First, all adopting hospitals received the same three-day training session prior
to performing operations on patients, such that all of the operating room teams in our sample had
the same starting base of experience and competence with the procedure prior to the first real
case. Second, the technology had been in commercial use for approximately two years—a long
enough time horizon over which to observe significant performance improvements by adopters
and short enough to allow interviews with people directly involved in early use of the technology
who could accurately recall their experiences. In addition, the newness of this technology
enabled us to trace learning curves for each site from the first use of the technology after the
training. Third, the company that developed the technology had assembled a comprehensive
database documenting all operations with the new technology. This database contained detailed
information on procedure times, surgical outcomes, patient characteristics, and other relevant
variables, and because the data were to be used for clinical study purposes, they were collected

Experience vs. Learning
8
under strict clinical protocols.8 The company agreed to provide us access to these data under
standard conditions of confidentiality,9 and helped us obtain access to personnel at the adopting
hospitals. Finally, as described below, adoption of this technology required more than mastering
the specific surgical technique. It required a significant degree of change in the way different
members of the surgical team interacted and communicated, opportunities for collective, or
organizational learning.
Minimally Invasive Cardiac Surgery. Most cardiac surgery comprises three phases:
gaining access to the heart, operating on the heart, and exiting the chest. The surgeon obtains
access to the heart by splitting the breastbone and separating the ribs. The patient’s blood is then
-lung machine,” which supports the blood pressure and
oxygenates the blood while the heart is stopped. During the operation, a clamp is placed on the
aorta to prevent blood from flowing backward into the heart during the operation. The most
common cardiac surgical procedure is coronary artery bypass graft (CABG) in which a blocked
artery is bypassed with either a vein taken from the leg or an artery dissected from the inside of
the chest wall. Other types of procedures include replacement and repair of mitral valves (MVR)
and repair of atrial septal defects (ASD). Once the operation is complete, the heart is allowed to
resume beating, fill with blood, and gradually take over responsibility for generating blood
pressure. At this point the patient is weaned from the pump and the chest is closed.
The most important difference between minimally invasive cardiac surgery and the
conventional procedure is that the breastbone is not cut and split. Instead, the heart is accessed
through a small incision between the ribs using specially designed instruments. Because the
incision is too small to admit the tubes that take the blood from the patient to the pump, these
8 Data were collected by individual hospitals and checked and cleaned by an independent contract research organization.

Experience vs. Learning
9
tubes are placed in the artery and vein in the groin. Instead of clamping the aorta externally, a
catheter is threaded through the groin up into the aorta and then a balloon is inflated to stop the
blood flowing backwards. The technology poses both a technical challenge for the surgeon, who
must operate in a substantially reduced space, and an organizational challenge for the operating
room team, which must learn a new interpersonal routine.
In conventional surgery, the roles of each team member are well established. In addition,
because the chest is open, everyone has direct visual access to the operative field and the surgeon
has both visual and tactile access. This allows team members to monitor progress of the
operation and to use visual queues to anticipate what actions will be needed. For instance, the
clamping of the aorta is visually apparent to everyone in the operating room and is a signal to the
scrub nurse that the surgeon will soon begin the actual repairs to the heart.
In the new procedure, because of the much smaller incision, direct visual and tactile
access are severely limited. As a result, communication between team members becomes critical
in monitoring progress and in coordinating actions. A good example of the required change is
the clamping of the aorta. In conventional heart surgery, clamping the aorta requires virtually no
coordination or communication. It is done by the surgeon and is visually apparent to everyone
on the team. In the new procedure, the aorta is “clamped” by placing a deflated balloon at a
precise location in the aortic arch (just outside the heart) and then inflating it to the requisite
level of pressure. The process begins with the surgeon threading a catheter into the groin and up
the aorta toward the heart. It is critical to monitor the progress of the catheter to ensure that it is
passing safely through the aorta. Because the surgeon can not directly see the tip of the catheter
inside the aorta, he must rely on other team members for the critical information. Trans-
9 All patient names and identifiers were scrubbed from the database prior to its transfer to us.

Experience vs. Learning
10
esophageal echo10 (TEE) images provide critical information on the location of the catheter and
the balloon. However, because only the anesthesiologists are typically trained in TEE, the
surgeon is heavily reliant on them for this delicate part of the procedure. Perfusionists (specially
trained technicians who operate the heart-lung machine) typically monitor balloon pressure. The
nurses consult monitors which display patient vital signs; a dramatic differences in blood
pressure between one side of the body and another is a sign that the balloon is not located
properly. Proper placement of the balloon requires that team members share information among
themselves (to identify warning signs) and to relay information on a continuous basis to the
surgeon who makes adjustments to the balloon through a catheter. Only after the balloon is
properly placed and inflated, and the aorta occluded, can the surgeon begin performing repairs to
the heart. Through interviews with members of the operating room teams, we learned that
problems accurately placing the balloon were one of the single biggest causes of delays in the
operation.
The placement of the balloon provides an example of the expanded roles of non-surgeon
team members during the new procedure. The anesthesiologist, who in a conventional case had
little to do while the patient is supported by the pump, plays a key role in monitoring balloon
placement through the TEE images. The scrub nurse, who formerly could see the operative area
to follow the surgeon’s progress and anticipate what to do next, has to consult monitors and
communicate with both the surgeon and other team members on the progress of the operation.
The perfusionist, who worked exclusively with the surgeon in a conventional case now has to
work collaboratively with the anesthesiologist and scrub nurse in placing the balloon and
monitoring its movements. Conventional surgery could be described as a “modular” process
10 Trans-esophageal echo, or TEE, is a kind of ultrasound technology primarily used by cardiologists and anesthesiologists.
Experience vs. Learning
11
whereby task boundaries are well established and fairly independent; the new procedure is far
more integral process in which in task boundaries are more blurred and tasks are interdependent.
Thus the technology disrupted the smooth flow of the operative routine and required the
development of new communication behaviors and new routines to enable the execution of a
more interdependent set of processes.
Data. To document rates of learning at the organizational level, we obtained access to
operative histories of 660 patients who had received the new procedure at 16 institutions
nationwide. Of these 16, nine were academic medical centers (“teaching hospitals”) and 7 were
non-academic (“community”) hospitals. The average hospital in our sample undertook a fairly
high volume of cardiac surgeries on an annual basis (approximately 1400/year); total average
annual cardiac surgery volumes ranged from 400-3500 cases per year. All of the hospitals in our
study were non-profit entities. Most of the hospitals had extensive experience adopting new
cardiac surgery innovations, and all had at least some prior experience with innovation. The
company that introduced the technology had targeted these institutions because they were
considered to have “first tier” cardiac surgery departments (with moderate to high total case
volumes, reputable surgeons, and a reputation for high quality care and excellent clinical
outcomes).
For each institution, we assembled a fairly complete case series that spans the first case
performed at a hospital through the last case performed as of November 1998. The average
number of cases for a site in our sample was 40, with a low of 11 and a high of 95. Differences
in number of cases performed across sites were generally the result of two factors. Although all
16 hospitals in our sample were considered “early adopters” (because they adopted within the
first year of FDA approval), there were differences in the exact time of adoption, which
Experience vs. Learning
12
influenced the number of cases performed by November 1998. The site with 95 cases, for
instance, was the first adopter of the technology. In addition, sites also varied in the rate (number
of cases/month) at which they were able to do the procedure (due to availability of appropriate
patients and interests of the adopting surgeon). Most of these data were obtained from a
database compiled for clinical study purposes, but we obtained missing data directly from the
databases created by the hospitals and surgical departments.12 The resulting database contained
the following information for each patient in the sample: characteristics of the patient (e.g., age,
sex, height and weight), indicators of health status prior to the operation (e.g., presence of
diabetes or chronic lung disease), the type of cardiac surgery performed (CABG, MVR, ASD, or
multiple procedures), the type and number of arteries bypassed (when relevant), the date of the
operation, the ordinal sequence a case represented for the hospital (first case, second case, etc.),
and times required to complete various phases of the operation.
We conducted interviews with cardiac surgeons, cardiologists, anesthesiologists, nurses,
perfusionists, and administrators at each of the 16 hospital sites. These interviews provided
important technical information that informed the design of our statistical models, and provided
data on how each site approached adoption, management practices, and organizational climate.
IV. Statistical Models and Analysis
In any context, there may be multiple ways to measure learning. In this paper, we focus
on one dimension: reduction in the time required to perform the minimally invasive cardiac
12 We discovered significant gaps in the database (e.g., hospitals failing to report some or all of their cases and incomplete or inconsistent information). As the database provided the ordered sequence of each case at each hospital (e.g. case number 1, 2, 3, 4, etc.), we could identify gaps by instances in which a case number or multiple case numbers were missing (e.g. 1,2,3, 5,6). We also compared data on the number of cases from the database with other data provided by the hospital on the number of cases they had performed by certain dates. Finally, incomplete data could easily be identified by missing fields in the database.

Experience vs. Learning
13
surgery (procedure time). Investigation of this dimension of learning provides a critical lens
through which to examine organizational learning for several reasons.
First, previous case studies have indicated that procedure time is perhaps the single most
important factor driving the total costs of treating and caring for a cardiac surgery patient.13 This
view was further corroborated during our interviews with administrators at hospitals in our study.
Long procedure times cut into the available capacity for performing surgeries and thus have a
high opportunity cost in terms of foregone revenue. In addition, cardiac surgery teams consist of
highly trained professionals. Typically, hospitals and physicians are each paid a set fee for
performing a specified type of cardiac surgery (e.g., single vessel coronary artery bypass or
mitral valve repair). No additional compensation is provided for using a new technique that
takes longer to treat a particular condition. Thus, if a new technique requires an additional three
hours to perform compared to a conventional procedure, the additional cost is borne by the
hospital.14 And, in recent years, as hospitals have faced significant price restraints from both
public payers and private managed care insurers, the issue of cost has become a critical area of
focus.
Second, procedure time is a good proxy for organizational learning. As described earlier,
minimally invasive cardiac surgery requires a new type of coordination among several
professionals, involving intensive learning by an operating room team. Improved coordination
and communication occurs through developing and refining team routines, thereby allowing
shorter procedure times. Finally, use of procedure time as a dependent variable alleviates the
13 See, e.g., “Partners HealthCare System, Inc. (B): Cardiac Care Improvement,” Harvard Business School case number 9-696-063, and “Massachusetts General Hospital: CABG Surgery (A),” Harvard Business School case number 9-696-015. 14 Medicare and some private insurers make reimbursement provisions for “outlier” patients. However, such extra reimbursements typically only apply when there is a very large difference in the cost of treating a specific patient relative to the average (e.g., the patient experienced complications and was hospitalized for 30 days instead of the normal 5 day period).

Experience vs. Learning
14
effect of “selective referral,” a problem faced by prior medical learning curve studies. Using
medical outcome (such as mortality) as a dependent variable leaves open the possibility that
hospitals and surgeons with better outcomes get more referrals, confounding the causal link
between volume and outcome. In contrast, because procedure time is not a basis for referral of a
patient to a surgeon or hospital, it is extremely unlikely that procedure time results are
confounded by selective referral biases.
One potential concern of focusing on procedure time is the possibility that other
dimensions of performance—particularly clinical outcomes—may suffer when procedure times
are reduced. Reducing procedure times and reducing the risk of complication or death, however,
are not necessarily in conflict. The incidence of central nervous system complications tend to
rise with the length of time the patient is on the heart-lung machine (Roach et al., 1996).15 Thus,
the surgeons we interviewed indicated that reducing procedure time was desirable from the
perspective of a patient’s well-being. Clearly, however, “rushing” an operation could lead to
poor clinical outcomes. The impact of procedure time on clinical outcome in any given case is
extremely difficult to determine; however, the surgeons we interviewed explained that reducing
procedure time, while important, was far less important than achieving optimal clinical
outcomes. We had no reason to disbelieve surgeons' reports that efforts to reduce procedure
times were taken within the confines of delivering high levels of care.16
Dependent Variables. Procedure time reduction—a measure of efficiency
improvement—can occur due to increased surgeon skill, as well as due to improved coordination
within the operating room team. To distinguish between these two factors, we used two measures
15 We attempted to discern whether shorter procedure times were associated with higher post-operative patient mortality rates in our sample. Detecting any correlation, however, was made impossible by the extremely low mortality rate in our sample.

Experience vs. Learning
15
of procedure time. Total procedure time is the time from the point of the first incision to the
completion of the operation; this measure directly relates to the total resources used and cost of
the procedure to the hospital and thus has important managerial implications. We calculated a
second dependent variable by subtracting out the time for the aortic occlusion phase of the
operation from total procedure time. Aortic occlusion occurs after the heart is completely
stopped and the balloon clamp has been successfully placed and inflated. During aortic
occlusion, the surgeon performs repairs to the heart itself. Individual surgeon speed, rather than
team coordination, is likely to be the dominant influence on how long the aortic occlusion phase
lasts. By netting out aortic occlusion time from total procedure time, we constructed a measure
that more closely captures the effects of team coordination—called net adjusted procedure time.
Control Variables. To isolate the effects of cumulative volume on procedure time, we
needed to include in our model as many factors as possible that also impact procedure time.
Obviously, in any operation on any given patient, there are many factors that ultimately
determine the procedure time. For our purposes, it was critical to identify those factors that
might cause large differences in procedure time and which varied systematically across the time
series of cases at any given site. We attempted to identify as many of these factors as possible
through surgeon interviews and through review of relevant medical literature.
First, the particular procedure being performed is likely to affect procedure time. The
technology studied can be used for several types of heart repairs, including coronary artery
bypass (CABG), atrial septic defect repair (ASD), and mitral valve repair or replacement. In
some cases, a combination of repairs is performed during the same operation. The procedure mix
varied across sites in the sample. We controlled for the effects of different procedures by
16 Finally, as a check, the data set allowed us to check for differences in mortality and complication rates; the result that there were no differences across hospitals in either outcome supports the claim that some hospitals did not

Experience vs. Learning
16
including dummy variables for the following procedure types: CAGB, ASD repairs, and multiple
procedures (mitral valve repair/replacement is the excluded category). The distribution of
procedures in our sample was a follows: CABG (49%), Valve Repair/Replacement (43%), ASD
repair (4%), and multiple procedures (4%). Data provided by the company indicated that the
distribution of procedures in our sample was very similar to the distribution of procedures
performed by all adopters of the technology.
Second, we controlled for the number of grafts in the CABG operation; each graft takes
time to sew, hence lengthening procedure time. Third, characteristics of the patient can also
influence operative times. Surgery on sicker patients is likely to take longer due to the risk of
complications. We used a slightly modified version of a standard measure of patient health
known as the Higgins Score. The Higgins Score, a predictor of the probability of death, is a
composite of several pre-operative factors.17 Our measure is a modified Higgins Score (without
anemia, a variable that was not collected in the clinical database we accessed).
One potential factor that might influence operative times is the vintage and type of
equipment available to the teams in our sample. We did not include this factor in our analysis
because the 16 sites had no major differences in basic cardiac surgery operating room equipment.
Second, the company that developed the technology required all adopting sites to use a
consistent, specific set of specialized instruments and catheters for the operations, as this set was
approved by the FDA. The company also specified the use of certain other types of equipment
for its procedure (notably, fluroscopy and TEE cardiographs). Thus, adopting sites had limited
degrees of freedom in their choice of equipment. Finally, even if there were small differences in
attempt to reduce procedure time at the expense of clinical outcomes. 17 The factors are: the extent to which the operation is an emergency case, patient weight and age, the level of serum creatinine, severity of left ventricular dysfunction, the number of previous cardiac surgeries on the patient, the level

Experience vs. Learning
17
equipment across sites that affected procedure times, these differences would be reflected in the
intercept term rather than the site specific learning curve slope coefficients.
We estimated the following model:
ln (Procedure Time i) = α0 + β0CABGi + β1Grafts i + β2ASDi + β4MultiProcedure i + β5Higginsi + β6ln (Cumulative Volume ij) + β7jHospitalj + β8jHospitalj * ln (Cumulative Volume ij) + eij
where each of the variables is defined as below:
Procedure Timei Time in minutes required to perform the procedure on the ith patient.
CABGi A control variable coded 1 if the procedure was a coronary artery bypass,
and 0 if otherwise.
Graftsi A control variable indicating the total number of sites where veins or arteries were stitched to the cardiac arteries being bypassed on the ith patient.
ASDi A control variable coded 1 if the procedure was an Atrial Septal Defect repair, and 0 if otherwise. Multi-Procedurei A control variable coded 1 if multiple types of repairs were performed on the heart during the operation. Higginsi: A control variable based on the Higgins Score to adjust for the health
status of the ith patient at the time of the operation.18 Cumulative Volumeij The number of prior cases of the minimally invasive procedure performed
at hospital j when patient i had his/her operation. Hospitalj A vector of j dummy variables indicating at which hospital patient i had
his/her operation.
This model enables isolation of the effects of cumulative volume on procedure time (the
main effect) and determination of whether this effect is different across sites in the sample (the
interaction term). Many site-specific factors might affect this result. For example, previous
of mitral valve insufficiency, prior vascular surgery, the presence of chronic obstructive pulmonary disease, diabetes, anemia, cerebrovascular disease, and the presence of aortic valve stenosis.

Experience vs. Learning
18
research has shown that the rate of experience accumulation can have an impact on learning
through “forgetting” effects (Argote et al. 1990). In this study, rate of experience could be an
important factor, along with characteristics of the surgical team (e.g., experience or leadership
style) and of the institution (e.g., size or hospital type). Our analytic strategy is to first test for
differences in learning curve slopes across institutions, and then to examine factors that might
explain these differences.
We estimated the model using log specifications of the dependent variable procedure
time and the independent variable, cumulative volume.19 This approach follows the convention
of prior learning curve studies and is consistent with the fact that, in absolute terms, procedure
times cannot decline at a linear rate forever. As an organization reduces its procedure time, we
expect marginal reductions in absolute times to become progressively more difficult and thus
smaller. Eventually, we would expect procedure times to approach an asymptote.
The coefficients of the model can be interpreted as follows. β6, the coefficient on ln
(cumulative volume), captures the average impact of case volume experience on procedure time
across all institutions. Previous learning curve studies lead us to expect this coefficient to have a
negative sign. That is, on average, we expect procedure times to fall in proportion to case
volume experience (holding constant other variables). β7j is a vector of coefficients that captures
how the average procedure times across institutions vary. β7j can be viewed as shifting up or
down the procedure time estimate for any given hospital.
18 In our preliminary analyses, we estimated several versions of the model using separate components of the Higgins index. These did not improve the fit or statistical power of the model. 19 In previous learning curve studies, it has been relatively common to correct for autocorrelation. Autocorrelation is an issue in studies that use some measure of output to construct both the dependent variable (e.g. productivity or average unit cost) and the independent variables (cumulative experience). In our study, this is not an issue because our dependent variable, procedure time, does not include output. Moreover, we ran tests for autocorrelation, and found an autocorrelation estimate for the full ln procedure time model of -0.022, with a 95% confidence interval (-.105, .061). For the full net adjusted procedure time model, the autocorrelation estimate is -0.017, with a 95%

Experience vs. Learning
19
β8j is a vector of the coefficient that captures the extent to which the slope of the learning
curve for an given institution varies from the average. β6-β8j can be interpreted as the learning
curve coefficient for site j. The central proposition of this paper is that cumulative experience
will not account for control-variable adjusted performance improvement, but rather that
organizational learning will lead to differences across institutions. A result obtaining significant
differences among the β8j estimates would support this proposition.
We estimated one model that pooled observations across sites and included dummy
variables for hospitals and an interaction term. With this approach, we used the larger pool of
data to estimate common effects, while isolating the predicted institution-specific differences
through dummy variables and interaction terms. An alternative approach would have been to
estimate a separate regression model for each of the 16 sites (and exclude the site dummy and
interaction term). However, this would require including the entire set of independent variables
in each equation (less site dummy and interaction terms), and thus would not be an efficient use
of degrees of freedom. We used the approach that assumed effects of control variables (Higgins,
CABG, grafts) on procedure time were the same across institutions in our sample, because the
surgeons in our study, although from different institutions, consistently identified the same set of
factors as influencing procedure times. Moreover, the Higgins index was constructed by
statistical research in the medical community on very large samples of patients across many
institutions, suggesting that the index has fairly similar effects across institutions. Finally, in
preliminary statistical analyses we estimated separate models for each site and found that effects
of the control variables were consistent across sites.
confidence interval (-.107, .070). For both models, the results are not different from zero, indicating a lack of autocorrelation.

Experience vs. Learning
20
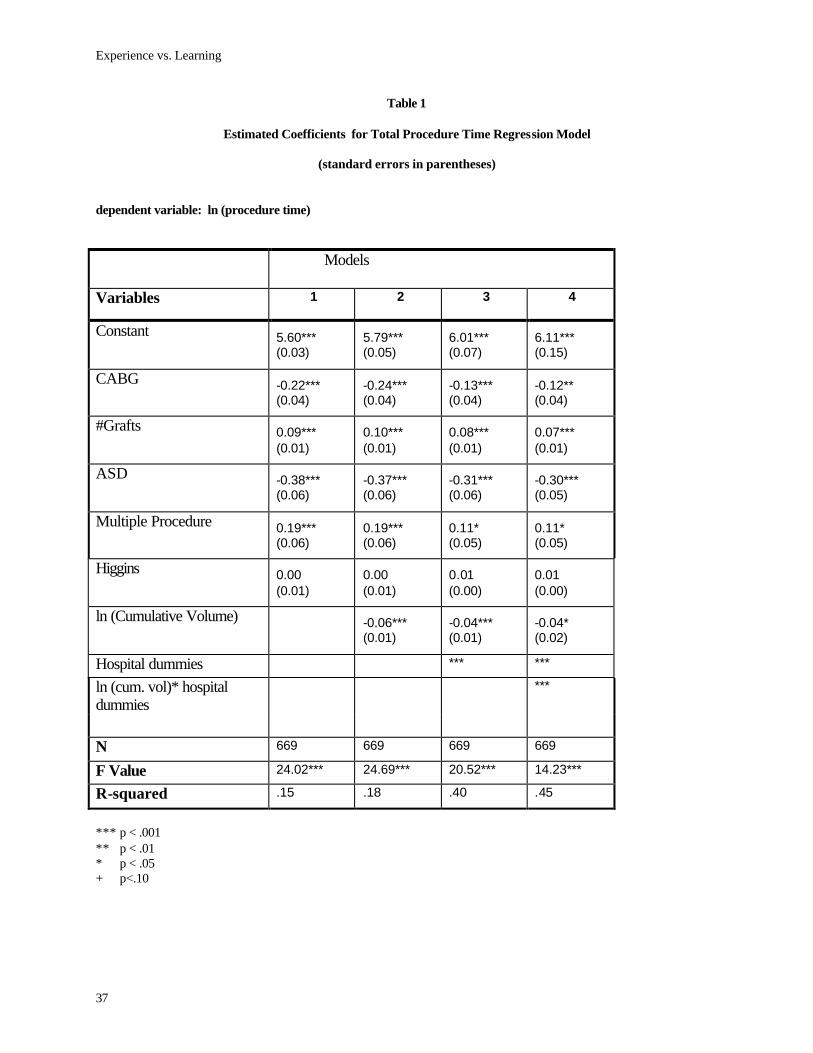
Results. Table 1 shows the results of the total procedure time models. For clarity of
presentation, Table 1 does not report the individual coefficients on site-specific estimates
(Hospitalj and Hospitalj*ln(Cumulative Volumeij ) but simply denotes whether the vector is
statistically significant from 0. Tables 2 shows the analogous results for the net adjusted
procedure time models.
In the total procedure time models (Table 1), all control variables, except Higgins, have
the expected sign and are statistically significant in all specifications. Model 2 considers the
effect of cumulative volume. Consistent with previous learning curve studies, the estimated
coefficient is negative and statistically significant; on average, total procedure time falls with the
institution’s cumulative experience with the technology. Model 3 adds a dummy variable for
each hospital site. The vector of dummy site variable coefficients (Β7j) is statistically significant
and improves the overall fit of the model.
Next, we address the question of whether hospital effects are different from each other.
Results of the F-test show that the magnitude of site-specific effects on procedure time varies
significantly across hospitals (F=14.11, p<.0001). Because the site dummies affect the intercept,
this finding suggests that initial procedure times varied significantly across hospitals in our
sample. This finding is interesting given that all adopting sites received highly-standardized
training in how to conduct the procedure. The company invested heavily in this training, both in
the development of supporting documentation and training materials and in providing technical
support in the field. Despite these efforts, these results indicate that some adopters start off faster
than others.
Model 4 addresses the core research question of the study, whether sites learn at different
rates. To do this, it includes an interaction term between the hospital dummy and cumulative

Experience vs. Learning
21
experience. Whereas Model 3 helped us identify differences across hospitals in the intercepts,
Model 4 isolates differences in slopes. These results show, first, that the vector of coefficients
corresponding to the interaction term is statistically significant. Second, affirmatively answering
our core research question, the results show that these site-specific slope coefficients are
statistically different from each other. To test this, we calculated an F-statistic from the vector of
coefficients β8j. The results supported our hypothesis, revealing significant differences in the
slopes of the learning curves across sites (F=3.44, p<.0001). Model 4 also shows that, even after
taking into account site-specific effects on the slope, significant differences in the intercepts
across sites still persist.
—Tables 1 and 2 about here—
Table 2 presents the results for the net adjusted procedure time models. With the exception of
some differences in control variables (ASD and Higgins), the overall impact of the variables of
interest is consistent with those presented for the total procedure time models. In sum, there is
an overall tendency for procedure times to fall with cumulative experience. Again, we find
statistically significant differences in both the slope and intercept of the learning curves across
our sample of 16 sites. These results give us further confidence that organizational or team
learning plays an important role in reducing procedure time, because the effects of cumulative
experience are different across sites, even when surgeon learning (improvements in stitching
time) is removed from the analysis.
The parameter estimates from the models above provide insight into the substantive
impact of learning curve differences across sites. To illustrate this, Figure 1 shows the time
obtained when we hold procedure type constant (a single vessel CABG performed on a patient of
typical health status—a Higgins score of 2.5), and trace the estimated net adjusted procedure

Experience vs. Learning
22
times for the first 50 cases for the site with the steepest, statistically significant learning curve
coefficient(Hospital M). The learning curve for Hospital M is juxtaposed against the estimated
average learning curve across all 16 sites in the study. As can been seen in Figure 1, Hospital M
had slower than average predicted procedure times for its first 7 cases. Our models suggest,
however, that by case 50, the team at Hospital M would be able to undertake a comparable
procedure significantly faster than the typical team in our sample. The estimated net adjusted
procedure time for Hospital M at case 50 would be approximately 132 minutes versus 220
minutes for the sample average.
Hospital M’s reduction in procedure time is substantial both in terms of raw time and the
associated costs. We estimate that Hospital M was able to reduce its net adjusted procedure time
from approximately 500 minutes on case 1 to 132 minutes by case 50. Using a standard industry
assumption that a cardiac operating room suite costs approximately $1,500 per hour, this 6 hour
reduction translates into a potential cost savings of $9,000 per case. Hospital M’s 88 minute
procedure time advantage over the average hospital is also by no means trivial. At $1,500 per
hour, this translates into approximately a $2,250 per case advantage. A 368 minute improvement
at Hospital M allows the surgeons to do one more revenue generating procedure per day.20 In
addition, at 132 minutes for the procedure (not including occlusion time), Hospital M’s time to
undertake the minimally invasive cardiac procedure is very close to the time required to perform
a similar phase of the operation using a conventional surgical approach.21
20 Medicare reimbursement for a coronary artery bypass graft admission ranges between $33,000 and $36,000. The cumulative effect of this over the course of a year can be quite substantial. Since cardiac surgery is one of the few services that is capacity constrained in the current health care environment, there are high opportunity costs for long procedure times. 21 After conducting our statistical analysis, we conducted a follow-up interview with the surgeon at Hospital M who performs the minimally invasive procedure. We asked him to tell us how long it takes his team now to perform the minimally invasive operation for a single vessel graft on a patient in average health. Our statistical estimate of 132 minutes fell within about 10 minutes of what he estimates it now takes his team to do the procedure. In addition, he

Experience vs. Learning
23
—Figure 1 about here—
One potential concern about interpreting learning curve coefficients is that some
organizations may appear to be “faster learners” by virtue of the fact that they were slow starters.
That is, they might reduce procedure time dramatically from an extremely high initial base.
While it is true that Hospital M started slower than the average hospital, Figure 1 also indicates
that its rate of improvement leads to an overall advantage in procedure time. Table 3 presents
estimates for net adjusted procedure time at case 40 across all 16 hospitals in our study. We used
40 cases as the point of comparison since 40 was the average number of cases performed at each
hospital at the time of our study. Clearly, we need to be careful interpreting these results for two
reasons. First, although 9 of the 16 hospitals in our study had performed more than 40 cases, we
are extrapolating past the experience base for the others. Second, although the procedure times
listed in the table are point estimates, our statistical models only allow us to say something about
the range of estimated procedure times we might expect to observe with some level of
confidence. We show these procedure times only to provide a rough illustration of the range of
estimated procedure times, rather than to draw definitive conclusions about differences between
specific sites.
Notwithstanding these caveats, Table 3 demonstrates that we might expect very large
differences in procedure times across sites over a comparable base of experience. Hospital M’s
estimated 143 minute time (at case 40) is the shortest net adjusted procedure time in our sample.
The largest outlier in the opposite direction was 307 minutes, more than two and half hours
longer than the time it takes Hospital M to do an entire case. The correlation between the
noted that a minimally invasive cardiac operation for his team now only take about 20 minutes longer than a similar type of case performed conventionally.

Experience vs. Learning
24
estimated procedure time for the hospitals’ initial case and the estimated procedure time by case
40 were not negatively (or positively) correlated.
—Table 3 about here—
V. Exploring Differences Across Sites
The above statistical analysis provides evidence that rates of learning can differ
significantly across independent organizations in the same industry. What might account for
these differences? As discussed above, all hospitals had similar state-of-the-art operating rooms;
all were using essentially the same FDA approved set of devices; all adopting surgical teams
went through the same training course; all of the teams came from respected cardiac surgery
departments. One possible source of differences might be the number of surgeons performing
the procedure at each hospital. With more surgeons using the new technology, the experience
base would be diluted. However, in our sample, this does not appear to be a contributing factor.
All but one of the hospitals in our study had the same surgeon performing all of the minimally
invasive operations. In the one hospital where three surgeons performed the operation, we found
no differences across surgeons in speed or the effect of cumulative experience, although the
hospital was a slow learner relative to others in the sample. Thus, dilution of experience may
have affected this one site but did not account for differences among the other sites.
Existing theories of organizational learning suggest a number of factors that might
explain our observed differences in slope coefficients across sites. One of these concerns
knowledge depreciation or “forgetting effects” resulting from turnover or time lags (Argote et
al., 1990). A theory of organizational forgetting would suggest that hospitals might learn faster
if the initial rate of conducting procedures were higher—imposing less time between procedures
for decay of new learning, while mastering the new technique. To test for this effect, we

Experience vs. Learning
25
correlated initial frequency (the number of procedures in the first 30 days at each hospital) with
the rate of reduction in procedure time (reverse-scored slopes of individual hospital learning
curves). The Spearman Rank Order correlation (rho=.13, p=.62) did not support this
proposition.22 We also examined how the lag between training and conducting the first case for
each hospital might have effected learning curve slopes. This revealed a weak but insignificant
association between greater lag and rate of procedure time reduction (rho=-.26, p=.37).
Similarly, if later starters could learn from the experience of earlier starters, the timing of
adoption might matter; however, there was no association in these data between start date and
rate of procedure time reduction (rho=.09, p=.73). Finally, the size of the cardiac surgery
departments in our sample hospitals varied substantially (as measured by number of cardiac
surgeries per year). To the extent that greater size is associated with more organizational
complexity and that it inhibits focus, it could have a detrimental impact on learning performance.
However, the slight negative relationship between department size and procedure time reduction
was not significant (rho=-.18, p=.52).
Interview data suggested instead that differences in learning performance could be due to
differences in underlying organizational processes. To illustrate this possibility, we present two
cases of hospitals (Hospital M and Hospital I) with very different learning curve slopes. As
mentioned above, Hospital M had the steepest learning curve. Hospital I was at the other end of
the spectrum. Its per case rate of improvement in procedure time was the second worst in the
22 We utilized the non-parametric statistical test, Spearman’s rho, to test this, as nonparametric statistics do not require assumptions about the distribution of the population from which the samples were taken, and also do not inflate the correlation due to outlier values (Saslow, 1982).

Experience vs. Learning
26
sample.23 Our intent with these case comparisons is to generate plausible hypotheses for future
testing.
Hospital M. Hospital M is a well-respected community hospital performing 1200 cardiac
operations a year. Although the cardiac surgery department did not have a history of undertaking
major research or cardiac surgical innovation, it had recently hired a relatively junior surgeon
with an interest in trying new techniques. Several characteristics of Hospital M’s adoption of the
new technology could plausibly have contributed to their relatively rapid rate of learning.
First, the team that went to the company’s three-day training program was not picked
randomly or on the basis of seniority (as it was at several other institutions). Instead, the
adopting surgeon hand-picked the team based on their prior experience working together and
their demonstrated ability to work well together. Second, there was evidence of a fairly high
degree of cross-department communication and cooperation even before the first case. After
returning from the training, the surgeon organized a series of meetings with other departments
that might be affected by the new technology. For instance, he invited the entire cardiology
department to a presentation at which he provided an overview of the technology and its
indications for use. This was important because it facilitated referrals of appropriate patients by
cardiologists. The perfusionists and the operating room nurses then met to agree upon “standard
terminology” that they would use during operations. There was also evidence that these cross-
department interactions continued after the first clinical cases. The perfusionists met on an
informal, but regular, basis with both the operating room nurses and the anesthesiologists to
discuss the procedure. A perfusionist noted, “We want to be familiar with what everyone on the
team is doing.” The surgeon also continued to have weekly meetings with cardiologists to
23 As mentioned earlier, the hospital with the slowest rate of learning was the only hospital to have multiple surgeons using this procedure. Thus, we thought that Hospital I and Hospital M would make a more meaningful

Experience vs. Learning
27
discuss upcoming cases (a practice that was virtually non-existent in other hospitals in our
study).
Third, the early cases (through the first 30) were carefully managed by the adopting
surgeon. The surgeon mandated stability of both the surgical team and the surgical procedure in
the early cases. Thus, the team that went to the training program performed the first 15 cases
before any new members were added or substituted. And, when new members were eventually
added, they were required (regardless of rank) to observe 4 cases and be proctored on 2 before
they were allowed to join the team. The surgeon also deliberately scheduled a set of similar
cases so that the team performed six operations in the first week (which occurred four weeks
after the team went to training). This allowed the team to keep the surgical procedure stable for
the first 30 cases, without modifying anything specified in the training. Moreover, prior to each
of the first 10 cases, the entire surgical team met to discuss the proposed procedure for the case
in advance. The team also met again after each of the first 20 cases to debrief. Thereafter, the
surgical team at Hospital M set up a process through which it could monitor the short- and long-
term outcomes of the new operation. The head perfusionist went to the intensive care unit to
check on each patient the day after surgery. Other team members collected and analyzed both
process and outcome data and presented the results to the referring cardiology group and to
national surgical conferences.
Finally, there was some evidence that the surgeon at Hospital M encouraged a high
degree of cooperation among members of the team. He saw minimally invasive cardiac surgery
as a paradigm shift; he reported that “the surgeon needs to be willing to allow himself to become
a partner [with the rest of the team] so he can accept input.” He explicitly encouraged input and
feedback from other team members in the operating room. One team member (not the surgeon)
comparison.

Experience vs. Learning
28
noted, “With this procedure, the hospital was willing to empower the team. There’s a real
trusting relationship that allows this to occur.”
Hospital I. The approach taken by Hospital I, a large, nationally renowned academic
medical center differed markedly from that of Hospital M. The initial phase of adoption at
Hospital I differed substantially from the approach observed at Hospital M. The team that was
sent to training was picked largely on the basis of availability and willingness to go (the training
was scheduled for a weekend). In addition, only three of the four core team members who
attended training together were present for the first case. For each of the subsequent six cases
the team composition was slightly different, and the surgeon later noted that “it was a disaster.
Now [the team] is very stable. We planned the operation so that the same people were here. I
won’t do it if the team is not here.”
Unlike Hospital M, there were no attempts to introduce the technology to the other
clinical groups that might contribute to or be impacted by its implementation. This lack of cross-
departmental communication is also apparent in the phases after the hospital began using the
technology on patients. For example, there were no meetings to discuss cases ahead of time. An
anesthesiologist noted, “I get no warning of a minimally invasive case until I show up at the
hospital.” There was also little indication that the staff involved with this procedure viewed
themselves as a “team.” One nurse noted, “We don’t have any real teams here. It’s just who gets
assigned on any given day.” Another added, “The nurses are interchangeable. We know our
‘little job’ and don’t really know what the other people are doing.”
Not only was team membership unstable during the early cases but the surgeon changed
the operative process for each early case, noting that, “I try to do something new on every case.”
In addition, there were no specific activities to reflect upon and share the experience gained on

Experience vs. Learning
29
the early cases. Hospital I, which published prolifically in the academic medical literature, did
not use the high quality data it collected for research purposes to inform its daily practice.
Finally, although the adopting surgeon at Hospital I was affable and respectful of other team
members, his focus was largely on mastering the technical aspects of the operation rather than
managing the overall adoption process and proactively encouraging input.
In summary, Hospital M's process for adopting the minimally invasive approach differed
markedly from the pattern found in Hospital I. First, the hospitals differed in terms of formal
procedures for new technology adoption. The presence of standardized training requirements
might facilitate learning by ensuring consistency of techniques across different people. Second,
cross-functional communication might facilitate learning, for example, if cardiologists'
understanding of the procedure enabled them to make appropriate patient referrals, promoting
consistency or simplicity of patient conditions, in the early stages. Third, team membership
stability and operative process stability both are likely to promote speed of learning, by allowing
a consistent group of people to work on a consistent task and thereby improve coordination (e.g.,
Moreland et al., 1998). Fourth, team debrief activities—including explicit reflection on relevant
data—prevalent at Hospital M but missing at Hospital I, can allow a team to reflect on its past
actions and design any changes needed to streamline its task (Edmondson et al., 2000), which
would likely foster greater efficiency. Finally, surgeon coaching behavior as demonstrated at
Hospital M, may allow other team members to feel more comfortable speaking up quickly about
their observations, for example, related to balloon placement or blood pressure, thus enabling
quicker response and ultimately faster operations. In sum, these cases suggest five factors that
might account for differences in rate of learning. More investigation of these factors is
warranted before conclusions can be drawn.

Experience vs. Learning
30
VI. Conclusions and Implications
Consistent with previous studies of the learning curve, this paper provides evidence that
learning-by-doing, through cumulative experience, plays a central role in the adoption of new
technologies. Our results also suggest, however, that learning from experience is not automatic.
Some organizations capitalize on their experience more effectively than others. Two potential
implications of this finding for theory and practice are discussed below, followed by issues for
future research.
First, learning-by-doing may be a firm-specific capability. As a result, simply increasing
output (in order to gain more cumulative experience) may not necessarily lead to a superior cost
position. An organization with less cumulative experience than its rivals can still achieve a
performance advantage if it more thoroughly exploits its opportunities for learning. Our results
offer a strong caution to technology adopters about depending too heavily on output expansion as
the key driver of performance improvement. This is particularly important to consider in the
context of medical technologies, where the existing volume-outcomes literature has focused
administrative and regulatory attention on volume, rather than on processes of adoption.
Although some level of cumulative experience may be necessary to master a technology, it is
unlikely to be sufficient. Unless an organization puts into place mechanisms for capturing
knowledge and implementing learning, experience may not translate into competence.
Second, for producers of a new technology the same caution applies. Innovators cannot
assume that the initial “teething pains” experienced by adopters will necessarily subside with
some specific level of experience. Facilitating collective (or organizational) learning may be an
important role that innovators need to play in ensuring the successful adoption of their
technology. Training would seem to be a logical strategy, but we must note that significant
differences in learning rates in our sample existed despite intensive and consistent training

Experience vs. Learning
31
provided by the innovating firm. Certain differences may be rooted in structural and
organizational aspects of the adopters themselves and may not be subject to change by the
innovator.
Our research to date raises questions to be explored in future work. The first concerns
the specific organizational and managerial factors that underlie the differences in learning rates
we observed. Our brief case descriptions of two organizations point in the general direction of
certain factors, but much more in-depth, comparative work is required to draw more specific
conclusions about the drivers of learning. An exploration of organizational level differences in
incentives, organizational processes, management, and practices is clearly warranted. A second
fruitful area concerns the complex interaction between performance improvements and future
adoption. There may be virtuous and vicious cycles at work. Early adopters with initial success
(failure) may then have an interest in doing more (fewer) cases. This leads to growing
(declining) volume which, in turn, may stimulate further performance improvement
(deterioration). A third avenue for future work concerns different dimensions of learning. This
paper focused on procedure time reduction as one particular manifestation of learning. Learning
in the context we have studied can also be manifested in other ways. For instance, some
hospitals in our study have begun to use the new technology for a wider range of cardiac
procedures than other hospitals. Future work should analyze learning curves associated with
these other dimensions of performance. Ultimately, we hope this work will contribute to the
empirical base of knowledge about the complex and poorly understood processes by which
organizations learn.

Experience vs. Learning
32
References
Adler, P. S. (1990). “Shared Learning.” Management Science 36(8): 938-957.
Adler, P. S. and K. B. Clark (1991). “Behind the Learning Curve: a Sketch of the Learning
Management Science 37(3): 267-281.
Argote, L. (1996). “Organizational learning curves: Persistence, transfer and turnover.”
International Journal of Technology Management 11(7,8): 759-769.
Argote, L., S. L. Beckman and D. Epple (1990). “The Persistence and Transfer of Learning in
Management Science 36(2): 140-154.
Argote, L. and D. Epple (1990). “Learning Curves in Manufac Science 247: 920-924.
Argote, L., C. A. Insko, N. Yovetich and A. A. Romero (1995). “Group Learning Curves: The
Effects of Turnover and Task Complexity on Group Performance.” Journal of Applied
Social Psychology 25(6): 512-529.
Argyris, C. and D. A. Schon (1978). Organizational Learning: A Theory of Action Perspective.
Reading, MA, Addison-Wesley.
Cohen, W. M. and D. A. Levinthal (1990). “Absorptive Capacity: A New Perspective On
Administrative Science Quarterly 35(1): 128-152.
Duncan, R. B. and A. Weiss (1979). “Organizational Learning: Implications for Organizational
Research in Organizational Behavior 1(4): 75-125.
Experience vs. Learning
33
Dutton, J. M. and A. Thomas (1984). “Treating Progress Functions as a Managerial
The Academy of Management Review 9(2): 235-247.
Edmondson, A. (1999). “Psychological Safety and Learning Behavior in Work Teams.”
Administrative Science Quarterly 44: 350-383.
Edmondson, A. and B. Moingeon (1996). When to Learn How and When to Learn Why:
Appropriate Organizational Learning Processes as a Source of Competitive Advantage.
Organization Learning and Competitive Advantage. B. Moingeon and A. Edmondson.
London, Sage Publications.
Edmondson, A. C., R. M. Bohmer and G. P. Pisano (2000). Learning New Technical and
Interpersonal Routines in Operating Room Teams. Technology. T. L. Griffith. Stamford,
Jai Press.
Edmondson, A. C. and B. Moingeon (1998). “From Organizational Learning to the Learning
Management Learning 29(1): 5-20.
Epple, D., L. Argote and R. Devadas (1991). “Organizational Learning Curves: A Method for
Investigating Intra-Plant Transfer of Knowledge Acquired through Learning by Doing.”
Organization Science 2(1): 58-70.
Gruber, H. (1992). “The learning curve in production of semiconductor memory chips.” Applied
Economics 24: 885-894.
Gruber, H. (1994). “The yield factor and the learning curve in semiconductor production.”
Applied Economics 26(8): 837-843.

Experience vs. Learning
34
Hannan, E. L. (1999). “The Relation Between Volume and Outcome in Health C New
England Journal of Medicine 340(21): 1677-1679.
Hannan, E. L., et al. (1991). “Coronary Artery Bypass Surgery: The Relationship between
Inhospital Mortality Rate and Surgical Volume after Controlling for Clinical Risk
Factors.” Medical Care 29(11): 1094-107.
Hatch, N. W. and D. C. Mowery (1998). “Process Innovation and Learning by Doing in
Management Science 44(11): 1461-1477.
Hayes, R. H. and K. B. Clark (1986). “Why Some Factories Are More Productive than Others.”
Harvard Business Review 64(5): 66-73.
Jarmin, R. S. (1994). “Learning by Doing and Competition in the Early Rayon Industry.” The
Rand Journal of Economics 25(3): 441-454.
Levitt, B. and J. G. March (1988). “Organizational Learning.” Annual Review of Sociology 14:
319-340.
Luft, H. S., D. W. Garnick, D. H. Mark and S. J. McPhee (1990). Hospital Volume, Physician
Volume, and Patient Outcomes: Assessing the Evidence. Ann Arbor, MI, Health
Administration Press.
Miller, D. (1990). The Icarus paradox: how exceptional companies bring about their own
downfall. New York, Harper Business.
Miner, A. S. and S. J. Mezias (1996). “Ugly Duckling No More: Pasts and Futures of
Organizational Learning Research.” Organization Science 7(1): 88-99.

Experience vs. Learning
35
Moreland, R. L., L. Argote and R. Krishnan (1998). Training People to Work in Groups. Theory
and Research on Small Groups. R. S. Tindale. New York, Plenum Press.
Nelson, R. R. and S. G. Winter (1982). An Evolutionary Theory of Economic Change.
Cambridge, MA, The Belknap Press of Harvard University.
Prahalad, C. K. and G. Hamel (1990). “The Core Competence of the Corporation.” Harvard
Business Review 68(3): 79-91.
Roach, G. W., et al. (1996). “Adverse cerebral outcomes after coronary bypass surgery.
Multicenter Study of Perioperative Ischemia Research Group and the Ischemia Research
and Education Foundation Investigators.” New England Journal of Medicine 335(25):
1857-63.
Rosenberg, N. (1976). Perspectives on Technology. Cambridge, Cambridge University Press.
Saslow, C. A. (1982). Basic Research Methods. New York, Random House.
Senge, P. M. (1990). The Fifth Discipline. New York, Doubleday.
Sinclair, G., S. Klepper and W. Cohen (2000). “What's experience got to do with it? Sources of
cost reduction in a large specialty chemicals producer.” Management Science 46(1): 28-
45.
Teece, D. and G. P. Pisano (1994). “The Dynamic Capabilities of Firms: an Introduction.”
Industrial and Corporate Change 3(3): 537-556.
Teece, D. J., G. P. Pisano and A. Shuen (1997). “Dynamic capabilities and strategic
management.” Strategic Management Journal 18(7): 509-533.

Experience vs. Learning
36
von Hippel, E. (1976). “The Dominant Role of Users in the Scientific Instrument Innovation
Research Policy 5(3): 212-239.
von Hippel, E. (1982). “Appropriability of Innovation Benefit as a Predictor of the Source of
Innovation.” Research Policy 11(2): 95-115.
von Hippel, E. and M. J. Tyre (1995). “How learning is done: Problem identification in novel
Research Policy 24(1): 1-12.
Wernerfelt, B. (1984). “A Resource-Based View of the Firm.” Strategic Management Journal
5(2): 171-180.
Wright, T. P. (1936). “Factors affecting the costs of airplanes.” Journal of Aeronautical Sciences
3: 122-128.
Experience vs. Learning
37
Table 1
Estimated Coefficients for Total Procedure Time Regression Model
(standard errors in parentheses)
dependent variable: ln (procedure time)
Models
Variables 1 2 3 4
Constant 5.60*** (0.03)
5.79*** (0.05)
6.01*** (0.07)
6.11*** (0.15)
CABG -0.22*** (0.04)
-0.24*** (0.04)
-0.13*** (0.04)
-0.12** (0.04)
#Grafts 0.09*** (0.01)
0.10*** (0.01)
0.08*** (0.01)
0.07*** (0.01)
ASD -0.38*** (0.06)
-0.37*** (0.06)
-0.31*** (0.06)
-0.30*** (0.05)
Multiple Procedure 0.19*** (0.06)
0.19*** (0.06)
0.11* (0.05)
0.11* (0.05)
Higgins 0.00 (0.01)
0.00 (0.01)
0.01 (0.00)
0.01 (0.00)
ln (Cumulative Volume) -0.06*** (0.01)
-0.04*** (0.01)
-0.04* (0.02)
Hospital dummies *** ***
ln (cum. vol)* hospital dummies
***
N 669 669 669 669
F Value 24.02*** 24.69*** 20.52*** 14.23***
R-squared .15 .18 .40 .45
*** p < .001 ** p < .01 * p < .05 + p<.10

Experience vs. Learning
38
Table 2
Estimated Coefficients for Net Adjusted Procedure Time Regression Model
(standard errors in parentheses)
dependent variable: ln (team time)
Models
Variables 1 2 3 4
Constant 5.14*** (0.04)
5.39*** (0.06)
5.62*** (0.09)
5.69*** (0.20)
CABG 0.09 (0.05)
0.07 (0.05)
0.20*** (0.05)
0.23*** (0.05)
#Grafts 0.07*** (0.02)
0.08*** (0.02)
0.06*** (0.01)
0.05*** (0.01)
ASD -0.10 (0.08)
-0.08 (0.08)
-0.03 (0.07)
-0.02 (0.07)
Multiple Procedure 0.19** (0.07)
0.20** (0.07)
0.11 (0.06)
0.12* (0.06)
Higgins 0.01+ (0.01)
0.01+ (0.01)
0.02* (0.01)
0.02* (0.01)
ln(Cumulative Volume) -0.08*** (0.02)
-0.05*** (0.02)
-0.05** (0.02)
Hospital dummies *** ***
ln (cum. vol)* hospital dummies
***
N 628 628 628 628
F Value 16.96*** 19.74*** 15.57*** 11.96***
R-squared .12 .16 .35 .42
*** p < .001 ** p < .01 * p < .05 + p<.10

Experience vs. Learning
39
Table 3
Estimated Net Procedure Time After 40 Cases of Experience
Hospital Estimated Net Procedure Time After 40
Cases of Experience (minutes)
A 305
B 222
C 307
D 289
E 155
F 189
G 188
H 253
I 266
J 235
K 175
L 288
M 143
N 228
O 189
P 295

Experience vs. Learning
40
Figure 1:Estimated Net Adjusted Procedure Times: Hospital M vs. Average
0
100
200
300
400
500
600
0 5 10 15 20 25 30 35 40 45 50
Case Number
Est
imat
ed N
et A
dju
sted
Pro
ced
ure
Tim
e (m
inu
tes)

Experience vs. Learning
41