expeditors/media/files/e/expeditors-ir-v2/... · expeditors network our systems and technology,...
TRANSCRIPT

E X P E D I T O R S
2 0 1 7 A N N U A L R E P O R T
EX
PE
DIT
OR
S IN
TE
RN
AT
ION
AL
OF
WA
SH
ING
TO
N, IN
C. 2
017
AN
NU
AL
RE
PO
RT

B O O T S O N T H E
G R O U N D
E X P E D I T O R S 2 0 1 7 A N N U A L R E P O R T


TO OUR SHAREHOLDERS
We are examining various uses of artificial intelligence and
one of its key components, machine learning. In fact, we use
machine learning in our operations today and very much
count on technologies such as these to drive higher levels of
execution and efficiency. In 2017, we continued to invest in
technology and brought new services to the market, including
Cargo Signal and Expeditors Carrier Allocation. Both of these
services were developed by our core business and technology
teams, and are powered by specialized technology that
incorporates best in class processes that improve the
performance of our employees and that of our customers.
Our Chief Strategy Officer has built out our team, designed
our methodology, analyzed market data and activity, and
is now focused on proving out ideas that will add to our
future. We are exercising discipline in our approach and will
invest in ideas that demonstrate the highest real promise
for future growth.
As you think about our company going forward, we hope
you walk away with an understanding that we are a market
leader today and intend to remain so for years to come. There
is much talk about technology and its ability to disrupt. We
are highly focused on technology but we also know that it
takes an incredible network of individuals and “boots on the
ground” to make the supply chain perform at optimum levels
and solve challenges quickly.
As always, a big thank you is in order for our employees,
customers, service providers, and shareholders. There are
many companies that people can choose to work with, work
for, and invest in and we never take your trust lightly.
Thank you for your on-going support and trust.
Jeffrey S. Musser
President & Chief Executive Officer, Director
Events in a single year can have an amazing impact on the
supply chain and the companies that count on the supply
chain to perform mission critical tasks every day. In 2016, we
faced a market of over-supply and slowing demand, whereas
in 2017, the market changed rapidly with an under-supply of
space and growing demand.
In 2017, we studied the market, made appropriate plans
based on the detailed facts presented, and, most importantly,
executed against our plans. By remaining resolute in our plans,
we continued to grow our business and, at the same time, we
improved our financial metrics from the first quarter through
the fourth quarter of 2017.
We are extremely proud to report that each of our core
services grew and became more efficient in 2017. It is true
that some of these services may not have grown with the
pace of the market. This was a deliberate move based on our
view of the marketplace. Our tenured leadership at all levels
demonstrated an ability to make quick decisions regarding
business that drives value to the organization, versus
business that is not an appropriate fit in a time of supply and
demand imbalance.
We regularly talk about the importance of people, process,
and technology, how each of these areas differentiates
us from our competitors, and how critical they are to the
success of our organization. Equally important is our ability
to execute all of our services worldwide on behalf of our
customers. This year, our people, our “boots on the ground,”
made a world of difference in our ability to perform for our
customers in a very difficult market. We know our customers
count on us and we take that very seriously.

EXPEDITORS NETWORKOur systems and technology, along with our extensive network of Boots on the Ground, enable us to provide highly flexible supply chain services. We bring global perspective with local expertise in search of optimal routing and pricing solutions for our customers.

over
16,500 employees
at
177 district offices
in over
60countries

EXPEDITORS TECHNOLOGY
Technology is at the foundation of everything we do. Our single, global technology platform enables greater speed, visibility, and analytics across our network, and allows seamless introduction of new capabilities throughout our worldwide organization. Our constant focus on people, processes, and technology is a key differentiator that drives our success.
3 million+ trading partners in our digital network
100 million+ daily system events driving digitized operations
82%+ Order Management bookings driven online


The world of high tech electronics manufacturing for a global consumer base is complex and ever-changing.
As an example, recently a North African country published a new regulation that restricts the import of certain finished goods to promote local manufacturing. A global manufacturer of high-value electronics thus shifted their model from finished goods to component importation to North Africa. Doing so created a new challenge since the components contained lithium ion batteries that qualify as dangerous goods, with limitations to international carriage. The customer had also experienced repeated incidents of pilferage.
Fortunately, we handle this sort of complexity all the time. Expeditors knew what to do and our people immediately set up a project team jointly with the customer, applying our internal expertise to assess the customer’s needs, and working our network to come up with the best routing solution. As is often the case, the most obvious routes weren’t necessarily the most advantageous. Having clearly identified the customer’s need for a route that accommodated dangerous goods requirements and also accounted for security, our people were able to design a new route that combined air, land and sea transit, with a dedicated security escort through a key part of the journey. The new bundled solution enabled the customer to securely and timely fulfill their market demand without raising their product price.
Boots on the Ground means expertise, creative problem solving and hard work. Our experienced people are trained to provide the best solution to meet the needs of our customers.

When one of our customers that distributes backyard play equipment needed a Christmas miracle to fulfill
holiday orders, it was Expeditors’ Boots on the Ground that kicked into
gear for a tale of holiday cheer.
Shortly before Christmas, the customer realized that a batch of orders had not been entered into their system because of a sudden emergency that required rushing one of their customer service representatives to intensive care. Because of the dash to the hospital, the orders had not been received into our electronic system to trigger the shipment in time for Christmas installation.
Realizing the tremendous disappointment this would cause for the 14 families expecting installation in time for Christmas, the shipper contacted us in a panic. In this case, because it was the holidays, our regular staffing was lighter than usual. The Expeditors district manager – along with a skeleton crew that sprang into action – spent a good part of Christmas Eve at the warehouse to ensure that the orders were shipped out, and that each order was routed to its final destination for installation in time for Christmas surprise and delight.
Boots on the Ground means more than having the best technology and systems to move freight from origin to destination. Sometimes technology and systems aren’t enough, which is when we get a chance to show the strength of our company at its best. It was the dedication of our people and their attention to detail throughout that filled this story with the holiday spirit.
And best of all: the customer service representative is doing just fine and was able to enjoy a healthy holiday season.

+6%+9%
+3%
+10%+3%
+11%
+10%
-2%
+14%-1%
+5%
+7%
+3%+5%
A I R F R E I G H T T O N N A G E
O C E A N C O N TA I N E R S
N E T R E V E N U E S
D I L U T E D E P S
1 4 1 5 1 6 1 7 1 4 1 5 1 6 1 7 1 4 1 5 1 6 1 7 1 41 3 1 3 1 3 1 3 1 5 1 6 1 7
+25%
+14%
In the midst of ramping up for the holidays, a large multi-service customer came to
us in dire need: one of their other primary shipping providers had fallen prey to a cyberattack that shut down all of their
systems for a duration unknown.
How quickly could we step in and take over all of their holiday shipping
in the affected region?
We didn’t know the answer but were confident that we had the people and systems in place to make it happen. We quickly scrambled a crack team of Order Management and EDI experts, both headquarters-based and regional, and working together they were able to load more than 14,000 purchase orders to our own system, run quality control checks, and start processing shipments within days.
As the impacted freight began moving through the pipeline, a number of our branch teams also stepped in to help manage the massive influx in volume and facilitate the import process, tracking each PO with its container until every last holiday shipment had arrived, cleared, and was delivered. Over a two-week period, we successfully handled more than 4,500 containers for the impacted customer.
Boots on the Ground doesn’t always require us to accomplish a 90-day job in just 90 hours. It means having confidence to know we can handle whatever our customers throw at us.

+6%+9%
+3%
+10%+3%
+11%
+10%
-2%
+14%-1%
+5%
+7%
+3%+5%
A I R F R E I G H T T O N N A G E
O C E A N C O N TA I N E R S
N E T R E V E N U E S
D I L U T E D E P S
1 4 1 5 1 6 1 7 1 4 1 5 1 6 1 7 1 4 1 5 1 6 1 7 1 41 3 1 3 1 3 1 3 1 5 1 6 1 7
+25%
+14%
2 0 1 7 H I G H L I G H T S


UNITED STATESSECURITIES AND EXCHANGE COMMISSION
Washington, D.C. 20549
FORM 10-K(Mark One)
ANNUAL REPORT PURSUANT TO SECTION 13 OR 15(d) OF THE SECURITIES EXCHANGE ACT OF 1934
For the fiscal year ended December 31, 2017 OR
TRANSITION REPORT PURSUANT TO SECTION 13 OR 15(d) OF THE SECURITIES EXCHANGE ACT OF 1934
For the transition period from to Commission File Number: 0-13468
EXPEDITORS INTERNATIONAL OF WASHINGTON, INC.(Exact name of registrant as specified in its charter)
Washington 91-1069248(State or other jurisdiction of
incorporation or organization)(I.R.S. Employer
Identification Number)
1015 Third Avenue, 12th Floor, Seattle, Washington 98104(Address of principal executive offices) (Zip Code)
(206) 674-3400(Registrant’s telephone number, including area code)
Securities registered pursuant to Section 12(b) of the Act:
Title of each class Name of each exchange on which registeredCommon Stock, par value $.01 per share NASDAQ Global Select Market
Securities registered pursuant to Section 12(g) of the Act: None
Indicate by check mark if the registrant is a well-known seasoned issuer, as defined in Rule 405 of the Securities Act. Yes No
Indicate by check mark if the registrant is not required to file reports pursuant to Section 13 or Section 15(d) of the Act. Yes No
Indicate by check mark whether the registrant (1) has filed all reports required to be filed by Section 13 or 15(d) of the Securities Exchange Act of 1934 during the preceding 12 months (or for such shorter period that the registrant was required to file such reports), and (2) has been subject to such filing requirements for the past 90 days. Yes No
Indicate by check mark whether the registrant has submitted electronically and posted on its corporate Web site, if any, every Interactive Data File required to be submitted and posted pursuant to Rule 405 of Regulation S-T (§232.405 of this chapter) during the preceding 12 months (or for such shorter period that the registrant was required to submit and post such files). Yes No
Indicate by check mark if disclosure of delinquent filers pursuant to Item 405 of Regulation S-K (§229.405 of this chapter) is not contained herein, and will not be contained, to the best of registrant’s knowledge, in definitive proxy or information statements incorporated by reference in Part III of this Form 10-K or any amendment to this Form 10-K.
Indicate by check mark whether the registrant is a large accelerated filer, an accelerated filer, a non-accelerated filer, a smaller reporting company, or emerging growth company. See the definitions of “large accelerated filer,” “accelerated filer,” “smaller reporting company,” and "emerging growth company" in Rule 12b-2 of the Exchange Act. (Check one):
Large accelerated filer Accelerated filer
Non-accelerated filer (Do not check if a smaller reporting company) Smaller reporting companyEmerging growth company
If an emerging growth company, indicate by check mark if the registrant has elected not to use the extended transition period forcomplying with any new or revised financial accounting standards provided pursuant to Section 13(a) of the Exchange Act.
Indicate by check mark whether the registrant is a shell company (as defined in Rule 12b-2 of the Act). Yes No
The aggregate market value of the registrant’s Common Stock held by non-affiliates of the registrant, based upon the closing price as of the last business day of the most recently completed second fiscal quarter ended June 30, 2017, was approximately $10,086,694,774.
At February 20, 2018, the number of shares outstanding of registrant’s Common Stock was 176,541,563.
DOCUMENTS INCORPORATED BY REFERENCEPortions of the definitive proxy statement for the Registrant’s 2018 Annual Meeting of Shareholders to be held on May 8, 2018 are
incorporated by reference into Part III of this Form 10-K.
1.
EXPEDITORS INTERNATIONAL OF WASHINGTON, INC.Form 10-K
For the Fiscal Year Ended December 31, 2017INDEX
Page
PART IItem 1 Business .............................................................................................................................................................
Item 1A Risk Factors .......................................................................................................................................................
Item 1B Unresolved Staff Comments ...............................................................................................................................
Item 2 Properties ...........................................................................................................................................................
Item 3 Legal Proceedings .............................................................................................................................................. 14
Item 4 Mine Safety Disclosures .....................................................................................................................................
PART IIItem 5 Market for Registrant's Common Equity, Related Stockholder Matters and Issuer Purchases of Equity Securities
Item 6 Selected Financial Data ......................................................................................................................................
Item 7 Management's Discussion and Analysis of Financial Condition and Results of Operations ...............................
Item 7A Quantitative and Qualitative Disclosures about Market Risk ..............................................................................
Item 8 Financial Statements and Supplementary Data ..................................................................................................
Item 9 Changes in and Disagreements with Accountants on Accounting and Financial Disclosure...............................
Item 9A Controls and Procedures ....................................................................................................................................
Item 9B Other Information ...............................................................................................................................................
PART IIIItem 10 Directors, Executive Officers and Corporate Governance ..................................................................................
Item 11 Executive Compensation ....................................................................................................................................
Item 12 Security Ownership of Certain Beneficial Owners and Management and Related Stockholder Matters .............
Item 13 Certain Relationships and Related Transactions and Director Independence ....................................................
Item 14 Principal Accounting Fees and Services .............................................................................................................
PART IVItem 15 Exhibits, Financial Statement Schedules ............................................................................................................
Item 16 Form 10-K Summary ..........................................................................................................................................
Signatures ..........................................................................................................................................................
2
11
14
14
15
15
17
18
28
29
29
29
30
30
30
31
31
31
31
34
35

2.
Forward-Looking Statements
In accordance with the provisions of the Private Securities Litigation Reform Act of 1995, the Company is making readers aware that forward-looking statements, because they relate to future events, are by their very nature subject to many important risk factors that could cause actual results to differ materially from those contained in the forward-looking statements. For additional information about forward-looking statements and for an identification of risk factors and their potential significance, see “Safe Harbor for Forward-Looking Statements Under Private Securities Litigation Reform Act of 1995; Certain Cautionary Statements” immediately preceding Part II, Item 7 “Management’s Discussion and Analysis of Financial Condition and Results of Operations” and Item 1A - "Risk Factors" in this report. Forward-looking statements speak only as of the date they were made. The Company undertakes no obligation to update these statements in light of subsequent events or developments.
PART I
ITEM 1—BUSINESS
Overview
Expeditors International of Washington, Inc. (herein referred to as "Expeditors,” the "Company," "we," "us," "our") provides a full suite of global logistics services, offering customers a seamless international network of people and integrated information systems to support the movement and strategic positioning of goods. As a third party logistics provider, we purchase cargo space from carriers (including airlines and ocean shipping lines) on a volume basis and resell that space to our customers. We do not compete for overnight courier or small parcel business and do not own aircraft or ships.
We provide a broad range of customer solutions, such as order management, time-definite transportation, warehousing and distribution, temperature-controlled transit, cargo insurance, specialized cargo monitoring and tracking, and other customized logistics solutions. In addition, our Project Cargo unit handles special project shipments that move via a single method or combination of air, ocean, and/or ground transportation and generally require a high level of specialized attention because of the unusual size or nature of what is being shipped.
Expeditors' primary services include:
• Airfreight Services
• Ocean Freight and Ocean Services
• Customs Brokerage and Other Services
Airfreight Services: Within airfreight, Expeditors typically acts either as a freight consolidator or as an agent for the airline that carries the shipment. Whether acting as a consolidator or agent, we offer our customers routing expertise, familiarity with local business practices, knowledge of export and import documentation and procedures, the ability to arrange for ancillary services and assistance with space availability in periods of high demand.
Solutions within Airfreight Services include:
Air Freight Consolidation: as an airfreight consolidator, Expeditors purchases cargo space from airlines on a volume basis and resells that space to our customers at lower rates than what those customers could negotiate directly from the airlines on an individual shipment. Expeditors determines the routing, consolidates shipments bound for a particular airport distribution point, and then selects the airline for transportation to the distribution point, where either we or one of our agents then arrange for the consolidated lot to be broken down into its component shipments and for the transportation of each individual shipment to its final destination.
Air Freight Forwarding: as a freight forwarder, Expeditors receives and forwards individual, unconsolidated shipments, and arranges the transportation with the airline that carries the shipment.
Ocean Freight and Ocean Services: Within ocean freight services, Expeditors offers three basic services: ocean freight consolidation, direct ocean forwarding, and order management:
Ocean Freight Consolidation: as an ocean freight consolidator, Expeditors contracts with ocean shipping carriers to obtain transportation for a fixed number of containers between various points during a specified time period at agreed-upon rates. We handle both full container loads as well as Less-than Container Load (LCL) freight, charging lower rates than what is available directly from the shipping lines. We also generate fees for ancillary services such as shipping and customs documentation, packing, crating, insurance services, negotiation of letters of credit, and the preparation of documentation to comply with local export laws.
Direct Ocean Forwarding: when a customer contracts directly with the ocean carrier, Expeditors acts as that customer’s agent and we may receive a commission from the carrier in addition to customer handling fees.
3.
Order Management: Expeditors provides a range of order management services, collecting fees from the shipper in addition to generating fees for meeting specific customer needs. Through Expeditors’ order management, we consolidate cargo from many suppliers in a particular origin into the fewest possible number of containers, putting more product in larger and fewer containers to maximize space and minimize cost.
Customs Brokerage and Other Services: Expeditors offers a range of custom solutions, including:
Customs Brokerage Services: Expeditors helps importers clear shipments through customs by preparing required documentation, calculating and paying duties and other taxes on behalf of the importer, arranging for any required inspections by governmental agencies, and arranging for local pickup, storage and delivery. Such services can include review of commercial documentation, assessment of information regarding value, country of origin, special trade programs, and classification. Customs reporting, discrepancy management and other visibility tools help our customers manage their compliance responsibilities globally.
Transcon: Expeditors Transcon consists of intra-continental ground transportation and delivery services and may be bundled together with domestic air. Transcon also includes value-added, white glove, and time-definite services.
Warehousing and Distribution Services: Expeditors’ distribution and warehousing services include distribution center management, inventory management, order fulfillment, returns programs, order level and other services.
Revenues and Net Revenues
The following charts show our 2017 revenues and net revenues (a non-GAAP measure calculated as revenues less directly related operating expenses*) by service type:
*See Management's Discussion and Analysis for a reconciliation of Net Revenues to Revenues.
The Expeditors Network
Beginning in 1981, Expeditors’ primary business focus was on airfreight shipments from Asia to the United States and related customs brokerage and other services. In the mid-1980’s, we began to expand our service capabilities in airfreight, ocean freight and distribution services. Today Expeditors has approximately 16,500 employees and provides a complete range of global logistics services to a diversified group of customers, both in terms of industry specialization and geographic location. As opportunities for profitable growth arise, we plan to create new offices. While Expeditors has historically expanded through organic growth, we have also been open to growth through acquisition of, or establishing joint ventures with existing agents or others within the industry.
At January 31, 2018, Expeditors, including its majority-owned subsidiaries, is organized functionally in geographic operating segments and operates district offices in the regions identified below. Our district offices have been established in locations where Expeditors maintains unilateral control over assets and operations and where the existence of the parent-subsidiary relationship is maintained by means other than record ownership of voting stock.

4.
Expeditors operates 177 district offices in the following geographic areas of responsibility:
• Americas (70)
• North Asia (21)
• South Asia (17)
• Europe (45)
• Middle East, Africa and India (24)
We also maintain branch offices, which are aligned with and dependent on one district office. Additionally, we contract with independent agents to provide required services and have established 39 such relationships worldwide.
For information concerning the amount of revenues, net revenues, operating income, identifiable assets, capital expenditures, depreciation and amortization and equity attributable to the geographic areas in which we conduct our business, see Note 10 to the consolidated financial statements.
Our Strategy
In 2017, Expeditors continued executing key strategic initiatives that are focused and aligned to achieve long-term earnings growth. The strategic plan is to grow business by focusing on the right markets and, within each market, on the right customers that lead to profitable business growth. Expeditors’ teams are aligned on the specific markets of its focused priorities; on the targeted accounts within those markets; and on ways that we can continue to differentiate ourselves from our competitors. We remain focused on growth based on four key strategic initiatives:
1. Ensure that every operating unit's base-line growth strategies for air, ocean and customs services grow at the rate of each unit's (i.e. district or region) relevant market growth rate, and Expeditors' Transcon and Distribution services are expected to maintain higher growth rates.
2. Align and integrate our European-Asian Pacific and European-North Americas interests to the same degree that our Asian Pacific and Americas interests have historically been aligned. This alignment is expected to result in additional growth in these markets beyond our base-line growth expectations.
3. Leverage our long and deeply entrenched presence in China - as well as the reputation that we have with the strategic carriers servicing China - to build a stronger import presence. Our main focus remains on developing and integrating our customs systems, expertise and talent, and making investments that enhance and improve our import infrastructure and our ability to provide local delivery and support services in China.
4. Expand market share growth and position in North America, traditionally Expeditors’ most strategic market.
In addition, in early 2017 we announced the appointment of Philip M. Coughlin to the newly created position of Chief Strategy Officer, reporting directly to President and Chief Executive Officer, Jeff Musser. Mr. Coughlin's role is to develop and oversee a core Strategy Group within Expeditors, comprised of current employees with a deep understanding of our products, services and technology, and external individuals with expertise in supply chain management, data and market analysis, and technology. While Mr. Coughlin's team is responsible for all strategy development, the team's focus is on exploring new avenues for innovation, differentiation and expansion.
Global Logistics and Supply Chain Technology
Expeditors has long believed that it is a competitive advantage to focus on organic growth and to utilize an enterprise technology platform designed and built by logistics technology professionals for logistics professionals. Our technology platform is built on principles of innovation, agility, collaboration, performance and consistency across the Expeditors global network to meet diverse and complex global logistics and supply chain needs. The platform is comprised of proprietary, third party and open source technologies. We utilize a globally consistent infrastructure supporting both centralized and distributed technology strategies that incorporate security, disaster recovery and high availability.
Expeditors’ technology platform is designed, coded, tested and implemented by the collaborative efforts of our logistics industry and information technology professionals. Internally developing, maintaining and enhancing technology capabilities is in keeping with Expeditors' long-held belief that it not outsource core functions, with information systems being one of those core functions.
We are not dependent on third parties for developing or enhancing our core technology platforms to address our needs or those of our customers. Expeditors also believes that having a single, uniform, globally-connected platform, driving logistics operations, and providing comprehensive visibility and advanced analytics create greater efficiency and value, particularly as the value of timely data and insights into that data are increasingly important.
5.
Organic Versus Acquired Growth
As a knowledge-based global provider of logistics services, we have often concluded over the course of our history that it is better to grow organically rather than by acquisition. When we have made acquisitions, it has generally been to obtain technology, geographic coverage and specialized industry expertise that could be leveraged to benefit our entire network. Nevertheless, despite our history of organic growth, we are not opposed to acquisitions and we will continue to identify and assess potential acquisitions.
Tailored Solutions and Targeted Marketing
As a non-asset based provider, we have considerable flexibility to tailor customer-specific solutions based on a customer’s needs. By understanding a customer's logistics processes and goals, we are able to identify opportunities for improvement, and are able to deploy relevant services and solutions for that customer. These services include all modes of cargo transportation, customs brokerage, warehousing and distribution, and order management. Expeditors' core services are further supported by our expertise in providing industry-specific solutions, supply chain analysis and optimization, cargo insurance, cargo security, and solutions for oversized and heavy lift freight. We offer these services across the globe on a single technology platform, in conjunction with consistent and efficient operations and processes that adhere to the highest standards of compliance.
Because Expeditors is in the business of optimizing customer logistics and supply chains, we focus our marketing strategy and efforts on professionals in logistics and supply chain management roles. While we drive our strategic marketing at a global level, district management of each office is responsible for its own business development, operations, and service execution. All employees are responsible for customer service and retention.
Leveraging Global, Regional and Local Expertise
Expeditors defines strategy, processes, technology and compliance at the corporate level, with input from our regional and district leadership. That is further supported and executed at all levels with dedicated account management personnel, coupled with regional and local expertise. We staff our districts principally with managers and other key personnel who are citizens of the nations in which they operate and who have extensive experience in global logistics. District managers and their staff are responsible for selling Expeditors' services directly to customers and prospects who may select or influence the selection of logistics service providers and for ensuring that customers receive timely and efficient services. We believe that this regional and local expertise in supply chain solutions, tailored to the needs of our customers, and our emphasis on exceptional customer service, along with our incentive-based compensation program that rewards employees based on the performance of the operations they control, have been important elements of our success. We believe this balanced approach between corporate, regional, and local expertise enables us to provide solutions customized to the needs of our customers.
What Expeditors Ships
The goods that Expeditors handles are generally a function of the products that dominate international trade between any particular origin and destination. These goods include products from multiple industries, including electronics, high technology, healthcare, aerospace and aviation, manufacturing, oil and energy, automotive, retail and fashion. In order to meet customers' complex and industry specific demands, we utilize industry vertical teams throughout our network to focus on providing solutions in different industries. Industry vertical teams work closely with our regional and district resources to grow our business. No single customer accounts for five percent or more of our net revenues.
Expeditors' Services in Detail
The following describes in more detail the operations of each of Expeditors’ services:
Airfreight Services
Airfreight services accounted for approximately 42, 40 and 41 percent of Expeditors' total revenues and 32, 32 and 34 percent of total net revenues in 2017, 2016 and 2015, respectively. When performing airfreight services, we typically act either as a freight consolidator or as an agent for the airline that carries the shipment. When acting as a freight consolidator, we purchase cargo space from airlines on a volume basis and resell that space to our customers at lower rates than they could obtain directly from airlines on an individual shipment. We then issue a House Airway Bill (HAWB) to our customers as the contract of carriage and, separately, we receive a Master Airway Bill from the airline when the freight is physically tendered. When moving shipments between points where the nature or volume of business does not facilitate consolidation, we receive and forward individual shipments as the agent of the airline that carries the shipment. Whether acting as a consolidator or agent, we offer our customers expertise for optimum routing, familiarity with local business practices, knowledge of export and import documentation and procedures, the ability to arrange for ancillary services, and assistance with space availability in periods of high demand.
In our airfreight operations, we receive shipments from our customers, determine the routing, consolidate shipments bound for a particular airport distribution point, and select the airline for transportation to the distribution point. At the distribution point, either we or an Expeditors' agent arranges for the consolidated lot to be broken down into its component shipments and for the transportation of the individual shipments to their final destinations.

6.
We estimate that our average airfreight consolidation weighs approximately 3,000 pounds and that a typical consolidation includes merchandise from several shippers. Because shipment by air is relatively expensive compared with ocean transportation, air shipments are generally characterized by a high value-to-weight ratio, the need for rapid delivery, or both.
At the origin, Expeditors typically delivers shipments from one of our warehouses to the airline after consolidating the freight into containers or onto pallets. Normally that shipment will then arrive at the destination distribution point within 48 hours from the point of origin. During periods of high demand, cargo space available from the scheduled air carriers can be limited and backlogs of freight shipments may occur. When these conditions exist, we may charter aircraft to meet customer demand.
Expeditors consolidates individual shipments based on weight and volume characteristics in cost-effective combinations. Typically, as the weight or volume of a shipment increases, the cost that we charge per pound/kilo or cubic inch/centimeter decreases. The rates charged by airlines also generally decrease as the weight or volume of the shipment increases. As a result, by aggregating shipments and presenting them to an airline as a single shipment, we are able to obtain a lower rate per pound/kilo or cubic inch/centimeter than what is charged for an individual shipment, while generally offering the customer a lower rate than could be obtained from the airline for an unconsolidated shipment.
Our airfreight net revenues for a consolidated shipment include the differential between the rate that the airline charges Expeditors and the rate that we, in turn, charge our customers, in addition to commissions that the airline pays us and fees that we charge our customers for ancillary services. Such ancillary services we provide include preparation of shipping and customs documentation, packing, crating, insurance services, negotiation of letters of credit, and the preparation of documentation to comply with local export laws.
Expeditors' management believes that owning aircraft would subject us to undue business risks, including large capital outlays, increased fixed operating expenses, volatile fuel prices, problems of fully utilizing aircraft and competition with our service providers - the airlines. Because we rely on commercial airlines to transport our shipments, our business may be adversely affected by changes in carrier financial stability, policies and practices such as pricing, payment terms, scheduling, capacity and frequency of service.
Although airline profitability has improved, many air carriers remain highly leveraged with debt. Carriers' financial results will continue to drive their asset acquisition and deployment strategies, which will impact airfreight pricing and capacity. Many of Expeditors' customers are focused on improving supply-chain efficiency, reducing overall logistics costs by negotiating lower rates and utilizing ocean freight whenever possible. Certain customers are increasingly utilizing airfreight to improve speed to market. We expect these trends to continue in conjunction with carriers' efforts to manage available capacity and the evolution of consumer purchasing behavior, such as online shopping. Changes in available capacity, periods of high demand, or other market disruptions could impact our buy and sell rates and challenge our ability to maintain historical unitary profitability.
Ocean Freight and Ocean Services
Ocean freight services accounted for approximately 30, 32 and 33 percent of Expeditors' total revenues and 24, 25 and 25 percent of total net revenues in 2017, 2016 and 2015, respectively. We operate Expeditors International Ocean, Inc. (EIO), an Ocean Transportation Intermediary, sometimes referred to as a Non-Vessel Operating Common Carrier (NVOCC), which specializes in ocean freight services in most major trade lanes in the world. EIO also provides service, on a smaller scale, to and from any location where we have an office or an agent. Ocean freight services are comprised of three basic services: ocean freight consolidation (EIO), direct ocean forwarding and order management.
Ocean freight consolidation: As an NVOCC, EIO contracts with ocean shipping lines to obtain transportation for a fixed number of containers between various points during a specified time period at an agreed rate. EIO provides full container load services to companies that need flexibility and access to vessel capacity that they may not necessarily achieve by dealing directly with the shipping lines. Additionally, EIO supports customers that prefer to supplement their carrier strategy with an NVOCC. EIO also leverages the Expeditors global gateway network for the movement of LCL freight for customers needing to ship smaller consignments via ocean. EIO issues a House Ocean Bill of Lading (HOBL) or a House Seaway Bill to customers as the contract of carriage and receives a separate Master Ocean Bill of Lading (MOBL) when freight is physically tendered. Revenues from fees charged to customers for ancillary services that EIO may provide include the preparation of shipping and customs documentation, packing, crating, insurance services, negotiation of letters of credit, and the preparation of documentation to comply with local export laws.
Direct ocean forwarding: When the customer contracts directly with the ocean carrier, EIO acts as an agent of the customer and derives its revenues from commissions paid by the ocean carrier and handling fees paid by the customer. In such arrangements, EIO does not issue a HOBL or House Seaway Bill. Rather, the carrier issues a MOBL directly to the customer who employs EIO to create documentation, manage shipment information and arrange various services to facilitate the shipment of goods. The MOBL shows the customer as the shipper.
Order management: Order management provides services that manage origin consolidation, supplier performance, carrier allocation, carrier performance, container management, document management, destination management and PO/SKU visibility through a web-based application. Customers have the ability to monitor and report against near real-time status of purchase orders from the date of creation through final delivery. Item quantities, required ship dates, commodity descriptions, estimated vs. actual ex-factory dates, container utilization, and document visibility are many of the managed functions that are visible and reportable via the web. Order management is available for various modes of transportation, including ocean, air, truck and rail. Order management revenues are derived from services provided to the shipper, as well as management fees associated with managing purchase order execution against customer specific rules. One basic function of order management involves arranging cargo from many suppliers in a particular origin and “consolidating” these shipments into the fewest possible number of containers to maximize
7.
space utilization and minimize cost. Through origin consolidation, customers can reduce the number of containers shipped by putting more product in larger and fewer containers.
Ocean carriers have incurred substantial operating losses in recent years, and many are highly leveraged with debt. These financial challenges have resulted in the 2016 bankruptcy of a major carrier, as well as multiple carrier acquisitions and carrier alliance formations, as the carriers pursue scale and market share in an effort to reduce operating costs and regain their financial footing. Additionally, while the overall global volumes have increased slightly over recent years, many carriers continue to take delivery of new and larger ships, which has created excess capacity. This excess capacity is at the heart of the carriers' financial challenge as they pursue business at lower rate levels to achieve higher load factors. Consequently, when the market goes through seasonal peaks or any sort of disruption and demand exceeds supply, the carriers react by increasing their pricing as quickly as possible to offset their previous losses. This carrier behavior, along with fluctuations in demand, creates pricing volatility that could impact Expeditors' ability to maintain historical unitary profitability.
Customs Brokerage and Other Services
Customs brokerage and other services accounted for approximately 28, 28 and 26 percent of Expeditors' total revenues and 44, 43 and 41 percent of total net revenues in 2017, 2016 and 2015, respectively. As a customs broker, we assist in clearing shipments through customs by preparing and transmitting required information and documentation, calculating and providing for payment of duties and other taxes on behalf of the importer, arranging required inspections by governmental agencies, and providing delivery services. We provide customs brokerage services in conjunction with transportation services or independently. Expeditors supports regulatory compliance and visibility to the supply chain through process and system controls, technology and oversight by licensed and trained professionals.
We also provide other value added services at destination, such as warehousing and distribution, Transcon and consulting services, none of which, individually, are currently significant to our total revenues and net revenues. Expeditors' distribution and warehousing services include distribution center management, inventory management, order fulfillment, returns programs and order level services. Transcon is a multi-modal product, which offers time-definite, intra-continental transportation solutions, often by ground and other specialty handling services. Expeditors responds to customer driven-requests for trade compliance consulting services, primarily through Tradewin. Fees for these non-transactional services are based upon hourly billing rates and bids for mutually agreed projects.
Competition
The global logistics services industry is intensely competitive and is expected to remain so for the foreseeable future. There are a large number of companies competing in one or more segments of the industry, but the number of firms with a global network that offer a full complement of logistics services is more limited. Further, there are new technology-based competitors entering the industry. Some of our competitors have significantly more resources than Expeditors. Depending on the location of the shipper and the importer, Expeditors must compete against both the niche players and larger entities. The industry continues to experience consolidations into larger firms striving for stronger and more complete multinational and multi-service networks. However, regional and local competitors still maintain a strong market presence in certain areas.
The primary competitive factors in the global logistics services industry continue to be price and quality of service, including reliability, responsiveness, expertise, convenience, and scope of operations. Expeditors emphasizes quality customer service and believes that our prices are competitive with the prices of others in the industry.
Larger customers utilize the services of multiple logistics providers and implement more sophisticated and efficient procedures for the management of their logistics supply chains by embracing strategies such as just-in-time delivery, network optimization, transportation flow optimization, and process improvement. Accordingly, timely and accurate information integrated into customer service capabilities are a significant factor in attracting and retaining customers. This information integrated into customer service capabilities includes customized Electronic Data Interchange (EDI), online freight tracing and tracking applications, customized reporting, data analytics, and solution modeling/simulation/optimization.
Expeditors' management believes that the ability to develop and deliver innovative solutions to meet our customers’ increasingly sophisticated information requirements is a critical factor in our ongoing success. We devote a significant amount of resources towards the maintenance and enhancement of systems in order to meet these customer demands. Management believes that our existing systems are competitive with the systems currently in use by other logistics services companies with which we compete.
Unlike many of our competitors, who have tended to grow by merger and acquisition, Expeditors operates the same transportation and accounting computer software, running on a common hardware platform, in all of our full-service locations. Small and middle-tier competitors, in general, do not have the resources available to develop these customized systems. Historically, growth through aggressive acquisition has proven to be a challenge for many of our competitors and typically involves the purchase of significant “goodwill.” As a result, Expeditors has pursued a strategy emphasizing organic growth supplemented by certain strategic acquisitions.
Our ability to attract, retain, and motivate highly qualified personnel with experience in global logistics services is an essential, if not the most important, element of Expeditors' ability to compete in the industry. To this end, we have adopted incentive compensation programs that make percentages of an operating unit's net revenues or profits available to managers for distribution among key personnel. We believe that these incentive compensation programs, combined with our experienced personnel and our ability to coordinate global marketing and business development efforts, provide a distinct competitive advantage.

8.
Currency and Dependence on Service Providers
Our worldwide operations require that we transact in a multitude of currencies other than the U.S. dollar. That exposes us to the inherent risks of volatile international currency markets and governmental interference. Some of the countries where we maintain offices and/or have agency relationships maintain strict currency control regulations that influence our ability to hedge foreign currency exposure. We try to compensate for these exposures by accelerating international currency settlements among our offices or agents.
In addition, our ability to provide services to our customers is highly dependent on good working relationships with a variety of entities, including airlines, ocean carrier lines, ground transportation providers and governmental agencies. We use a consistent approach in selecting and managing service providers across all of our product offerings, beginning with a rigorous qualification and risk-based diligence process. We select and engage with best-in-class, compliance-focused, efficiently run, growth-oriented partners, based upon defined value elements and are intentional in our relationship and performance management activity, reinforcing success by awarding service providers who consistently achieve at the highest levels with additional business. We consider our current working relationships with these entities to be satisfactory. However, changes in the financial stability and operating capabilities and capacity of asset-based carriers, space allotments available from carriers, governmental regulation or deregulation efforts, modernization of the regulations governing customs brokerage, and/or changes in governmental restrictions, quota restrictions or trade accords could affect our business in unpredictable ways.
Seasonality
Historically, our operating results have been subject to seasonal demand trends, with the first quarter being the weakest and the third and fourth quarters being the strongest; however, there is no assurance that this seasonal trend will occur in the future. This pattern has been the result of, or influenced by, numerous factors, including weather patterns, national holidays, consumer demand, new product launches, economic conditions and a myriad of other similar and subtle forces. We cannot accurately forecast many of these factors, nor can we estimate accurately the relative influence of any particular factor and, as a result, there can be no assurance that historical patterns will continue in future periods.
Environmental
In the United States, we are subject to Federal, state and local provisions regulating the discharge of materials and emissions into the environment or otherwise for the protection of the environment. Similar laws apply in many other jurisdictions in which we operate. Although current operations have not been significantly affected by compliance with these environmental laws, governments, service providers and customers are becoming increasingly sensitive to environmental issues, and we cannot predict what impact future environmental regulations may have on our business. We do not anticipate making any material capital expenditures for environmental control purposes during 2018.
Expeditors is committed to continual improvement in reducing the sum total impact of our operations on the environment. We have over 200 employee-led Green Teams, which cover each of our local district offices and are responsible for projects focused on reducing Expeditors' Scope 1 and Scope 2 emissions (as defined by the Greenhouse Gas Protocol, Scope 1 emissions include all direct greenhouse gas emissions; Scope 2 includes indirect greenhouse gas emission from purchased electricity, heat or steam). We have voluntarily disclosed our Scope 1 and Scope 2 emissions data to CDP since 2010, and we are currently a member of both SmartWay and Transporte Limpio in North America. SmartWay is a voluntary public-private program sponsored by the EPA for tracking, documenting and sharing information about fuel use and freight emissions across supply chains. Transporte Limpio is a similar, voluntary program sponsored by the Mexican government.
Employees
At December 31, 2017, Expeditors employed approximately 16,500 people, of which approximately 10,500 were employed in international locations.
Expeditors is a party to collective bargaining agreements with a limited number of employees outside the U.S., and we do not consider these agreements to be material. We consider our employee relations to be satisfactory.
In order to retain the services of highly qualified, experienced, and motivated employees, Expeditors places considerable emphasis on our non-equity incentive compensation programs.
Other Information
Expeditors International of Washington, Inc. was incorporated in the State of Washington in May 1979. Our executive offices are located at 1015 Third Avenue, Seattle, Washington, and our telephone number is (206) 674-3400.
Our Internet address is http://www.expeditors.com. We make available free of charge through our Internet website Expeditors' annual report on Form 10-K, quarterly reports on Form 10-Q, current reports on Form 8-K, and all amendments to those reports as soon as reasonably practicable after such material is electronically filed with or furnished to the Securities and Exchange Commission (SEC). The information contained on or accessible through Expeditors' website is not a part of this Annual Report on Form 10-K.
9.
Executive Officers of the Registrant
The following table sets forth the names, ages, and positions of current executive officers of our company.
Name Age PositionJeffrey S. Musser.............. 52 President, Chief Executive Officer and DirectorEugene K. Alger................ 57 President, Global ServicesDaniel R. Wall ................... 49 President, Global ProductsRichard H. Rostan ............ 61 President, Global Geographies and OperationsPhilip M. Coughlin............. 57 Senior Vice President and Chief Strategy OfficerBradley S. Powell ............. 57 Senior Vice President and Chief Financial OfficerChristopher J. McClincy.... 43 Senior Vice President and Chief Information OfficerBenjamin G. Clark ............ 49 Senior Vice President, General Counsel and Corporate Secretary
Jeffrey S. Musser joined Expeditors in February 1983 and was promoted to District Manager in October 1989. Mr. Musser was elected to Regional Vice President in September 1999, Senior Vice President - Chief Information Officer in January 2005 and to Executive Vice President and Chief Information Officer in May 2009. On December 19, 2013, Mr. Musser was appointed as President and Chief Executive Officer and was elected by the Board of Directors as a director, effective March 1, 2014.
Eugene K. Alger joined Expeditors in October 1981 and was promoted to District Manager in May 1982. Mr. Alger was elected Regional Vice President in January 1992, Senior Vice President of North America in September 1999 and Executive Vice President - North America in March 2008. In June 2014, Mr. Alger was promoted to Executive Vice President - Global Services. In August 2015, Mr. Alger was promoted to President, Global Services.
Daniel R. Wall joined Expeditors in March 1987 and was promoted to District Manager in May 1992 and Global Director-Account Management in March 2002. Mr. Wall was elected Vice President - ECMS in January 2004 and Senior Vice President - Ocean Services in September 2004. In June 2015, Mr. Wall was appointed as President, Global Products.
Richard H. Rostan joined Expeditors in August 1985 and was promoted to District Manager in March 1987, Regional Vice President in January 1993, Senior Vice President of Global Distribution in July 2012 and Senior Vice President, Americas in January 2015. Mr. Rostan was promoted to Executive Vice President, Americas in July 2015. Mr. Rostan was promoted to President of Global Geographies and Operations, effective February 28, 2017.
Philip M. Coughlin joined Expeditors in October 1985 and was promoted to District Manager in August 1986. Mr. Coughlin was elected Regional Manager in January 1991, Regional Vice President in January 1992, Senior Vice President of North America in September 1999 and Executive Vice President - North America in March 2008. In June 2014, Mr. Coughlin was promoted to President, Global Geographies and Operations. Mr. Coughlin was appointed Senior Vice President and Chief Strategy Officer, a newly created position, effective February 28, 2017.
Bradley S. Powell joined Expeditors as Chief Financial Officer in October 2008 and was elected Senior Vice President and Chief Financial Officer in February 2012. Prior to joining Expeditors, Mr. Powell served as President and Chief Financial Officer of Eden Bioscience Corporation, a publicly-traded biotechnology company, from December 2006 to September 2008 and as Vice President and Chief Financial Officer from July 1998 to December 2006.
Christopher J. McClincy joined Expeditors in July 1998 and was promoted to Vice President - Information Services in April 2009. In February 2014, Mr. McClincy was promoted to Senior Vice President and Chief Information Officer.
Benjamin G. Clark joined Expeditors in February 2015 as Senior Vice President and General Counsel and was appointed Corporate Secretary in May 2015. Preceding Expeditors, Mr. Clark served as Executive Vice President and General Counsel of the Dematic Group, a global provider of intelligent intralogistics and materials handling solutions. Prior to his experience with Dematic, Mr. Clark spent four years as the Vice President and Deputy General Counsel for the publicly traded Celanese Corporation, a global technologies and specialty materials company. From 2002 to 2009 Mr. Clark worked for Honeywell International, Inc., where he held progressively responsible roles concluding as the Vice President and General Counsel, Aerospace Global Operations.
Regulation and Security
With respect to activities in the air transportation industry in the United States, Expeditors is subject to regulation by the Transportation Security Administration (TSA) of the Department of Homeland Security (DHS) as an indirect air carrier. All United States indirect air carriers are required to maintain prescribed security procedures and are subject to periodic audits by TSA. Our overseas offices and agents are licensed as airfreight forwarders in their respective countries of operation. Each Expeditors office is licensed, or, in the case of our newer offices, we have applied for a license as an airfreight forwarder from the International Air Transport Association (IATA), a voluntary association of airlines and air transport related entities that prescribes certain operating procedures for airfreight forwarders acting as agents for its members. The majority of our airfreight forwarding business is conducted with airlines that are IATA members.

10.
Expeditors is licensed as an Ocean Transportation Intermediary (OTI) (sometimes referred to as an NVOCC) by the Federal Maritime Commission (FMC). The FMC has established certain qualifications for shipping agents, including certain surety bonding requirements. The FMC is also responsible for the economic regulation of OTI/NVOCC activity originating or terminating in the United States. To comply with these economic regulations, vessel operators and NVOCCs, such as EIO, are required to file tariffs electronically, establishing the rates to be charged for the movement of specified commodities into and out of the United States. The FMC has the power to enforce these regulations by assessing penalties.
Expeditors is licensed as a customs broker by the Customs and Border Protection (CBP) agency of DHS, nationally and in each U.S. customs district in which we do business. All United States customs brokers are required to maintain prescribed records and are subject to periodic audits by CBP. In other jurisdictions in which Expeditors performs customs clearance services, we are licensed by the appropriate governmental authority where such license is required to perform these services. Expeditors participates in various governmental supply chain security programs, such as the Customs-Trade Partnership Against Terrorism (C-TPAT) in the United States, as well as other security initiatives, such as Authorized Economic Operator (AEO) programs, in various other countries.
We do not believe that current United States and foreign governmental regulations impose significant economic restraint upon our business operations. In general, Expeditors conducts business activities in each country through a wholly or majority-owned subsidiary corporation that is organized and existing under the laws of that country. However, the regulations of foreign governments can impose barriers to our ability to provide the full range of our business activities in a wholly or majority United States-owned subsidiary. For example, foreign ownership of a customs brokerage business is prohibited in some jurisdictions and, less frequently, the ownership of the licenses required for freight forwarding and/or freight consolidation is restricted to local entities. When we encounter this sort of governmental restriction, we work to establish a legal structure that meets the requirements of the local regulations, while also providing the substantive operating and economic advantages that would be available in the absence of such regulation. This can be accomplished by creating a joint venture or exclusive agency relationship with a qualified local entity that holds the required license.
The continuing global threats from terrorism and wars, and governments’ overriding concern for the safety of passengers and citizens who import and/or export goods into and out of their respective countries, have resulted in a proliferation of cargo security and other regulations over the past several years. Many of these regulations are complex and require varying degrees of interpretation. While these regulations have already created a marked difference in the security and other arrangements required to move shipments around the globe, regulations are expected to become more stringent in the future. As governments look for ways to minimize the exposure of their citizens to potential terror-related incidents, we and our competitors in the transportation business may be required to incorporate security and other procedures within our respective scope of services to a far greater degree than has been required in the past. We believe that increased security and other requirements may involve further investments in technology and more sophisticated screening procedures being applied to cargo, customers, vendors and employees. Expeditors' position is that any increased cost of compliance with security regulations will be passed through to those who are beneficiaries of our services.
Cargo Liability
When acting as an airfreight consolidator, Expeditors assumes a carrier’s liability for lost or damaged shipments. This legal liability is typically limited by contract to the lower of the value of the goods or the released value (19 Special Drawing Rights per kilo unless the customer declares a higher value and pays a surcharge), except in the absence of an appropriate airway bill. The airline that we utilize to make the actual shipment is generally liable to us in the same manner and to the same extent. Generally, when acting solely as the agent of the shipper, we do not assume any contractual liability for loss or damage to shipments tendered to the carrier.
When acting as an ocean freight consolidator, Expeditors assumes a carrier’s liability for lost or damaged shipments. This liability is typically limited by contract to the lower of the value of the goods or the released value ($500 per package or customary freight unit unless the customer declares a higher value and pays a surcharge). The ocean carrier that we utilize to make the actual shipment is generally liable to us in the same manner and to the same extent. We do not assume liability for lost or damaged shipments in our ocean freight forwarding and customs clearance operations.
When providing ground transportation services as a carrier, Expeditors assumes a carrier’s liability for lost or damaged shipments. This liability is typically limited by contract to the lower of the value of the goods or the released value (generally $0.50 per pound, although the released value can vary from country to country) unless the customer declares a higher value and pays a surcharge. The ground carrier that we utilize to make the actual shipment is generally liable to us in the same manner and to the same extent.
When providing warehousing and distribution services, our legal liability is limited by contract and tariff to an amount generally equal to the lower of the value of the goods or $0.50 per pound with a maximum of $50 per “lot” — which is defined as the smallest unit that the warehouse is required to track.
In certain circumstances, Expeditors will assume additional limited liability. We maintain cargo legal liability insurance covering claims for losses attributable to missing or damaged shipments for which we are legally liable. Expeditors also maintains insurance coverage for the property of others that is stored in our warehouse facilities. This insurance coverage is provided by a Vermont, U.S.-based insurance entity wholly-owned by Expeditors. The coverage is fronted and re-insured by a global insurance company. The total risk retained by Expeditors in 2017 was $5 million. In addition, we are licensed as an insurance broker through our subsidiary, Expeditors Cargo Insurance Brokers, Inc., and place insurance coverage for other customers.
11.
ITEM 1A – RISK FACTORS
RISK FACTORS DISCUSSION AND POTENTIAL SIGNIFICANCE
International Trade ..............
Expeditors primarily provides services to customers engaged in international commerce. Everything that affects international trade has the potential to expand or contract our primary market and adversely impact our operating results. For example, international trade is influenced by:
• currency exchange rates and currency control regulations;
• interest rate fluctuations;
• changes and uncertainties in governmental policies, such as taxation, quota restrictions, other forms of
trade barriers and/or restrictions and trade accords; • changes in and application of international and domestic customs, trade and security regulations;
• wars, strikes, civil unrest, acts of terrorism, and other conflicts; • changes in labor and other costs;
• natural disasters and pandemics;
• changes in consumer attitudes regarding goods made in countries other than their own;
• changes in availability of credit;
• changes in the price and readily available quantities of oil and other petroleum-related products; and
• increased global concerns regarding working conditions and environmental sustainability.
Service Providers................
As a non-asset based provider of global logistics services, Expeditors depends on a variety of asset-based service providers, including air, ocean and ground freight carriers. The quality and profitability of our services depend upon effective selection, management and discipline of service providers. In recent years, many of our service providers have incurred significant operating losses and are highly leveraged with debt. Additionally, several ocean carriers have consolidated, with the potential for more to occur in the future. Changes in the financial stability, operating capabilities and capacity of asset-based carriers and space allotment made available to Expeditors by asset-based carriers could affect us in unpredictable ways. Any combination of reduced carrier capacity, pricing volatility or more limited carrier transportation schedules could negatively impact our ability to maintain historical profitability.
Expeditors' carriers are subject to increasingly stringent laws, which could directly or indirectly have a material adverse effect on our business. Future regulatory developments in the U.S. and abroad could adversely affect operations and increase operating costs in transportation industries, which in turn could increase our purchased transportation costs. If we are unable to pass such costs on to our customers, our business and results of operations could be materially adversely affected.
Key Personnel ....................
Identifying, training and retaining key employees is essential to continued growth and future profitability. Effective succession planning is an important element of our programs. Failure to ensure an effective transfer of knowledge and smooth transitions involving key employees could hinder our ability to execute on our business strategies and level of service. The loss of the services of one or more key personnel could have an adverse effect on our business. We must continue to develop and retain management personnel to address issues of succession planning. We believe that our compensation programs, which have been in place since we became a publicly traded entity, are among the unique characteristics responsible for differentiating our performance from that of many of our competitors. Significant changes to compensation programs could affect our performance and ability to attract and retain key personnel.
Technology..........................
Expeditors relies heavily and must compete based upon the flexibility and sophistication of the technologies utilized in performing our core businesses. Future results depend on our success in developing competitive and reliable systems to address the needs of our customers and suppliers. Development and maintenance of these systems must be accomplished in a cost-effective manner and support the use of secure protocols, including integration and availability of third party technology. We are continually enhancing our systems, including significant upgrades to core operating and accounting systems. These efforts are inherently complex and if not managed properly could lead to disruptions in our operations or our ability to remain competitive.

12.
RISK FACTORS DISCUSSION AND POTENTIAL SIGNIFICANCE
Network Continuity andCybersecurity ......................
As Expeditors, our customers and suppliers continue to increase reliance on systems, and as additional features are added, the risks also increase. Any significant disruptions to our global systems or the Internet for any reason, which could include equipment or network failures; co-location facility failures; power outages; sabotage; employee error or other actions; cyber-attacks or other security breaches; reliance on third party technology; geo-political activity or natural disasters; all of which could have a material negative effect on our results. This could include loss of revenue; business disruptions (such as the inability to timely process shipments); loss of property, including trade secrets and confidential information; legal claims and proceedings; reporting delays or errors; interference with regulatory reporting; significant remediation costs; an increase in costs to protect our systems and technology; or damage to our reputation.
Foreign Operations .............
The majority of Expeditors' revenues and operating income comes from operations conducted outside the United States. To maintain a global service network, we may be required to operate in hostile locations and in dangerous situations. Doing business in foreign locations also subjects us to a variety of risks and considerations not normally encountered by domestic enterprises. In addition, we operate in parts of the world where common business practices could constitute violations of the anti-corruption laws, rules, regulations and decrees of the United States and of other countries in which we conduct business, including the U.S. Foreign Corrupt Practices Act and the UK Bribery Act; as well as trade and exchange control laws, or laws, regulations and Executive Orders imposing embargoes and sanctions; and anti-boycott laws and regulations. Compliance with these laws, rules, regulations and decrees is dependent on our employees, service providers, agents, third party brokers and customers, whose individual actions could violate these laws, rules, regulations and decrees. Failure to comply could result in substantial penalties and additional expenses, damage to our reputation and restrictions on our ability to conduct business.
Growth ................................
Expeditors has historically relied primarily upon organic growth and has tended to avoid growth through acquisition. Future results will depend upon our ability to anticipate and adapt to constantly evolving supply chain requirements and innovations. To continue to grow organically, we must gain profitable market share in a highly competitive environment and successfully develop and market new service offerings. When investment opportunities arise, our success could be dependent on our ability to evaluate and integrate acquisitions.
Regulatory Environment .....
Expeditors is affected by ever increasing regulations from a number of sources in the United States and in foreign locations in which we operate. Many of these regulations are complex and require varying degrees of interpretation, including those related to trade compliance, data privacy, employment, compensation and competition, and may result in unforeseen costs. In reaction to the continuing global terrorist threat, governments around the world are continuously enacting or updating security regulations. These regulations are multi-layered, increasingly technical in nature and characterized by a lack of harmonization of substantive requirements among various governmental authorities. Furthermore, the implementation of these regulations, including deadlines and substantive requirements, can be driven by regulatory urgencies rather than industry's realistic ability to comply.
Failure to consistently and timely comply with these regulations, or the failure, breach or compromise of our policies and procedures or those of our service providers or agents, may result in increased operating costs, damage to our reputation, restrictions on operations or fines and penalties.
Competition.........................
The global logistics services industry is intensely competitive and is expected to remain so for the foreseeable future. There are a large number of companies competing in one or more segments of the industry, but the number of firms with a global network that offer a full complement of logistics services is more limited. Nevertheless, many of these competitors have significantly more resources than Expeditors, and are actively pursuing acquisition opportunities and are developing new technologies to gain competitive advantages. Depending on the location of the shipper and the importer, we must compete against both the niche players, larger entities including carriers, and emerging technology companies. The primary competitive factors are price and quality of service. Many larger customers utilize the services of multiple logistics providers. Customers regularly solicit bids from competitors in order to improve service and to secure favorable pricing and contractual terms such as longer payment terms, fixed-price arrangements, higher or unlimited liability limits and performance penalties. Increased competition and competitors' acceptance of expanded contractual terms could result in reduced revenues, reduced margins, higher operating costs or loss of market share, any of which would damage our results of operations, cash flows and financial condition.
13.
RISK FACTORS DISCUSSION AND POTENTIAL SIGNIFICANCE
Taxes ..................................
Expeditors is subject to many taxes in the United States and foreign jurisdictions. In many of these jurisdictions, the tax laws are very complex and are open to different interpretations and application. Tax authorities frequently implement new taxes and change their tax rates and rules, including interpretations of those rules. In December 2017, the United States made significant changes to its tax laws, which added complexity and uncertainty in calculating corporate tax liabilities. We are regularly under audit by tax authorities, including transfer pricing inquiries. Although we believe our tax estimates are reasonable, the final determination of tax audits, including any potential penalties and interest, could be materially different from our tax provisions and accruals and negatively impact our financial results.
Litigation/Investigations.......
As a multinational corporation, Expeditors is subject to formal or informal investigations from governmental authorities or others in the countries in which we do business. In addition, we may become subject to civil litigation with our customers, service providers and other parties with whom we do business. These investigations and litigation may require significant management time and could cause us to incur substantial additional legal and related costs, which may include fines, penalties or damages that could have a materially adverse impact on our financial results.
Economic Conditions ..........
The global economy and capital and credit markets continue to experience uncertainty and volatility. Unfavorable changes in economic conditions may result in lower freight volumes and adversely affect Expeditors' revenues and operating results, as experienced in 2009 and 2012. These conditions may adversely affect certain of our customers and service providers. Were that to occur, our revenues and net earnings could also be adversely affected. Should our customers’ ability to pay deteriorate, additional bad debts may be incurred.
Predictability of Results.......
Expeditors is not aware of any accurate means of forecasting short-term customer requirements. However, long-term customer satisfaction depends upon our ability to meet these unpredictable short-term customer requirements. Personnel costs, our single largest expense, are always less flexible in the very near term as we must staff to meet uncertain demand. As a result, short-term operating results could be disproportionately affected. A significant portion of Expeditors' revenues is derived from customers in retail and technology industries whose shipping patterns are tied closely to consumer demand and from customers in industries whose shipping patterns are dependent upon just-in-time production schedules. Therefore, the timing of our revenues are, to a large degree, impacted by factors out of our control, such as a sudden change in consumer demand for retail goods, product launches and/or manufacturing production delays. Additionally, many customers ship a significant portion of their goods at or near the end of a quarter, and therefore, we may not learn of a shortfall in revenues until late in a quarter. To the extent that a shortfall in revenues or earnings was not expected by securities analysts or investors, any such shortfall from levels predicted by securities analysts or investors could have an immediate and adverse effect on the trading price of our stock.
Volatile market conditions can create situations where rate increases charged by carriers and other service providers are implemented with little or no advance notice. We often times cannot pass these rate increases on to our customers in the same time frame, if at all. As a result, our yields and margins can be negatively impacted, as recently experienced, particularly with ocean freight.
Catastrophic Events............
A disruption or failure of Expeditors' systems or operations in the event of a major earthquake, weather event, cyber-attack, terrorist attack, strike, civil unrest, pandemic or other catastrophic event could cause delays in providing services or performing other mission-critical functions. Our corporate headquarters and certain other critical business operations are in the Seattle, Washington area, which is near major earthquake faults. A catastrophic event that results in the destruction or disruption of any of our critical business or information technology systems could harm our ability to conduct normal business operations and our operating results.

14.
ITEM 1B — UNRESOLVED STAFF COMMENTSNot applicable.ITEM 2 — PROPERTIESExpeditors owns the following properties:
Location Nature of PropertyUnited States: Washington, Seattle ...................................................................................... Corporate headquartersCalifornia, Brisbane ...................................................................................... Office and warehouse buildingCalifornia, Hawthorne ................................................................................... Office and warehouse buildingIllinois, Bensenville ....................................................................................... Office and warehouse buildingNew Jersey, Edison ...................................................................................... Office and warehouse buildingNew York, Inwood ......................................................................................... Office and warehouse buildingTexas, Humble .............................................................................................. Office and warehouse buildingWashington, SeaTac ..................................................................................... Office buildingWashington, Spokane ................................................................................... Office building
North Asia: China, Beijing ............................................................................................... Office and warehouse buildingChina, Shanghai ........................................................................................... Office buildingChina, Shenzhen .......................................................................................... OfficesChina, Tianjin ................................................................................................ OfficesHong Kong, Kowloon .................................................................................... OfficesKorea, Seoul ................................................................................................. OfficesTaiwan, Taipei ............................................................................................... Offices
Europe: Belgium, Brussels ......................................................................................... Office and warehouse buildingEngland, London .......................................................................................... Office and warehouse buildingIreland, Cork ................................................................................................. Office and warehouse buildingIreland, Dublin .............................................................................................. Office and warehouse buildingNetherlands, Amsterdam .............................................................................. Office and warehouse building
Other North America:Mexico, Nuevo Laredo .................................................................................. Land
Latin America: Costa Rica, Alajuela ..................................................................................... Office building
Middle East: Egypt, Cairo .................................................................................................. Office and warehouse building
We lease and maintain approximately 440 locations worldwide, of which approximately 90 are in the United States. These leased locations are primarily located close to an airport, ocean port, or on an important border crossing. The majority of these facilities contain warehouse facilities. Lease terms are either on a month-to-month basis or terminate at various times through 2028. See Note 8 to our consolidated financial statements for lease commitments. We will from time to time investigate the possibility of building or buying suitable facilities. We believe that current leases can be extended and that suitable alternative facilities are available in the vicinity of each present facility should extensions be unavailable at the conclusion of current leases.
ITEM 3 — LEGAL PROCEEDINGS
Expeditors is involved in claims, lawsuits, government investigations and other legal matters that arise in the ordinary course of business and are subject to inherent uncertainties. Currently, in management's opinion and based upon advice from legal advisors, none of these matters are expected to have a significant effect on our operations, cash flows or financial position. As of December 31, 2017, the amounts accrued for these claims, lawsuits, government investigations and other legal matters are not significant to our operations, cash flows or financial position. At this time, we are unable to estimate any additional loss or range of reasonably possible losses, if any, beyond the amounts recorded, that might result from the resolution of these matters.
15.
ITEM 4 — MINE SAFETY DISCLOSURESNot applicable.PART II
ITEM 5 — MARKET FOR REGISTRANT’S COMMON EQUITY, RELATED STOCKHOLDER MATTERS AND ISSUER PURCHASES OF EQUITY SECURITIES
Expeditors' common stock trades on The NASDAQ Global Select Market. The following table sets forth the high and low sale prices for our common stock as reported by The NASDAQ Global Select Market under the symbol EXPD.
Common Stock Common StockQuarter High Low Quarter High Low2017 2016First ......................................... $ 57.35 $ 51.57 First ....................................... $ 49.56 $ 40.41Second .................................... $ 57.75 $ 51.96 Second .................................. $ 50.63 $ 46.48Third ........................................ $ 60.30 $ 54.32 Third ...................................... $ 52.58 $ 48.41Fourth ...................................... $ 66.01 $ 56.45 Fourth .................................... $ 56.37 $ 47.23
There were 801 shareholders of record as of February 20, 2018. This figure does not include a substantially greater number of beneficial holders of our common stock, whose shares are held of record by banks, brokers and other financial institutions.
The Board of Directors declared semi-annual dividends per share during the two most recent fiscal years paid as follows:
June 15, 2017 ........................................................................................................................................................................... $ 0.42December 15, 2017 .................................................................................................................................................................. $ 0.42June 15, 2016 ........................................................................................................................................................................... $ 0.40December 15, 2016 .................................................................................................................................................................. $ 0.40
ISSUER PURCHASES OF EQUITY SECURITIES
Period
Total Numberof SharesPurchased
Average PricePaid perShare
Total Numberof Shares
Purchased asPart ofPublicly
AnnouncedPlans or
Programs
MaximumNumber
of Sharesthat
May Yet BePurchasedUnder thePlans or
ProgramsOctober 1-31, 2017 .................................................... — $ — — 11,121,188November 1-30, 2017 ................................................ 574,000 $ 64.33 574,000 11,031,664December 1-31, 2017 ................................................ 1,557,579 $ 64.58 1,557,579 9,018,093Total ........................................................................... 2,131,579 $ 64.52 2,131,579 9,018,093
In November 1993, Expeditors' Board of Directors authorized a Non-Discretionary Stock Repurchase Plan for the purpose of repurchasing our common stock in the open market with the proceeds received from the exercise of stock options. On February 9, 2009, the Plan was amended to increase the authorization to repurchase up to 40 million shares of our common stock. This authorization has no expiration date. This plan was disclosed in our annual report on Form 10-K filed on March 31, 1995. In the fourth quarter of 2017, we repurchased 778,977 shares of common stock under the Non-Discretionary Stock Repurchase Plan.
In November 2001, under a Discretionary Stock Repurchase Plan, Expeditors' Board of Directors authorized the repurchase of our common stock in the open market to reduce the issued and outstanding stock down to 200 million shares. In February 2014, the Board of Directors authorized repurchases down to 190 million shares of common stock outstanding. In February and August 2015 and May 2016, the Board of Directors further authorized repurchases down to 188 million, 180 million and 170 million, respectively. The maximum number of shares available for repurchase under this plan will increase as the total number of outstanding shares increases. This authorization has no expiration date. In the fourth quarter of 2017, we repurchased 1,352,602 shares of common stock under the Discretionary Stock Repurchase Plan. These discretionary repurchases included 355,765 shares that were made to limit the growth in the number of issued and outstanding shares resulting from stock option exercises and 996,837 shares to reduce the number of total shares outstanding.

16.
The graph below compares Expeditors International of Washington, Inc.'s cumulative 5-Year total shareholder return on common stock with the cumulative total returns of the S&P 500 index, the NASDAQ Transportation index, and the NASDAQ Industrial Transportation index (NQUSB2770T) as a replacement for the NASDAQ Transportation index. The Company is making the modification to reference a specific transportation index and to source that data directly from NASDAQ. The graph assumes that the value of the investment in our common stock and in each of the indexes (including reinvestment of dividends) was $100 on 12/31/2012 and tracks it through 12/31/2017. Total return assumes reinvestment of dividends in each of the indices indicated.
COMPARISON OF 5-YEAR CUMULATIVE TOTAL RETURNAmong Expeditors International of Washington, Inc., the S&P 500 Index,
the NASDAQ Industrial Transportation Index and theNASDAQ Transportation Index.
12/12 12/13 12/14 12/15 12/16 12/17
Expeditors International of Washington, Inc. ............ $ 100.00 $ 113.52 $ 116.07 $ 119.12 $ 142.10 $ 176.08Standard and Poor's 500 Index ................................... 100.00 132.39 150.51 152.59 170.84 208.14NASDAQ Transportation ............................................. 100.00 133.76 187.65 162.30 193.79 248.92NASDAQ Industrial Transportation (NQUSB2770T) .. 100.00 141.60 171.91 132.47 171.17 218.34
The stock price performance included in this graph is not necessarily indicative of future stock price performance.
17.
ITEM 6 — SELECTED FINANCIAL DATA
Financial Highlights
In thousands, except per share data
2017 2016 2015 2014 2013Revenues ...................................................................... $ 6,920,948 6,098,037 6,616,632 6,564,721 6,080,257Net revenues1 ................................................................ $ 2,319,189 2,164,036 2,187,777 1,981,427 1,882,853Net earnings attributable to shareholders ...................... $ 489,345 430,807 457,223 376,888 348,526Diluted earnings attributable to shareholders per share $ 2.69 2.36 2.40 1.92 1.68Basic earnings attributable to shareholders per share... $ 2.73 2.38 2.42 1.92 1.69Dividends declared and paid per common share........... $ 0.84 0.80 0.72 0.64 0.60Cash used for dividends ................................................ $ 150,495 145,123 135,673 124,634 123,292Cash used for share repurchases .................................. $ 478,258 337,658 629,991 550,781 261,936Working capital .............................................................. $ 1,448,333 1,288,648 1,115,136 1,285,188 1,526,673Total assets ................................................................... $ 3,117,008 2,790,871 2,565,577 2,870,626 2,996,416Shareholders’ equity ...................................................... $ 1,991,858 1,844,638 1,691,993 1,868,408 2,084,783Weighted average diluted shares outstanding ............... 181,666 182,704 190,223 196,768 206,895Weighted average basic shares outstanding ................. 179,247 181,282 188,941 196,147 205,995
_______________________ 1Non-GAAP measure calculated as revenues less directly related operating expenses attributable to our principal services. See Management's Discussion and Analysis for a reconciliation of Net Revenues to Revenues.
SAFE HARBOR FOR FORWARD-LOOKING STATEMENTS UNDER PRIVATE SECURITIES LITIGATION REFORM ACT OF 1995; CERTAIN CAUTIONARY STATEMENTS
This Annual Report on Form 10-K for the fiscal year ended December 31, 2017 contains “forward-looking statements,” as defined in Section 27A of the Securities Act of 1933, as amended, and Section 21E of the Securities Exchange Act of 1934, as amended. From time to time, Expeditors or its representatives have made or may make forward-looking statements, orally or in writing. Such forward-looking statements may be included in, but not limited to, press releases, presentations, oral statements made with the approval of an authorized executive officer or in various filings made by Expeditors with the Securities and Exchange Commission. Statements including those preceded by, followed by or that include the words or phrases “will likely result”, “are expected to”, "would expect", "would not expect", “will continue”, “is anticipated”, “estimate”, “project”, "provisional", "plan", "believe", "probable", "reasonably possible", "may", "could", "should", "intends", "foreseeable future" or similar expressions are intended to identify “forward-looking statements” within the meaning of the Private Securities Litigation Reform Act of 1995. Such statements are qualified in their entirety by reference to and are accompanied by the discussion in Item 1A of certain important factors that could cause actual results to differ materially from such forward-looking statements.
The risks included in Item 1A are not exhaustive. Furthermore, reference is also made to other sections of this report, which include additional factors that could adversely impact Expeditors' business and financial performance. Moreover, Expeditors operates in a very competitive, complex and rapidly changing global environment. New risk factors emerge from time to time and it is not possible for management to predict all of such risk factors, nor can it assess the impact of all of such risk factors on Expeditors' business or the extent to which any factor, or combination of factors, may cause actual results to differ materially from those contained in any forward-looking statements. Accordingly, forward-looking statements cannot be relied upon as a guarantee of actual results.
Shareholders should be aware that while Expeditors does, from time to time, communicate with securities analysts, it is against Expeditors' policy to disclose to such analysts any material non-public information or other confidential commercial information. Accordingly, shareholders should not assume that Expeditors agrees with any statement or report issued by any analyst irrespective of the content of such statement or report. Furthermore, Expeditors has a policy against issuing financial forecasts or projections or confirming the accuracy of forecasts or projections issued by others. Accordingly, to the extent that reports issued by securities analysts contain any projections, forecasts or opinions, such reports are not the responsibility of Expeditors.

18.
ITEM 7 — MANAGEMENT’S DISCUSSION AND ANALYSIS OF FINANCIAL CONDITION AND RESULTS OF OPERATIONS
Overview
Expeditors International of Washington, Inc. is a global logistics company. Our services include air and ocean freight consolidation and forwarding, customs clearance, warehousing and distribution, purchase order management, vendor consolidation, time-definite transportation services, cargo insurance, specialized cargo monitoring and tracking, and other customized logistics solutions. We do not compete for overnight courier or small parcel business. As a non-asset based carrier, we do not own or operate transportation assets.
We derive our revenues from three principal sources: 1) airfreight services, 2) ocean freight and ocean services, and 3) customs brokerage and other services. These are the revenue categories presented in our financial statements.
We generate the major portion of our air and ocean freight revenues by purchasing transportation services on a wholesale basis from direct (asset-based) carriers and reselling those services to our customers on a retail basis. The difference between the rate billed to our customers (the sell rate) and the rate we pay to the carrier (the buy rate) is termed “net revenue” (a non-GAAP measure), “yield" or "margin." By consolidating shipments from multiple customers and concentrating our buying power, we are able to negotiate favorable buy rates from the direct carriers, while at the same time offering lower sell rates than customers would otherwise be able to negotiate themselves. The most significant drivers of changes in gross revenues and related transportation expenses are volume, sell rates and buy rates. Volume has a similar effect on the change in both gross revenues and related transportation expenses in each of our three primary sources of revenue.
In most cases we act as an indirect carrier. When acting as an indirect carrier, we issue a House Airway Bill (HAWB), a House Ocean Bill of Lading (HOBL) or a House Seaway Bill to customers as the contract of carriage. In turn, when the freight is physically tendered to a direct carrier, we receive a contract of carriage known as a Master Airway Bill for airfreight shipments and a Master Ocean Bill of Lading for ocean shipments. In these transactions, we evaluate whether it is appropriate to record the gross or net amount as revenue. Generally, revenue is recorded on a gross basis when we are the primary obligor, are obligated to compensate direct carriers for services performed regardless of whether customers accept the service, have latitude in establishing price, have discretion in selecting the direct carrier, have credit risk or have several but not all of these indicators. Revenue is generally recorded on a net basis where we are not primarily obligated and do not have latitude in establishing prices. Such amounts earned are determined using a fixed fee, a per unit of activity fee or a combination thereof.
For revenues earned in other capacities, for instance, when we do not issue a HAWB, a HOBL, or a House Seaway Bill or otherwise act solely as an agent for the shipper, only the commissions and fees earned for such services are included in revenues. In these transactions, we are not a principal and report only commissions and fees earned in revenue.
Customs brokerage and other services involves providing services at destination, such as helping customers clear shipments through customs by preparing and filing required documentation, calculating and providing for payment of duties and other taxes on behalf of customers as well as arranging for any required inspections by governmental agencies, and arranging for delivery. These are complicated functions requiring technical knowledge of customs rules and regulations in the multitude of countries in which we have offices.
We manage our company along five geographic areas of responsibility: Americas; North Asia; South Asia; Europe; and Middle East, Africa and India (MAIR). Each area is divided into sub-regions, which are composed of operating units with individual profit and loss responsibility. Our business involves shipments between operating units and often touches more than one geographic area. The nature of the international logistics business necessitates a high degree of communication and cooperation among operating units. Because of this inter-relationship between operating units, it is very difficult to examine any one geographic area and draw meaningful conclusions as to its contribution to our overall success on a stand-alone basis. The following chart shows net revenues by geographic areas of responsibility for the years ended December 31, 2017, 2016 and 2015:
19.
Our operating units share revenue using the same arms-length pricing methodologies that we use when our offices transact business with independent agents. Certain costs are allocated among the segments based on the relative value of the underlying services, which can include allocation based on actual costs incurred or estimated cost plus a profit margin. Our strategy closely links compensation with operating unit profitability. Individual success is closely linked to cooperation with other operating units within our network.
The mix of services varies by segment based primarily on the import or export orientation of local operations in each of our regions. In accordance with our revenue recognition policy (see Note 1. E to the consolidated financial statements of this report), almost all freight revenues and related expenses are recorded at origin and shipment profits are split between origin and destination offices by recording a commission fee or profit share revenue at destination and a corresponding commission or profit share expense as a component of origin consolidation costs.
North Asia is our largest export oriented region and accounted for 37% of revenues, 22% of net revenues and 35% of operating income for the year ended December 31, 2017. North Asia's net revenues as a percentage of revenues is lower than other segments due to the largely export nature of operations in that region.
Expeditors' Culture
From the inception of our company, management has believed that the elements required for a successful global service organization can only be assured through recruiting, training, and ultimately retaining superior personnel. We believe that our greatest challenge is now and always has been perpetuating a consistent global corporate culture, which demands:
• Total dedication to providing superior customer service;
• Compliance with our policies and procedures and government regulations;
• Aggressive marketing of all of our service offerings;
20.
• A positive, safe work environment that is inclusive and free from discrimination and harassment;
• Ongoing development of key employees and management personnel;
• Creation of unlimited advancement opportunities for employees dedicated to hard work, personal growth and continuous improvement;
• Individual commitment to the identification and mentoring of successors for every key position so that when change occurs, a qualified and well-trained internal candidate is ready to step forward; and
• Continuous identification, design and implementation of system solutions and differentiated service offerings, both technological and otherwise, to meet and exceed the needs of our customers while simultaneously delivering tools to make our employees more efficient and more effective.
We reinforce these values with a compensation system that rewards employees for profitably managing the things they can control. This compensation system has been in place since we became a publicly traded company. There is no limit to how much a key, non-executive manager can be compensated for success. We believe in a “real world” environment where the employees of our operating units are held accountable for the profit implications of their decisions. If these decisions result in operating losses, management generally must make up these losses with future operating profits, in the aggregate, before any cash incentive compensation can be earned. Executive management, in limited circumstances, makes exceptions at the branch operating unit level. At the same time, our policies, processes and relevant training focus on such things as cargo management, risk mitigation, compliance, accounts receivable collection, cash flow and credit soundness in an attempt to help managers avoid the kinds of errors that might end a career.
We believe that our unique culture is a critical component to our continued success. We strongly believe that it is nearly impossible to predict events that, individually or in the aggregate, could have a positive or a negative impact on our future operations. As a result, management's focus is on building and maintaining a global corporate culture and an environment where well-trained employees and managers are prepared to identify and react to changes as they develop and thereby help us adapt and thrive as major trends emerge.
Our ability to provide services to customers is highly dependent on good working relationships with a variety of entities including airlines, ocean carriers, ground transportation providers and governmental agencies. The significance of maintaining acceptable working relationships with these entities has gained increased importance as a result of ongoing concern over terrorism, security, changes in governmental regulation and oversight of international trade. A good reputation helps to develop practical working understandings that will assist in meeting security requirements while minimizing potential international trade obstacles, especially as governments promulgate new regulations and increase oversight and enforcement of new and existing laws. We consider our current working relationships with these entities to be satisfactory.
Our business is also highly dependent on the financial stability and operational capabilities of the carriers we utilize. Although airline profitability has improved, many air carriers remain highly leveraged with debt. Moreover, the ocean carrier industry has incurred substantial losses in recent years. Many carriers are highly leveraged with debt and certain carriers are facing significant liquidity challenges, such as those that led to the bankruptcy filing of a major carrier that occurred in August 2016. This environment requires that we be selective in determining which carriers to utilize. Further changes in the financial stability, operating capabilities and capacity of asset-based carriers, space allotments available from carriers, governmental regulations, and/or trade accords could adversely affect our business in unpredictable ways.
International Trade and Competition
We operate in over 60 countries in the competitive global logistics industry and our activities are closely tied to the global economy. International trade is influenced by many factors, including economic and political conditions in the United States and abroad, currency exchange rates, and laws and policies relating to tariffs, trade restrictions, foreign investments and taxation. Periodically, governments consider a variety of changes to current tariffs and trade restrictions and accords. We cannot predict which, if any, of these proposals may be adopted, or the effects the adoption of any such proposal will have on our business. Doing business in foreign locations also subjects us to a variety of risks and considerations not normally encountered by domestic enterprises. In addition to being influenced by governmental policies concerning international trade, our business may also be negatively affected by political developments and changes in government personnel or policies in the United States and other countries, as well as economic turbulence, political unrest and security concerns in the nations in which we conduct business and the future impact that these events may have on international trade and oil prices.
The global logistics services industry is intensely competitive and is expected to remain so for the foreseeable future. Our pricing and terms continue to be pressured by uncertainty in global trade and economic conditions, concerns over volatile fuel costs, disruptions in port services, political unrest and fluctuating currency exchange rates. We expect these operating and competitive conditions to continue.
Ocean carriers have incurred substantial operating losses in recent years, and many are highly leveraged with debt. These financial challenges have resulted in the 2016 bankruptcy of a major carrier, as well as multiple carrier acquisitions and carrier alliance formations. Additionally, while overall global demand has recently increased, carriers continue to take delivery of new and larger ships, which creates additional capacity. When the market experiences seasonal peaks or any sort of disruption, the carriers often increase their pricing suddenly. This carrier behavior creates pricing volatility that could impact Expeditors' ability to maintain historical unitary profitability.
The global economic environment and trade growth have improved but remain uncertain. We cannot predict the impact of future changes in global trade on our operating results, freight volumes, pricing, changes in consumer demand, carrier stability and capacity, customers’ abilities
21.
to pay or on changes in competitors' behavior. Additionally, we cannot predict the direct or indirect impact that further changes in consumer purchasing behavior, such as online shopping, could have on our business.
Critical Accounting Estimates
A summary of our significant accounting policies can be found in Note 1 to the consolidated financial statements in this report.
Management believes that the nature of our business is such that there are few complex challenges in accounting for operations. While judgments and estimates are a necessary component of any system of accounting, the use of estimates is limited primarily to the following areas:
• accrual of loss contingencies;
• accrual of various tax liabilities and contingencies;
• accounts receivable valuation; and
• accrual of insurance liabilities for the portion of the related exposure that we have self-insured.
These estimates, other than the accrual of loss contingencies and tax liabilities and contingencies, are not highly uncertain and have not historically been subject to significant change. Management believes that the methods utilized in all of these areas are non-aggressive in approach and consistent in application. Management believes that there are limited, if any, alternative accounting principles or methods which could be applied to these transactions. While the use of estimates means that actual future results may be different from those contemplated by the estimates, management believes that alternative principles and methods used for making such estimates would not produce materially different results than those reported.
The outcome of loss contingencies, including legal proceedings and claims and government investigations, brought against us are subject to significant uncertainty. An estimated loss from a contingency, such as a legal proceeding, claim or government investigation, is accrued by a charge to income if it is probable that an asset has been impaired or a liability has been incurred and the amount of the loss can be reasonably estimated. Disclosure of a loss contingency is required if there is at least a reasonable possibility that a significant loss has been incurred. In determining whether a loss should be accrued, management evaluates several factors, including advice from outside legal counsel, in order to estimate the likelihood of an unfavorable outcome and to make a reasonable estimate of the amount of loss or range of reasonably possible loss. Changes in these factors could have a material impact on our financial position, results of operations and operating cash flows for any particular quarter or year.
We are subject to taxation in multiple U.S. and foreign tax jurisdictions. As discussed in Note 1.F to the consolidated financial statements, the earnings of our foreign subsidiaries are not considered to be indefinitely reinvested outside of the U.S. and, accordingly, U.S. Federal and State income taxes have historically been provided for all undistributed earnings net of related foreign tax credits of our foreign subsidiaries.
Accounting for income taxes involves estimates and judgments. Management believes our tax positions, including intercompany transfer pricing policies, are reasonable and consistent. As a matter of course, Expeditors is audited by various taxing authorities, and sometimes these audits result in proposed assessments where the ultimate resolution could result in significant additional tax, penalties and interest payments being required. We establish liabilities when, despite our belief that the tax return positions are appropriate and consistent with tax law, we conclude that we may not be successful in realizing the tax position. In evaluating a tax position, we determine whether it is more likely than not that the position will be sustained upon examination, including resolution of any related appeals or litigation processes, based on the technical merits of the position and in consultation with qualified tax advisors. Our estimate of any ultimate tax liability contains assumptions based on past experiences, judgments about potential actions by taxing jurisdictions as well as judgments about the likely outcome of issues that have been raised by the taxing jurisdiction. We believe the estimates and assumptions used to support the evaluation of our tax positions are reasonable. However, final determinations of tax liabilities, penalties and interest could be materially different from estimates.
As discussed in further detail in Note 5 to the consolidated financial statements, on December 22, 2017 the U.S. enacted the Tax Cuts and Jobs Act (the 2017 Tax Act). The 2017 Tax Act, which is also commonly referred to as “U.S. tax reform,” significantly changes U.S. corporate income tax laws by, among other things, reducing the U.S. corporate income tax rate to 21% starting in 2018 and creating a territorial tax system with a one-time mandatory tax on previously undistributed foreign earnings of non-U.S. subsidiaries.
Prospectively, excluding the impact of any discrete items, the provisions of the 2017 Tax Act are expected to reduce our effective tax rate compared to what the rate would have otherwise been in the absence of U.S. tax reform. The ultimate impact on our effective tax rate will largely depend on the mix of pretax earnings that we generate in the U.S. as compared to the rest of the world.

22.
Results of Operations
The following table shows the total net revenues (a non-GAAP measure calculated as revenues less directly related operating expenses attributable to our principal services) and our expenses for 2017, 2016, and 2015 expressed as percentages of net revenues. Management believes that net revenues are a better measure than total revenues when analyzing and discussing management's effectiveness in managing our principal services since total revenues earned by Expeditors as a freight consolidator include the carriers’ charges to us for carrying the shipment, whereas revenues earned by Expeditors in our other capacities include primarily the commissions and fees actually earned by us. Net revenue is one of our primary operational and financial measures and demonstrates our ability to manage sell rates to customers with our ability to concentrate and leverage our purchasing power through effective consolidation of shipments from multiple customers utilizing a variety of transportation carriers and optimal routings. Using net revenue also provides a commonality for comparison among various services.
The table, chart and the accompanying discussion and analysis should be read in conjunction with the consolidated financial statements and related notes thereto in this report.
2017 2016 2015
In thousands Amount
Percentof net
revenues Amount
Percentof net
revenues Amount
Percent of net
revenues Airfreight services:
Revenues ............................................................ $2,877,032 $2,453,347 $2,740,583Expenses ............................................................ 2,126,761 1,752,167 1,987,690Net revenues ....................................................... 750,271 32% 701,180 32% 752,893 34%
Ocean freight and ocean services:Revenues ............................................................ 2,107,045 1,917,494 2,194,004Expenses ............................................................ 1,543,740 1,378,699 1,648,993Net revenues ....................................................... 563,305 24 538,795 25 545,011 25
Customs brokerage and other services:Revenues ............................................................ 1,936,871 1,727,196 1,682,045Expenses ............................................................ 931,258 803,135 792,172Net revenues ....................................................... 1,005,613 44 924,061 43 889,873 41
Total net revenues.......................................... 2,319,189 100 2,164,036 100 2,187,777 100Overhead expenses:
Salaries and related costs ................................... 1,267,120 55 1,157,635 53 1,143,511 52Other ................................................................... 351,809 15 336,238 16 322,782 15
Total overhead expenses ............................... 1,618,929 70 1,493,873 69 1,466,293 67Operating income ..................................................... 700,260 30 670,163 31 721,484 33Other income, net ..................................................... 18,335 1 16,693 1 15,205 1Earnings before income taxes .................................. 718,595 31 686,856 32 736,689 34Income tax expense ................................................. 228,212 10 254,323 12 277,192 13
Net earnings .................................................. 490,383 21 432,533 20 459,497 21Less net earnings attributable to the noncontrollinginterest ...................................................................... 1,038 — 1,726 — 2,274 —
Net earnings attributable to shareholders ...... $ 489,345 21% $ 430,807 20% $ 457,223 21%
23.
2017 compared with 2016
Airfreight services:
Airfreight services revenues increased 17% in 2017, as compared with 2016. This increase is attributed to tonnage growth across all segments and higher average sell rates, principally on exports out of North Asia and Europe. We increased sell rates in response to higher buy rates caused by an overall increase in market demand. Airfreight services expenses increased 21% in 2017 as compared with 2016, as a result of the 10% increase in tonnage and higher average buy rates due to tighter carrier capacity.
Airfreight services net revenues in 2017 increased 7%, as compared with 2016. The increase was principally due to a 10% increase in tonnage, partially offset by a 6% decrease in net revenue per kilo. Average net revenue per kilo declined in most regions primarily due to competitive market conditions and tight carrier capacity. Carriers in North Asia and South Asia increased pricing significantly as a result of higher demand relative to available capacity. North America, North Asia and Europe net revenues increased 10%, 8% and 15%, respectively, due primarily to tonnage increases of 12%, 6% and 12%, respectively. South Asia net revenues decreased 12%, despite a 12% increase in tonnage, primarily due to lower average sell rates and higher average buy rates.
Since late 2016, the global airfreight market has been experiencing imbalances between carrier capacity and demand in certain lanes, which is resulting in higher average buy rates. Customers remain focused on improving supply-chain efficiency, reducing overall logistics costs by negotiating lower rates and utilizing ocean freight whenever possible. Customers are increasingly utilizing airfreight to improve speed to market. We expect these trends to continue in conjunction with carriers' efforts to manage available capacity and the evolution of consumer purchasing behavior, such as online shopping. These conditions could be affected by new product launches during periods that have historically experienced higher demand. Historically, we have experienced lower airfreight margins in the fourth quarter as seasonal volumes increase and carriers correspondingly increase buy rates. These events, should they continue to occur, could create a higher degree of volatility in volumes and, ultimately, buy and sell rates.

24.
Ocean freight and ocean services:
Ocean freight consolidation, direct ocean forwarding and order management are the three basic services that constitute and are collectively referred to as ocean freight and ocean services. Ocean freight and ocean services revenues increased 10% in 2017 as compared with 2016, primarily due to a 5% increase in container volume and higher average sell rates to customers. Ocean freight and ocean services expenses increased 12% in 2017 as compared with 2016, due to volume growth and higher average buy rates, resulting from overall market demand and carriers managing available capacity.
Ocean freight and ocean services net revenues increased 5% in 2017, as compared with 2016. The largest component of our ocean freight net revenue is derived from ocean freight consolidation, which represented 45% and 48% of ocean freight net revenue in 2017 and 2016, respectively.
Ocean freight consolidation net revenues decreased 1% in 2017, as compared with 2016. This decrease was due primarily to a 6% decrease in net revenue per container, largely offset by a 5% increase in volume. Direct ocean freight forwarding net revenues increased 6% due to higher volumes. Order management net revenues increased 13%, mostly resulting from higher volumes with new and existing customers, primarily in North Asia and South Asia.
North Asia ocean freight and ocean services net revenues increased 11% in 2017, as compared with 2016, due principally to 4% growth in volume and order management. North America and South Asia net revenues both increased 1%, as higher volumes were largely offset by lower margins. Europe net revenues decreased 1%, due to a decline in net revenue per container, mostly offset by volume growth.
We expect that pricing volatility will continue as customers solicit bids and carriers adapt to changing market conditions, merge or create alliances with other carriers. These conditions could result in lower margins.
Customs brokerage and other services:
Customs brokerage and other services revenues and expenses increased 12% and 16%, respectively, in 2017, as compared with 2016, primarily as a result of higher volumes.
Customs brokerage and other services net revenues increased 9% in 2017, as compared with 2016, primarily as a result of an increase in customs brokerage and road freight volumes, particularly in North America and Europe. Customers continue to seek out customs brokers with sophisticated computerized capabilities critical to an overall logistics management program, including rapid responses to changes in the regulatory and security environment.
North America net revenues increased 11% in 2017, as compared with 2016, primarily as a result of higher volumes from existing and new customers in road freight and customs brokerage services. Europe net revenues increased 12% due primarily to growth in import, road freight, and warehouse and distribution services.
Overhead expenses:
Salaries and related costs increased 9% in 2017, as compared with 2016, principally due to an increase in the number of employees, primarily in North America, South Asia and Europe, higher salaries, and an increase in bonuses resulting from higher operating income.
Historically, the relatively consistent relationship between salaries and net revenues is the result of a compensation philosophy that has been maintained since the inception of our company: offer a modest base salary and the opportunity to share in a fixed and determinable percentage of the operating profit of the business unit controlled by each key employee. Using this compensation model, changes in individual incentive compensation occur in proportion to changes in our operating income, creating a direct alignment between corporate performance and shareholder interests. Bonuses to field and executive management in 2017 were up 4.7% as compared with 2016, primarily as a result of a 4.5% increase in operating income. Our management compensation programs have always been incentive-based and performance driven. Salaries and related costs increased to 55% of net revenues in 2017, as compared with 53% in 2016.
Because our management incentive compensation programs are also cumulative, generally no management bonuses can be paid unless the relevant business unit is, from inception, cumulatively profitable. Any operating losses must be offset in their entirety by operating profits before management is eligible for a bonus. Executive management, in limited circumstances, makes exceptions at the branch operating unit level. Since the most significant portion of management compensation comes from the incentive bonus programs, we believe that this cumulative feature is a disincentive to excessive risk taking by our managers. Our services have a short operating cycle. As a result, the outcome of any higher risk transactions, such as overriding established credit limits, would be known in a relatively short time frame. Management believes that when the potential and certain impact on the bonus is fully considered in light of this short operating cycle, the potential for short-term gains that could be generated by engaging in risky business practices is sufficiently mitigated to discourage excessive and inappropriate risk taking. Management believes that both the stability and the long-term growth in revenues, net revenues and net earnings are a result of the incentives inherent in our compensation programs.
Other overhead expenses increased 5% in 2017, as compared with 2016. We continue to invest in additional technology and facilities, which resulted in higher rent and facilities expenses, technology-related fees and consulting costs. These increases were offset by a $4 million gain on the sale of a property, lower claims, the favorable resolution of an indirect tax contingency of $6 million and the recovery of certain legal and related costs totaling $8 million in 2017 compared to $5 million in 2016. We will continue to make important investments in people,
25.
processes and technology, as well as to invest in our strategic efforts to explore new areas for profitable growth. Other overhead expenses decreased to 15% of net revenues in 2017 from 16% in 2016.
Income tax expense:
We pay income taxes in the United States and other jurisdictions. Our consolidated effective income tax rate was 31.8% in 2017, as compared with 37.0% in 2016. The change in the effective tax rate was principally due to recording the estimated impact of U.S. tax reform and to a lesser degree a result of a higher proportion of our total outstanding stock-based compensation expense being for non-qualified stock option grants and restricted stock units. The tax benefit associated with non-qualified stock option and restricted stock unit grants is recorded when the related compensation expense is recognized while the tax benefit received for incentive stock options and employee stock purchase plan shares cannot be anticipated and are recognized if and when a disqualifying disposition occurs.
Our effective tax rate is subject to variation and the effective tax rate can be more or less volatile based on the amount of pre-tax income or loss. For example, the impact of discrete items and non-deductible expenses on the effective tax rate is greater when pre-tax income is lower. Total consolidated foreign income tax expense is composed of the income tax expense of our Non-US subsidiaries as well as income based withholding taxes paid by our Non-US subsidiaries on behalf its parent for intercompany payments, including the remittance of dividends. For example our effective foreign tax rate increased from 30.9% in 2016 to 33.9% in 2017, principally due to withholding tax payments associated with dividend payments from our non-U.S. subsidiaries. Prospectively, excluding the impact of discrete items recorded in a future reporting period and any changes recorded in 2018 to provisional 2017 income tax expense amounts as discussed in Note 5 to the consolidated financial statements, the provisions of the 2017 Tax Act are expected to reduce our annual effective tax rate to an estimated rate between 31% and 34%. The ultimate impact on our effective tax rate will largely depend on the mix of pretax earnings that we generate in the U.S. as compared to the rest of the world and the other factors discussed above.
2016 compared with 2015
Airfreight services:
Airfreight services revenues decreased 10% in 2016, as compared with 2015, primarily as a result of lowering average sell rates in response to competitive market conditions. The decrease in average sell rates was partially offset by a 3% growth in airfreight tonnage. Airfreight services expenses decreased 12% in 2016 as compared with 2015, as a result of favorable buying opportunities throughout most regions due primarily to excess available carrier capacity. While not possible to quantify, sell rates and tonnage were favorably impacted in 2015 by customers converting a portion of their ocean freight shipments to airfreight due to port disruptions on the U.S. West Coast.
Airfreight services net revenues in 2016 decreased 7% as compared with 2015. The decrease was principally due to a 12% decrease in net revenue per kilo, partially offset by a 3% increase in tonnage. Average net revenue per kilo declined in most regions primarily due to competitive market conditions and rapid changes in carrier pricing caused by sporadic increases in demand. North America net revenues decreased by 6% due principally to a 3% decrease in tonnage. North Asia, South Asia and Europe net revenues decreased 10%, 9% and 2%, respectively, despite tonnage increases of 5%, 7% and 3%.
Ocean freight and ocean services:
Ocean freight and ocean services revenues decreased 13% in 2016, as compared with 2015, as we continued to lower average sell rates to customers in response to competitive market conditions and lower available buy rates from carriers. Although average sell rates to customers declined, container volumes increased 3%. Ocean freight and ocean services expenses decreased 16% in 2016 as compared with 2015, due to lower average buy rates, resulting from carrier overcapacity.
Ocean freight and ocean services net revenues decreased 1% in 2016, as compared with 2015. In 2016 and 2015, the largest component of our ocean freight net revenue was derived from ocean freight consolidation, which represented 48% and 50%, respectively, of ocean freight net revenue.
Ocean freight consolidation net revenues decreased 6% in 2016, as compared with 2015. This decrease was due primarily to an 8% decrease in net revenue per container, partially offset by a 3% increase in volume. During the latter part of the third quarter of 2016, we experienced a spike in average buy rates that began with the bankruptcy of a large ocean carrier on August 31, 2016. Direct ocean freight forwarding net revenues decreased 2% due to lower volumes principally in North America. Order management net revenues increased 11%, mostly resulting from higher volumes with new and existing customers, primarily in North Asia and South Asia.
North America ocean freight and ocean services net revenues decreased 3% in 2016, as compared with 2015, primarily due to lower direct ocean forwarding volumes and a decrease in ocean freight consolidation resulting from declining margins on imports. North Asia net revenues decreased 1% as lower margins were offset by a 1% growth in volume. Europe net revenues decreased 4%, as lower direct ocean forwarding volumes more than offset growth from order management and ocean freight consolidation. South Asia net revenues increased 6% due principally to 4% growth in volumes.
Customs brokerage and other services:
Customs brokerage and other services revenues and expenses increased 3% and 1%, respectively, in 2016, as compared with 2015, primarily as a result of increased volumes from existing and new road freight customers.

26.
Customs brokerage and other services net revenues increased 4% in 2016, as compared with 2015, primarily as a result of an increase in road freight volumes. Customers continued to seek out customs brokers with sophisticated computerized capabilities critical to an overall logistics management program, including rapid responses to changes in the regulatory and security environment.
North America net revenues increased 5% in 2016, as compared with 2015, primarily as a result of higher volumes from existing and new customers in road freight and lower import service costs. North Asia net revenues increased 8% due primarily to growth in import and warehouse and distribution services. Europe net revenues remained constant, as compared with 2015.
Overhead expenses:
Salaries and related costs increased 1% in 2016, as compared with 2015, principally due to an increase in the number of employees, primarily in North America and Europe, partially offset by reduced bonuses from lower operating income.
Bonuses to field and executive management in 2016 were down 7% as compared with 2015, primarily as a result of a 7% decrease in operating income. Salaries and related costs increased to 53% of net revenues in 2016 as compared with 52% in 2015.
Other overhead expenses increased 4% in 2016, as compared with 2015. The increase in expenses was primarily due to higher rent and maintenance costs and technology fees, partially offset by lower claims. Other overhead expenses increased to 16% of net revenues in 2016, as compared with 15% in 2015.
Income tax expense:
Our consolidated effective income tax rate declined slightly to 37.0% in 2016, as compared to 37.6% in 2015. The decrease in the effective tax rate was principally the result of a higher proportion of our total outstanding stock-based compensation expense being for non-qualified stock option grants.
Currency and Other Risk Factors
The nature of our worldwide operations necessitates dealing with a multitude of currencies other than the U.S. dollar. This results in our being exposed to the inherent risks of volatile international currency markets and governmental interference. Some of the countries where we maintain offices and/or agency relationships have strict currency control regulations, which influence our ability to hedge foreign currency exposure. We try to compensate for these exposures by accelerating international currency settlements among our offices and agents. We may enter into foreign currency hedging transactions where there are regulatory or commercial limitations on our ability to move money freely around the world or the short-term financial outlook in any country is such that hedging is the most time-sensitive way to mitigate short-term exchange losses. Any such hedging activity during 2017, 2016 and 2015 was insignificant. We had no foreign currency derivatives outstanding at December 31, 2017 and 2016. Net foreign currency losses were approximately $13 million in 2017, and net foreign currency gains were approximately $8 million in both 2016 and 2015.
International air and ocean freight forwarding and customs brokerage are intensively competitive and are expected to remain so for the foreseeable future. There are a large number of entities competing in the international logistics industry, many of which have significantly more resources than us; however, our primary competition is confined to a relatively small number of companies within this group. The industry continues to experience consolidations into larger firms striving for stronger and more complete multinational and multi-service networks. However, regional and local brokers and forwarders remain a competitive force.
The primary competitive factors in the international logistics industry continue to be price and quality of service, including reliability, responsiveness, expertise, convenience, and scope of operations. We emphasize quality customer service and believe that our prices are competitive with those of others in the industry. Customers regularly solicit bids from competitors in order to improve service, pricing and contractual terms such as seeking longer payment terms, higher or unlimited liability limits and performance penalties. Increased competition and competitors' acceptance of expanded contractual terms could result in reduced revenues, reduced margins, higher operating costs or loss of market share, any of which would damage our results of operations and financial condition.
Larger customers utilize more sophisticated and efficient procedures for the management of their logistics supply chains by embracing strategies such as just-in-time inventory management. We believe that this trend has resulted in customers using fewer service providers with greater technological capacity and more consistent global coverage. Accordingly, sophisticated computerized customer service capabilities and a stable worldwide network have become significant factors in attracting and retaining customers. Developing and maintaining these systems and a worldwide network has added a considerable indirect cost to the services provided to customers. Smaller and middle-tier competitors, in general, do not have the resources available to develop customized systems and a worldwide network.
Liquidity and Capital Resources
Our principal source of liquidity is cash and cash equivalents, short-term investments and cash generated from operating activities. Net cash provided by operating activities for the year ended December 31, 2017 was $489 million, as compared with $529 million for 2016. This $40 milliondecrease is primarily due to increases in accounts receivable, partially offset by higher earnings. At December 31, 2017, working capital was $1,448 million, including cash and cash equivalents of $1,051 million. We had no long-term debt at December 31, 2017. Management believes that our current cash position and operating cash flows will be sufficient to meet our capital and liquidity requirements for at least the next 12 months and thereafter for the foreseeable future, including meeting any contingent liabilities related to standby letters of credit and other obligations.
27.
As a customs broker, we make significant cash advances for a select group of our credit-worthy customers. These cash advances are for customer obligations such as the payment of duties and tax to customs authorities in various countries throughout the world. Cash advances are a “pass through” and are not recorded as a component of revenue and expense. The billings of such advances to customers are accounted for as a direct increase in accounts receivable from the customer and a corresponding increase in accounts payable to governmental customs authorities. As a result of these “pass through” billings, the conventional Days Sales Outstanding or DSO calculation does not directly measure collection efficiency. For customers that meet certain criteria, we have agreed to extend payment terms beyond our customary terms. Management believes that it has established effective credit control procedures, and historically has experienced relatively insignificant collection problems.
Our business historically has been subject to seasonal fluctuations in demand and this is expected to continue in the future. Cash flows fluctuate as a result of this seasonality. Historically, the first quarter shows an excess of customer collections over customer billings. This results in positive cash flow. The increased activity associated with periods of higher demand (typically commencing late second or early third quarter and continuing well into the fourth quarter) causes an excess of customer billings over customer collections. This cyclical growth in customer receivables consumes available cash.
Cash used by investing activities for the year ended December 31, 2017 was $12 million, as compared with $53 million for 2016. We had capital expenditures of $95 million in 2017 as compared with $59 million in 2016. Capital expenditures in 2017 related primarily to continuing investments in technology, the substantial completion of the construction of a building in Europe, office furniture and equipment and leasehold improvements. Occasionally, we elect to purchase buildings to house staff and to facilitate the staging of customers’ freight. In 2016, we completed a land acquisition, for which the funds had been deposited into escrow in 2014 and initiated building construction for the aforementioned building in Europe. In 2017, we completed the sale of land and buildings in Miami, Florida, which resulted in net cash proceeds of approximately $84 million. Total anticipated capital expenditures in 2018 are currently estimated to be $75 million.
Cash used in financing activities for the year ended December 31, 2017 was $425 million as compared with $299 million in 2016. We used the proceeds from stock option exercises, employee stock purchases and available cash to repurchase our common stock on the open market to limit the growth in issued and outstanding shares. During 2017 and 2016, we used cash to repurchase 8 million and 7 million shares of common stock, respectively. During 2017 and 2016, we paid dividends of $0.84 and $0.80 per share, respectively.
We have a Non-Discretionary Stock Repurchase Plan to repurchase shares from the proceeds of stock option exercises. During 2017, we repurchased 3.7 million shares at an average price of $57.47 per share. We also have a Discretionary Stock Repurchase Plan under which management is allowed to repurchase shares to reduce the issued and outstanding stock to 170 million shares of common stock. During 2017, we repurchased 4.5 million shares at an average price of $58.72 per share. See Note 3 to the consolidated financial statements for cumulative repurchases under both repurchase plans.
We follow established guidelines relating to credit quality, diversification and maturities of our investments to preserve principal and maintain liquidity. Our investment portfolio has historically not been significantly adversely impacted by disruptions in credit markets. However, there can be no assurance that our investment portfolio will not be adversely affected in the future.
We cannot predict what impact ongoing uncertainties in the global economy and political uncertainty may have on our operating results, freight volumes, pricing, changes in consumer demand, carrier stability and capacity, customers’ abilities to pay or on changes in competitors' behavior.
We maintain international unsecured bank lines of credit. At December 31, 2017, we were contingently liable for $75 million from standby letters of credit and guarantees. The standby letters of credit and guarantees relate to obligations of our foreign subsidiaries for credit extended in the ordinary course of business by direct carriers, primarily airlines, and for duty and tax deferrals available from governmental entities responsible for customs and value-added-tax (VAT) taxation. The total underlying amounts due and payable for transportation and governmental excises are properly recorded as obligations in the books of the respective foreign subsidiaries, and there would be no need to record additional expense in the unlikely event the parent company is required to perform.
Amount of commitment expiration per period
In thousands
Totalamounts
committedLess than 1
year1 - 3years
3 - 5years
After 5 years
Standby letters of credit and guarantees ........ $ 75,311 66,929 6,484 88 1,810

28.
At December 31, 2017, our contractual obligations are as follows:
Payments due by period
In thousands TotalLess than
1 year1 - 3years
3 - 5years
After 5 years
Contractual Obligations:Operating leases ................................................... $ 259,895 72,148 103,242 49,949 34,556Unconditional purchase obligations....................... 56,116 51,340 4,776 — —Construction, equipment and technologypurchase obligations ............................................. 18,475 15,311 3,164 — —Total contractual cash obligations ......................... $ 334,486 138,799 111,182 49,949 34,556
We typically enter into short-term unconditional purchase obligations with asset-based providers reserving space on a guaranteed basis. The pricing of these obligations varies to some degree with market conditions. We only enter into agreements that management believes we can fulfill. Historically, we have met these obligations in the normal course of business. Management believes, in line with historical experience, almost all committed purchase obligations outstanding as of December 31, 2017 will be fulfilled during 2018 in the ordinary course of business.
Our foreign subsidiaries regularly remit dividends to the U.S. parent company after evaluating their working capital requirements and needs to finance local capital expenditures. In some cases, our ability to repatriate funds from foreign operations may be subject to foreign exchange controls. At December 31, 2017, cash and cash equivalent balances of $446 million were held by our non-United States subsidiaries, of which $47 million was held in banks in the United States. Earnings of our foreign subsidiaries are not considered to be indefinitely reinvested outside of the United States and, accordingly, historically a deferred tax liability has been established for all undistributed earnings, net of foreign related tax credits, that are available to be repatriated.
As a result of U.S. tax reform, a liability of approximately $32 million for the estimate of the one-time mandatory tax on undistributed earnings of the Company's non-U.S. subsidiaries was recorded as of December 31, 2017. The cash tax effects of this deemed repatriation can be remitted in installments over an eight-year period as follows: (i) for each of the initial five years, 8% of the net tax liability is required to be remitted on an annual basis; (ii) in the sixth year, 15% of the net tax liability is required to be remitted; (iii) in the seventh year, 20% of the net tax liability is required to be remitted; and (iv) in the eighth year, the remaining 25% of the net tax liability is required to be remitted. We anticipate that we will pay this tax in installments over the eight-year period and anticipate cash payments of the deemed repatriation tax to approximate $2 million to $3 million in each of the next five years.
Impact of Inflation
To date, our business has not been adversely affected by inflation. Direct carrier rate increases could occur over the short to medium-term period. Due to the high degree of competition in the market place, these rate increases can lead to an erosion in our margins. As we are not required to purchase or maintain extensive property and equipment and have not otherwise incurred substantial interest rate-sensitive indebtedness, we currently have limited direct exposure to increased costs resulting from increases in interest rates.
Off-Balance Sheet Arrangements
As of December 31, 2017, we did not have any material off-balance-sheet arrangements, as defined in Item 303(a)(4)(ii) of SEC Regulation S-K.
ITEM 7A — QUANTITATIVE AND QUALITATIVE DISCLOSURES ABOUT MARKET RISK
We are exposed to market risks in the ordinary course of our business. These risks are primarily related to foreign exchange risk and changes in short-term interest rates. The potential impact of our exposure to these risks is presented below:
Foreign Exchange Risk
We conduct business in many different countries and currencies. Our business often results in revenue billings issued in a country and currency that differs from that where the expenses related to the service are incurred. In the ordinary course of business, we create numerous intercompany transactions and may have receivables, payables and currencies that are not denominated in the local functional currency. This brings foreign exchange risk to our earnings. The principal foreign exchange risks to which Expeditors is exposed include Chinese Yuan, Euro, Mexican Peso, Canadian Dollar and British Pound.
Foreign exchange rate sensitivity analysis can be quantified by estimating the impact on our earnings as a result of hypothetical changes in the value of the U.S. dollar, our functional currency, relative to the other currencies in which we transact business. All other things being equal, an average 10% weakening of the U.S. dollar, throughout the year ended December 31, 2017, would have had the effect of raising operating income approximately $48 million. An average 10% strengthening of the U.S. dollar, for the same period, would have the effect of reducing operating income approximately $39 million. This analysis does not take into account changes in shipping patterns based upon this hypothetical currency
29.
fluctuation. For example, a weakening in the U.S. dollar would be expected to increase exports from the United States and decrease imports into the United States over some relevant period of time, but the exact effect of this change cannot be quantified without making speculative assumptions.
We currently do not use derivative financial instruments to manage foreign currency risk and only enter into foreign currency hedging transactions in limited locations where regulatory or commercial limitations restrict our ability to move money freely. Any such hedging activity throughout the year ended December 31, 2017, was insignificant. Net foreign currency losses were approximately $13 million in 2017, and net currency gains were approximately $8 million in both 2016 and 2015. We had no foreign currency derivatives outstanding at December 31, 2017 and 2016. We instead follow a policy of accelerating international currency settlements to manage foreign exchange risk relative to intercompany billings. As of December 31, 2017, we had $17 million of net unsettled intercompany transactions. The majority of intercompany billings are resolved within 30 days.
Interest Rate Risk
At December 31, 2017, we had cash and cash equivalents of $1,051 million, of which $668 million was invested at various short-term market interest rates. We had no long-term debt at December 31, 2017. A hypothetical change in the interest rate of 10 basis points at December 31, 2017 would not have a significant impact on our earnings.
In management’s opinion, there has been no material change in our interest rate risk exposure between 2017 and 2016.
ITEM 8 — FINANCIAL STATEMENTS AND SUPPLEMENTARY DATA
The following documents are filed on the pages listed below, as part of Part II, Item 8 of this report.
Document Page
1 Financial Statements and Reports of Independent Registered Public Accounting Firm:
Reports of Independent Registered Public Accounting Firm ................................................................................... F-1 and F-2
Consolidated Financial Statements:
Balance Sheets as of December 31, 2017 and 2016 ........................................................................................ F-3
Statements of Earnings for the Years Ended December 31, 2017, 2016, and 2015 .......................................... F-4
Statements of Comprehensive Income for the Years Ended December 31, 2017, 2016, and 2015 .................. F-5
Statements of Equity for the Years Ended December 31, 2017, 2016, and 2015 .............................................. F-6 and F-7
Statements of Cash Flows for the Years Ended December 31, 2017, 2016, and 2015 ..................................... F-8
Notes to Consolidated Financial Statements ..................................................................................................... F-10 through F-24
ITEM 9 — CHANGES IN AND DISAGREEMENTS WITH ACCOUNTANTS ON ACCOUNTING AND FINANCIAL DISCLOSURE
None.
ITEM 9A — CONTROLS AND PROCEDURES
Evaluation of Disclosure Controls and Procedures
We carried out an evaluation, under the supervision and with the participation of our management, including the Chief Executive Officer and Chief Financial Officer, of the effectiveness of the design and operation of our disclosure controls and procedures (as defined in the Exchange Act Rule 13a-15(e)) as of the end of the period covered by this report. Based upon that evaluation, the Chief Executive Officer and Chief Financial Officer concluded that our disclosure controls and procedures were effective as of the end of the period covered by this report at the reasonable assurance level.
Changes in Internal Controls
There were no changes in our internal control over financial reporting that occurred during the most recent fiscal quarter that have materially affected, or are reasonably likely to materially affect, our internal control over financial reporting.
We are developing a new accounting system, which is being implemented on a worldwide basis over the next several years. This system is expected to improve the efficiency of certain financial and transactional processes and reporting. This transition affects the processes that constitute our internal control over financial reporting and requires testing for operating effectiveness.

30.
In the next two fiscal years, we will adopt two significant new accounting standards related to revenue recognition and accounting for leases. The adoption of these accounting standards will require changes to existing processes and systems that are an integral part of our internal controls and will require testing for operating effectiveness.
Our management has confidence in our internal controls and procedures. Nevertheless, our management, including Expeditors’ Chief Executive Officer and Chief Financial Officer, does not expect that our disclosure controls and procedures or our internal controls will prevent all errors or intentional fraud. An internal control system, no matter how well-conceived and operated, can provide only reasonable, not absolute, assurance that the objectives of such internal controls are met. Further, the design of an internal control system must reflect the fact that there are resource constraints, and the benefits of controls must be considered relative to their costs. Because of the inherent limitations in all internal control systems, no evaluation of controls can provide absolute assurance that all of our control issues and instances of fraud, if any, have been detected.
Management Report on Internal Control Over Financial Reporting
Management is responsible for establishing and maintaining adequate internal control over financial reporting as required by the Sarbanes-Oxley Act of 2002 and as defined in Exchange Act Rule 13a-15(f). Our system of internal control over financial reporting is designed to provide reasonable assurance to our management and Board of Directors regarding the reliability of our financial reporting and the preparation of financial statements for external purposes in accordance with U.S. generally accepted accounting principles. Internal control over financial reporting includes those policies and procedures that (i) pertain to the maintenance of records that in reasonable detail accurately and fairly reflect the transactions and dispositions of the assets; (ii) provide reasonable assurance that transactions are recorded as necessary to permit preparation of financial statements in accordance with U.S. generally accepted accounting principles, and that receipts and expenditures are being made only in accordance with authorizations of management and our Board of Directors; and (iii) provide reasonable assurance regarding prevention or timely detection of unauthorized acquisition, use or disposition of the Company’s assets that could have a material effect on the financial statements.
A system of internal control can provide only reasonable, not absolute, assurance that the objectives of the control system are met. Management, including the Chief Executive Officer and Chief Financial Officer, conducted an assessment of the effectiveness of the Company's internal control over financial reporting, as of December 31, 2017, based on the framework in Internal Control — Integrated Framework (2013) issued by the Committee of Sponsoring Organizations of the Treadway Commission (COSO). Based on this assessment, management has concluded that, as of December 31, 2017, our internal control over financial reporting was effective.
KPMG LLP, an independent registered public accounting firm, has issued an attestation report on our internal control over financial reporting as of December 31, 2017, which is included on page F-2.
ITEM 9B — OTHER INFORMATION
Not applicable.
PART III
ITEM 10 — DIRECTORS, EXECUTIVE OFFICERS AND CORPORATE GOVERNANCE
The information required by this item is set forth below or incorporated by reference to information under the caption “Proposal No. 1: Election of Directors” and to the information under the captions “Section 16(a) Beneficial Ownership Reporting Compliance” and “Board Operations" in Expeditors' definitive Proxy Statement for its annual meeting of shareholders to be held on May 8, 2018. See also Part I - Item 1 - Executive Officers of the Registrant.
Audit Committee and Audit Committee Financial Expert
Expeditors' Board has a separately-designated standing Audit Committee established in accordance with Section 3(a)(58)(A) of the Exchange Act. The members of the Audit Committee are Richard B. McCune, Alain Monié, Dan P. Kourkoumelis and James M. Dubois. Expeditors' Board has determined that Richard B. McCune, Chairman of the Audit Committee, is an audit committee financial expert as defined by Item 407(d)(5) of Regulation S-K under the Exchange Act and that each member of the Audit Committee is independent under the NASDAQ independence standards applicable to audit committee members.
Code of Ethics and Governance Guidelines
Expeditors has adopted a Code of Business Conduct that applies to all Expeditors employees including, of course, its principal executive officer and principal financial and accounting officer. The Code of Business Conduct is posted on Expeditors' website at https://investor.expeditors.com. Expeditors will post any amendments to the Code of Business Conduct at that location. In the unlikely event that the Board of Directors approves any sort of waiver to the Code of Business Conduct for Expeditors' executive officers or directors, information concerning such waiver will also be posted at that location. No such waivers have been granted.
ITEM 11 — EXECUTIVE COMPENSATION
The information required by this item is incorporated by reference to information under the captions “Director Compensation Program” and “Compensation Committee Report” in Expeditors' definitive Proxy Statement for its annual meeting of shareholders to be held on May 8, 2018.
31.
ITEM 12 — SECURITY OWNERSHIP OF CERTAIN BENEFICIAL OWNERS AND MANAGEMENT AND RELATED STOCKHOLDER MATTERS
The information required by this item is incorporated by reference to information under the captions “Shareholder Engagement and Stock Ownership Information” in Expeditors' definitive Proxy Statement for its annual meeting of shareholders to be held on May 8, 2018.
Securities Authorized for Issuance under Equity Compensation Plans
The following table provides information as of December 31, 2017, regarding compensation plans under which equity securities of Expeditors are authorized for issuance.
(a) (b) (c)
Plan Category
Number of Securitiesto be Issued Upon
Exercise ofOutstanding
Options, Warrantsand Rights (1)
Weighted-AverageExercise Price of
OutstandingOptions, Warrants
and Rights (2)
Number of SecuritiesAvailable for Future
Issuance Under Equity Compensation Plans (Excluding Securities
Reflected in Column (a)) (3)
Equity Compensation Plans Approved by Security Holders ...... 13,564,211 $ 44.36 3,399,854
Equity Compensation Plans Not Approved by Security Holders — — —
Total .......................................................................................... 13,564,211 $ 44.36 3,399,854
(1) Represents shares issuable upon exercise of outstanding stock options, vesting of outstanding restricted stock units under the Omnibus Incentive Plan and performance stock units that will vest if target levels are achieved.
(2) The weighted average exercise price does not take into account the shares issuable upon vesting of outstanding restricted stock units, which have no exercise price.
(3) Includes 1,409,217 available for issuance under the employee stock purchase plans, 1,884,387 available for future grants of equity awards under the Omnibus Incentive Plan and 106,250 available for issuance of restricted stock under the Director's Restricted Stock Plan.
ITEM 13 — CERTAIN RELATIONSHIPS AND RELATED TRANSACTIONS, AND DIRECTOR INDEPENDENCE
The information required by this item is incorporated by reference to information under the captions “Certain Relationships and Related Transactions” in Expeditors' definitive Proxy Statement for its annual meeting of shareholders to be held on May 8, 2018.
ITEM 14 — PRINCIPAL ACCOUNTING FEES AND SERVICES
The information required by this item is incorporated by reference to information under the caption “Relationship with Independent Registered Public Accounting Firm” in Expeditors' definitive Proxy Statement for its annual meeting of shareholders to be held on May 8, 2018.
PART IV
ITEM 15 — EXHIBITS, FINANCIAL STATEMENT SCHEDULES
Page(a) 1. FINANCIAL STATEMENTS
Reports of Independent Registered Public Accounting Firm .................................................................................. F-1 and F-2Consolidated Balance Sheets as of December 31, 2017 and 2016 ....................................................................... F-3Consolidated Statements of Earnings for the Years Ended December 31, 2017, 2016 and 2015 ......................... F-4Consolidated Statements of Comprehensive Income for the Years Ended December 31, 2017, 2016 and 2015.. F-5Consolidated Statements of Equity for the Years Ended December 31, 2017, 2016 and 2015 ............................. F-6 and F-7Consolidated Statements of Cash Flows for the Years Ended December 31, 2017, 2016 and 2015 ..................... F-8Notes to Consolidated Financial Statements ......................................................................................................... F-10 through F-24
2. FINANCIAL STATEMENT SCHEDULESSchedules are omitted because of the absence of conditions under which they are required or because therequired information is given in the consolidated financial statements or notes thereto.
3. EXECUTIVE COMPENSATION PLANS AND ARRANGEMENTS

32.
The following list is a subset of the list of exhibits described below and contains all compensatory plans, contracts or arrangements in which any director or executive officer of Expeditors is a participant, unless the method of allocation of benefits thereunder is the same for management and non-management participants:
(1) Form of Employment Agreement executed by Jeffrey S. Musser, Expeditors' President and Chief Executive Officer. See Exhibit 10.23.(2) Form of Employment Agreement executed by Expeditors' Chief Financial Officer. See Exhibit 10.25. (3) Form of Employment Agreement executed by Expeditors' President, Global Products. See Exhibit 10.27.(4) Expeditors' 2008 Executive Incentive Compensation Plan. See Exhibit 10.35.(5) Expeditors' 2014 Directors’ Restricted Stock Plan. See Exhibit 10.36.(6) Expeditors' 2002 Employee Stock Purchase Plan. See Exhibit 10.42.(7) Expeditors' amendment to the 2002 Employee Stock Purchase Plan. See Exhibit 10.42.1(8) Expeditors' 2007 Stock Option Plan. See Exhibit 10.49.(9) Form of Stock Option Agreement used in connection with Incentive options granted under Expeditors' 2007 Stock Option Plan. See
Exhibit 10.50.(10) Expeditors' 2008 Stock Option Plan. See Exhibit 10.51.(11) Form of Stock Option Agreement used in connection with options granted under Expeditors' 2008 Stock Option Plan. See Exhibit 10.52.(12) Expeditors' 2009 Stock Option Plan. See Exhibit 10.53.(13) Form of Stock Option Agreement used in connection with options granted under Expeditors' 2009 Stock Option Plan. See Exhibit 10.54.(14) Expeditors' 2010 Stock Option Plan. See Exhibit 10.55.(15) Form of Stock Option Agreement used in connection with options granted under Expeditors’ 2010 Stock Option Plan. See Exhibit 10.56.(16) Expeditors' 2011 Stock Option Plan. See Exhibit 10.57.(17) Form of Stock Option Agreement used in connection with options granted under Expeditors' 2011 Stock Option Plan. See Exhibit 10.58.(18) Expeditors' 2012 Stock Option Plan. See Exhibit 10.59.(19) Form of Stock Option Agreement used in connection with options granted under Expeditors' 2012 Stock Option Plan. See Exhibit 10.60.(20) Expeditors' 2013 Stock Option Plan. See Exhibit 10.61.(21) Form of Stock Option Agreement used in connection with options granted under Expeditors' 2013 Stock Option Plan. See Exhibit 10.62.(22) Expeditors' 2014 Stock Option Plan. See Exhibit 10.63.(23) Form of Stock Option Agreement used in connection with options granted under Expeditors; 2014 Stock Option Plan. See Exhibit 10.64.(24) Expeditors' 2015 Stock Option Plan. See Exhibit 10.65.(25) Form of Stock Option Agreement used in connection with options granted under Expeditors' 2015 Stock Option Plan. See Exhibit 10.66.(26) Expeditors' 2016 Stock Option Plan. See Exhibit 10.67.(27) Form of Stock Option Agreement used in connection with options granted under Expeditors' 2016 Stock Option Plan. See Exhibit 10.68.(28) Expeditors' 2017 Omnibus Incentive Plan. See Exhibit 10.69(29) Form of Executive Restricted Stock Unit Award Agreement used in connection with executive restricted stock units granted under
Expeditors' 2017 Omnibus Incentive Stock Plan. See Exhibit 10.70(30) Form of Performance Share Award Agreement used in connection with performance share units granted under Expeditors' 2017
Omnibus Incentive Stock Plan. See Exhibit 10.71
(b) EXHIBITS
Exhibit Number Exhibit
3.1 Expeditors' Restated Articles of Incorporation and the Articles of Amendment as amended
3.2
Expeditors' Amended and Restated Bylaws. (Incorporated by reference to Exhibit 3.2 to Form 8-K, filed on or about May 6, 2016.)
10.23
Form of Employment Agreement executed by Jeffrey S. Musser, Expeditors' President and Chief Executive Officer dated December 31, 2008. (Incorporated by reference to Exhibit 10.23 to Form 10-K, filed on or about February 26, 2015.)
10.25
Form of Employment Agreement executed by Expeditors' Chief Financial Officer dated December 31, 2008. (Incorporated by reference to Exhibit 10.25 to Form 10-K, filed on or about February 27, 2009.)
10.27 Form of Employment Agreement executed by Expeditors' President, Global Products. (Incorporated by reference to Exhibit 10.27 to Form 10-Q, filed on or about August 6, 2015.)
33.
10.35
Expeditors' 2008 Executive Incentive Compensation Plan. (Incorporated by reference to Appendix C of Expeditors' Notice of Annual Meeting of Shareholders and Proxy Statement pursuant to Regulation 14A filed on or about March 21, 2008.)
10.36
Expeditors' 2014 Directors’ Restricted Stock Plan. (Incorporated by reference to Appendix D of Expeditors' Notice of Annual Meeting of Shareholders and Proxy Statement pursuant to Regulation 14A filed on or about March 21, 2014.)
10.42
Expeditors' 2002 Employee Stock Purchase Plan. (Incorporated by reference to Appendix C of Expeditors' Notice of Annual Meeting of Shareholders and Proxy Statement pursuant to Regulation 14A filed on or about March 21, 2014.)
10.42.1
Expeditors' amendment to the 2002 Employee Stock Purchase Plan. (Incorporated by reference to Appendix C of Expeditors' Notice of Annual Meeting of Shareholders and Proxy Statement pursuant to Regulation 14A filed on or about March 21, 2014.)
10.49
Expeditors' 2007 Stock Option Plan. (Incorporated by reference to Appendix A of Expeditors' Notice of Annual Meeting of Shareholders and Proxy Statement pursuant to Regulation 14A filed on or about March 30, 2007.)
10.50
Form of Stock Option Agreement used in connection with Incentive options granted under Expeditors' 2007 Stock Option Plan. (Incorporated by reference to Exhibit 10.50 to Form 10-K filed on or about February 29, 2008.)
10.51
Expeditors' 2008 Stock Option Plan. (Incorporated by reference to Appendix A of Expeditors' Notice of Annual Meeting of Shareholders and Proxy Statement pursuant to Regulation 14A filed on or about March 21, 2008.)
10.52
Form of Stock Option Agreement used in connection with options granted under Expeditors' 2008 Stock Option Plan. (Incorporated by reference to Exhibit 10.52 to Form 10-K filed on or about February 27, 2009.)
10.53
Expeditors' 2009 Stock Option Plan. (Incorporated by reference to Appendix A of Expeditors' Notice of Annual Meeting of Shareholders and Proxy Statement pursuant to Regulation 14A filed on or about March 20, 2009.)
10.54
Form of Stock Option Agreement used in connection with options granted under Expeditors' 2009 Stock Option Plan. (Incorporated by reference to Exhibit 10.2 to Form 8-K filed on or about May 11, 2009.)
10.55 Expeditors' 2010 Stock Option Plan. (Incorporated by reference to Appendix A of Expeditors' Notice of Annual Meeting ofShareholders and Proxy Statement pursuant to Regulation 14A filed on or about March 19, 2010.)
10.56 Form of Stock Option Agreement used in connection with options granted under Expeditors' 2010 Stock Option Plan.(Incorporated by reference to Appendix B of Expeditors' Notice of Annual Meeting of Shareholders and Proxy Statementpursuant to Regulation 14A filed on or about March 19, 2010.)
10.57 Expeditors' 2011 Stock Option Plan. (Incorporated by reference to Appendix A of Expeditors' Notice of Annual Meeting ofShareholders and Proxy Statement pursuant to Regulation 14A filed on or about March 18, 2011.)
10.58 Form of Stock Option Agreement used in connection with options granted under Expeditors' 2011 Stock Option Plan.(Incorporated by reference to Appendix B of Expeditors' Notice of Annual Meeting of Shareholders and Proxy Statementpursuant to Regulation 14A filed on or about March 18, 2011.)
10.59 Expeditors' 2012 Stock Option Plan. (Incorporated by reference to Appendix A of Expeditors' Notice of Annual Meeting ofShareholders and Proxy Statement pursuant to Regulation 14A filed on or about March 20, 2012.)
10.60 Form of Stock Option Agreement used in connection with options granted under Expeditors' 2012 Stock Option Plan.(Incorporated by reference to Appendix B of Expeditors' Notice of Annual Meeting of Shareholders and Proxy Statementpursuant to Regulation 14A filed on or about March 20, 2012.)
10.61 Expeditors' 2013 Stock Option Plan. (Incorporated by reference to Appendix A of Expeditors' Notice of Annual Meeting ofShareholders and Proxy Statement pursuant to Regulation 14A filed on or about March 29, 2013.)
10.62 Form of Stock Option Agreement used in connection with options granted under Expeditors' 2013 Stock Option Plan.(Incorporated by reference to Appendix B of Expeditors' Notice of Annual Meeting of Shareholders and Proxy Statementpursuant to Regulation 14A filed on or about March 29, 2013.)
10.63 Expeditors' 2014 Stock Option Plan. (Incorporated by reference to Appendix A of Expeditors' Notice of Annual Meeting ofShareholders and Proxy Statement pursuant to Regulation 14A filed on or about March 21, 2014.)
10.64 Form of Stock Option Agreement used in connection with options granted under Expeditors' 2014 Stock Option Plan.(Incorporated by reference to Appendix B of Expeditors' Notice of Annual Meeting of Shareholders and Proxy Statementpursuant to Regulation 14A filed on or about March 21, 2014.)
10.65 Expeditors' 2015 Stock Option Plan. (Incorporated by reference to Appendix A of Expeditors' Notice of Annual Meeting ofShareholders and Proxy Statement pursuant to Regulation 14A filed on or about April 9, 2015.)
10.66 Form of Stock Option Agreement used in connection with options granted under Expeditors' 2015 Stock Option Plan.(Incorporated by reference to Appendix B of Expeditors' Notice of Annual Meeting of Shareholders and Proxy Statementpursuant to Regulation 14A filed on or about April 9, 2015.)

34.
10.67 Expeditors' 2016 Stock Option Plan. (Incorporated by reference to Appendix A of Expeditors' Notice of Annual Meeting ofShareholders and Proxy Statement pursuant to Regulation 14A filed on or about March 24, 2016.)
10.68 Form of Stock Option Agreement used in connection with options granted under Expeditors' 2016 Stock Option Plan.(Incorporated by reference to Appendix B of Expeditors' Notice of Annual Meeting of Shareholders and Proxy Statementpursuant to Regulation 14A filed on or about March 24, 2016.)
10.69 Expeditors' 2017 Omnibus Incentive Plan. (Incorporated by reference to Exhibit 10.69 to Form S-8 Registration filed on orabout May 16, 2017.)
10.70 Form of Executive Restricted Stock Unit Award Agreement used in connection with executive restricted stock unitsgranted under Expeditors' 2017 Omnibus Incentive Plan. (Incorporated by reference to Exhibit 10.70 to Form S-8 filed onor about May 16, 2017.)
10.71 Form of Performance Share Award Agreement used in connection with performance share units granted underExpeditors' 2017 Omnibus Incentive Plan. (Incorporated by reference to Exhibit 10.71 to Form S-8 filed on or about May16, 2017.)
21.1 Subsidiaries of the registrant.
23.1 Consent of Independent Registered Public Accounting Firm.
31.1 Certification of Chief Executive Officer pursuant to Section 302 of the Sarbanes-Oxley Act of 2002.
31.2 Certification of Chief Financial Officer pursuant to Section 302 of the Sarbanes-Oxley Act of 2002.
32 Certification pursuant to 18 U.S.C. Section 1350, as adopted pursuant to Section 906 of the Sarbanes-Oxley Act of 2002.
101.INS XBRL Instance Document.
101.SCH XBRL Taxonomy Extension Schema Document.
101.CAL XBRL Taxonomy Extension Calculation Linkbase Document.
101.LAB XBRL Taxonomy Extension Label Linkbase Document.
101.PRE XBRL Taxonomy Extension Presentation Linkbase Document.
101.DEF XBRL Taxonomy Extension Definition Linkbase Document.
ITEM 16 — FORM 10-K SUMMARY
None.
35.
SIGNATURESPursuant to the requirements of Section 13 or 15(d) of the Securities Exchange Act of 1934, the registrant has duly caused this report to be signed on its behalf by the undersigned, thereunto duly authorized.Date: February 23, 2018
EXPEDITORS INTERNATIONAL OF WASHINGTON, INC.
By: /s/ Bradley S. Powell
Bradley S. Powell
Senior Vice President and Chief Financial Officer
Pursuant to the requirements of the Securities Exchange Act of 1934, this report has been signed below by the following persons on behalf of the registrant and in the capacities indicated on February 23, 2018.
Signature Title
/s/ Jeffrey S. Musser President, Chief Executive Officer and Director(Jeffrey S. Musser) (Principal Executive Officer)
/s/ Bradley S. Powell Senior Vice President and Chief Financial Officer(Bradley S. Powell) (Principal Financial and Accounting Officer)
/s/ Robert R. Wright Chairman of the Board and Director(Robert R. Wright)
/s/ Glenn M. Alger Director(Glenn M. Alger)
/s/ James M. DuBois Director(James M. DuBois)
/s/ Mark A. Emmert Director(Mark A. Emmert)
/s/ Diane H. Gulyas Director(Diane H. Gulyas)
/s/ Dan P. Kourkoumelis Director(Dan P. Kourkoumelis)
/s/ Richard B. McCune Director(Richard B. McCune)
/s/ Alain Monié Director(Alain Monié)
/s/ Liane J. Pelletier Director(Liane J. Pelletier)
/s/ Tay Yoshitani Director(Tay Yoshitani)

EXPEDITORS INTERNATIONAL OF WASHINGTON, INC.
AND SUBSIDIARIES
CONSOLIDATED FINANCIAL STATEMENTS
COMPRISING ITEM 8
ANNUAL REPORT ON FORM 10-K
TO SECURITIES AND EXCHANGE COMMISSION FOR THE
YEARS ENDED DECEMBER 31, 2017, 2016, AND 2015
F-1
Report of Independent Registered Public Accounting Firm
To the Stockholders and Board of DirectorsExpeditors International of Washington, Inc.:
Opinion on the Consolidated Financial Statements
We have audited the accompanying consolidated balance sheets of Expeditors International of Washington, Inc. and subsidiaries (the Company) as of December 31, 2017 and 2016, the related consolidated statements of earnings, comprehensive income, equity, and cash flows for each of the years in the three year period ended December 31, 2017, and the related notes (collectively, the consolidated financial statements). In our opinion, the consolidated financial statements present fairly, in all material respects, the financial position of the Company as of December 31, 2017 and 2016, and the results of its operations and its cash flows for each of the years in the three year period ended December 31, 2017, in conformity with U.S. generally accepted accounting principles.
We also have audited, in accordance with the standards of the Public Company Accounting Oversight Board (United States) (PCAOB), the Company’s internal control over financial reporting as of December 31, 2017, based on criteria established in Internal Control - Integrated Framework (2013) issued by the Committee of Sponsoring Organizations of the Treadway Commission, and our report dated February 23, 2018expressed an unqualified opinion on the effectiveness of the Company’s internal control over financial reporting.
Basis for Opinion
These consolidated financial statements are the responsibility of the Company’s management. Our responsibility is to express an opinion on these consolidated financial statements based on our audits. We are a public accounting firm registered with the PCAOB and are required to be independent with respect to the Company in accordance with the U.S. federal securities laws and the applicable rules and regulations of the Securities and Exchange Commission and the PCAOB.
We conducted our audits in accordance with the standards of the PCAOB. Those standards require that we plan and perform the audit to obtain reasonable assurance about whether the consolidated financial statements are free of material misstatement, whether due to error or fraud. Our audits included performing procedures to assess the risks of material misstatement of the consolidated financial statements, whether due to error or fraud, and performing procedures that respond to those risks. Such procedures included examining, on a test basis, evidence regarding the amounts and disclosures in the consolidated financial statements. Our audits also included evaluating the accounting principles used and significant estimates made by management, as well as evaluating the overall presentation of the consolidated financial statements. We believe that our audits provide a reasonable basis for our opinion.
/s/ KPMG LLP
We have served as the Company's auditor since 1982.
Seattle, Washington February 23, 2018

F-2
Report of Independent Registered Public Accounting Firm
To the Stockholders and Board of DirectorsExpeditors International of Washington, Inc.:
Opinion on Internal Control Over Financial Reporting
We have audited Expeditors International of Washington, Inc.’s and subsidiaries' (the Company) internal control over financial reporting as of December 31, 2017, based on criteria established in Internal Control - Integrated Framework (2013) issued by the Committee of Sponsoring Organizations of the Treadway Commission. In our opinion, the Company maintained, in all material respects, effective internal control over financial reporting as of December 31, 2017, based on criteria established in Internal Control - Integrated Framework (2013) issued by the Committee of Sponsoring Organizations of the Treadway Commission.
We also have audited, in accordance with the standards of the Public Company Accounting Oversight Board (United States) (PCAOB), the consolidated balance sheets of the Company as of December 31, 2017 and 2016, the related consolidated statements of earnings, comprehensive income, equity, and cash flows for each of the years in the three-year period ended December 31, 2017, and the related notes (collectively, the consolidated financial statements), and our report dated February 23, 2018 expressed an unqualified opinion on those consolidated financial statements.
Basis for Opinion
The Company’s management is responsible for maintaining effective internal control over financial reporting and for its assessment of the effectiveness of internal control over financial reporting, included in the accompanying Management Report on Internal Control Over Financial Reporting. Our responsibility is to express an opinion on the Company’s internal control over financial reporting based on our audit. We are a public accounting firm registered with the PCAOB and are required to be independent with respect to the Company in accordance with the U.S. federal securities laws and the applicable rules and regulations of the Securities and Exchange Commission and the PCAOB.
We conducted our audit in accordance with the standards of the PCAOB. Those standards require that we plan and perform the audit to obtain reasonable assurance about whether effective internal control over financial reporting was maintained in all material respects. Our audit of internal control over financial reporting included obtaining an understanding of internal control over financial reporting, assessing the risk that a material weakness exists, and testing and evaluating the design and operating effectiveness of internal control based on the assessed risk. Our audit also included performing such other procedures as we considered necessary in the circumstances. We believe that our audit provides a reasonable basis for our opinion.
Definition and Limitations of Internal Control Over Financial Reporting
A company’s internal control over financial reporting is a process designed to provide reasonable assurance regarding the reliability of financial reporting and the preparation of financial statements for external purposes in accordance with generally accepted accounting principles. A company’s internal control over financial reporting includes those policies and procedures that (1) pertain to the maintenance of records that, in reasonable detail, accurately and fairly reflect the transactions and dispositions of the assets of the company; (2) provide reasonable assurance that transactions are recorded as necessary to permit preparation of financial statements in accordance with generally accepted accounting principles, and that receipts and expenditures of the company are being made only in accordance with authorizations of management and directors of the company; and (3) provide reasonable assurance regarding prevention or timely detection of unauthorized acquisition, use, or disposition of the company’s assets that could have a material effect on the financial statements.
Because of its inherent limitations, internal control over financial reporting may not prevent or detect misstatements. Also, projections of any evaluation of effectiveness to future periods are subject to the risk that controls may become inadequate because of changes in conditions, or that the degree of compliance with the policies or procedures may deteriorate.
/s/ KPMG LLP Seattle, Washington February 23, 2018
F-3.
Consolidated Balance SheetsIn thousands, except per share data
December 31, 2017 2016Current Assets:Cash and cash equivalents .................................................................................................................. $ 1,051,099 974,435Accounts receivable, less allowance for doubtful accounts of $12,858 in 2017 and $9,247 in 2016 .... 1,414,741 1,190,130Other .................................................................................................................................................... 75,612 54,014
Total current assets ................................................................................................................. 2,541,452 2,218,579Property and equipment, net ................................................................................................................ 525,203 536,572Goodwill ............................................................................................................................................... 7,927 7,927Deferred Federal and state income taxes, net ..................................................................................... 13,207 —Other assets, net .................................................................................................................................. 29,219 27,793
Total assets ............................................................................................................................. $ 3,117,008 2,790,871
Current Liabilities:Accounts payable ................................................................................................................................. $ 866,305 726,571Accrued expenses, primarily salaries and related costs ....................................................................... 206,320 185,502Federal, state and foreign income taxes .............................................................................................. 20,494 17,858
Total current liabilities ............................................................................................................. 1,093,119 929,931Noncurrent Federal income tax payable ............................................................................................... 29,516 —Deferred Federal and state income taxes, net ..................................................................................... — 13,727Commitments and contingencies
Shareholders’ Equity:Preferred stock, par value $0.01 per share, authorized 2,000 shares; none issued ............................. — —Common stock, par value $0.01 per share, authorized 640,000 shares;
issued and outstanding 176,374 shares at December 31, 2017and 179,857 shares at December 31, 2016 ................................................................................. 1,764 1,799
Additional paid-in capital ...................................................................................................................... 546 2,642Retained earnings ................................................................................................................................ 2,063,512 1,944,789Accumulated other comprehensive loss ............................................................................................... (73,964) (104,592)
Total shareholders’ equity ............................................................................................................. 1,991,858 1,844,638Noncontrolling interest ......................................................................................................................... 2,515 2,575
Total equity ................................................................................................................................... 1,994,373 1,847,213Total liabilities and equity ........................................................................................................ $ 3,117,008 2,790,871
See accompanying notes to consolidated financial statements.

F-4.
Consolidated Statements of EarningsIn thousands, except per share data
Years ended December 31, 2017 2016 2015Revenues:Airfreight services ..................................................................................... $ 2,877,032 2,453,347 2,740,583Ocean freight and ocean services ............................................................ 2,107,045 1,917,494 2,194,004Customs brokerage and other services .................................................... 1,936,871 1,727,196 1,682,045
Total revenues ..................................................................................... 6,920,948 6,098,037 6,616,632Operating Expenses:Airfreight services ..................................................................................... 2,126,761 1,752,167 1,987,690Ocean freight and ocean services ............................................................ 1,543,740 1,378,699 1,648,993Customs brokerage and other services .................................................... 931,258 803,135 792,172Salaries and related costs ........................................................................ 1,267,120 1,157,635 1,143,511Rent and occupancy costs ........................................................................ 119,732 108,812 102,470Depreciation and amortization .................................................................. 49,310 46,796 46,012Selling and promotion ............................................................................... 44,290 41,763 41,990Other ........................................................................................................ 138,477 138,867 132,310
Total operating expenses .................................................................... 6,220,688 5,427,874 5,895,148Operating income ................................................................................ 700,260 670,163 721,484
Other Income (Expense):Interest income ......................................................................................... 13,204 11,580 10,421Other, net .................................................................................................. 5,131 5,113 4,784
Other income, net ................................................................................ 18,335 16,693 15,205Earnings before income taxes .................................................................. 718,595 686,856 736,689Income tax expense ................................................................................. 228,212 254,323 277,192
Net earnings ........................................................................................ 490,383 432,533 459,497
Less net earnings attributable to the noncontrolling interest ..................... 1,038 1,726 2,274Net earnings attributable to shareholders ............................................ $ 489,345 430,807 457,223
Diluted earnings attributable to shareholders per share ........................... $ 2.69 2.36 2.40Basic earnings attributable to shareholders per share .............................. $ 2.73 2.38 2.42Weighted average diluted shares outstanding .......................................... 181,666 182,704 190,223Weighted average basic shares outstanding ............................................ 179,247 181,282 188,941
See accompanying notes to consolidated financial statements.
F-5.
Consolidated Statements of Comprehensive IncomeIn thousands
Years ended December 31, 2017 2016 2015Net earnings .............................................................................................. $ 490,383 432,533 459,497Other comprehensive income (loss), net of tax:Foreign currency translation adjustments, net of tax of $16,761 in 2017,$12,687 in 2016 and $23,801 in 2015 ....................................................... 30,434 (23,743) (44,090)
Other comprehensive income (loss) ....................................................... 30,434 (23,743) (44,090)Comprehensive income .......................................................................... 520,817 408,790 415,407
Less comprehensive income attributable to the noncontrolling interest .... 844 1,337 1,605Comprehensive income attributable to shareholders .............................. $ 519,973 407,453 413,802
See accompanying notes to consolidated financial statements.

F-6.
Consolidated Statements of Equity In thousands, except per share dataYears ended December 31, 2017, 2016 and 2015
Common Stock
Shares Par ValueBalance at December 31, 2014 ............................................................................................................................... 191,656 $ 1,916Exercise of stock options and release of restricted shares ...................................................................................... 2,851 29Issuance of shares under stock purchase plan ........................................................................................................ 699 7Shares repurchased under provisions of stock repurchase plans ............................................................................ (13,139) (131)Stock compensation expense .................................................................................................................................. — —Tax benefits from stock plans, net ............................................................................................................................ — —Net earnings ............................................................................................................................................................ — —Other comprehensive loss ....................................................................................................................................... — —Dividends paid ($0.72 per share) ............................................................................................................................. — —Distributions of dividends to noncontrolling interest ................................................................................................. — —Balance at December 31, 2015 ............................................................................................................................... 182,067 1,821Exercise of stock options and release of restricted shares ...................................................................................... 3,769 38Issuance of shares under stock purchase plan ........................................................................................................ 703 7Shares repurchased under provisions of stock repurchase plans ............................................................................ (6,682) (67)Stock compensation expense .................................................................................................................................. — —Tax benefits from stock plans, net ............................................................................................................................ — —Net earnings ............................................................................................................................................................ — —Other comprehensive loss ....................................................................................................................................... — —Dividends paid ($0.80 per share) ............................................................................................................................. — —Purchase of noncontrolling interest — —Distributions of dividends to noncontrolling interest ................................................................................................. — —Balance at December 31, 2016 ............................................................................................................................... 179,857 1,799Exercise of stock options and release of restricted shares ...................................................................................... 4,058 40Issuance of shares under stock purchase plan ........................................................................................................ 682 7Shares repurchased under provisions of stock repurchase plans ............................................................................ (8,223) (82)Stock compensation expense .................................................................................................................................. — —Net earnings ............................................................................................................................................................ — —Other comprehensive income (loss) ........................................................................................................................ — —Dividends paid ($0.84 per share) ............................................................................................................................. — —Distributions of dividends to noncontrolling interest ................................................................................................. — —Balance at December 31, 2017 ............................................................................................................................... 176,374 $ 1,764
F-7.
Additionalpaid-incapital
Retainedearnings
Accumulated othercomprehensive
loss
Totalshareholders’
equityNoncontrolling
interestTotal
equity $ 1,113 1,903,196 (37,817) 1,868,408 3,200 1,871,608
105,085 — — 105,114 — 105,11425,843 — — 25,850 — 25,850
(176,493) (453,367) — (629,991) — (629,991)43,415 — — 43,415 — 43,4151,068 — — 1,068 — 1,068
— 457,223 — 457,223 2,274 459,497— — (43,421) (43,421) (669) (44,090)— (135,673) — (135,673) — (135,673)— — — — (2,122) (2,122)31 1,771,379 (81,238) 1,691,993 2,683 1,694,676
157,139 — — 157,177 — 157,17728,129 — — 28,136 — 28,136
(225,317) (112,274) — (337,658) — (337,658)45,217 — — 45,217 — 45,217(2,664) — — (2,664) — (2,664)
— 430,807 — 430,807 1,726 432,533— — (23,354) (23,354) (389) (23,743)— (145,123) — (145,123) — (145,123)
107 107 (110) (3)— — — — (1,335) (1,335)
2,642 1,944,789 (104,592) 1,844,638 2,575 1,847,213176,285 — — 176,325 — 176,32528,760 — — 28,767 — 28,767
(258,049) (220,127) — (478,258) — (478,258)50,908 — — 50,908 — 50,908
— 489,345 — 489,345 1,038 490,383— — 30,628 30,628 (194) 30,434— (150,495) — (150,495) — (150,495)— — — — (904) (904)
$ 546 2,063,512 (73,964) 1,991,858 2,515 1,994,373
See accompanying notes to consolidated financial statements.
F-6.
Consolidated Statements of Equity In thousands, except per share dataYears ended December 31, 2017, 2016 and 2015
Common Stock
Shares Par ValueBalance at December 31, 2014 ............................................................................................................................... 191,656 $ 1,916Exercise of stock options and release of restricted shares ...................................................................................... 2,851 29Issuance of shares under stock purchase plan ........................................................................................................ 699 7Shares repurchased under provisions of stock repurchase plans ............................................................................ (13,139) (131)Stock compensation expense .................................................................................................................................. — —Tax benefits from stock plans, net ............................................................................................................................ — —Net earnings ............................................................................................................................................................ — —Other comprehensive loss ....................................................................................................................................... — —Dividends paid ($0.72 per share) ............................................................................................................................. — —Distributions of dividends to noncontrolling interest ................................................................................................. — —Balance at December 31, 2015 ............................................................................................................................... 182,067 1,821Exercise of stock options and release of restricted shares ...................................................................................... 3,769 38Issuance of shares under stock purchase plan ........................................................................................................ 703 7Shares repurchased under provisions of stock repurchase plans ............................................................................ (6,682) (67)Stock compensation expense .................................................................................................................................. — —Tax benefits from stock plans, net ............................................................................................................................ — —Net earnings ............................................................................................................................................................ — —Other comprehensive loss ....................................................................................................................................... — —Dividends paid ($0.80 per share) ............................................................................................................................. — —Purchase of noncontrolling interest — —Distributions of dividends to noncontrolling interest ................................................................................................. — —Balance at December 31, 2016 ............................................................................................................................... 179,857 1,799Exercise of stock options and release of restricted shares ...................................................................................... 4,058 40Issuance of shares under stock purchase plan ........................................................................................................ 682 7Shares repurchased under provisions of stock repurchase plans ............................................................................ (8,223) (82)Stock compensation expense .................................................................................................................................. — —Net earnings ............................................................................................................................................................ — —Other comprehensive income (loss) ........................................................................................................................ — —Dividends paid ($0.84 per share) ............................................................................................................................. — —Distributions of dividends to noncontrolling interest ................................................................................................. — —Balance at December 31, 2017 ............................................................................................................................... 176,374 $ 1,764

F-7.
Additionalpaid-incapital
Retainedearnings
Accumulated othercomprehensive
loss
Totalshareholders’
equityNoncontrolling
interestTotal
equity $ 1,113 1,903,196 (37,817) 1,868,408 3,200 1,871,608
105,085 — — 105,114 — 105,11425,843 — — 25,850 — 25,850
(176,493) (453,367) — (629,991) — (629,991)43,415 — — 43,415 — 43,4151,068 — — 1,068 — 1,068
— 457,223 — 457,223 2,274 459,497— — (43,421) (43,421) (669) (44,090)— (135,673) — (135,673) — (135,673)— — — — (2,122) (2,122)31 1,771,379 (81,238) 1,691,993 2,683 1,694,676
157,139 — — 157,177 — 157,17728,129 — — 28,136 — 28,136
(225,317) (112,274) — (337,658) — (337,658)45,217 — — 45,217 — 45,217(2,664) — — (2,664) — (2,664)
— 430,807 — 430,807 1,726 432,533— — (23,354) (23,354) (389) (23,743)— (145,123) — (145,123) — (145,123)
107 107 (110) (3)— — — — (1,335) (1,335)
2,642 1,944,789 (104,592) 1,844,638 2,575 1,847,213176,285 — — 176,325 — 176,32528,760 — — 28,767 — 28,767
(258,049) (220,127) — (478,258) — (478,258)50,908 — — 50,908 — 50,908
— 489,345 — 489,345 1,038 490,383— — 30,628 30,628 (194) 30,434— (150,495) — (150,495) — (150,495)— — — — (904) (904)
$ 546 2,063,512 (73,964) 1,991,858 2,515 1,994,373
See accompanying notes to consolidated financial statements.
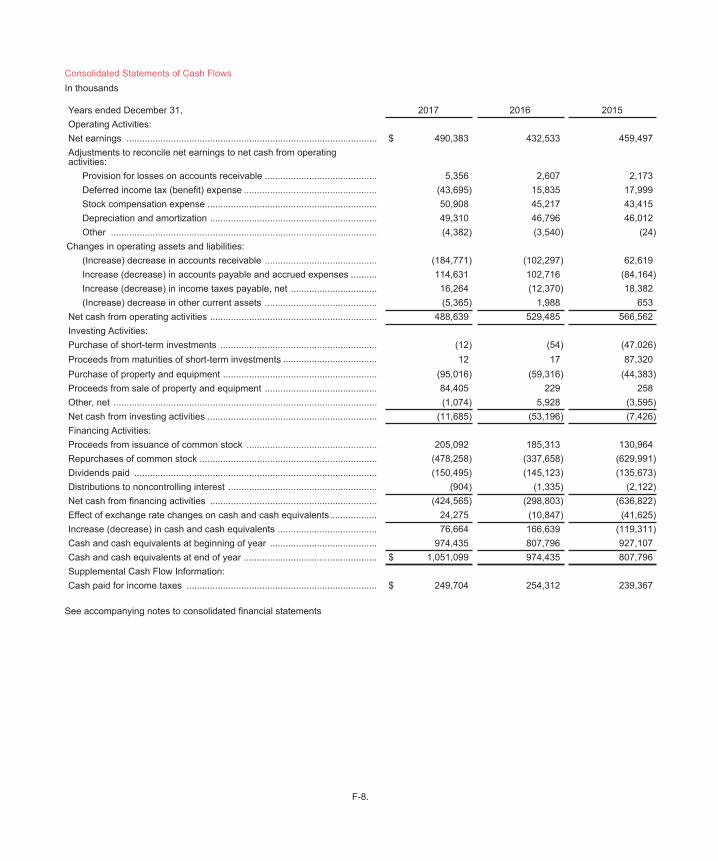
F-8.
Consolidated Statements of Cash FlowsIn thousands
Years ended December 31, 2017 2016 2015Operating Activities:Net earnings ................................................................................................ $ 490,383 432,533 459,497Adjustments to reconcile net earnings to net cash from operatingactivities:
Provision for losses on accounts receivable ........................................... 5,356 2,607 2,173Deferred income tax (benefit) expense ................................................... (43,695) 15,835 17,999Stock compensation expense ................................................................. 50,908 45,217 43,415Depreciation and amortization ................................................................ 49,310 46,796 46,012Other ...................................................................................................... (4,382) (3,540) (24)
Changes in operating assets and liabilities:(Increase) decrease in accounts receivable ........................................... (184,771) (102,297) 62,619Increase (decrease) in accounts payable and accrued expenses .......... 114,631 102,716 (84,164)Increase (decrease) in income taxes payable, net ................................. 16,264 (12,370) 18,382(Increase) decrease in other current assets ........................................... (5,365) 1,988 653
Net cash from operating activities ................................................................ 488,639 529,485 566,562Investing Activities:Purchase of short-term investments ............................................................ (12) (54) (47,026)Proceeds from maturities of short-term investments .................................... 12 17 87,320Purchase of property and equipment ........................................................... (95,016) (59,316) (44,383)Proceeds from sale of property and equipment ........................................... 84,405 229 258Other, net ..................................................................................................... (1,074) 5,928 (3,595)Net cash from investing activities ................................................................. (11,685) (53,196) (7,426)Financing Activities:Proceeds from issuance of common stock .................................................. 205,092 185,313 130,964Repurchases of common stock .................................................................... (478,258) (337,658) (629,991)Dividends paid ............................................................................................. (150,495) (145,123) (135,673)Distributions to noncontrolling interest ......................................................... (904) (1,335) (2,122)Net cash from financing activities ................................................................ (424,565) (298,803) (636,822)Effect of exchange rate changes on cash and cash equivalents.................. 24,275 (10,847) (41,625)Increase (decrease) in cash and cash equivalents ...................................... 76,664 166,639 (119,311)Cash and cash equivalents at beginning of year ......................................... 974,435 807,796 927,107Cash and cash equivalents at end of year ................................................... $ 1,051,099 974,435 807,796Supplemental Cash Flow Information:Cash paid for income taxes ......................................................................... $ 249,704 254,312 239,367
See accompanying notes to consolidated financial statements
F-9.
[This page intentionally left blank]

F-9.
[This page intentionally left blank]

F-10.
NOTES TO CONSOLIDATED FINANCIAL STATEMENTS
NOTE 1. SUMMARY OF SIGNIFICANT ACCOUNTING POLICIES
A. | Basis of Presentation
Expeditors International of Washington, Inc. (the "Company”) is a non-asset based provider of global logistics services operating through a worldwide network of offices and exclusive or non-exclusive agents. The Company’s customers include retailing and wholesaling, electronics, industrial and manufacturing companies around the world.
International trade is influenced by many factors, including economic and political conditions in the United States and abroad, currency exchange rates and currency control regulations, regulatory environments, cargo and other security concerns, laws and policies relating to tariffs, trade and quota restrictions, foreign investments and taxation. Periodically, governments consider a variety of changes to current tariffs and trade restrictions and accords. The Company cannot predict which, if any, of these proposals may be adopted, nor can the Company predict the effects adoption of any such proposal will have on the Company’s business. Doing business in foreign locations also subjects the Company to a variety of risks and considerations not normally encountered by domestic enterprises. In addition to being influenced by governmental policies concerning international trade and commerce, the Company’s business may also be affected by political developments and changes in government personnel or policies as well as economic turbulence, political unrest and security concerns in the nations in which it does business and the future impact that these events may have on international trade including impact on oil prices.
The consolidated financial statements have been prepared pursuant to the rules and regulations of the Securities and Exchange Commission in accordance with accounting principles generally accepted in the United States (U.S. GAAP). The consolidated financial statements include the accounts of the Company and its subsidiaries stated in U.S. dollars, the Company’s reporting currency. In addition, the consolidated financial statements also include the accounts of operating entities where the Company maintains a parent-subsidiary relationship through unilateral control over assets and operations together with responsibility for payment of all liabilities, notwithstanding a lack of technical majority ownership of the subsidiary's common stock.
All significant intercompany accounts and transactions have been eliminated in consolidation. All dollar amounts in the notes are presented in thousands except for per share data or unless otherwise specified. Certain prior year amounts have been reclassified to conform to the 2017 presentation. See Note 1.F below for further information.
B. | Cash Equivalents
All highly liquid investments with a maturity of three months or less at date of purchase are considered to be cash equivalents.
C. | Accounts Receivable
The Company maintains an allowance for doubtful accounts, which is reviewed at least monthly for estimated losses resulting from the inability of its customers to make required payments for services and advances. Additional allowances may be necessary in the future if the ability of its customers to pay deteriorates. The Company has recorded an allowance for doubtful accounts in the amounts of $12,858, $9,247 and $7,820 as of December 31, 2017, 2016 and 2015, respectively. Additions and write-offs have not been significant in any of these years.
D. | Long-Lived Assets, Depreciation and Amortization
Property and equipment are recorded at cost and are depreciated or amortized on the straight-line method over the shorter of the assets’ estimated useful lives or lease terms. Useful lives for major categories of property and equipment are as follows:
Buildings and land improvements ..................................................................................................................... 30 to 40 yearsBuilding improvements ..................................................................................................................................... 3 to 10 yearsFurniture, fixtures, equipment and purchased software .................................................................................... 3 to 10 years
Expenditures for maintenance, repairs, and replacements of minor items are charged to earnings as incurred. Major upgrades and improvements that extend the life of the asset are capitalized. Upon disposition, the cost and related accumulated depreciation are removed from the accounts and the resulting gain or loss is included in income for the period.
For the years ended December 31, 2017 and 2016, the Company performed the required goodwill annual impairment test during the fourth quarter and determined that no impairment had occurred.
E. | Revenues and Revenue Recognition
The Company derives its revenues from three principal sources: 1) airfreight services, 2) ocean freight and ocean services, and 3) customs brokerage and other services. These are the revenue categories presented in the financial statements.
F-11.
As a non-asset based carrier, the Company does not own transportation assets. Rather, the Company generates the major portion of its air and ocean freight revenues by purchasing transportation services from direct (asset-based) carriers and reselling those services to its customers. The difference between the rate billed to customers (the sell rate) and the rate paid to the carrier (the buy rate) is termed “net revenue” (a non-GAAP measure), “yield” or "margin." By consolidating shipments from multiple customers and concentrating its buying power, the Company is able to negotiate favorable buy rates from the direct carriers, while at the same time offering lower sell rates than most customers would otherwise be able to negotiate themselves.
Airfreight services revenues include the charges to the Company for carrying the shipments when the Company acts as a freight consolidator. Ocean freight services revenues include the charges to the Company for carrying the shipments when the Company acts as a Non-Vessel Operating Common Carrier (NVOCC). In each case the Company is acting as an indirect carrier. When acting as an indirect carrier, the Company will issue a House Airway Bill (HAWB), a House Ocean Bill of Lading (HOBL) or a House Seaway Bill to customers as the contract of carriage. In turn, when the freight is physically tendered to a direct carrier, the Company receives a contract of carriage known as a Master Airway Bill for airfreight shipments and a Master Ocean Bill of Lading for ocean shipments. At this point, the risk of loss passes to the carrier, however, in order to claim for any such loss, the customer is first obligated to pay the freight charges. In these transactions, the Company evaluates whether it is appropriate to record the gross or net amount as revenue. Generally, when the Company is the primary obligor, it is obligated to compensate direct carriers for services performed regardless of whether customers accept the service, has latitude in establishing price, has discretion in selecting the direct carrier, has credit risk or has several but not all of these indicators, revenue is recorded on a gross basis. Revenue is generally recorded on a net basis where the Company is not primarily obligated and does not have latitude in establishing prices. Such amounts earned are determined using a fixed fee, a per unit of activity fee or a combination thereof.
Based upon the terms in the contract of carriage, revenues related to shipments where the Company issues a HAWB, a HOBL or a House Seaway Bill are recognized at the time the freight is tendered to the direct carrier at origin. Costs related to the shipments are also recognized at this same time.
Revenues earned in other capacities, for instance, when the Company acts as an agent for the shipper, and does not issue a HAWB, a HOBL or a House Seaway Bill, include only the commissions and fees earned for the services performed. In these transactions, the Company is not a principal and reports only commissions and fees earned in revenue. These revenues are recognized upon completion of the services.
Customs brokerage and other services involves providing services at destination, such as helping customers clear shipments through customs by preparing required documentation, calculating and providing for payment of duties and other taxes on behalf of the customers as well as arranging for any required inspections by governmental agencies, and arranging for delivery. This is a complicated function requiring technical knowledge of customs rules and regulations in the multitude of countries in which the Company has offices. Revenues related to customs brokerage and other services are recognized upon completion of the services. Arranging international shipments is a complex task. Each actual movement can require multiple services. In some instances, the Company is asked to perform only one of these services. However, in most instances, the Company performs multiple services. These services include ancillary services such as local transportation, export customs formalities, distribution services and logistics management. Each of these services has an associated fee which is recognized as revenue upon completion of the service.
Typically, the fees for each of these services are quoted as separate components; however, customers on occasion will request an all-inclusive rate for a set of services known in the industry as “door-to-door service.” This means that the customer is billed a single rate for all services from pickup at origin to delivery at destination. In these instances, the revenue for origin and destination services, as well as revenue that will be characterized as freight charges, is allocated to branches as set by preexisting Company policy modified as agreed upon by customer specific negotiations between the offices involved. Each of the Company’s branches are separate profit centers and the primary compensation for the branch management group comes in the form of incentive-based compensation calculated directly from the operating income of that branch. This compensation structure ensures that the allocation of revenue and expense among components of services, when provided under an all-inclusive rate, is done in an objective manner on a relative selling price basis.
The Company presents revenues net of sales and value-added taxes.
F. | Income Taxes
Income taxes are accounted for under the asset and liability method of accounting. Under this method, deferred tax assets and liabilities are recognized for the future tax consequences attributed to differences between the financial statement carrying amounts of existing assets and liabilities and their respective tax bases, the tax effect of loss carryforwards and tax credit carryforwards. Deferred tax assets and liabilities are measured using enacted tax rates expected to apply to taxable income in the years in which those temporary differences are expected to be recovered or settled. The effect on deferred tax assets and liabilities of a change in tax rates is recognized in income in the period that includes the enactment date. Earnings of the Company's foreign subsidiaries are not considered to be indefinitely reinvested outside of the United States and, accordingly, U.S. Federal and State income taxes have historically been provided for all undistributed earnings net of related foreign tax credits. See Note 5 for impacts associated with U.S. tax reform under the Tax Cuts and Jobs Act (2017 Tax Act). A valuation allowance is established when necessary to reduce deferred tax assets to amounts expected to be realized. The Company recognizes interest expense related to unrecognized

F-12.
tax benefits or underpayment of income taxes in interest expense and recognizes penalties in operating expenses. Beginning on January 1, 2017, the Company adopted accounting guidance requiring that, prospectively, excess tax benefits and deficiencies be recorded in income tax expense for stock option exercises, cancellations and disqualifying dispositions of employee stock purchase plan shares. Adoption also resulted in the retroactive reclassification of excess tax benefits on the statement of cash flows.
G | Net Earnings Attributable to Shareholders per Common Share
Diluted earnings attributable to shareholders per share is computed using the weighted average number of common shares and dilutive potential common shares outstanding. Dilutive potential common shares represent outstanding stock options, stock purchase rights and unvested restricted stock units. Basic earnings attributable to shareholders per share is calculated using the weighted average number of common shares outstanding without taking into consideration dilutive potential common shares outstanding.
H. | Stock Plans
The Company maintains several equity incentive plans under which the Company has granted stock options, director restricted stocks, restricted stock units (RSU), performance stock units and employee stock purchase rights to employees or directors. The Company recognizes stock compensation expense based on the fair value of awards at the grant date. This expense, adjusted for expected forfeitures, is recognized in net earnings on a straight-line basis over the service periods as a component of salaries and related costs. RSU awards to certain employees meeting specific retirement eligibility criteria at the time of grant are expensed immediately, as there is no substantive service period associated with those awards. Expense for performance stock units is recognized over the service period when it is probable the performance goal will be achieved.
I. | Foreign Currency
Foreign currency amounts attributable to foreign operations have been translated into U.S. dollars using year-end exchange rates for assets and liabilities, historical rates for equity, and weighted average rates for revenues and expenses. Translation adjustments resulting from this process are recorded as components of other comprehensive income until complete or substantially complete liquidation by the Company of its investment in a foreign entity. Currency fluctuations are a normal operating factor in the conduct of the Company’s business and foreign exchange transaction gains and losses are included in revenues and operating expenses. Also, the Company is exposed to foreign currency exchange fluctuations on monetary assets and liabilities denominated in currencies that are not the local functional currency. Foreign exchange gains and losses on such balances are recognized in net earnings within airfreight services costs, customs brokerage and other services costs and other income, net. Net foreign currency losses in 2017 were $13,315, and net foreign currency gains in 2016 and 2015 were $7,955 and $7,820, respectively.
The Company follows a policy of accelerating international currency settlements to manage its foreign exchange exposure. Accordingly, the Company enters into foreign currency hedging transactions only in limited locations where there are regulatory or commercial limitations on the Company’s ability to move money freely. Such hedging activity during 2017, 2016, and 2015 was insignificant. The Company had no foreign currency derivatives outstanding at December 31, 2017 and 2016.
J. | Comprehensive Income
Comprehensive income consists of net earnings and other gains and losses affecting equity that, under U.S. GAAP, are excluded from net earnings. For the Company, these consist of foreign currency translation gains and losses, net of related income tax effects and comprehensive income or loss attributable to the noncontrolling interests. Upon the complete or substantially complete liquidation of the Company's investment in a foreign entity, cumulative translation adjustments are recorded as reclassification adjustments in other comprehensive income and recognized in net earnings.
Accumulated other comprehensive loss consisted entirely of foreign currency translation adjustments, net of related income tax effects, as of December 31, 2017 and 2016.
K. | Segment Reporting
The Company is organized functionally in geographic operating segments. Accordingly, management focuses its attention on revenues, net revenues, operating income, identifiable assets, capital expenditures, depreciation and amortization and equity generated in each of these geographical areas when evaluating the effectiveness of geographic management. Transactions among the Company’s various offices are conducted using the same arms-length pricing methodologies the Company uses when its offices transact business with independent agents. Certain costs are allocated among the segments based on the relative value of the underlying services, which can include allocation based on actual costs incurred or estimated cost plus a profit margin.
L. | Use of Estimates
The preparation of financial statements in conformity with U.S. GAAP requires management to make estimates and assumptions that affect the reported amounts of the assets and liabilities and disclosure of contingent assets and liabilities at the date of the
F-13.
financial statements and the reported amounts of revenues and expenses during the period. The Company uses estimates primarily in the following areas: accounts receivable valuation, accrual of costs related to ancillary services the Company provides, accrual of liabilities for the portion of the related exposure that the Company has self-insured, accrual of various tax liabilities including estimates associated with the 2017 Tax Act, accrual of loss contingencies and calculation of share-based compensation expense. Actual results could be materially different from the estimated provisions and accruals recorded.
M. | Recent Accounting Pronouncements
Revenue Recognition
In May 2014, the Financial Accounting Standards Board (FASB) issued an Accounting Standards Update (ASU) amending existing revenue recognition guidance and requiring related detailed disclosures to enable users of financial statements to understand the nature, amount, timing and uncertainty of our revenues and cash flows arising from contracts with customers. This standard is effective for the Company beginning on January 1, 2018. The Company formed a cross-functional project team to evaluate the adoption impacts for each of its services.
Under the standard used through the end of 2017, the Company's transportation revenue was recognized at the point in time freight was tendered to the direct carrier at origin. Under the new standard, transportation and related services revenue is recognized over time as control is transferred to the customer. The Company expects to defer more revenues under the new standard. The Company has also evaluated whether it acts as principal or agent with regards to its promise to transfer services to the customer and it expects the presentation to change for certain of its services from a net to gross presentation.
The Company has developed and implemented systems solutions and process changes to facilitate revenue recognition under the new standard. The Company has also identified and designed changes to its internal controls to support the adoption. The Company will adopt this standard using the modified retrospective transition method applied to those contracts that are not completed as of January 1, 2018. Upon adoption, the Company will recognize the cumulative effect of adopting as an adjustment currently estimated to be less than a $35 million decrease to its opening balance of retained earnings. Prior periods will not be retrospectively adjusted.
Leases
In February 2016, the FASB issued an ASU changing the accounting for leases and including a requirement to record all leases exceeding one year on the consolidated balance sheet as assets and liabilities. As currently issued, the new lease standard requires adoption using a modified retrospective transition and will be effective for the Company beginning on January 1, 2019. Adoption will impact the consolidated balance sheets as future minimum lease payments under noncancelable leases totaled $260 millionas of December 31, 2017. The Company is currently evaluating its existing lease portfolios, including accumulating all of the necessary information required to properly evaluate and account for leases under the new standard. Additionally, the Company has begun the implementation of an enterprise-wide lease management system that, along with accompanying process changes, will assist it in the accounting and internal control changes necessary to meet the reporting and disclosure requirements of the new standard when it becomes effective.
Taxes
In February 2018, the FASB issued an ASU, which amends existing guidance for reporting comprehensive income to reflect changes resulting from the 2017 Tax Act. The amendment provides the option to reclassify stranded tax effects resulting from the 2017 Tax Act and within accumulated other comprehensive income (AOCI) to retained earnings. New disclosures will be required upon adoption, including the accounting policy for releasing income tax effects from AOCI, whether reclassification of stranded income tax effects is elected, and information about other income tax effect reclassifications. The amendment will become effective for the Company on January 1, 2019, though early adoption is permitted. The Company is currently evaluating the impact of adopting this standard on its consolidated financial statements and disclosures.

F-14.
NOTE 2. PROPERTY AND EQUIPMENT
The components of property and equipment are as follows:
2017 2016Land ............................................................................................................... $ 147,261 172,310Buildings and leasehold improvements .......................................................... 416,597 467,096Furniture, fixtures, equipment and purchased software .................................. 320,544 296,214Construction in progress ................................................................................. 61,083 7,604Property and equipment, at cost ..................................................................... 945,485 943,224Less accumulated depreciation and amortization ........................................... 420,282 406,652Property and equipment, net .......................................................................... $ 525,203 536,572
In 2016, the Company completed a land acquisition in Europe, utilizing funds that had been placed in escrow in 2014. Construction of a building on that land was completed in January of 2018. In January 2017, the Company formally approved a plan to sell land and buildings in Miami, Florida. The decision to sell these assets was largely based upon changes in local operational requirements and the Company's intended use of the property. The property, which had a net book value of $80 million, was sold in December 2017 for a $4 million gain, which is reported in the United States segment within other operating expenses.
NOTE 3. SHAREHOLDERS’ EQUITY
A. | Stock Repurchase Plans
The Company has a Non-Discretionary Stock Repurchase Plan, originally approved by the Board of Directors in November 1993, under which management is authorized to repurchase up to 40,000 shares of the Company’s common stock in the open market with the proceeds received from the exercise of employee stock options, directors' restricted stock awards and the Employee Stock Purchase Plan.
The Company has a Discretionary Stock Repurchase Plan originally approved by the Board of Directors in November 2001, and amended from time to time under which management as of December 31, 2017 is authorized to repurchase shares down to 170,000 shares of common stock outstanding.
The following table summarizes by plan the Company’s repurchasing activity:
Cumulative sharesrepurchased
Average price per share
Non-Discretionary Plan (1994 through 2017) ............................................... 37,356 $ 32.63Discretionary Plan (2001 through 2017) ....................................................... 62,252 $ 41.90
B. | Omnibus Incentive Plan
On May 2, 2017, the shareholders approved the Company's 2017 Omnibus Incentive Plan (2017 Plan), which made available 2,500shares of the Company's common stock in aggregate to be issued under any award type allowed by the 2017 Plan. The RSU granted in 2017 vest annually over three years based on continued employment and are settled upon vesting in shares of the Company's common stock on a one-for-one basis.
F-15.
The following table summarizes information about RSU:
Number ofshares
Weighted averagegrant date fair value
Outstanding at December 31, 2016.... — $ —RSU granted ....................................... 593 $ 54.11RSU vested ........................................ — $ —RSU forfeited ...................................... (12) $ 54.04Outstanding at December 31, 2017.... 581 $ 54.11
In 2017, the Company also awarded 23 Performance Stock Units (PSU) under the 2017 Plan. The PSU include performance conditions to be finally measured in 2019. The final number of PSU will be determined using an adjustment factor of up to 2 timesor down to 0.5 of the targeted PSU grant, depending on the degree of achievement of the designated performance targets. If the minimum performance thresholds are not achieved, no shares will be issued. Each PSU will convert to one share of the Company's common stock upon vesting.
RSU and PSU granted under the 2017 Plan have dividend equivalent rights, which entitle holders of RSU and PSU to the same dividend value per share as holders of common stock. Dividend equivalent rights are subject to the same vesting and other terms and conditions as the corresponding unvested RSU and PSU and are accumulated and paid in shares when the underlying awards vest.
At December 31, 2017, assuming target levels are achieved for PSU, there are 1,896 shares available for grant under the 2017 plan.
When restrictions on RSU or PSU lapse the Company derives a tax deduction in certain countries based on the fair market value of the award upon vesting. Until vesting, a deferred tax asset is recognized and measured based on the fair value of the award at the date of grant (consistent with measurement for stock compensation expense). Any excess or shortfall in the tax deduction resulting from the difference between fair market value of the award between the date of grant and the date of vesting is recognized to income tax expense upon vesting.
C. | Stock Option Plans
Historically, the Company granted stock options under stock option plans approved annually by shareholders. Those plans generally allowed for the grant of qualified and non-qualified grants and outstanding options expire no more than ten years from the date of grant. Stock options granted in 2016 vest over three years from the date of grant as compared to five years for options granted in prior years. Stock options were last granted in 2016 under the Company's 2016 stock options plan. No additional shares can be granted under any of the Company's stock option plans other than the 2017 Plan.
Upon the exercise of non-qualified stock options and disqualifying dispositions of incentive stock options, the Company derives a tax deduction measured by the excess of the market value over the option price at the date of exercise or disqualifying disposition. The portion of the benefit from the deduction, which equals the estimated fair value of the options (previously recognized as compensation expense) is recorded as a credit to the deferred tax asset for non-qualified stock options and is recorded as a credit to current tax expense for any disqualified dispositions of incentive stock options. For disqualifying dispositions, when the amount of the tax deduction is less than the cumulative amount of compensation expense recognized for the award, the amount credited to current tax expense is limited to the tax benefit associated with the tax deduction. All of the tax benefit received upon option exercise for the tax deduction in excess of the estimated fair value of the options was credited to additional paid-in capital prior to 2017. Commencing in 2017, in connection with the new requirements and adoption of accounting guidance issued in March 2016, these tax amounts are no longer recorded in additional paid-in capital and instead are reflected as components of income tax expense.

F-16.
The following table summarizes information about stock options:
Number ofshares
Weightedaverage
exercise priceper share
Weightedaverage
remainingcontractual life
Aggregate intrinsic value
Outstanding at December 31, 2016 .............................. 17,374 $ 44.25Options granted ............................................................ — $ —Options exercised ......................................................... (4,020) $ 43.86Options forfeited ........................................................... (328) $ 44.23Options canceled .......................................................... (65) $ 46.27Outstanding at December 31, 2017 .............................. 12,961 $ 44.36 5.78 $ 263,431Exercisable at December 31, 2017 ............................... 6,615 $ 43.44 4.30 $ 140,569
D. | Stock Purchase Plan
In May 2002, the shareholders approved the Company’s 2002 Employee Stock Purchase Plan (the 2002 Plan), which became effective August 1, 2002. On May 7, 2014, the shareholders approved an amendment to the 2002 Plan to increase the Company's common stock available for purchase under that plan by 3 million shares. The Company’s amended 2002 Plan provides for 12,305shares of the Company’s common stock to be reserved for issuance upon exercise of purchase rights granted to employees who elect to participate through regular payroll deductions beginning August 1 of each year. The purchase rights are exercisable on July 31 of the following year at a price equal to the lesser of (1) 85% of the fair market value of the Company’s stock on the last trading day in July or (2) 85% of the fair market value of the Company’s stock on the first trading day in August of the preceding year. A total of 10,896 shares have been issued under the 2002 Plan since inception and $16,400 has been withheld from employees at December 31, 2017 in connection with the plan year ending July 31, 2018.
E. | Director Restricted Stock Plan
On May 7, 2014, the shareholders approved the Company’s 2014 Directors’ Restricted Stock Plan (the 2014 Directors’ Plan), which provides for annual awards of restricted stock to non-employee directors and makes 250 shares of the Company’s common stock available for grant. The plan provides for an annual grant of restricted stock awards with a fair market value equal to $200 to each participant on June 1 of each year. There are 106 shares available for grant under this plan as of December 31, 2017. Each restricted stock award under the 2014 Directors’ Plan vests either at the time of grant or with a vesting schedule, as determined by the Compensation Committee of the Board of Directors. Restricted shares granted in 2016 and 2017 vested at the time of grant and there were no unvested restricted shares as of December 31, 2017. In 2017, restricted shares totaling 38 were granted with a fair value per share of $52.75. Restricted shares entitle the grantees to all shareholder rights, including cash dividends and transfer rights once vested. If a non-employee director’s service is terminated, any unvested portion of an award would be forfeited.
F. | Share-Based Compensation Expense
The fair value of each option grant is estimated on the date of grant using the Black-Scholes Model with the following assumptions:
For the years ended December 31,2017 2016 2015
Dividend yield ..................................................................................................... 1.50% 1.70% 1.60%Volatility – stock option plans .............................................................................. - 24 - 25% 29 - 34%Volatility – stock purchase rights plans ............................................................... 14% 20% 20%Risk-free interest rates ....................................................................................... 1.22% 0.51 - 1.42% 0.30 - 2.04%Expected life (years) – stock option plans .......................................................... - 5.5 - 6.5 6.41 - 7.47Expected life (years) – stock purchase rights plans ............................................ 1 1 1Weighted average fair value of stock options granted during the period ............ - $ 9.57 $ 13.44Weighted average fair value of stock purchase rights granted during the period $ 11.69 $ 10.99 $ 10.45
The Company’s expected volatility assumptions are based on the historical volatility of the Company’s stock over a period of time commensurate to the expected life. The expected life assumption is primarily based on historical employee exercise patterns and employee post-vesting termination behavior. The risk-free interest rate for the expected term of the option is based on the corresponding yield curve in effect at the time of grant for U.S. Treasury bonds having the same term as the expected life of the option. The expected dividend yield is based on the Company’s historical experience. The forfeiture assumption used to calculate compensation expense is primarily based on historical pre-vesting employee forfeiture patterns.
F-17.
The compensation for restricted stock awards and RSU is based on the fair market value of the Company’s share of common stock on the date of grant.
The total intrinsic value of options exercised during the years ended December 31, 2017, 2016 and 2015 was approximately $55 million, $29 million and $31 million, respectively.
As of December 31, 2017, the total unrecognized compensation cost related to stock awards is $69 million and the weighted average period over which that cost is expected to be recognized is 1.9 years.
Total stock compensation expense and the total related tax benefit recognized are as follows:
For the years ended December 31,2017 2016 2015
Stock compensation expense ..................................................................... $ 50,908 45,217 43,415Recognized tax benefit ............................................................................... $ 7,029 8,178 6,010
Approximately $4 million of stock compensation expense was recognized in 2017 for RSU grants meeting retirement eligibility criteria. Shares issued as a result of stock option exercises, restricted stock awards, vested restricted stock units, vested performance stock units and employee stock plan purchases are issued as new shares outstanding by the Company.
NOTE 4. BASIC AND DILUTED EARNINGS PER SHARE
The following table reconciles the numerator and the denominator of the basic and diluted per share computations for earnings attributable to shareholders.
Net earningsattributable toshareholders
Weightedaverageshares
Earnings per share
2017Basic earnings attributable to shareholders ................................................ $ 489,345 179,247 $ 2.73Effect of dilutive potential common shares ................................................. — 2,419 —Diluted earnings attributable to shareholders ............................................. $ 489,345 181,666 $ 2.692016Basic earnings attributable to shareholders ................................................ $ 430,807 181,282 $ 2.38Effect of dilutive potential common shares ................................................. — 1,422 —Diluted earnings attributable to shareholders ............................................. $ 430,807 182,704 $ 2.362015Basic earnings attributable to shareholders ................................................ $ 457,223 188,941 $ 2.42Effect of dilutive potential common shares ................................................. — 1,282 —Diluted earnings attributable to shareholders ............................................. $ 457,223 190,223 $ 2.40
The following potential common shares have been excluded from the computation of diluted earnings per share because the effect would have been antidilutive:
Years ended December 31, 2017 2016 2015Shares ........................................................................................................ 19 9,211 8,330
NOTE 5. INCOME TAXES
On December 22, 2017, the United States enacted the 2017 Tax Act. The 2017 Tax Act, which is also commonly referred to as “U.S. tax reform”, significantly changes U.S. corporate income tax laws by, among other things, reducing the U.S. corporate income tax rate from 35% to 21% starting in 2018 and creates a territorial tax system with a one-time mandatory tax on the undistributed foreign earnings of the Company's non-U.S. subsidiaries. As a result, the Company recorded a net income tax benefit of $13.9 million during the fourth quarter of 2017. This amount, which reduced income tax expense in the consolidated statements of earnings, consists of three components:

F-18.
i. $116.2 million of deferred income tax benefit resulting from completion of the remeasurement of net deferred tax liabilities based on the new lower U.S. income tax rate,
ii. $70.2 million provisional estimate of deferred income tax expense for the reversal of net deferred tax asset provided for its foreign income tax credits in excess of unremitted foreign earnings (after adjustment of the unremitted foreign earnings liability to reflect the lower U.S. tax rate) to transition to the territorial tax system, and
iii. $32.1 million of current income tax expense relating to the provisional estimate of the one-time mandatory tax on undistributed earnings of non-U.S. subsidiaries.
In addition, as a result of the transition to a territorial tax system in the U.S., the effective tax rate for the year ended December 31, 2017 included a $25.4 million income tax benefit as foreign tax rates are lower than the 2017 U.S. corporate income tax rate of 35%. Although the $13.9 million and $25.4 million net income tax benefits represent what the Company believes are reasonable estimates of the impact of the 2017 Tax Act on the Company's consolidated financial statements as of December 31, 2017, they should be considered provisional.
Given the significance of the legislation, the Securities and Exchange Commission staff issued Staff Accounting Bulletin No. 118 (SAB 118), which allows registrants to record provisional amounts during a one year “measurement period”. However, the measurement period is deemed to have ended earlier when the registrant has obtained, prepared and analyzed the information necessary to finalize its accounting. During the measurement period, impacts of the law are expected to be recorded at the time a reasonable estimate for all or a portion of the effects can be made, and provisional amounts can be recognized and adjusted as information becomes available, prepared or analyzed.
SAB 118 summarizes a three-step process to be applied at each reporting period to account for and qualitatively disclose: (1) the effects of the change in tax law for which accounting is complete; (2) provisional amounts (or adjustments to provisional amounts) for the effects of the tax law where accounting is not complete, but that a reasonable estimate has been determined; and (3) a reasonable estimate cannot yet be made and therefore taxes are reflected in accordance with law prior to the enactment of the 2017 Tax Act.
Provisional amounts include any changes as a result of future guidance and interpretations to be issued and also includes any indirect impacts required to be recorded, including for example amounts recorded for state income taxes. The Company will finalize its tax positions and calculations when it files its 2017 U.S. tax returns. At that time, the Company will be able to conclude finally whether any further adjustments are required to its net current and deferred tax accounts in the U.S. as of December 31, 2017, as well as to the provisional liability associated with the one-time mandatory tax. Any adjustments to these provisional amounts will be reported as a component of income tax expense in the reporting period in which any such adjustments are determined, which will be no later than the fourth quarter of 2018.
Significant provisions that are not yet effective but may impact income taxes in future years include an incremental tax (base erosion anti-abuse tax or BEAT) on excessive amounts paid to foreign related parties, and a minimum tax on certain foreign earnings in excess of 10 percent of the foreign subsidiaries tangible assets (i.e., global intangible low-taxed income or GILTI). The Company is still evaluating whether to make a policy election to treat the GILTI tax as a period expense or to provide U.S. deferred taxes on foreign temporary differences that are expected to generate GILTI income when they reverse in future years.
Income tax expense (benefit) includes the following components:
Federal State Foreign Total 2017
Current ................................................................. $ 101,821 20,490 149,596 271,907Deferred ............................................................... (42,474) (1,221) — (43,695)
$ 59,347 19,269 149,596 228,2122016
Current ................................................................. $ 85,330 16,082 137,076 238,488Deferred ............................................................... 16,903 (1,068) — 15,835
$ 102,233 15,014 137,076 254,3232015
Current ................................................................. $ 95,046 16,973 147,174 259,193Deferred ............................................................... 17,631 368 — 17,999
$ 112,677 17,341 147,174 277,192
F-19.
Income tax expense differs from amounts computed by applying the United States Federal income tax rate of 35% to earnings before income taxes as a result of the following:
2017 2016 2015Computed “expected” tax expense ............................................................. $ 251,508 240,400 257,841Increase in income taxes resulting from:
State income taxes, net of Federal income tax benefit .................. 12,525 9,759 11,272Nondeductible stock compensation expense, net ......................... 63 3,629 5,241Enactment of 2017 Tax Act ........................................................... (13,894) — —Effect of lower foreign tax rates ..................................................... (25,374) — —Other, net ...................................................................................... 3,384 535 2,838
$ 228,212 254,323 277,192
The components of earnings before income taxes are as follows:
2017 2016 2015United States ............................................................................................ $ 276,714 243,754 236,932Foreign ...................................................................................................... 441,881 443,102 499,757
$ 718,595 686,856 736,689
The tax effects of temporary differences and tax credits that give rise to significant portions of deferred tax assets and deferred tax liabilities are as follows:
Years ended December 31, 2017 2016Deferred Tax Assets:Accrued third party obligations, deductible for taxes upon economic performance .................. $ 8,075 15,153Provision for doubtful accounts receivable ............................................................................... 628 497Excess of financial statement over tax depreciation ................................................................. 4,804 10,650Deductible stock compensation expense, net .......................................................................... 17,326 21,758Foreign currency translation adjustment .................................................................................. 24,448 57,207Retained liability for cargo claims ............................................................................................. 1,062 1,178Total gross deferred tax assets ................................................................................................ 56,343 106,443Deferred Tax Liabilities:Unremitted foreign earnings, net of related foreign tax credits ................................................. 43,136 120,170Total gross deferred tax liabilities ............................................................................................. 43,136 120,170Net deferred tax assets (liabilities) ........................................................................................... $ 13,207 (13,727)
Based on management’s review of the Company’s tax positions, the Company had no significant unrecognized tax benefits as of December 31, 2017 and 2016.
The Company or one of its subsidiaries files income tax returns in the U.S. federal jurisdiction and various state, local and foreign jurisdictions. The Company is no longer subject to U.S. federal income tax examinations by tax authorities for years prior to 2014. With respect to state and local jurisdictions and countries outside of the United States, with limited exceptions, the Company and its subsidiaries are no longer subject to income tax audits for years prior to 2001. In the normal course of business, the Company is subject to examination by taxing authorities throughout the world. The outcome of a tax audit is always uncertain. Although the Company records estimates for additional tax expense, as well as interest and penalties that could arise from certain tax audits, the final resolution of these audits could differ materially from the estimates recorded by the Company. Any interest and penalties expensed in relation to the underpayment of income taxes were insignificant for the years ended December 31, 2017, 2016 and 2015.

F-20.
NOTE 6. FAIR VALUE OF FINANCIAL INSTRUMENTS
The Company’s financial instruments, other than cash, consist primarily of cash equivalents, accounts receivable, accounts payable and accrued expenses. The carrying value of these financial instruments approximates their fair value. Cash and cash equivalents consist of the following:
December 31, 2017 December 31, 2016 Cost Fair Value Cost Fair Value Cash and cash equivalents:Cash and overnight deposits ..................................... $ 383,021 383,021 406,787 406,787Corporate commercial paper ..................................... 635,345 635,919 507,777 507,889Time deposits ............................................................ 32,733 32,733 59,871 59,871
Total cash and cash equivalents .................. 1,051,099 1,051,673 974,435 974,547
The fair value of corporate commercial paper and time deposits is based on the use of market interest rates for identical or similar assets (Level 2 fair value measurement).
NOTE 7. CREDIT ARRANGEMENTS
Certain of the Company’s foreign subsidiaries maintain bank lines of credit for short-term working capital purposes. A few of these credit lines are supported by standby letters of credit issued by a United States bank, or guarantees issued by the Company to the foreign banks issuing the credit line. At December 31, 2017, the Company was contingently liable for approximately $75,311 under outstanding standby letters of credit and guarantees. At December 31, 2017, the Company was in compliance with all restrictive covenants of these credit lines and the associated credit facilities.
The standby letters of credit and guarantees relate to obligations of the Company’s foreign subsidiaries for credit extended in the ordinary course of business by direct carriers, primarily airlines, and for duty and tax deferrals available from governmental entities responsible for customs and value-added-tax (VAT) taxation. The total underlying amounts due and payable for transportation and governmental excise taxes are properly recorded as obligations in the books of the respective foreign subsidiaries, and there would be no need to record additional expense in the unlikely event the parent company were to be required to perform.
F-21.
NOTE 8. COMMITMENTS
A. | Leases
The Company occupies office and warehouse facilities under terms of operating leases expiring up to 2028. The Company also has two long-term operating lease arrangements to use land, for which the usage rights were entirely prepaid. Usage rights for those arrangements are recognized in rent expense over the lease terms up to 2057. Total rent expense for all operating leases in 2017, 2016 and 2015 was $68,920, $62,294 and $58,133, respectively.
At December 31, 2017, future minimum annual lease payments under all noncancelable leases are as follows:
2018 ...................................................................................................................................................... $ 72,1482019 ...................................................................................................................................................... 57,7762020 ...................................................................................................................................................... 45,4662021 ...................................................................................................................................................... 30,9252022 ...................................................................................................................................................... 19,024Thereafter .............................................................................................................................................. 34,556
$ 259,895
B. | Unconditional Purchase Obligations
The Company enters into short-term unconditional purchase obligations with asset-based providers reserving space on a guaranteed basis. The pricing of these obligations varies to some degree with market conditions. Historically, the Company has met these obligations in the normal course of business within one year. Purchase obligations outstanding as of December 31, 2017 totaled $56,116.
C. | Employee Benefits
The Company has employee savings plans under which the Company provides a discretionary matching contribution. In 2017, the Company increased its 401(k) matching contribution. In 2017, 2016 and 2015, the Company’s contributions under the plans were $18,210, $9,681, and $8,658, respectively.
NOTE 9. CONTINGENCIES
The Company is involved in claims, lawsuits, government investigations and other legal matters that arise in the ordinary course of business and are subject to inherent uncertainties. Currently, in management's opinion and based upon advice from legal advisors, none of these matters are expected to have a significant effect on the Company's operations, cash flows or financial position. As of December 31, 2017, the amounts accrued for these claims, lawsuits, government investigations and other legal matters are not significant to the Company's operations, cash flows or financial position. At this time, the Company is unable to estimate any additional loss or range of reasonably possible losses, if any, beyond the amounts recorded, that might result from the resolution of these matters.

F-22.
NOTE 10. BUSINESS SEGMENT INFORMATION
Financial information regarding 2017, 2016 and 2015 operations by the Company’s designated geographic areas is as follows:
United States
OtherNorth
America2017Revenues from unaffiliated customers ................................................................................ $ 1,851,395 256,359Transfers between geographic areas .................................................................................. 111,163 11,827Total revenues ..................................................................................................................... $ 1,962,558 268,186Net revenues1 ...................................................................................................................... $ 1,008,841 119,071Operating income ................................................................................................................ $ 277,821 38,131Identifiable assets at year end ............................................................................................. $ 1,595,140 151,181Capital expenditures ............................................................................................................ $ 28,212 1,563Depreciation and amortization ............................................................................................. $ 32,017 1,546Equity .................................................................................................................................. $ 1,337,568 60,7052016Revenues from unaffiliated customers ................................................................................ $ 1,683,006 226,561Transfers between geographic areas .................................................................................. 106,076 10,778Total revenues ..................................................................................................................... $ 1,789,082 237,339Net revenues1 ...................................................................................................................... $ 918,110 119,492Operating income ................................................................................................................ $ 250,715 32,530Identifiable assets at year end ............................................................................................. $ 1,455,722 104,804Capital expenditures ............................................................................................................ $ 39,531 1,727Depreciation and amortization ............................................................................................. $ 29,939 1,479Equity $ 1,166,582 46,4482015Revenues from unaffiliated customers ................................................................................ $ 1,763,361 226,284Transfers between geographic areas .................................................................................. 118,884 13,383Total revenues ..................................................................................................................... $ 1,882,245 239,667Net revenues1 ...................................................................................................................... $ 906,780 124,381Operating income ................................................................................................................ $ 245,257 46,846Identifiable assets at year end ............................................................................................. $ 1,185,671 111,549Capital expenditures ............................................................................................................ $ 26,807 3,915Depreciation and amortization ............................................................................................. $ 29,532 1,331Equity .................................................................................................................................. $ 986,330 70,932
F-23.
LatinAmerica North Asia South Asia Europe
MiddleEast,
Africa andIndia
Elimi-nations
Consoli-dated
97,096 2,576,971 661,878 1,072,028 405,221 — 6,920,94814,766 21,405 22,999 43,296 20,848 (246,304) —
111,862 2,598,376 684,877 1,115,324 426,069 (246,304) 6,920,94858,199 509,235 163,450 335,702 121,267 3,424 2,319,189
9,964 248,422 53,057 48,491 24,365 9 700,26055,431 458,152 137,279 501,711 215,495 2,619 3,117,008
4,612 3,756 1,688 53,954 1,231 — 95,0161,277 5,326 2,215 5,068 1,861 — 49,310
26,546 240,721 94,516 142,971 123,600 (32,254) 1,994,373
84,665 2,242,670 603,980 918,561 338,594 — 6,098,03715,037 21,212 24,251 41,102 21,876 (240,332) —99,702 2,263,882 628,231 959,663 360,470 (240,332) 6,098,03756,066 471,275 171,033 304,429 123,335 296 2,164,03613,321 230,777 64,967 42,195 35,672 (14) 670,16349,231 511,851 120,300 351,960 190,902 6,101 2,790,871
1,038 3,889 3,038 7,554 2,539 — 59,3161,187 5,455 2,177 4,576 1,983 — 46,796
27,164 327,672 91,983 108,430 112,633 (33,699) 1,847,213
94,229 2,557,398 677,628 958,827 338,905 — 6,616,63219,158 21,722 25,018 42,787 21,322 (262,274) —
113,387 2,579,120 702,646 1,001,614 360,227 (262,274) 6,616,63265,017 493,235 179,110 308,301 110,953 — 2,187,77719,656 245,854 69,643 65,024 29,204 — 721,48448,678 446,914 127,014 421,590 221,835 2,326 2,565,577
1,756 2,203 2,383 5,222 2,097 — 44,3831,041 5,425 2,110 4,931 1,642 — 46,012
33,161 253,097 99,220 154,174 130,105 (32,343) 1,694,676
_______________________ 1Net revenues are a non-GAAP measure calculated as revenues less directly related operating expenses attributable to the Company's principal services. The Company's management believes that net revenues are a better measure than total revenues when evaluating the Company's operating segment performance since total revenues earned as a freight consolidator include the carriers' charges for carrying the shipment, whereas revenues earned in other capacities include primarily the commissions and fees earned by the Company. Net revenue is one of the Company's primary operational and financial measures and demonstrates the Company's ability to concentrate and leverage purchasing power through effective consolidation of shipments from customers utilizing a variety of transportation carriers and optimal routings.

F-24.
The following table presents the calculation of net revenues:
Years ended December 31, 2017 2016 2015Revenues:Total revenues .......................................................................... $ 6,920,948 6,098,037 6,616,632Expenses:Airfreight services ..................................................................... 2,126,761 1,752,167 1,987,690Ocean freight and ocean services ............................................ 1,543,740 1,378,699 1,648,993Customs brokerage and other services .................................... 931,258 803,135 792,172
Net revenues ...................................................................... $ 2,319,189 2,164,036 2,187,777
Other than the United States, only the People’s Republic of China, including Hong Kong, represented more than 10% of the Company’s total revenue, net revenue, total identifiable assets or equity in any period presented as noted in the table below.
2017 2016 2015Total revenues ......................................................................................................... 31% 31% 32%Net revenues ........................................................................................................... 18% 18% 19%Identifiable assets at year end ................................................................................. 11% 15% 13%Equity ....................................................................................................................... 8% 13% 10%
NOTE 11. QUARTERLY RESULTS (UNAUDITED)
1st 2nd 3rd 4th2017Revenues ......................................................................... $ 1,545,132 1,672,279 1,802,166 1,901,371Net revenues .................................................................... 527,605 563,633 599,142 628,809Net earnings ..................................................................... 93,567 108,755 120,606 167,455Net earnings attributable to shareholders ......................... 93,264 108,851 120,263 166,967Diluted earnings attributable to shareholders per share ... 0.51 0.60 0.66 0.92Basic earnings attributable to shareholders per share ..... 0.52 0.60 0.67 0.942016Revenues ......................................................................... $ 1,418,472 1,475,164 1,562,394 1,642,007Net revenues .................................................................... 517,069 553,117 545,259 548,591Net earnings ..................................................................... 97,047 116,439 107,949 111,098Net earnings attributable to shareholders ......................... 96,584 116,052 107,581 110,590Diluted earnings attributable to shareholders per share ... 0.53 0.63 0.59 0.61Basic earnings attributable to shareholders per share ..... 0.53 0.64 0.59 0.61
Net earnings in the fourth quarter of 2017 include a $39 million net income tax benefit that resulted from the effect of the 2017 Tax Act as described in Note 5. This amount is composed of the remeasurement of net deferred tax liabilities and assets based on the new lower U.S. corporate tax rate, the recording of a provisional estimate of the one-time mandatory tax on the undistributed earnings of the Company's non-U.S. subsidiaries and the provisional effects of the transition to a territorial tax system in the U.S. Net earnings in the fourth quarter of 2016 include a $6 million foreign exchange gain recorded in customs brokerage and other services expenses that resulted from the devaluation of Egyptian pound. The sum of quarterly per share data may not equal the per share total reported for the year.

D I R E C T O R S
R O B E R T R . W R I G H T
C h a i r m a n o f t h e B o a r d , D i r e c t o r
G L E N N M . A L G E R
D i r e c t o r
J A M E S M . D U B O I S
D i r e c t o r
M A R K A . E M M E R T
D i r e c t o r, C o m p e n s a t i o n C o m m i t t e e C h a i r
D I A N E H . G U LYA S
D i r e c t o r
D A N P . K O U R K O U M E L I S
D i r e c t o r
R I C H A R D B . M C C U N E
D i r e c t o r, A u d i t C o m m i t t e e C h a i r
A L A I N M O N I É
D i r e c t o r
J E F F R E Y S . M U S S E R
P r e s i d e n t & C h i e f E x e c u t i v e O f f i c e r, D i r e c t o r
L I A N E J . P E L L E T I E R
D i r e c t o r, N o m i n a t i n g & C o r p o r a t e
G o v e r n a n c e C o m m i t t e e C h a i r
T AY Y O S H I TA N I
D i r e c t o r

E X E C U T I V E O F F I C E R S
& S E N I O R M A N A G E R S
J E F F R E Y S . M U S S E R *
P r e s i d e n t & C h i e f E x e c u t i v e O f f i c e r, D i r e c t o r
E U G E N E K . A L G E R
P r e s i d e n t , G l o b a l S e r v i c e s
T I M O T H Y C . B A R B E R
E x e c u t i v e V i c e P r e s i d e n t , E u r o p e
B L A K E R . B E L L
S e n i o r V i c e P r e s i d e n t , G l o b a l Tr a n s c o n
B E N J A M I N G . C L A R K
S e n i o r V i c e P r e s i d e n t , G e n e r a l C o u n s e l & C o r p o r a t e S e c r e t a r y
P H I L I P M . C O U G H L I N
S e n i o r V i c e P r e s i d e n t , C h i e f S t r a t e g y O f f i c e r
K A R L F R A N C I S C O
S e n i o r V i c e P r e s i d e n t , G l o b a l O c e a n
S T E V E N J . G R I M M E R
S e n i o r V i c e P r e s i d e n t , A c c o u n t M a n a g e m e n t
S C O T T M . K E L LY
V i c e P r e s i d e n t , G l o b a l O c e a n S e r v i c e s
B R U C E J . K R E B S
S e n i o r V i c e P r e s i d e n t , G l o b a l D i s t r i b u t i o n
M U R A L I K R I S H N A M U R T H Y
S e n i o r V i c e P r e s i d e n t , M i d d l e E a s t , A f r i c a & I n d i a n S u b c o n t i n e n t
K H O O N L I N G L I M
S e n i o r V i c e P r e s i d e n t , S o u t h A s i a
* Member of the Board of D irectors

D A N A L . L O R E N Z E
S e n i o r V i c e P r e s i d e n t , G l o b a l C u s t o m s
C H A R L E S J . LY N C H
S e n i o r V i c e P r e s i d e n t , C o r p o r a t e C o n t r o l l e r
C H R I S T O P H E R J . M C C L I N C Y
S e n i o r V i c e P r e s i d e n t & C h i e f I n f o r m a t i o n O f f i c e r
B R A D L E Y S . P O W E L L
S e n i o r V i c e P r e s i d e n t & C h i e f F i n a n c i a l O f f i c e r
W I L L I A M A . R O M B E R G E R I I I
S e n i o r V i c e P r e s i d e n t , T h e A m e r i c a s
R I C H A R D H . R O S T A N
P r e s i d e n t , G l o b a l G e o g r a p h i e s & O p e r a t i o n s
J . J O N A T H A N S O N G
S e n i o r V i c e P r e s i d e n t , G l o b a l S a l e s & M a r k e t i n g
J O S E A . U B E D A
S e n i o r V i c e P r e s i d e n t , G l o b a l A i r
D A N I E L R . W A L L
P r e s i d e n t , G l o b a l P r o d u c t s
A L L E N W A N G
S e n i o r V i c e P r e s i d e n t , N o r t h A s i a
M I C H E L L E D . W E A V E R
S e n i o r V i c e P r e s i d e n t , G l o b a l O r d e r M a n a g e m e n t
C R A I G L . W I L W E R D I N G
S e n i o r V i c e P r e s i d e n t , G l o b a l B u s i n e s s O p e r a t i o n s

C O R P O R A T E H E A D Q U A R T E R S
E X P E D I T O R S I N T E R N AT I O N A LO F W A S H I N G T O N , I N C .10 1 5 T h i r d A v e n u e , S e a t t l e , WA 9 8 10 4
I N F O R M AT I O N I S A V A I L A B L E O Nw w w. e x p e d i t o r s . c o m
S U S T A I N A B I L I T Y
Infor mat ion about Ex peditors’ commit ment to the environment; cor porate soc ial responsibi l it y; sec ur it y, health, and safet y; and good gover nance are desc r ibed in detail under “Cor porate Cit i zenship” at w w w.ex peditors .com and in the Company’s updated Su stainabilit y R epor t w w w.ex peditors .com /about- u s/su stainabilit y
O F F I C E S & A G E N T S
F o r i n f o r m a t i o n a b o u t h o w w e c a n h e l p f u l f i l l y o u r l o g i s t i c s o r s u p p l y c h a i n n e e d s , c o n t a c t u s a t o n e o f o u r 17 7 d i s t r i c t o f f i c e s o r t h r o u g h o n e o f o u r m o r e t h a n 10 0 a g e n t l o c a t i o n s i n o v e r 6 0 c o u n t r i e s : w w w. e x p e d i t o r s . c o m / l o c a t i o n s
A N N U A L M E E T I N G
T h e a n n u a l m e e t i n g o f s h a r e h o l d e r s w i l l b e h e l d Tu e s d a y, M a y 8 , 2 0 1 8 , a t 9 : 0 0 a m a t E x p e d i t o r s ’ C o r p o r a t e H e a d q u a r t e r s
T R A N S F E R A G E N T & R E G I S T R A R , D I V I D E N D D I S B U R S I N G A G E N T
C O M P U T E R S H A R E T R U S T C O M P A N Y , N . A .4 6 2 S o u t h 4 t h S t r e e t , S u i t e 16 0 0 , L o u i s v i l l e , K Y 4 0 2 0 2o r P. O . B o x 5 0 5 0 0 0 , L o u i s v i l l e , K Y 4 0 2 3 3 - 5 0 0 0
S H A R E H O L D E R S E R V I C E S(8 7 7) 4 9 8 - 8 8 6 1 - To l l F r e e( 7 8 1) 5 75 -2 8 7 9 – N o n - U S o r C a n a d a
H E A R I N G I M P A I R E D / T D D(8 0 0) 9 5 2 - 9 24 5
W E B S I T Ew w w. c o m p u t e r s h a r e . c o m
I N V E S T O R R E L A T I O N S
F u r t h e r i n f o r m a t i o n a b o u t t h e C o m p a n y, a d d i t i o n a l c o p i e s o f t h i s r e p o r t , F o r m 10 - K o r o t h e r f i n a n c i a l i n f o r m a t i o n m a y b e o b t a i n e d w i t h o u t c h a r g e b y w r i t i n g :
B R A D L E Y S . P O W E L LS e n i o r V i c e P r e s i d e n t & C h i e f F i n a n c i a l O f f i c e rE x p e d i t o r s I n t e r n a t i o n a l o f Wa s h i n g t o n , I n c .10 1 5 T h i r d A v e n u e , S e a t t l e , WA 9 8 10 4
i n v e s t o r. e x p e d i t o r s . c o m / i n f o r m a t i o n - r e q u e s t /c o n t a c t- u s
I N D E P E N D E N T R E G I S T E R E D P U B L I C A C C O U N T I N G F I R M
K P M G L L P19 1 8 E i g h t h A v e n u e , S u i t e 2 9 0 0 , S e a t t l e , WA 9 8 10 1
S T O C K P R I C E & D I V I D E N D S
T h e f o l l o w i n g t a b l e s e t s f o r t h t h e h i g h a n d l o w s a l e p r i c e s f o r t h e C o m p a n y ’ s c o m m o n s t o c k a s r e p o r t e d b y T h e N A S D A Q G l o b a l S e l e c t M a r k e t u n d e r t h e s y m b o l E X P D :
I n 2 0 17 a n d 2 0 16 , t h e B o a r d o f D i r e c t o r s d e c l a r e d a s e m i - a n n u a l d i v i d e n d o f $ . 4 2 a n d $ . 4 0 p e r s h a r e , r e s p e c t i v e l y , w h i c h w a s p a i d a s f o l l o w s :
QUARTER2017FIRST
SECOND
THIRD
FOURTH
2016FIRST
SECOND
THIRD
FOURTH
HIGH
$ 5 7. 3 5$ 5 7.75$ 6 0 . 3 0$ 6 6 . 0 1
$ 4 9 . 5 6$ 5 0 . 6 3$ 5 2 . 5 8$ 5 6 . 3 7
LOW
$ 5 1 . 5 7$ 5 1 . 9 6$ 5 4 . 3 2$ 5 6 . 4 5
$ 4 0 . 4 1$ 4 6 . 4 8$ 4 8 . 4 1$ 4 7. 2 3
2017
2016
15 JUNE15 DECEMBER15 JUNE15 DECEMBER
C O R P O R A T E I N F O R M A T I O N

E X P E D I T O R S
2 0 1 7 A N N U A L R E P O R T
EX
PE
DIT
OR
S IN
TE
RN
AT
ION
AL
OF
WA
SH
ING
TO
N, IN
C. 2
017
AN
NU
AL
RE
PO
RT