expansion study and performance analysis...
TRANSCRIPT

E X PA N S I O N S T U D Y A N D
P E R F O R M A N C E A N A LY S I S O F T H E
D E N M A R K C O M M U N I T Y W I N D FA R M
THESIS PROJECT
Thesis submitted to the School of Engineering and Information Technology, Murdoch University in partial fulfilment of the requirements for the degree of:
Bachelor of Engineering Honours [BE(Hons)] Electrical Power & Renewable Energy
M U R D O C H U N I V E R S I T Y
S C H O O L O F E N G I N E E R I N G A N D I N F O R M A T I O N T E C H N O L O G Y
E N G 4 7 0 E N G I N E E R I N G H O N O U R S T H E S I S
A I D E N J A M E S S T A N K O V I C
J A N U A R Y 2 0 1 7


DECLARATION
I, Aiden James Stankovic, certify that this work contains no material which has been
accepted for the award of any other degree or diploma in my name, in any university
or other tertiary institution and, to the best of my knowledge and belief, contains no
material previously published or written by another person, except where due
reference has been made in the text.
In addition, I certify that no part of this work will, in the future, be used in a
submission in my name, for any other degree or diploma in any university or other
tertiary institution without the prior approval of Murdoch University.
I give consent to this copy of my thesis, when deposited in the University Library,
being made available for loan and photocopying, subject to the provisions of the
Copyright Act 1968. I also give permission for the digital version of my thesis to be
made available on the web, via the University’s digital research repository, the
Library Search and also through web search engines, unless permission has been
granted by the University to restrict access for a period of time.
Signed: …………………………………………………..
Name: ……………………………………………………
Date: ……………………………………………………..


ACKNOWLEDGEMENTS
Firstly, I would like to express my sincere gratitude to my supervisor and educator,
Dr. Martina Calais, for your continued guidance and support, not only during this
thesis project, but throughout the course of my engineering degree. Your passion for
teaching electrical and renewable engineering has inspired me to work just as hard
to learn. I feel like I am now ready to grasp my engineering career with both hands.
Adj. Professor Craig Carter, your energy and enthusiasm is incredible. You have
given so much of your own time for this project, and for that I am truly thankful.
Your knowledge of the industry brings an aspect to university that I believe every
undergraduate should be exposed to. I am leaving university with skills that I would
not have gained without your time and efforts.
Special thanks must also be awarded to Andrew Woodroffe from SkyFarming. You
have had some brilliant ideas that I would not have thought of by myself, and your
zealousness has always kept me interested in this project.
Last, but certainly not least, thank you to my beautiful partner, Brittany. You have
always been there for me, through the late nights, the early mornings, the good
times, and the terrible. Through everything, you have never left my side. You bring
out the best in me, and I would not be where I am without your patience, kindness,
and understanding.


vii
ABSTRACT
Integration of renewable energy generators into rural distribution networks can
cause significant problems with voltage rise at the point of connection during times
of maximum generation. One such case is the Denmark Community Windfarm,
where the rated power of the wind farm has been limited to 90% in order to keep
network voltages within acceptable limits. Expansion of the wind farm is forecast by
the wind farm operator due to the location’s good wind resource, and therefore
overcoming this restriction is required.
A generation analysis has determined that the wind farm does not currently lose
much annual production due to the imposed maximum power limit. However, the
implementation of an additional wind turbine generator results in substantial
impact on the wind farm’s annual production. A battery energy storage system can
limit the amount of wasted generation from the expanded wind farm, but such
systems are expensive for utility-scale utilisation and so are not yet economically
feasible to implement.
Modern wind turbine generator technology can provide dynamic reactive power
support to the distribution network. Application of such machines allows the wind
farm to generate at its full potential whilst keeping network voltages within
acceptable limits. This is confirmed through simulation of the Denmark distribution
network.

ix
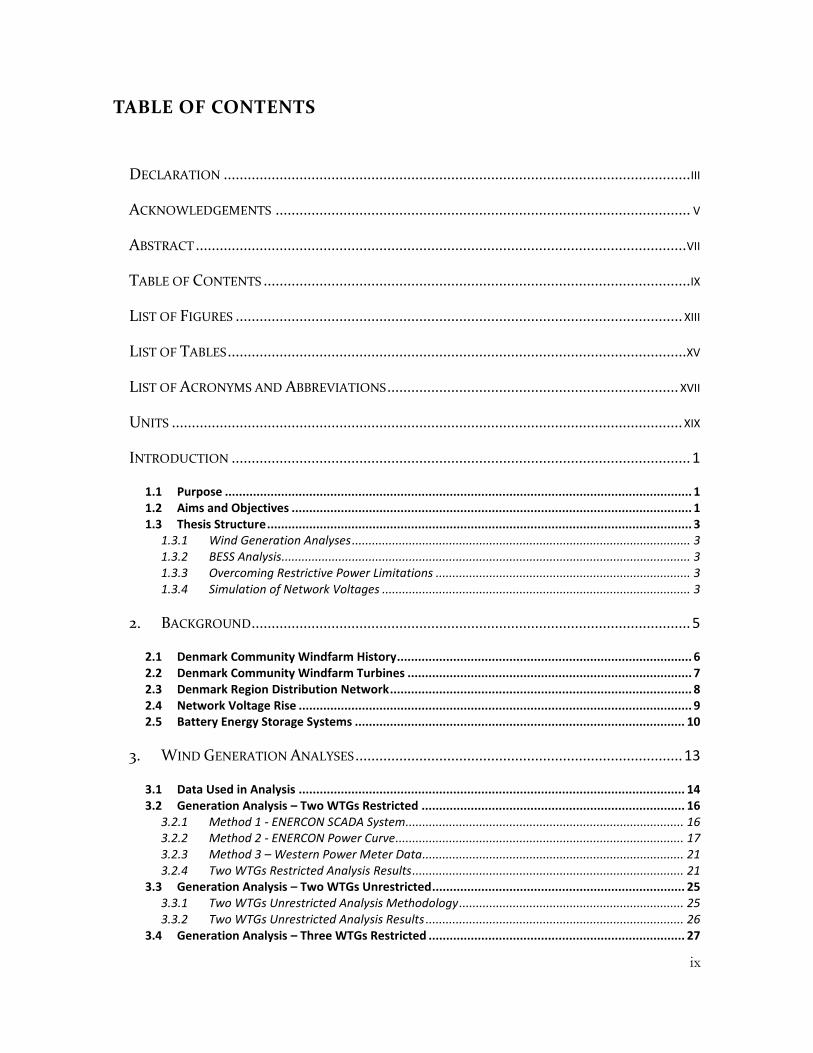
TABLE OF CONTENTS
DECLARATION ..................................................................................................................... III
ACKNOWLEDGEMENTS ........................................................................................................ V
ABSTRACT ........................................................................................................................... VII
TABLE OF CONTENTS ........................................................................................................... IX
LIST OF FIGURES ................................................................................................................ XIII
LIST OF TABLES ................................................................................................................... XV
LIST OF ACRONYMS AND ABBREVIATIONS ......................................................................... XVII
UNITS ................................................................................................................................ XIX
INTRODUCTION ................................................................................................................... 1
1.1 Purpose ..................................................................................................................................... 1 1.2 Aims and Objectives .................................................................................................................. 1 1.3 Thesis Structure ......................................................................................................................... 3
1.3.1 Wind Generation Analyses ..................................................................................................... 3 1.3.2 BESS Analysis.......................................................................................................................... 3 1.3.3 Overcoming Restrictive Power Limitations ............................................................................ 3 1.3.4 Simulation of Network Voltages ............................................................................................ 3
2. BACKGROUND .............................................................................................................. 5
2.1 Denmark Community Windfarm History .................................................................................... 6 2.2 Denmark Community Windfarm Turbines ................................................................................. 7 2.3 Denmark Region Distribution Network ...................................................................................... 8 2.4 Network Voltage Rise ................................................................................................................ 9 2.5 Battery Energy Storage Systems .............................................................................................. 10
3. WIND GENERATION ANALYSES .................................................................................. 13
3.1 Data Used in Analysis .............................................................................................................. 14 3.2 Generation Analysis – Two WTGs Restricted ........................................................................... 16
3.2.1 Method 1 - ENERCON SCADA System ................................................................................... 16 3.2.2 Method 2 - ENERCON Power Curve ...................................................................................... 17 3.2.3 Method 3 – Western Power Meter Data .............................................................................. 21 3.2.4 Two WTGs Restricted Analysis Results ................................................................................. 21
3.3 Generation Analysis – Two WTGs Unrestricted ........................................................................ 25 3.3.1 Two WTGs Unrestricted Analysis Methodology ................................................................... 25 3.3.2 Two WTGs Unrestricted Analysis Results ............................................................................. 26
3.4 Generation Analysis – Three WTGs Restricted ......................................................................... 27

x
3.4.1 Three WTGs Restricted Analysis Methodology .................................................................... 27 3.4.2 Three WTGs Restricted Analysis Results .............................................................................. 28
3.5 Generation Analysis – Three WTGs Unrestricted ..................................................................... 29 3.5.1 Three WTGs Unrestricted Analysis Methodology ................................................................ 29 3.5.2 Three WTGs Unrestricted Analysis Results ........................................................................... 29
3.6 Effect of Increasing Power Limitation ...................................................................................... 31 3.7 DCWF Capacity Factor.............................................................................................................. 32 3.8 Third WTG Site......................................................................................................................... 33 3.9 Third WTG Economic Analysis .................................................................................................. 36
4. BESS ANALYSIS ......................................................................................................... 39
4.1 BESS Size .................................................................................................................................. 40 4.2 BESS Type ................................................................................................................................ 42
4.2.1 Vanadium Redox Battery Option ......................................................................................... 43 4.2.2 Lithium-Ion Battery Option .................................................................................................. 46
4.3 BESS Generation Analysis ........................................................................................................ 50 4.3.1 Maximum Generation Mode ................................................................................................ 50 4.3.2 DCWF Output with BESS in MGM ........................................................................................ 53 4.3.3 Peak Shaving Mode .............................................................................................................. 56
4.4 BESS Economic Analysis ........................................................................................................... 59 4.4.1 BESS Pricing .......................................................................................................................... 59 4.4.2 BESS Payback ....................................................................................................................... 61
5. OVERCOMING RESTRICTIVE POWER LIMITATIONS ..................................................... 67
5.1 BESS Inverter ........................................................................................................................... 67 5.2 STATCOM ................................................................................................................................ 67 5.3 ENERCON WTG Technology ..................................................................................................... 68
6. SIMULATION OF NETWORK VOLTAGES ...................................................................... 71
6.1 PowerFactory Model ............................................................................................................... 72 6.2 Simulation of Original Network ............................................................................................... 73 6.3 Simulation of Two WTGs – Limited Output .............................................................................. 75 6.4 Simulation of Two WTGs – Maximum Output .......................................................................... 76 6.5 Simulation of Three WTGs – Limited Output............................................................................ 77 6.6 Simulation of Three WTGs – Maximum Output ....................................................................... 78 6.7 Simulation of Three WTGs with Q+ and STATCOM Option – No Output .................................. 79 6.8 Simulation of Three WTGs with STATCOM Option – Limited Output ....................................... 80 6.9 Simulation of Three WTGs with STATCOM Option – Maximum Output ................................... 81
7. PROJECT COMPLICATIONS ......................................................................................... 83
8. CONCLUSION ............................................................................................................. 85
9. REFERENCES............................................................................................................... 87
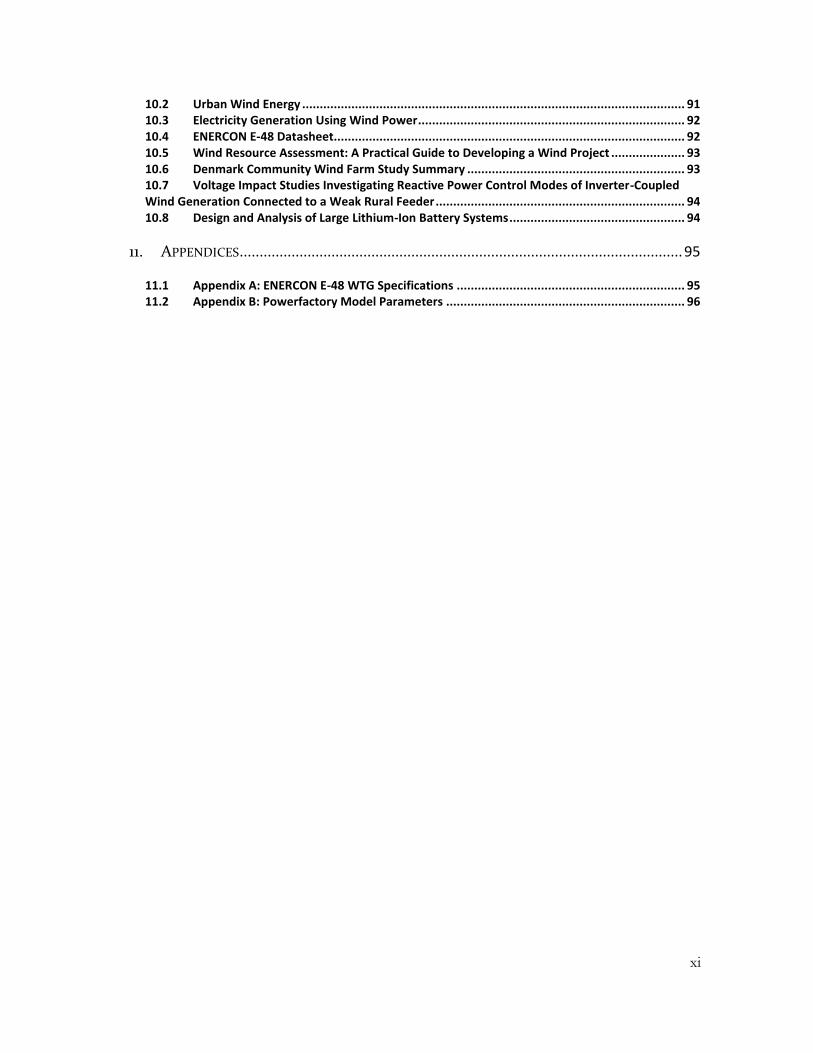
10. LITERATURE REVIEW ............................................................................................. 91
10.1 Developing Wind Power Projects ........................................................................................ 91
xi
10.2 Urban Wind Energy ............................................................................................................. 91 10.3 Electricity Generation Using Wind Power ............................................................................ 92 10.4 ENERCON E-48 Datasheet.................................................................................................... 92 10.5 Wind Resource Assessment: A Practical Guide to Developing a Wind Project ..................... 93 10.6 Denmark Community Wind Farm Study Summary .............................................................. 93 10.7 Voltage Impact Studies Investigating Reactive Power Control Modes of Inverter-Coupled Wind Generation Connected to a Weak Rural Feeder ....................................................................... 94 10.8 Design and Analysis of Large Lithium-Ion Battery Systems .................................................. 94
11. APPENDICES ............................................................................................................... 95
11.1 Appendix A: ENERCON E-48 WTG Specifications ................................................................. 95 11.2 Appendix B: Powerfactory Model Parameters .................................................................... 96


xiii
LIST OF FIGURES
Figure 1: DCWF Site ................................................................................................................ 5
Figure 2: DCWF Construction ................................................................................................. 6
Figure 3: Anemomter at Mt Barker Wind Farm ..................................................................... 7
Figure 4: Simplified Denmark Region Distribution Network .................................................. 8
Figure 5: ENERCON E-48 Formulated Power Curve.............................................................. 19
Figure 6: Comparison of Results from Analysis Methods .................................................... 23
Figure 7: Two WTGs Limited and Unlimited Operation ....................................................... 26
Figure 8: Two and Three WTGs Limited and Unlimited Operation ...................................... 30
Figure 9: Sensitivity Analysis of Annual Generation with Increasing Power Limitation ...... 31
Figure 10: Wind Rose of the DCWF Site ............................................................................... 34
Figure 11: Possible Locations for T3 ..................................................................................... 35
Figure 12: Third WTG Payback Period .................................................................................. 38
Figure 13: Battery Power Selection ...................................................................................... 40
Figure 14: Annual Output of BESS with Inreasing Battery Capacity ..................................... 41
Figure 15: Vanadium Redox Battery Technology ................................................................. 44
Figure 16: Lithium-Ion Battery Technology .......................................................................... 47
Figure 17: DCWF Best Week of Generation ......................................................................... 53
Figure 18: DCWF Worst Week of Generation ...................................................................... 54
Figure 19: DCWF Average Week of Generation ................................................................... 55
Figure 20: Payback Period for BESS Expansion in 2017 ........................................................ 65
Figure 21: Payback Period for BESS Expansion in 2020 ........................................................ 66
Figure 22: Conventional E-48 WTG P-Q Characterisitc ........................................................ 68
Figure 23: E-48 WTG with Q+ P-Q Characteristic ................................................................. 69
Figure 24: WTG with Q+ and STATCOM P-Q Characteristic ................................................. 70
Figure 25: PowerFactory Simulated Network ...................................................................... 72
Figure 26: Simulation of Original Network ........................................................................... 74
Figure 27: Simulation of Two WTGs - Limited Output ......................................................... 75

xiv
Figure 28: Simulation of Two WTGs – Maximum Output .................................................... 76
Figure 29: Simulation of Three WTGs - Limited Output ....................................................... 77
Figure 30: Simulation of Three WTGs - Maximum Output ................................................... 78
Figure 31: Simulation of Three WTGs with Q+ and STATCOM - No Output ........................ 79
Figure 32: Simulation of Three WTGs with Q+ and STATCOM - Limited Output ................. 80
Figure 33: Simulation of Three WTGs with Q+ and STATCOM - Maximum Output ............. 81
xv
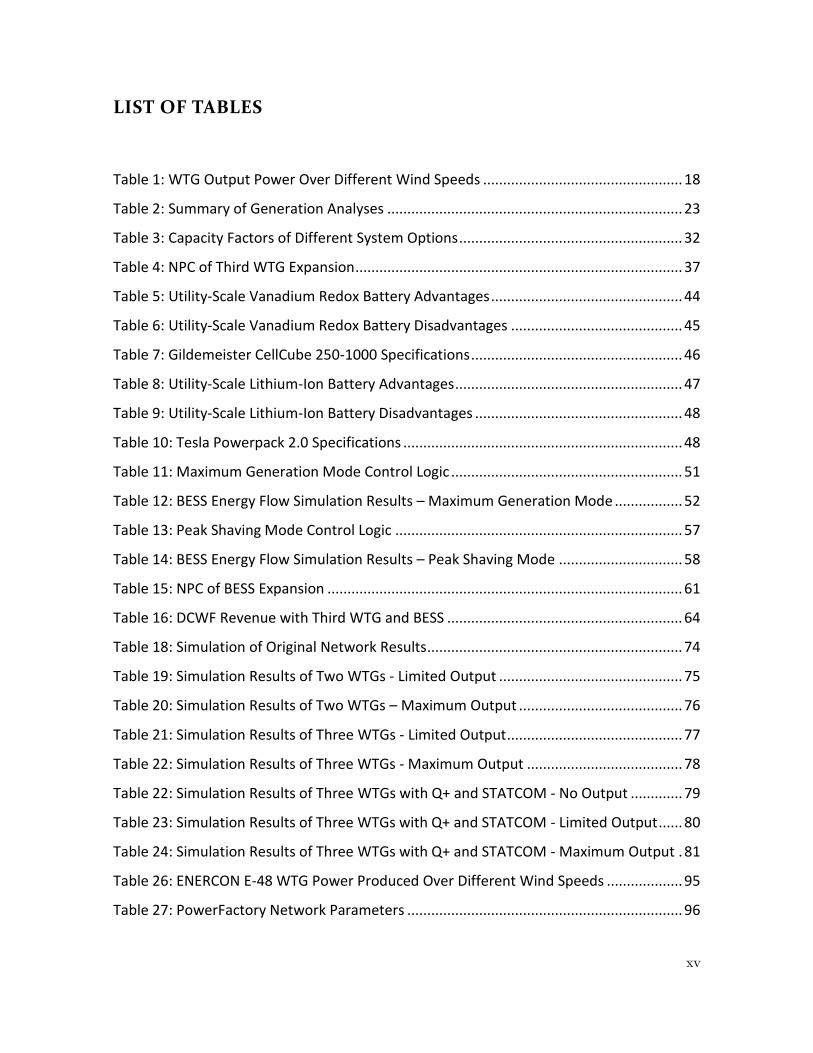
LIST OF TABLES
Table 1: WTG Output Power Over Different Wind Speeds .................................................. 18
Table 2: Summary of Generation Analyses .......................................................................... 23
Table 3: Capacity Factors of Different System Options ........................................................ 32
Table 4: NPC of Third WTG Expansion .................................................................................. 37
Table 5: Utility-Scale Vanadium Redox Battery Advantages ................................................ 44
Table 6: Utility-Scale Vanadium Redox Battery Disadvantages ........................................... 45
Table 7: Gildemeister CellCube 250-1000 Specifications ..................................................... 46
Table 8: Utility-Scale Lithium-Ion Battery Advantages ......................................................... 47
Table 9: Utility-Scale Lithium-Ion Battery Disadvantages .................................................... 48
Table 10: Tesla Powerpack 2.0 Specifications ...................................................................... 48
Table 11: Maximum Generation Mode Control Logic .......................................................... 51
Table 12: BESS Energy Flow Simulation Results – Maximum Generation Mode ................. 52
Table 13: Peak Shaving Mode Control Logic ........................................................................ 57
Table 14: BESS Energy Flow Simulation Results – Peak Shaving Mode ............................... 58
Table 15: NPC of BESS Expansion ......................................................................................... 61
Table 16: DCWF Revenue with Third WTG and BESS ........................................................... 64
Table 18: Simulation of Original Network Results ................................................................ 74
Table 19: Simulation Results of Two WTGs - Limited Output .............................................. 75
Table 20: Simulation Results of Two WTGs – Maximum Output ......................................... 76
Table 21: Simulation Results of Three WTGs - Limited Output ............................................ 77
Table 22: Simulation Results of Three WTGs - Maximum Output ....................................... 78
Table 22: Simulation Results of Three WTGs with Q+ and STATCOM - No Output ............. 79
Table 23: Simulation Results of Three WTGs with Q+ and STATCOM - Limited Output ...... 80
Table 24: Simulation Results of Three WTGs with Q+ and STATCOM - Maximum Output . 81
Table 26: ENERCON E-48 WTG Power Produced Over Different Wind Speeds ................... 95
Table 27: PowerFactory Network Parameters ..................................................................... 96


xvii
LIST OF ACRONYMS AND ABBREVIATIONS
ARENA Australian Renewable Energy Agency
BESS(s) Battery Energy Storage System
BRCP Benchmark Reserve Capacity Price
DCW Denmark Community Windfarm
DoD Depth of Discharge
ESS ENERCON SCADA system
LDF Lower Denmark Feeder
LIB(s) Lithium-Ion Battery(s)
LGC(s) Large-scale Energy Certificate(s)
POC Point of Connection
MGM Maximum Generation Mode
MV Medium Voltage
NPC Net Present Cost
NPV Net Present Value
O&M Operation and Maintenance
POC Point of Connection
POE Price of Electricity
PSM Peak Shaving Mode
PPA Power Purchase Agreement
REC(s) Renewable Energy Certificate(s)

xviii
SCADA Supervisory Control and Data Acquisition
STEM Short Term Energy Market
SWIS South West Interconnected System
T1 Turbine 1
T2 Turbine 2
T3 Turbine 3
VRB(s) Vanadium Redox Battery(s)
WEM Wholesale Electricity Market
WTG(s) Wind Turbine Generator(s)
xix
UNITS
A Ampere
°C Degrees Celsius
m Metre
s Second
m/s Metre/Second
km Kilometre
kV Kilovolt
kW Kilowatt
kWh Kilowatt Hour
m2 Squared Metre
ms Millisecond
MW Megawatt
MWh Megawatt Hour
MVAr Mega Volt-Ampere reactive
T Ton
V Volt

1
INTRODUCTION
1.1 Purpose
The purpose of this report is to document the engineering thesis project undertaken
by Aiden James Stankovic in partial fulfilment of the requirements of a Bachelor of
Engineering Honours degree at Murdoch University.
1.2 Aim and Objectives
The Denmark Community Windfarm (DCWF) is a wind farm located in Denmark,
Western Australia currently comprising of two 800 kW ENERCON E-48 wind
turbine generators (WTGs). Due to the location of the wind farm on the Denmark
distribution network, the wind farm faces current issues with network voltage rise at
the point of connection (POC) at times of maximum output. Consequently the
power limit of the WTGs has been limited to 90% of rated capacity, 720 kW, and the
WTGs are required to operate at a fixed power factor of 0.9 absorbing.
The DCWF Board has requested an investigation into the expansion of the DCWF.
The implementation of a third ENERCON E-48 WTG has been proposed as an
expansion option to the wind farm. The possible inclusion of a battery energy
storage system (BESS) has also been considered as an option to develop the DCWF.
2
In order to maximise the potential generation from the DCWF, the power limitation
from the wind farm will be attempted to be raised. The aim of this thesis is to
investigate different options to raise the maximum power limit of the DCWF and
each option tested for effectiveness. Simulations of the network will ultimately be
carried out to test the impact of different limit-raising options on the network
voltage.
An economic analysis will also be carried out on proposed expansion options. Net
present cost (NPC), net present value (NPV), and payback period of the different
system options will be calculated to determine their economic feasibility.
The objectives of the thesis project can be summarised below:
• Perform a generation analysis of the current operation of the DCWF;
• Perform a generation analysis of the expanded operation of the DCWF with a
third WTG;
• Research and determine an appropriate type, size, and make and model of
battery storage product;
• Perform a generation analysis of the expanded operation of the DCWF with
the inclusion of the BESS;
• Carry out an economic analysis of different expansion options; and
• Simulate different expansion options to determine effect on network voltage.
3
1.3 Thesis Structure
The thesis project report body has been broken down into four main sections. This is
due to the individual methodologies and broad nature of the project. Itemisation of
the various section components is shown below.
1.3.1 Wind Generation Analyses
• Generation analysis of the DCWF with and without power restrictions.
• Generation analysis of the expanded DCWF with third WTG.
• Economic analysis of third WTG.
1.3.2 BESS Analysis
• BESS size and type selection.
• Generation analysis of the expanded DCWF with third WTG and BESS.
• Economic analysis of BESS.
1.3.3 Overcoming Restrictive Power Limitations
• Q+ and STATCOM option for this WTG.
• BESS inverter reactive power capabilities.
1.3.4 Simulation of Network Voltages
• Simulation of network voltages to assess impact of investigated expansion
options.


5
2. BACKGROUND
The Denmark Community Windfarm (DCWF) is located approximately 400 km
south of Perth, 10 km south of the town of Denmark, in the Great Southern region of
Western Australia. Figure 1 shows the layout of the DCWF site, encompassing both
WTGs, Turbine 1 (T1) and Turbine 2 (T2); the electrical switch-room; and the
constructed roads on the site [1]. (Image used with author’s permission)
Figure 1: DCWF Site
6
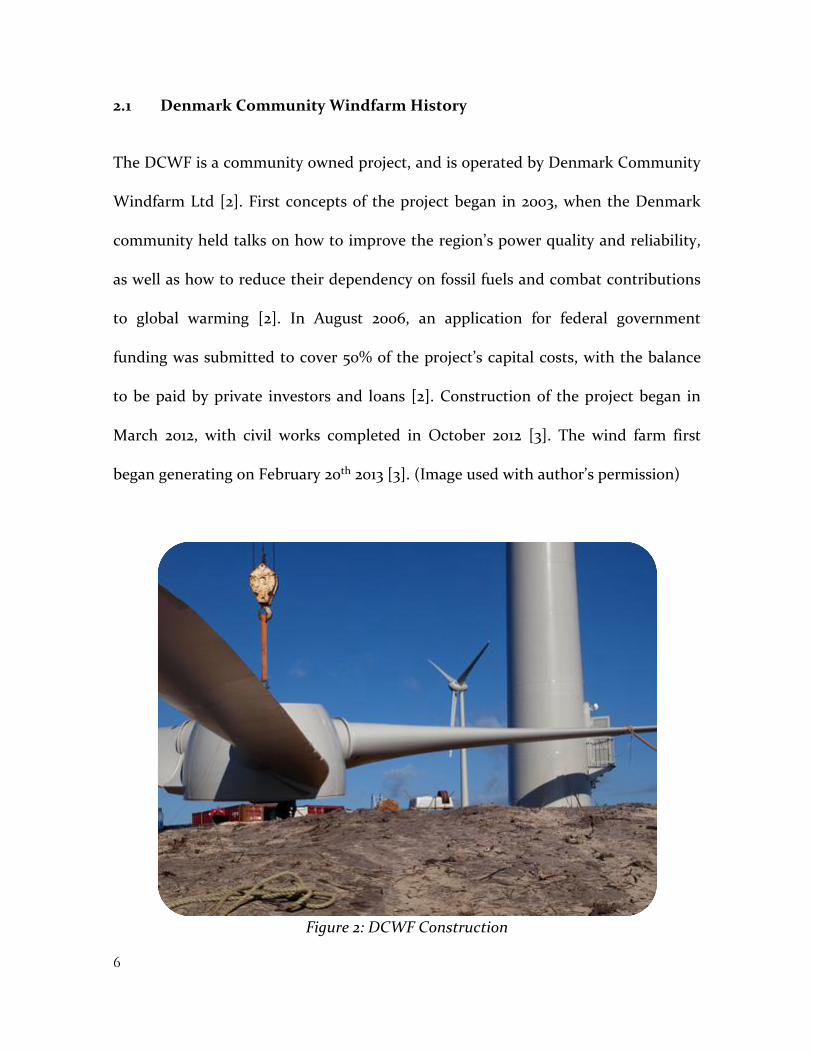
2.1 Denmark Community Windfarm History
The DCWF is a community owned project, and is operated by Denmark Community
Windfarm Ltd [2]. First concepts of the project began in 2003, when the Denmark
community held talks on how to improve the region’s power quality and reliability,
as well as how to reduce their dependency on fossil fuels and combat contributions
to global warming [2]. In August 2006, an application for federal government
funding was submitted to cover 50% of the project’s capital costs, with the balance
to be paid by private investors and loans [2]. Construction of the project began in
March 2012, with civil works completed in October 2012 [3]. The wind farm first
began generating on February 20th 2013 [3]. (Image used with author’s permission)
Figure 2: DCWF Construction

7
2.2 Denmark Community Windfarm Turbines
The wind farm currently comprises of two 800 kW ENERCON E-48, each of 55-
meter hub height and 48-meter blade diameter [4]. The WTGs are classified Class IV
variable speed, active pitch-controlled, inverter-coupled machines [4]. The
ENERCON SCADA system (ESS) installed in the WTGs allows for the remote
monitoring of generation and environmental parameters, logged in 10-minute
averages [4]. More information on the WTG characteristics can be found in
Appendix A: ENERCON E-48 WTG Specifications. (Image used with author’s
permission)
Figure 3: Anemomter at Mt Barker Wind Farm

8
2.3 Denmark Region Distribution Network
The South-West Interconnected System (SWIS), operated by Western Power, is the
medium of electricity transportation in the southwest of Australia. The transmission
network extends from Kalbarri in the north to Albany in the south and Busselton in
the west to Kalgoorlie in the east [5]. The Denmark distribution network forms part
of the SWIS. However, the remoteness of regional Western Australia means that
electrical power is generated in Albany and transmitted across 70km of transmission
lines to Denmark. Thus, the need for local generation becomes apparent.
The DCWF is connected to the SWIS at the terminating end of a 22km long 22kV
distribution line that branches out from the Lower Denmark Feeder (LDF). The LDF
is then connected to Albany Substation, which is approximately 70km along the
transmission line east of Denmark [6]. A simplified single line diagram of the
Denmark region distribution network is shown in Figure 4.
Figure 4: Simplified Denmark Region Distribution Network

9
2.4 Network Voltage Rise
Network stability and reliability is crucial in the continuous supply of electricity to
consumers. Sudden changes in generation or load demand in a network can cause
voltage rise or droop [7]. This may lead to switching events that effectively open
circuit the network, therefore causing a blackout.
As such, network voltage, frequency, and reactive power should all be monitored and
controlled within certain limits before network parameters fall outside operational
limits [8]. Western Power stipulates that generators connected to the SWIN must keep
network voltages within 0.9pu and 1.1pu, or ±10% of nominal voltage [8]. However, in
the planning stages of projects ±6% is used for voltage limits [7].
The DCWF is considered to be at a low fault level; the short circuit current
contributed by the WTGs is limited by the inverters, and the short circuit impedance
seen by the WTGs is greatest at the end of the LDF where the turbines are connected
[9]. The embedded generation source at the end of the high impedance LDF causes
significant voltage rise at the POC.
Limitations on the output of generators connected to distribution network may be
imposed to prevent this voltage rise [7]. To limit the voltage rise at the POC at the
DCWF, the wind farm is required to operate at 90% of rated capacity, 1.44MW (720
kW), and 0.9 lagging power factor, absorbing reactive power.
10
2.5 Battery Energy Storage Systems
A primary objective to ensure the reliability of any electrical power system is to
maintain a continuous balance between the production and consumption of
electrical power; power generated within the system must match the load demanded
by the system [9].
A considerable problem with renewable energy, such as wind and solar, is the
variability of resource supply. This variability makes it extremely difficult to match
renewable generators with real-time consumption, as the amount of electrical power
that is readily available fluctuates with resource availability, and the load demand
also changes with time of day, week and year [10]. A possible solution to this
problem is the storage of electrical energy so that it can be consumed on demand.
Battery storage allows electricity generated from renewable resources to be
consumed at peak network loads, rather than at times when network loads are low
and renewable generation is high [10]. Different factors have influenced the
commercialisation of battery storage technologies into the renewable energy market,
namely cost and product availability [11]. However, the technology, coupled with
renewable energy generators, is being progressively utilized in modern times as
research and development into the technology continues [11].
11
Battery energy storage systems (BESSs) have traditionally been very expensive in
utility-scale storage options. However, the price of such systems has declined in
recent years due to research and innovation, with studies predicting from that prices
will continue to decrease [12]. Research and development into various BESS
technologies has made several systems available for commercial utilisation, with
large-scale battery storage capacity now totalling more than 800 MWh worldwide
[13].
The price of BESSs are predicted to rapidly decline in years to come, which will also
see an increase in their implementation in renewable energy integration. Such
storage systems contribute to the security and reliability of wind power systems, as
the ability to store energy for later consumption is what is required to ensure load
demand will always be met. This will result in an increase in renewable energy
penetration [14].

13
3. WIND GENERATION ANALYSES
Assessment of a site’s wind resource and subsequent generation is one of the most
critical exercises in wind farm projects. This enables the wind farm operator to
evaluate the wind farm’s performance; troubleshoot switching events and outages;
and predict future wind farm generation to facilitate wind farm expansion.
A wind generation analysis of the DCWF in multiple operational states has been
undertaken in order to assess the optimal mode of operation. The optimal mode of
operation of the DCWF refers to the number of WTGs constituting the wind farm, as
well as the maximum power limit that will result in the greatest annual production
whilst minimizing cost and maintaining network stability.
The wind generation analyses conducted in this project have all used the same
methodology in order to provide an accurate comparison. This method is termed the
“ENERCON Power Curve” methodology. The analysis of the DCWF in its current
operational state has been studied using three separate analysis techniques. This is
done in order to verify that the “ENERCON Power Curve” methodology is accurate,
as the method is used extensively in subsequent parts of the project.

14
3.1 Data Used in Analysis
The analysis period that data has been obtained for the DCWF thesis project has
been chosen to be March 1st 2015 – March 1st 2016, providing one full year of data.
Using the annual period of March – March also provides two additional years of data
for comparison, as the DCWF has logged data since its commissioning in February
2013 [3]. Reliable weather station data is not available in the Denmark region, with
the closest wind speeds to correlate with measured in Albany, approximately 50 kms
away. The annual generation data obtained for the analysis period is 4.3% lower than
the average for all three years. Thus, the analyses presented in this report will be
slightly underestimated, but are adequate for comparison and assessment purposes.
The data acquired for this project has been obtained using the ENERCON SCADA
System (ESS). The ENERCON E-48 WTGs are remotely monitored using the ESS.
This provides the wind turbine operator the ability to download data that has been
logged by the WTGs [4]. Working with SkyFarming, the following data for each
WTG for the analysis period has been acquired:
• Average wind speed at hub height (m/s)
• Nacelle Orientation (°)
• Average power (kW)
• Average reactive power (kVAR)
• Energy produced (kWh)
15
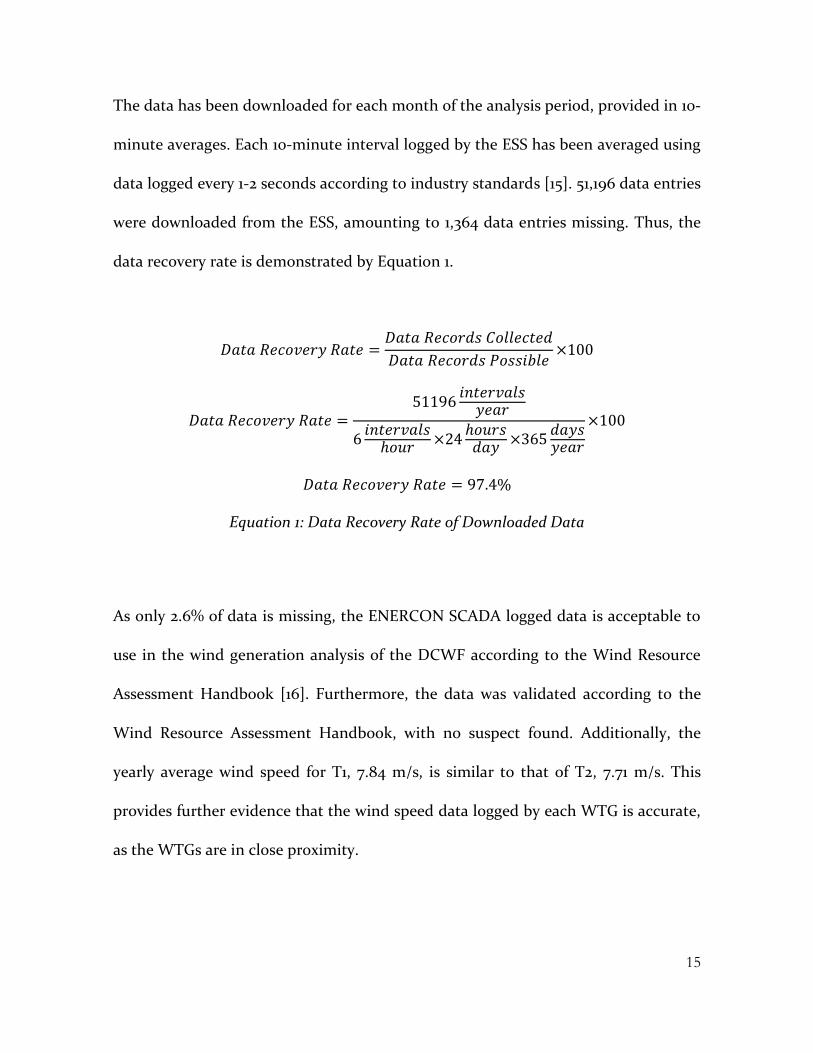
The data has been downloaded for each month of the analysis period, provided in 10-
minute averages. Each 10-minute interval logged by the ESS has been averaged using
data logged every 1-2 seconds according to industry standards [15]. 51,196 data entries
were downloaded from the ESS, amounting to 1,364 data entries missing. Thus, the
data recovery rate is demonstrated by Equation 1.
𝐷𝑎𝑡𝑎 𝑅𝑒𝑐𝑜𝑣𝑒𝑟𝑦 𝑅𝑎𝑡𝑒 =𝐷𝑎𝑡𝑎 𝑅𝑒𝑐𝑜𝑟𝑑𝑠 𝐶𝑜𝑙𝑙𝑒𝑐𝑡𝑒𝑑
𝐷𝑎𝑡𝑎 𝑅𝑒𝑐𝑜𝑟𝑑𝑠 𝑃𝑜𝑠𝑠𝑖𝑏𝑙𝑒×100
𝐷𝑎𝑡𝑎 𝑅𝑒𝑐𝑜𝑣𝑒𝑟𝑦 𝑅𝑎𝑡𝑒 =51196
𝑖𝑛𝑡𝑒𝑟𝑣𝑎𝑙𝑠𝑦𝑒𝑎𝑟
6𝑖𝑛𝑡𝑒𝑟𝑣𝑎𝑙𝑠
ℎ𝑜𝑢𝑟×24
ℎ𝑜𝑢𝑟𝑠𝑑𝑎𝑦
×365𝑑𝑎𝑦𝑠𝑦𝑒𝑎𝑟
×100
𝐷𝑎𝑡𝑎 𝑅𝑒𝑐𝑜𝑣𝑒𝑟𝑦 𝑅𝑎𝑡𝑒 = 97.4%
Equation 1: Data Recovery Rate of Downloaded Data
As only 2.6% of data is missing, the ENERCON SCADA logged data is acceptable to
use in the wind generation analysis of the DCWF according to the Wind Resource
Assessment Handbook [16]. Furthermore, the data was validated according to the
Wind Resource Assessment Handbook, with no suspect found. Additionally, the
yearly average wind speed for T1, 7.84 m/s, is similar to that of T2, 7.71 m/s. This
provides further evidence that the wind speed data logged by each WTG is accurate,
as the WTGs are in close proximity.
16
3.2 Generation Analysis – Two WTGs Restricted
A generation analysis of the DCWF in its current state of operation has been
performed in order to demonstrate the wind farm’s annual production with
currently imposed maximum power restrictions. As previously mentioned, the data
used in the analysis will be subsequently used in later parts of the project. Therefore,
it is vital that the generation analysis of the DCWF’s current operation be performed.
To ensure the accuracy of future results, the current generation analysis has been
undertaken using three independent methods; each will be compared to show the
data’s validity.
3.2.1 Method 1 - ENERCON SCADA System
The first generation analysis technique employed in the evaluation of the DCWF’s
current annual generation is the assessment of ENERCON SCADA data. As
mentioned beforehand, energy produced from each WTG has been downloaded via
the ESS. The energy produced by each WTG has been logged in kWh to one
significant figure for each month of the analysis period.
The annual output from each WTG has been found by summing all 10-minute
periods of energy production for each month of downloaded data.
17
3.2.2 Method 2 - ENERCON Power Curve
The second energy analysis method employed in the assessment of the DCWF’s
annual generation in its current operational state uses wind speed and the resulting
power produced by the WTGs. The power produced by the E-48 WTG at various
wind speeds is shown on the manufacturer’s datasheet [4]. The relationship is
represented in Table 25 in Appendix A: ENERCON E-48 WTG Specifications. A series
of equations have been developed in order to replicate the E-48 WTG power curve
shown in the manufacturer’s datasheet.
Wind speeds below 3 m/s produce no power from the WTG, and therefore this part
of the equation is defined as a constant 0 kW.
Wind speeds from cut-in wind speed, 3 m/s, to rated wind speed, 14 m/s, produce
variable power from the WTG. These wind speeds, obtained from the manufacturers
datasheet, have been plotted with their corresponding power produced, and then a
line of best fit applied to the plot. It is important to note that the line of best fit is
produced from a 6th order polynomial with the equation shown to 10 significant
figures in order to minimise errors. The generated equation is shown in Appendix A:
ENERCON E-48 WTG Specifications.
Wind speeds from 14 m/s to 28 m/s produce rated power from the WTG, 810 kW.
The relationship is modelled by a constant, 810 kW.
18
Assuming a linear ramp down relationship of the WTG for wind speeds between 28
m/s and 34 m/s, a further equation can be formulated that models the ENERCON
storm control feature. The storm control feature allows the WTG to reduce power
until cut-out wind speed is reached; therefore, the WTG does not suddenly stop
producing power. This linear ramp down relationship can be confirmed with visual
inspection of the power curve in the manufacturer’s datasheet [4].
Wind speeds above the WTG’s cut-out wind speed, 34 m/s, produce no power. The
relationship is modelled by a constant, 0 kW.
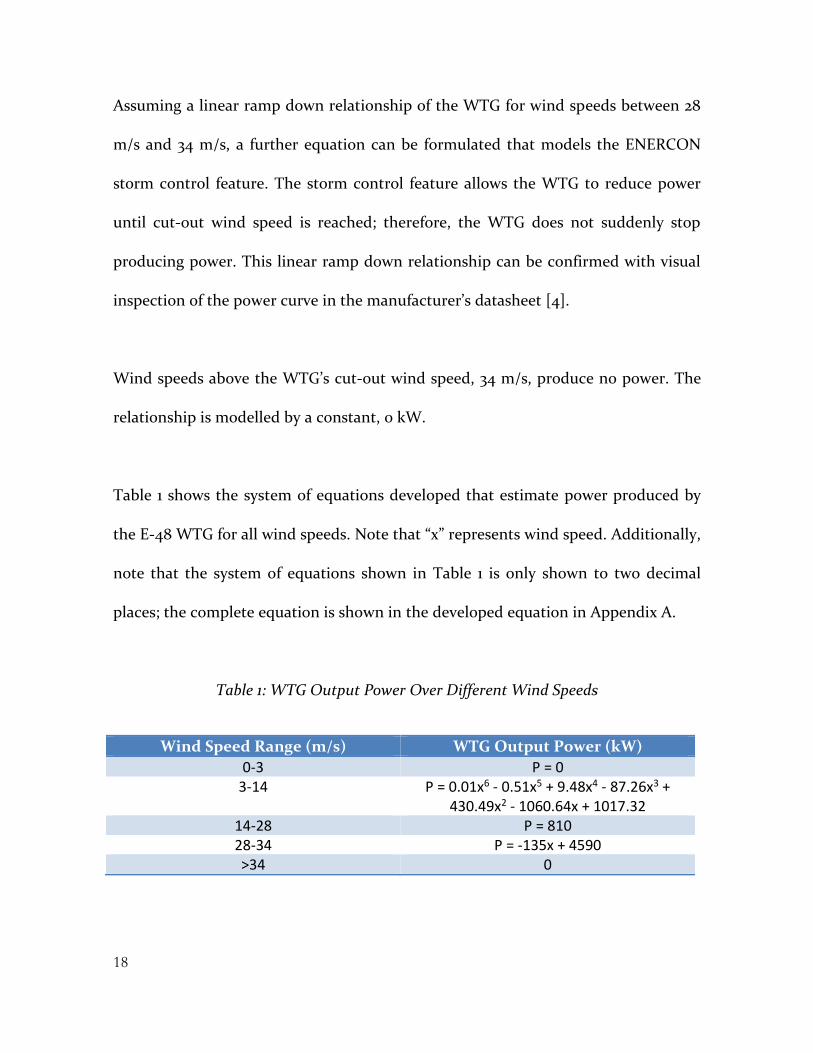
Table 1 shows the system of equations developed that estimate power produced by
the E-48 WTG for all wind speeds. Note that “x” represents wind speed. Additionally,
note that the system of equations shown in Table 1 is only shown to two decimal
places; the complete equation is shown in the developed equation in Appendix A.
Table 1: WTG Output Power Over Different Wind Speeds
Wind Speed Range (m/s) WTG Output Power (kW)
0-3 P = 0 3-14 P = 0.01x6 - 0.51x5 + 9.48x4 - 87.26x3 +
430.49x2 - 1060.64x + 1017.32 14-28 P = 810 28-34 P = -135x + 4590 >34 0

19
The WTG output power for all wind speeds is represented graphically in Figure 5
below. This has been achieved by plotting the equations shown in Table 1. The
formulated power curve is almost identical to the one shown on the manufacturer’s
datasheet.
Figure 5: ENERCON E-48 Formulated Power Curve
Annual generation for the analysis period can now be estimated using this series of
equations and wind speeds logged by the ESS. 10-minute averaged wind speeds for
both T1 and T2 have been downloaded from the system. The system of equations has
been implemented into Microsoft Excel using logic statements that test the logged
wind speed of each 10-minute interval.
0
100
200
300
400
500
600
700
800
900
0 2 4 6 8 10 12 14 16 18 20 22 24 26 28 30 32 34 36
Po
we
r P
rod
uce
d (
kW)
Wind Speed (m/s)
ENERCON E-48 Formulated Power Curve

20
The result of the equations is the 10-minute average output power of T1 and T2. Each
10-minute period’s energy yield can then be found by multiplying the average WTG
output power by 1
6. An example of energy output for a 10-minute interval is shown
below in Equation 2, where the logged 10-minute average wind speed is 9.5 m/s.
𝐴𝑣𝑒𝑟𝑎𝑔𝑒 𝑂𝑢𝑡𝑝𝑢𝑡 𝑃𝑜𝑤𝑒𝑟 (𝑘𝑊) = 0.01x6 − 0.51x5 + 9.48x4 − 87.26x3 + 430.49x2 − 1060.64x + 1017.32
𝐴𝑣𝑒𝑟𝑎𝑔𝑒 𝑂𝑢𝑡𝑝𝑢𝑡 𝑃𝑜𝑤𝑒𝑟 (𝑘𝑊) = 0.01×9.56 − 0.51×9.55 + 9.48×9.54 − 87.26×9.53 + 430.49×9.52 − 1060.64×9.5 + 1017.32
𝐴𝑣𝑒𝑟𝑎𝑔𝑒 𝑂𝑢𝑡𝑝𝑢𝑡 𝑃𝑜𝑤𝑒𝑟 = 476.28 kW
𝐸𝑛𝑒𝑟𝑔𝑦 𝑃𝑟𝑜𝑑𝑢𝑐𝑒𝑑 = 𝑃𝑜𝑤𝑒𝑟×𝑇𝑖𝑚𝑒 = 476.28kW×10 minutes/hour
60 minutes/hour= 79.38𝑘𝑊ℎ
Equation 2: ENERCON Power Curve Method Example
The current operation of the DCWF restricts the operation of the two WTGs to 720
kW each. This control scheme was implemented into the “ENERCON Power Curve”
method using further logic statements in Microsoft Excel. This effectively allowed
the DCWF in its current state of operation to be modelled.
The annual generation from the DCWF for the analysis period was then found by
summing the energy yield for each 10-minute period for both T1 and T2.

21
3.2.3 Method 3 – Western Power Meter Data
The third and final energy analysis method used in the assessment of the DCWF in
its current state of restricted output is the study of the exported electricity meter
data. The utility operator, Western Power, logs all electricity exported from the
DCWF to the SWIS after all power quality and transformations have taken place.
This data is available to download from the Australian Energy Market Operator
(AEMO) website for each month of interest in 30-minute averages [17].
The annual generation for the DCWF using the “Western Power Logged Data”
method has been found by summing the logged generation from all months
downloaded for the analysis period.
3.2.4 Two WTGs Restricted Analysis Results
All three methods of analysis for the DCWF’s generation for the analysis period can
be summarised below. Figure 6 shows the monthly output from the DCWF
consisting of two WTGs restricted at 1.44 MW.
22
The “ENERCON SCADA System” method of analysis has resulted in 2,581 MWh
generated from T1 and 2,548 MWh generated from T2. The total generation from
two E-48 WTGs at the DCWF restricted at 1.44 MW for the year of analysis is
therefore 5,129 MWh.
The “ENERCON Power Curve” method of generation analysis for the DCWF has
resulted in 2522MWh produced from T1 and 2462 MWh produced from T2. The
annual generation for the wind farm for the analysis period is therefore equal to
4984 MWh.
The electricity generated from the DCWF using the “Western power Meter Data”
analysis has been found to be 5043MWh. Individual WTG generation data is not
available, as the export is logged by Western Power after the point of connection
(POC) of the wind farm.
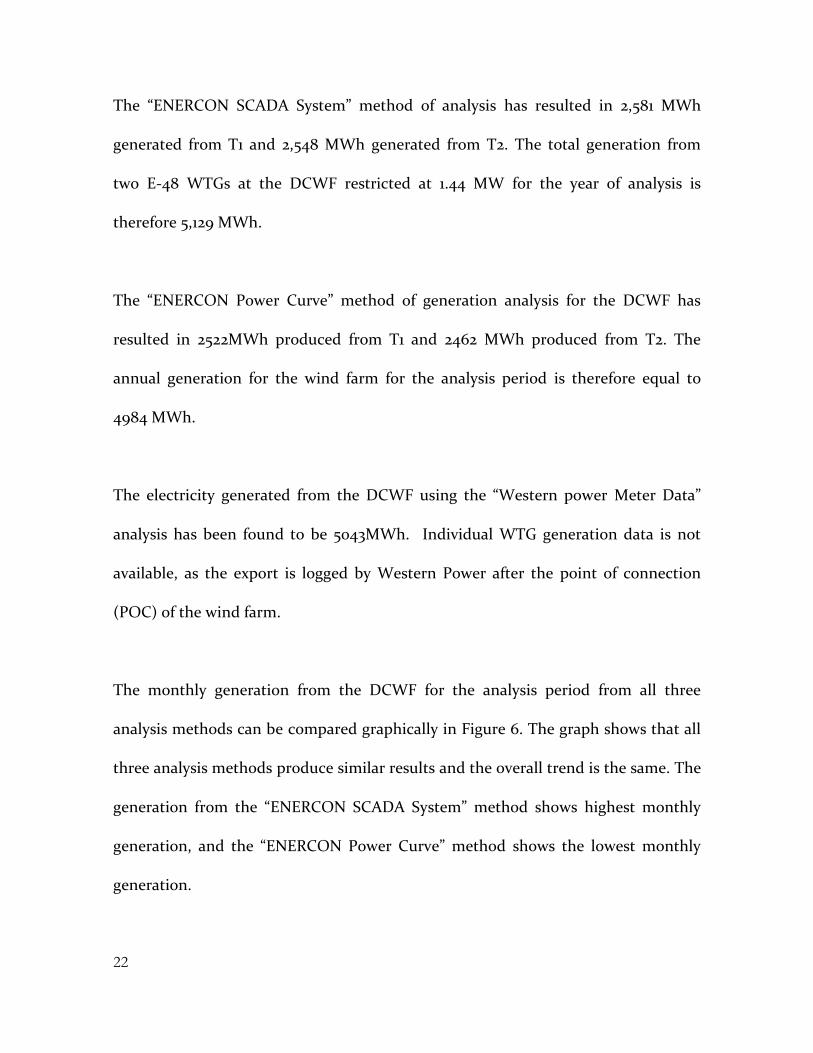
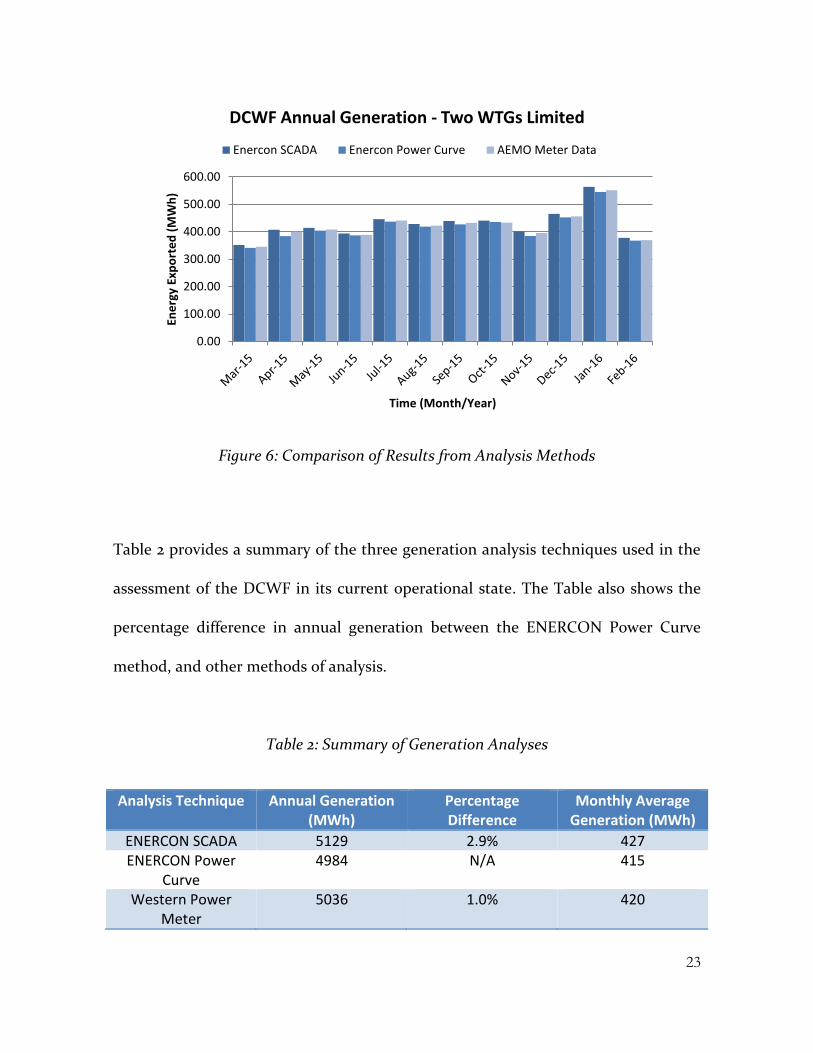
The monthly generation from the DCWF for the analysis period from all three
analysis methods can be compared graphically in Figure 6. The graph shows that all
three analysis methods produce similar results and the overall trend is the same. The
generation from the “ENERCON SCADA System” method shows highest monthly
generation, and the “ENERCON Power Curve” method shows the lowest monthly
generation.
23
Figure 6: Comparison of Results from Analysis Methods
Table 2 provides a summary of the three generation analysis techniques used in the
assessment of the DCWF in its current operational state. The Table also shows the
percentage difference in annual generation between the ENERCON Power Curve
method, and other methods of analysis.
Table 2: Summary of Generation Analyses
Analysis Technique Annual Generation (MWh)
Percentage Difference
Monthly Average Generation (MWh)
ENERCON SCADA 5129 2.9% 427 ENERCON Power
Curve 4984 N/A 415
Western Power Meter
5036 1.0% 420
0.00
100.00
200.00
300.00
400.00
500.00
600.00En
erg
y Ex
po
rte
d (
MW
h)
Time (Month/Year)
DCWF Annual Generation - Two WTGs Limited
Enercon SCADA Enercon Power Curve AEMO Meter Data
24
The ‘ENERCON Power Curve” method demonstrates the least annual production
from the DCWF. This may be due to the anemometer that measures wind speeds for
the ESS being located behind the nacelle of the WTGs. However, most modern
WTGs take this shadow effect into consideration before logging wind speeds [18].
Further discrepancies may arise from the ESS accuracy. The system only logs energy
produced from the WTGs to the nearest whole number, which may overestimate the
actual energy yield from the DCWF.
Lastly, the meter data from Western Power is logged after the POC of the DCWF.
Thus, transformer losses and line losses have already occurred once the energy
produced from the WTGs has been logged. As both other methods of estimation
have not taken these losses into account, this may have resulted in increased
generation from the “Western Power Meter Data” analysis method.
However, the comparison of results in Table 2 shows that the difference between the
analysis techniques is relatively small. This confirms that the “ENERCON Power
Curve” method of analysis is accurate enough to use in further generation analyses of
the thesis project.
25
3.3 Generation Analysis – Two WTGs Unrestricted
The next generation analysis performed of the DCWF will assess the wind farm’s
annual generation with current constituents of two E-48 WTGs operating with no
restrictions. Current maximum output restrictions limit the DCWF to 90% capacity,
1.44 MW, in order to keep network voltages within acceptable limits. In order to
assess the impedance of the power restrictions on the DCWF, a generation analysis
has been performed with the wind farm operating at its full rated capacity of 1.6
MW.
The purpose of this analysis is to determine how much of the wind farm’s annual
generation is lost due to current maximum power restrictions. Assessment of the
wind farm’s annual loss of generation is used to determine whether the maximum
power limitation should attempt to be overcome.
3.3.1 Two WTGs Unrestricted Analysis Methodology
The generation analysis for the unrestricted operation of the DCWF has been
performed using the “ENERCON Power Curve” method. However, in this case the
turbines are not limited to 720 kW; instead, they are analysed operating with no
maximum power limit. This has been implemented into Microsoft Excel by removing
the limit to the energy production of each WTG that was previously imposed.
26
3.3.2 Two WTGs Unrestricted Analysis Results
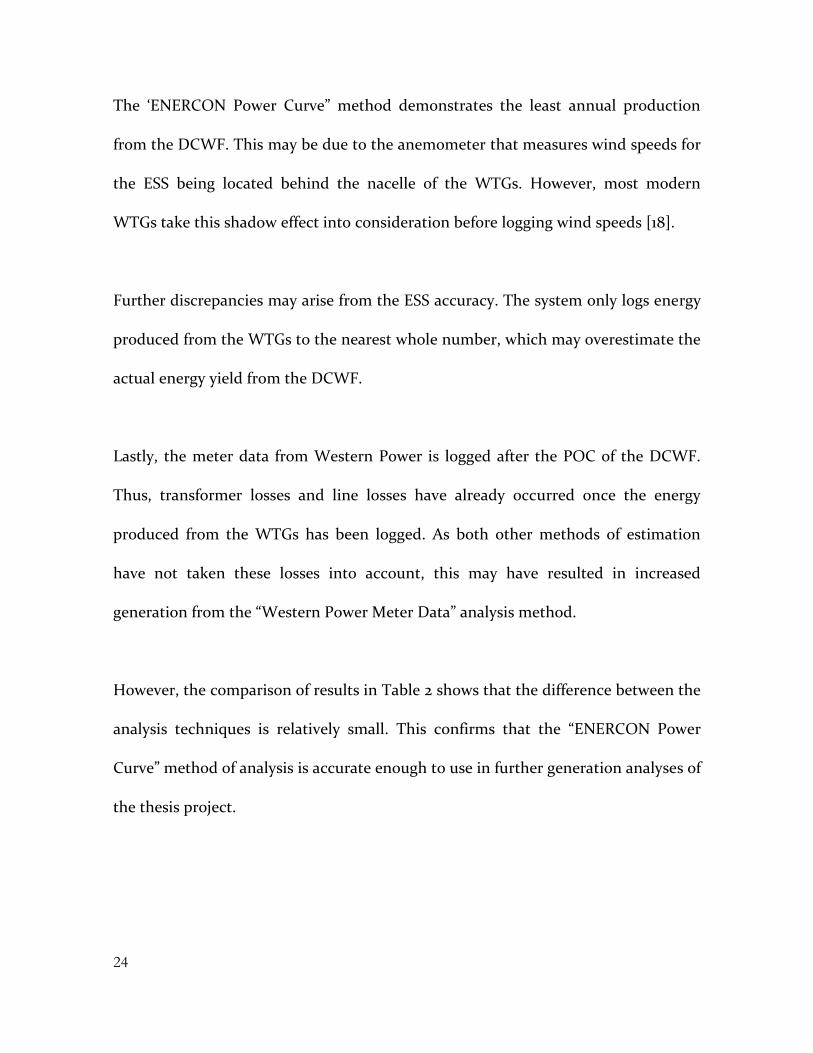
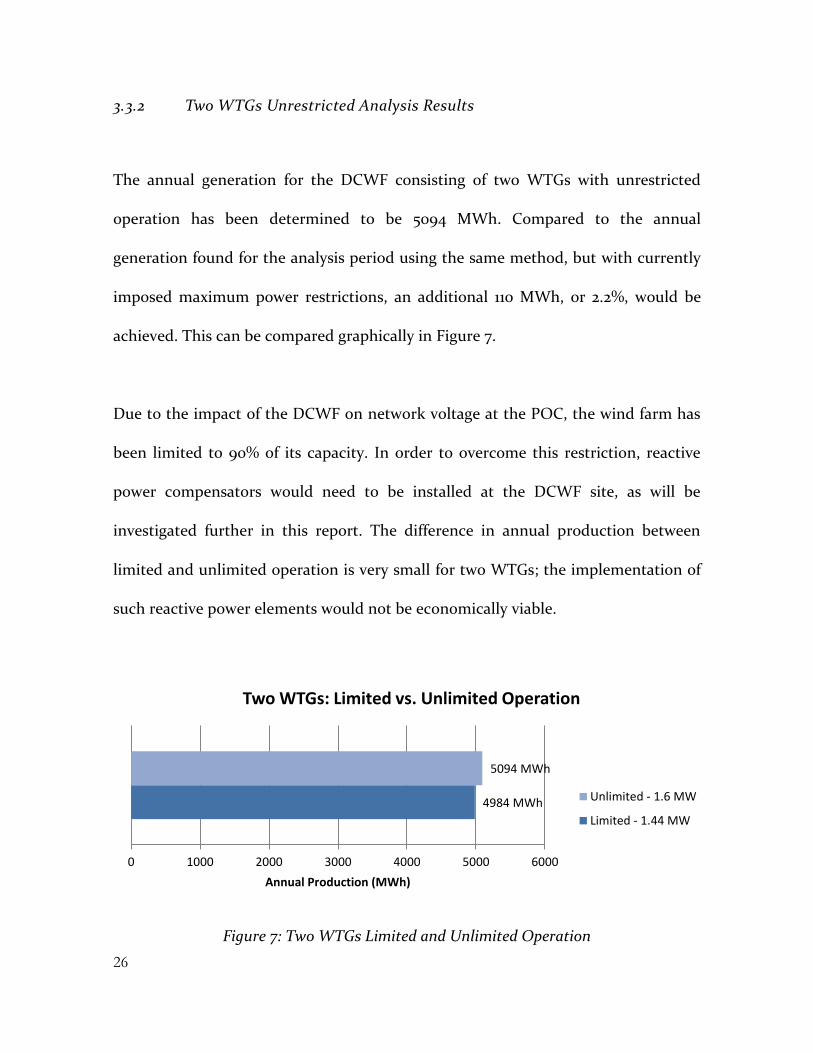
The annual generation for the DCWF consisting of two WTGs with unrestricted
operation has been determined to be 5094 MWh. Compared to the annual
generation found for the analysis period using the same method, but with currently
imposed maximum power restrictions, an additional 110 MWh, or 2.2%, would be
achieved. This can be compared graphically in Figure 7.
Due to the impact of the DCWF on network voltage at the POC, the wind farm has
been limited to 90% of its capacity. In order to overcome this restriction, reactive
power compensators would need to be installed at the DCWF site, as will be
investigated further in this report. The difference in annual production between
limited and unlimited operation is very small for two WTGs; the implementation of
such reactive power elements would not be economically viable.
Figure 7: Two WTGs Limited and Unlimited Operation
4984 MWh
5094 MWh
0 1000 2000 3000 4000 5000 6000
Annual Production (MWh)
Two WTGs: Limited vs. Unlimited Operation
Unlimited - 1.6 MW
Limited - 1.44 MW
27
3.4 Generation Analysis – Three WTGs Restricted
The DCWF Board have specified that one option for expansion to the wind farm is
the inclusion of a third WTG. For ease of analysis, as well as maintenance
consistency and visual appeal of the wind farm, the additional WTG has been chosen
to be a third ENERCON E-48 WTG, Turbine 3 (T3). The operation of the third WTG
in both restricted and unrestricted operation has been analysed in order to
investigate all possible modes of operation of the DCWF.
If a third WTG is implemented at the DCWF, it may be possible that the wind farm
operates with a maximum power limitation for a limited period of time. This may
result due to a delay in raising the maximum power limitation of the wind farm.
This section of the report documents the generation analysis of the wind farm with
three WTGs restricted to 1.44 MW.
3.4.1 Three WTGs Restricted Analysis Methodology
The average of the wind speeds logged from the two existing WTGs has been used in
the analysis of the third WTG. This has been found to be the most suitable wind
speed available at the site. Logged wind speed data for the region has been found to
be very limited; this is discussed in detail in Project Complications.
.
28
The potential annual production from T3 has been estimated using the “ENERCON
Power Curve” method. The wind farm has been limited to 1.44 MW, with each WTG
limited to 480 kW. This is a very unlikely control scheme, as only 60% of the wind
farm capacity is utilised. However, as previously stated, this limitation would be
impermanent, and would only exist until the wind farm is operable at a greater
maximum power limit.
The implementation of this operational state has been performed using Microsoft
Excel. Due to the large amount of data used in the generation analysis, the results
can be viewed in the attached program.
3.4.2 Three WTGs Restricted Analysis Results
The generation analysis of the DCWF with three WTGs restricted to 1.44 MW
maximum output power has resulted in an additional annual generation of 1450
MWh, or 29.1%, compared to two WTGs restricted to the same limit. Thus, the total
annual generation with three WTGs restricted at 1.44 MW is 6436 MWh.
The result of this generation analysis shows that even if maximum power limits
cannot be overcome, it still may be economically feasible to implement a third WTG.
This will be investigated furthermore in Third WTG Economic Analysis.
29
3.5 Generation Analysis – Three WTGs Unrestricted
A generation analysis has also been performed of the expanded DCWF with three
WTGs operating with no maximum power restrictions. The purpose of this study is
to assess the potential annual generation of the DCWF after expansion and compare
this to other generation analyses. The developed model will also be used in
subsequent sections of the project.
3.5.1 Three WTGs Unrestricted Analysis Methodology
The method used in the analysis of three WTGs operating with no maximum power
limit is the same method used in previous analyses of the wind farm. The
“ENERCON Power Curve” methodology has been applied in order to attain
consistent results and provide an accurate comparison to other analyses.
3.5.2 Three WTGs Unrestricted Analysis Results
The generation analysis results of three WTGs operating with no maximum power
limitation are consistent with results obtained from previous analyses. The annual
generation from the expanded wind farm has been found to be 7639 MWh. This is
equal to 50% more than two WTGs operating unrestricted, as is expected.
30
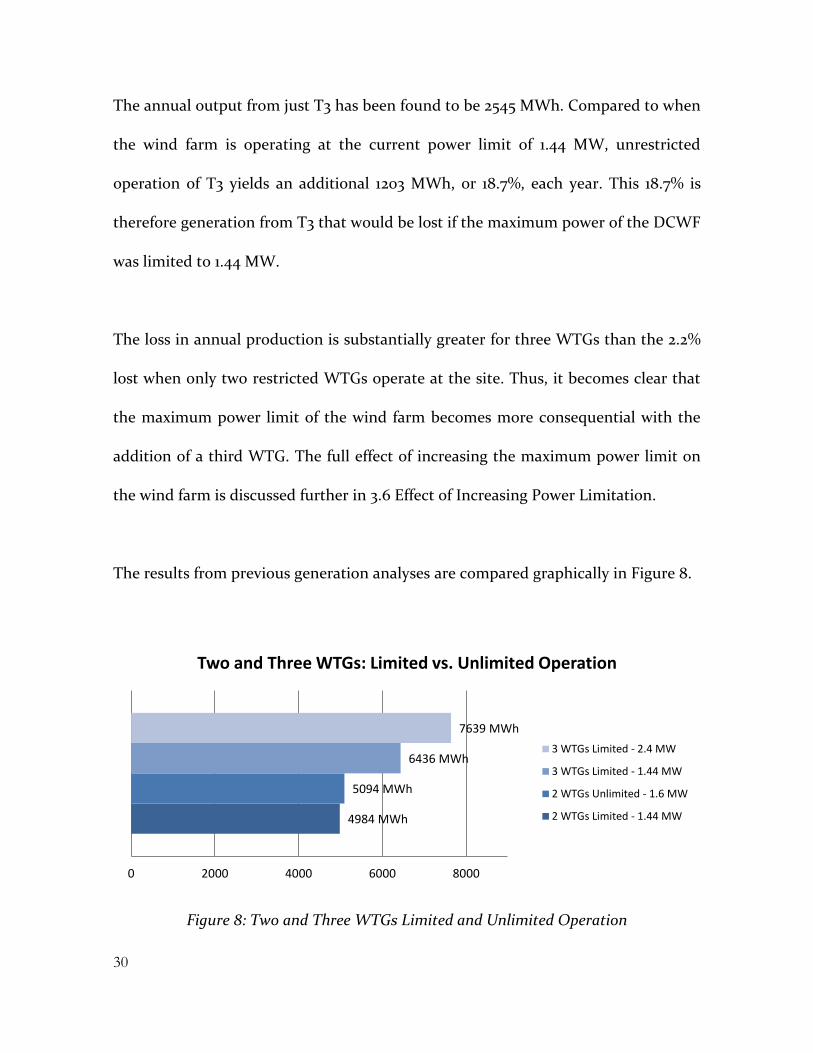
The annual output from just T3 has been found to be 2545 MWh. Compared to when
the wind farm is operating at the current power limit of 1.44 MW, unrestricted
operation of T3 yields an additional 1203 MWh, or 18.7%, each year. This 18.7% is
therefore generation from T3 that would be lost if the maximum power of the DCWF
was limited to 1.44 MW.
The loss in annual production is substantially greater for three WTGs than the 2.2%
lost when only two restricted WTGs operate at the site. Thus, it becomes clear that
the maximum power limit of the wind farm becomes more consequential with the
addition of a third WTG. The full effect of increasing the maximum power limit on
the wind farm is discussed further in 3.6 Effect of Increasing Power Limitation.
The results from previous generation analyses are compared graphically in Figure 8.
Figure 8: Two and Three WTGs Limited and Unlimited Operation
4984 MWh
5094 MWh
6436 MWh
7639 MWh
0 2000 4000 6000 8000
Two and Three WTGs: Limited vs. Unlimited Operation
3 WTGs Limited - 2.4 MW
3 WTGs Limited - 1.44 MW
2 WTGs Unlimited - 1.6 MW
2 WTGs Limited - 1.44 MW

31
3.6 Effect of Increasing Power Limitation
A sensitivity analysis has been performed on how the annual generation of the
DCWF is affected by the increase in maximum power limit. The sensitivity analysis
begins at the current maximum power limit, 1.44 MW, and includes increasing
output limits of the wind farm up to the maximum capacity of three WTGs, 2.4 MW.
The results of the sensitivity analysis are shown below in Figure 9.
Figure 9: Sensitivity Analysis of Annual Generation with Increasing Power Limitation
The results from the sensitivity analysis show that increasing the maximum output
power of the wind farm results in more annual production. The trend appears very
linear from maximum power limits of 1.44 MW to 2 MW, and then starts to decay
much more rapidly. If the maximum power of the wind farm could only be raised to
a certain limit, 2 MW would result in significantly more annual generation.
6200.00
6400.00
6600.00
6800.00
7000.00
7200.00
7400.00
0 0.5 1 1.5 2 2.5 3
An
nu
al G
en
era
tio
n (
MW
h)
Power Limitation (MW)
Energy Yield with Increasing Power Limitation
32
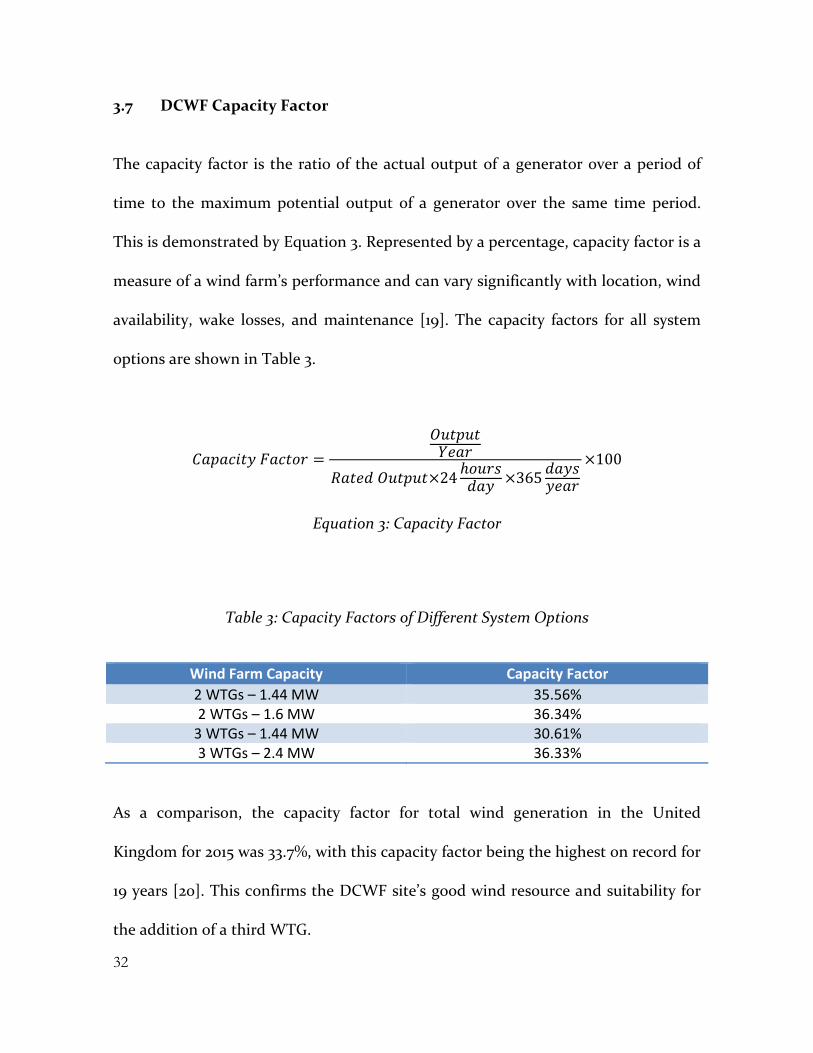
3.7 DCWF Capacity Factor
The capacity factor is the ratio of the actual output of a generator over a period of
time to the maximum potential output of a generator over the same time period.
This is demonstrated by Equation 3. Represented by a percentage, capacity factor is a
measure of a wind farm’s performance and can vary significantly with location, wind
availability, wake losses, and maintenance [19]. The capacity factors for all system
options are shown in Table 3.
𝐶𝑎𝑝𝑎𝑐𝑖𝑡𝑦 𝐹𝑎𝑐𝑡𝑜𝑟 =
𝑂𝑢𝑡𝑝𝑢𝑡𝑌𝑒𝑎𝑟
𝑅𝑎𝑡𝑒𝑑 𝑂𝑢𝑡𝑝𝑢𝑡×24ℎ𝑜𝑢𝑟𝑠
𝑑𝑎𝑦×365
𝑑𝑎𝑦𝑠𝑦𝑒𝑎𝑟
×100
Equation 3: Capacity Factor
Table 3: Capacity Factors of Different System Options
Wind Farm Capacity Capacity Factor
2 WTGs – 1.44 MW 35.56% 2 WTGs – 1.6 MW 36.34%
3 WTGs – 1.44 MW 30.61% 3 WTGs – 2.4 MW 36.33%
As a comparison, the capacity factor for total wind generation in the United
Kingdom for 2015 was 33.7%, with this capacity factor being the highest on record for
19 years [20]. This confirms the DCWF site’s good wind resource and suitability for
the addition of a third WTG.
33
3.8 Third WTG Site
The placement of the third WTG at the DCWF site is important in order to optimise
its production and minimise its effect on the existing WTGs. T3 should not be placed
upstream of existing WTGs, as this would reduce the output of T1 and T2 [21]. In
addition, T3 should not be placed downstream of prevailing winds from T1 and T2, as
this would reduce its own output.
The yaw control of the WTGs positions the rotor to face the direction that the wind
is blowing [19]. In effect, the position of the nacelle will show the direction of
prevailing winds. Data downloaded from the ESS has provided the bearing of the
nacelle of T1 and T2 for the analysis period. Due to the amount of data downloaded,
this has not been included in the report but can be viewed in the attached Microsoft
Excel program.

34
A wind rose has been developed using the data downloaded from the ESS. Wind
speed data has been binned into eight bins to show the frequency of wind speeds in
each direction. The plot, shown in Figure 10, shows the relative frequency of wind
directions at the DCWF site. It is clear from the wind rose that the two prevailing
wind directions are from the Northeast and Southwest, with wind direction coming
from these directions more than 30% of the time. Thus, the third WTG should be
Northeast or Southwest of T1 or T2.
Figure 10: Wind Rose of the DCWF Site
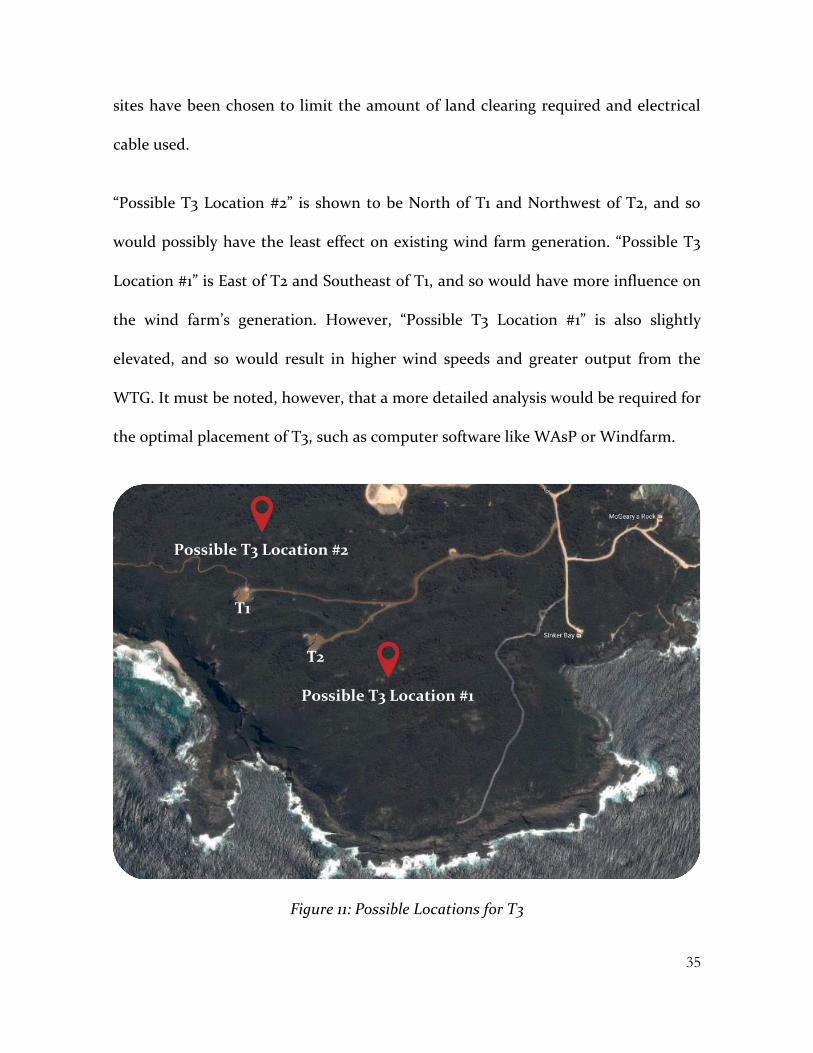
Two possible sites have been selected for the implementation of T3 at the DCWF.
These sites, shown in Figure 11, represent where the additional WTG could be
located that would have minimal impact on the existing WTGs. Furthermore, the
0
2
4
6
8
10
12
14
16N
NE
E
SE
S
SW
W
NW
Wind Rose of the DCWF Site
35
sites have been chosen to limit the amount of land clearing required and electrical
cable used.
“Possible T3 Location #2” is shown to be North of T1 and Northwest of T2, and so
would possibly have the least effect on existing wind farm generation. “Possible T3
Location #1” is East of T2 and Southeast of T1, and so would have more influence on
the wind farm’s generation. However, “Possible T3 Location #1” is also slightly
elevated, and so would result in higher wind speeds and greater output from the
WTG. It must be noted, however, that a more detailed analysis would be required for
the optimal placement of T3, such as computer software like WAsP or Windfarm.
Figure 11: Possible Locations for T3
Possible T3 Location #1
Possible T3 Location #2
T1
T2

36
3.9 Third WTG Economic Analysis
The feasibility of a third WTG at the DCWF has been analysed using results from
generation analysis of three WTGs operating with and without maximum power
limits. The pricing of the third WTG has been estimated using a model developed by
Horizon Power. The price of has also been discussed with SkyFarming, who
managed construction of the existing WTGs.
The model developed by Horizon Power has estimated the installed price of a
generic onshore WTG to be $2,750/kWh, equating to $2.2m for the ENERCON E-48
WTG. Operation and maintenance (O&M) for the lifetime of the project was then
estimated at $40k/year, equating to $800k for the lifetime of the WTG. SkyFarming
provided an additional estimate for the third WTG of approximately $1.9m installed.
O&M has been assumed to be the same. Thus, the final price of the third WTG has
been calculated using the average of these two estimations, rounded up to $2.1m.
Additional costs from the implementation of the third WTG have been assumed to
be road construction costs and cabling and switchgear for the WTG. After liaising
with SkyFarming, this has been estimated to be $100k and $10k respectively. Please
note that no financial documentation for the original construction of the DCWF has
become available for this thesis project, complicating the economic analysis. A
breakdown of estimated expansion costs for the construction of the third WTG is
shown in Table 4.
37
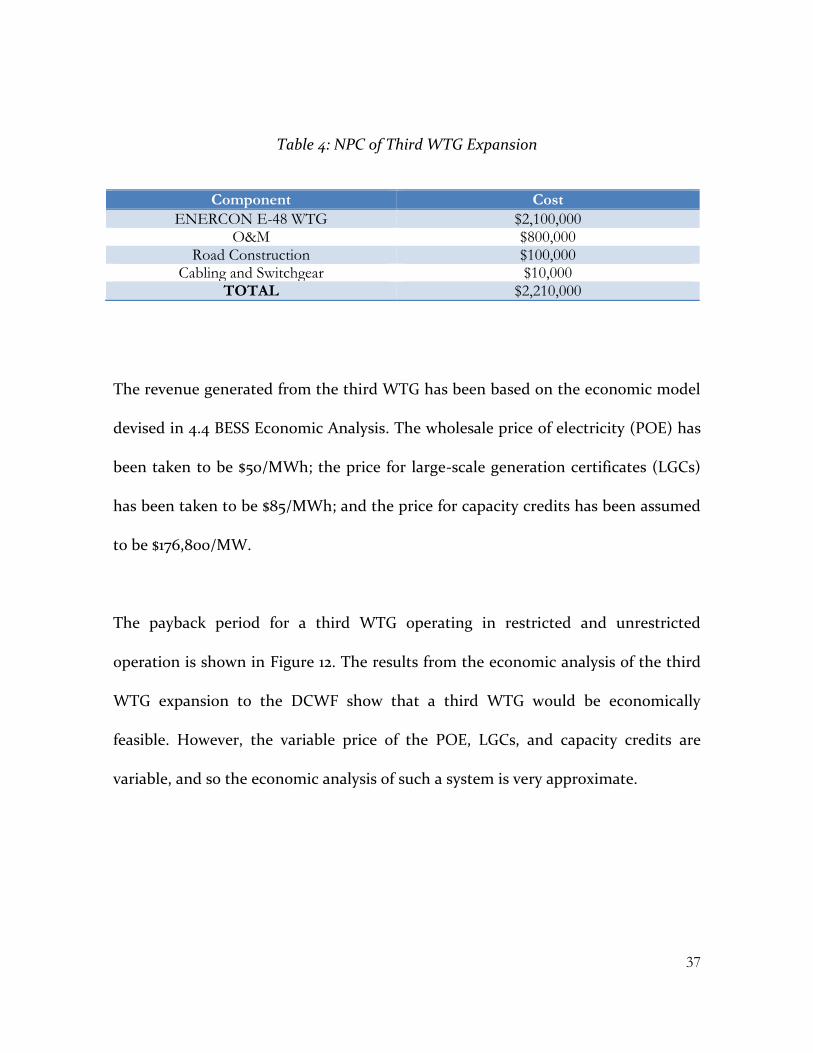
Table 4: NPC of Third WTG Expansion
Component Cost
ENERCON E-48 WTG $2,100,000 O&M $800,000
Road Construction $100,000 Cabling and Switchgear $10,000
TOTAL $2,210,000
The revenue generated from the third WTG has been based on the economic model
devised in 4.4 BESS Economic Analysis. The wholesale price of electricity (POE) has
been taken to be $50/MWh; the price for large-scale generation certificates (LGCs)
has been taken to be $85/MWh; and the price for capacity credits has been assumed
to be $176,800/MW.
The payback period for a third WTG operating in restricted and unrestricted
operation is shown in Figure 12. The results from the economic analysis of the third
WTG expansion to the DCWF show that a third WTG would be economically
feasible. However, the variable price of the POE, LGCs, and capacity credits are
variable, and so the economic analysis of such a system is very approximate.
38
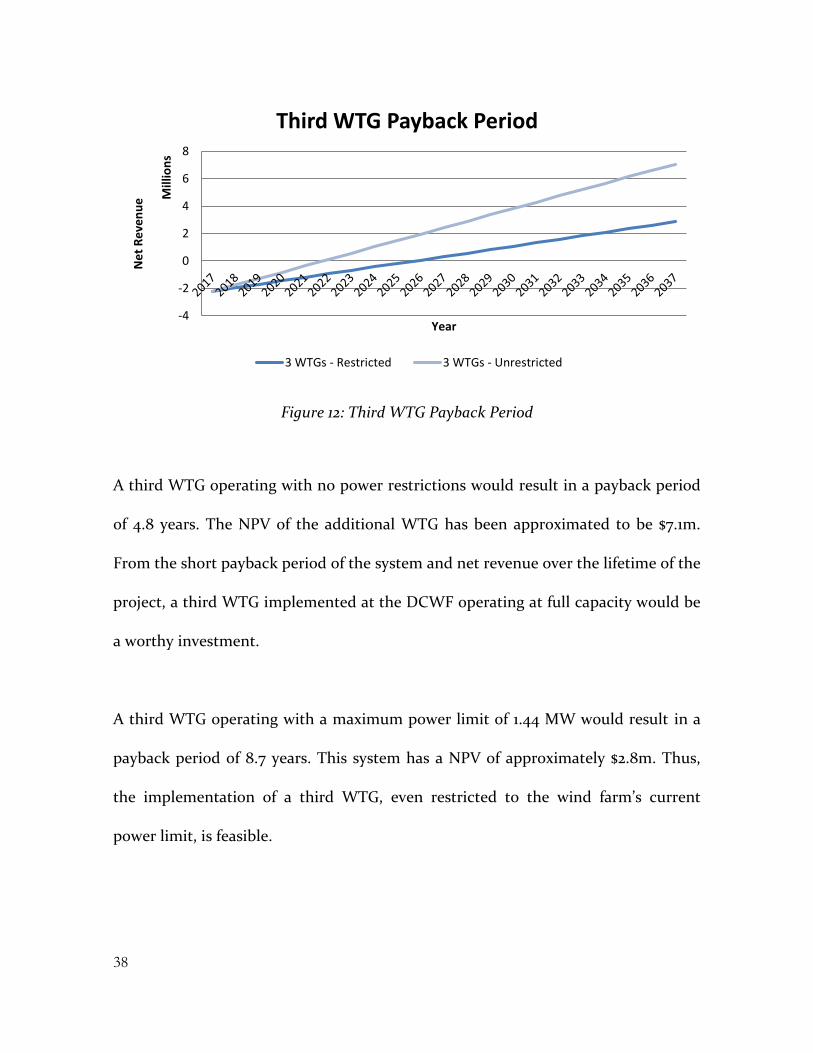
Figure 12: Third WTG Payback Period
A third WTG operating with no power restrictions would result in a payback period
of 4.8 years. The NPV of the additional WTG has been approximated to be $7.1m.
From the short payback period of the system and net revenue over the lifetime of the
project, a third WTG implemented at the DCWF operating at full capacity would be
a worthy investment.
A third WTG operating with a maximum power limit of 1.44 MW would result in a
payback period of 8.7 years. This system has a NPV of approximately $2.8m. Thus,
the implementation of a third WTG, even restricted to the wind farm’s current
power limit, is feasible.
-4
-2
0
2
4
6
8N
et
Re
ven
ue M
illio
ns
Year
Third WTG Payback Period
3 WTGs - Restricted 3 WTGs - Unrestricted

39
4. BESS ANALYSIS
One other option to consider in the expansion of the DCWF is the inclusion of
battery storage. The implementation of a BESS at the DCWF would facilitate the
addition of a third WTG as well as provide substantial benefits to the Denmark
distribution network. As such, the assumption has been made that the BESS will
only be considered with the implementation of a third WTG.
This section of the report will investigate several aspects that require consideration
with the implementation of a BESS. Suitable BESS technologies will be researched
and put forward, with two technologies ultimately considered. Different BESS sizes
will also be presented, with the objective to perform a generation analysis on the
expanded system.
With BESS type and size determined, specific BESS products can then be selected.
This study includes an in depth economic feasibility study of selected systems.
40
4.1 BESS Size
BESS size is divided into two components: battery power and battery capacity.
Battery power is the amount of power that a battery can deliver instantaneously [22].
Battery capacity is the amount of energy that can be stored in a battery [22]. These
two characteristics are governed by the design and chemistry of the battery [22], and
so it becomes apparent that BESS size will dictate the type of technology utilised.
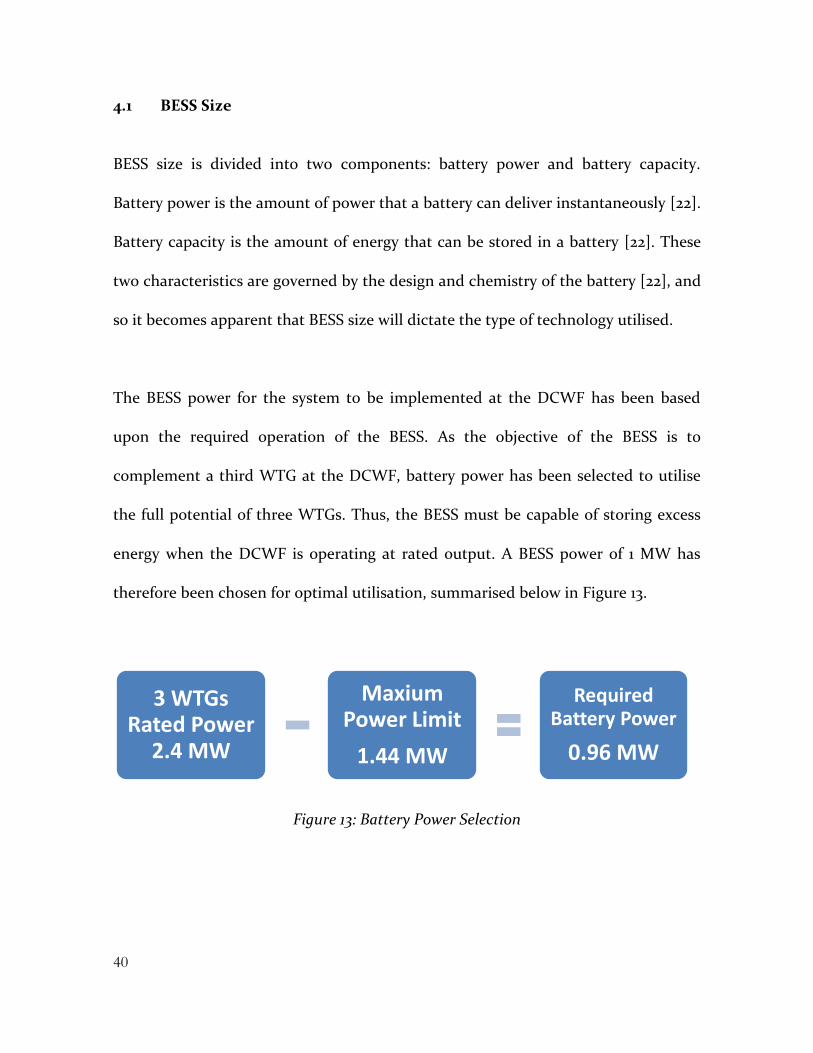
The BESS power for the system to be implemented at the DCWF has been based
upon the required operation of the BESS. As the objective of the BESS is to
complement a third WTG at the DCWF, battery power has been selected to utilise
the full potential of three WTGs. Thus, the BESS must be capable of storing excess
energy when the DCWF is operating at rated output. A BESS power of 1 MW has
therefore been chosen for optimal utilisation, summarised below in Figure 13.
Figure 13: Battery Power Selection
3 WTGs Rated Power
2.4 MW
Maxium Power Limit
1.44 MW
Required Battery Power
0.96 MW

41
Battery capacity for the DCWF BESS has been selected using alternative methods.
The amount of storage required from the BESS is not determined by a load, but
rather by the amount of generation lost due to the maximum power limitation.
Using the previously developed generation analysis model, the annual output from
the DCWF with battery storage has been estimated. This model will be discussed in
detail in 4.3 BESS Generation Analysis. The annual output from just the BESS with
increasing battery capacity is shown below in Figure 14. From this plot, a BESS
capacity of 4 MWh has been chosen to optimise the output from the BESS whilst
minimising the size, and hence cost, of the BESS.
Figure 14: Annual Output of BESS with Inreasing Battery Capacity
0
100
200
300
400
500
600
700
800
0 2 4 6 8 10 12
An
nu
al P
rod
uct
ion
(M
Wh
)
Battery Capacity (MWh)
Additional Output from Battery Energy Storage System
42
4.2 BESS Type
Various battery technologies are currently available for commercial utilisation, with
the battery’s characteristics governed by the technology utilised. Thus, some
technologies are recommended more for large-scale storage than others. Important
battery characteristics to consider for utility-scale integration include:
• Cost;
• Lifetime;
• Round trip efficiency;
• Depth of discharge;
• Energy Density; and
• Maintenance.
Two battery technologies have been investigated for possible implementation at the
DCWF based on their optimal characteristics for use in large-scale systems:
Vanadium Redox batteries (VRBs) and Lithium-Ion batteries (LIBs).

43
4.2.1 Vanadium Redox Battery Option
VRBs, also known as flow batteries, are a type of battery storage cell comprising of
two solutions of Vanadium in different valence states. The two solutions are kept in
separate storage tanks and then pumped across an ion-exchange membrane.
Electrons flow across the membrane from the catholytic solution to the analytic
solution as a chemical reaction occurs, producing a DC current. This chemical
reaction is represented in Equation 4 below [23]. A visual representation of the VRB
technology is shown in Figure 15 [23].
𝑉𝑂2+ + 2𝐻2 ⟶ 𝑉𝑂2+ + 𝐻2𝑂 − 𝑒− (Positive Electrode)
𝑉3+ + 𝑒− ⟶ 𝑉2+ (Negative Electrode)
Equation 4: Vanadium Redox Chemical Reaction
VRB technology has some significant benefits as a utility-scale BESS in comparison
to other battery technologies. A summary of VRB benefits are listed in Table 5. The
technology has been implemented in similar projects to the proposed expansion of
the DCWF, such as on the Huxley Hill Wind Farm on King Island, Tasmania [24].

44
Figure 15: Vanadium Redox Battery Technology
Table 5: Utility-Scale Vanadium Redox Battery Advantages
Battery Property Advantage
Battery capacity is proportional to tank size [22]
Cheaper $/kWh - lower cost for large-scale systems
Short response time [25] Can be discharged very quickly (ms) Efficiency does not degrade
over battery lifetime [22] Greater energy yield over longer project lifetimes
Capable of 100% DoD [26] All battery capacity can be utilised Electrolyte lasts indefinitely [22] Long system lifetime Can be mechanically recharged
with electrolyte replacement [22] Battery can be recharged
very quickly Low self-discharge [27] Stored longer with no loss in capacity
The VRB technology also has some disadvantages associated with its use in large-
scale systems. These are summarised in Table 6.
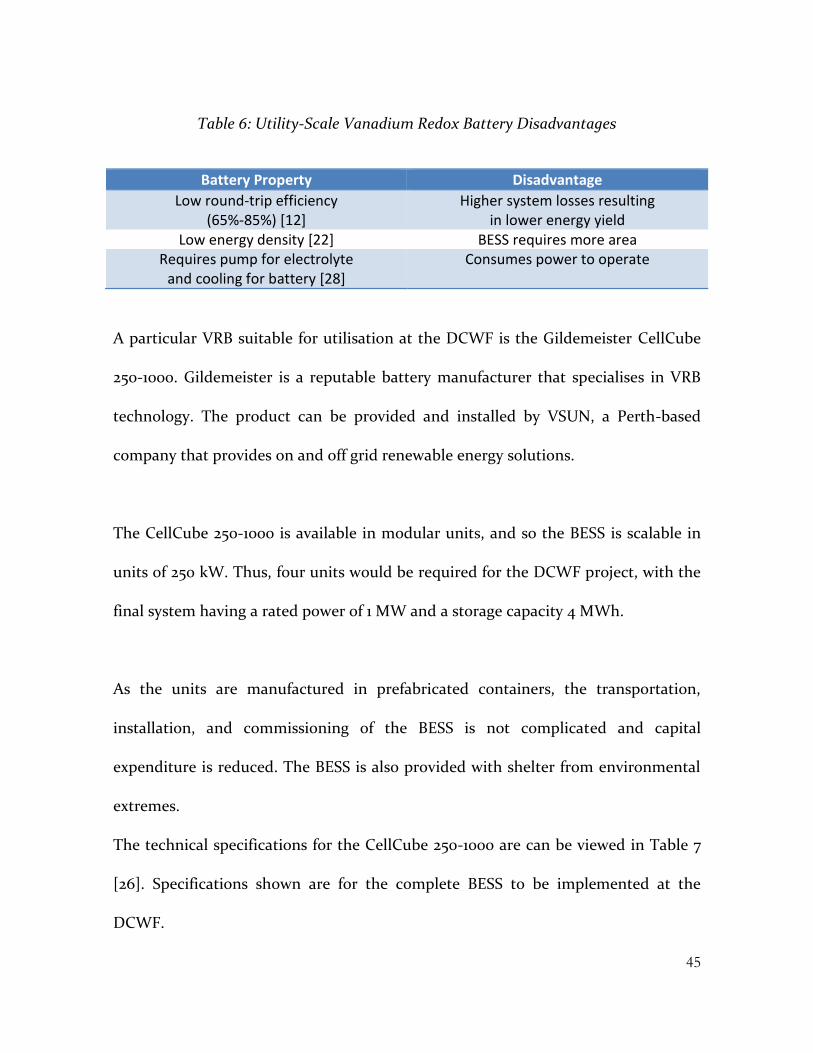
45
Table 6: Utility-Scale Vanadium Redox Battery Disadvantages
Battery Property Disadvantage
Low round-trip efficiency (65%-85%) [12]
Higher system losses resulting in lower energy yield
Low energy density [22] BESS requires more area Requires pump for electrolyte
and cooling for battery [28] Consumes power to operate
A particular VRB suitable for utilisation at the DCWF is the Gildemeister CellCube
250-1000. Gildemeister is a reputable battery manufacturer that specialises in VRB
technology. The product can be provided and installed by VSUN, a Perth-based
company that provides on and off grid renewable energy solutions.
The CellCube 250-1000 is available in modular units, and so the BESS is scalable in
units of 250 kW. Thus, four units would be required for the DCWF project, with the
final system having a rated power of 1 MW and a storage capacity 4 MWh.
As the units are manufactured in prefabricated containers, the transportation,
installation, and commissioning of the BESS is not complicated and capital
expenditure is reduced. The BESS is also provided with shelter from environmental
extremes.
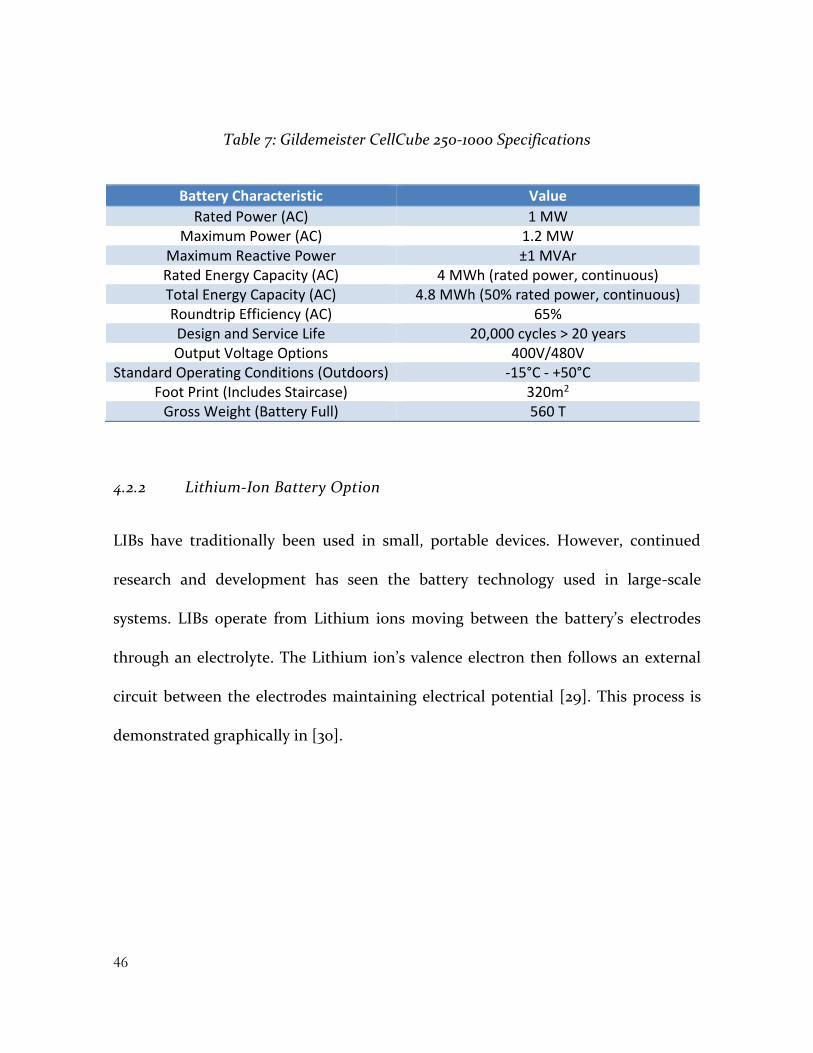
The technical specifications for the CellCube 250-1000 are can be viewed in Table 7
[26]. Specifications shown are for the complete BESS to be implemented at the
DCWF.
46
Table 7: Gildemeister CellCube 250-1000 Specifications
Battery Characteristic Value
Rated Power (AC) 1 MW Maximum Power (AC) 1.2 MW
Maximum Reactive Power ±1 MVAr Rated Energy Capacity (AC) 4 MWh (rated power, continuous) Total Energy Capacity (AC) 4.8 MWh (50% rated power, continuous) Roundtrip Efficiency (AC) 65% Design and Service Life 20,000 cycles > 20 years Output Voltage Options 400V/480V
Standard Operating Conditions (Outdoors) -15°C - +50°C Foot Print (Includes Staircase) 320m2
Gross Weight (Battery Full) 560 T
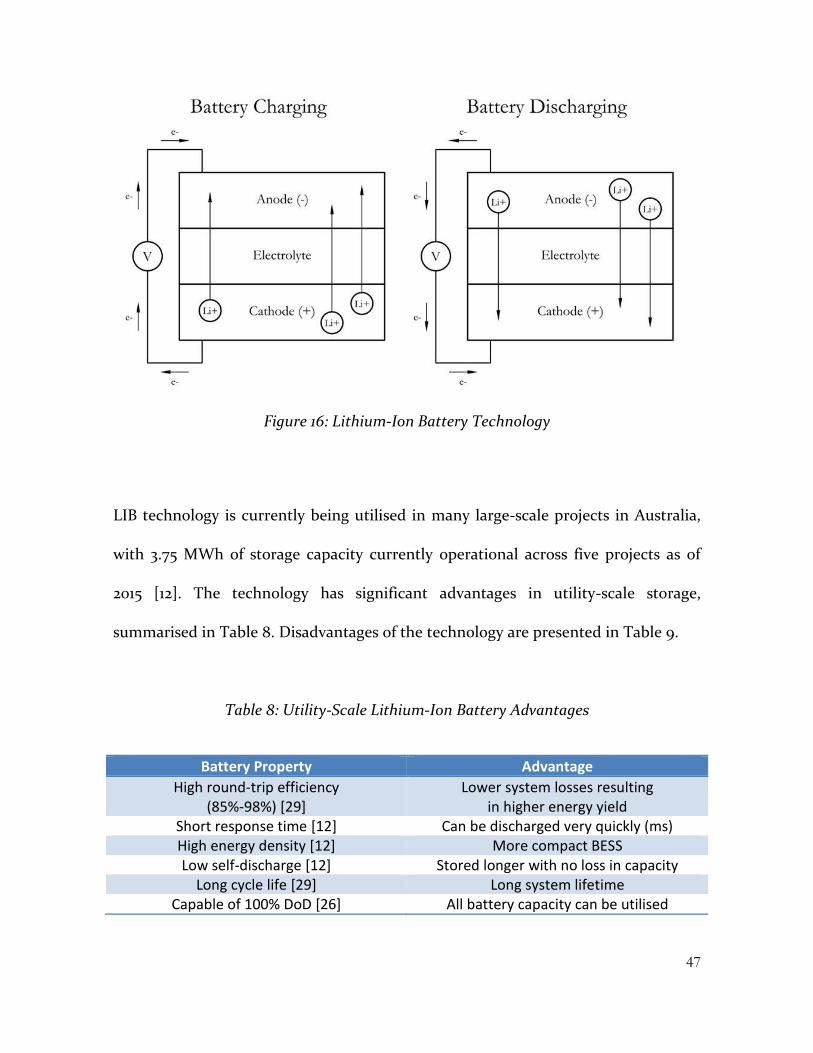
4.2.2 Lithium-Ion Battery Option
LIBs have traditionally been used in small, portable devices. However, continued
research and development has seen the battery technology used in large-scale
systems. LIBs operate from Lithium ions moving between the battery’s electrodes
through an electrolyte. The Lithium ion’s valence electron then follows an external
circuit between the electrodes maintaining electrical potential [29]. This process is
demonstrated graphically in [30].
47
Figure 16: Lithium-Ion Battery Technology
LIB technology is currently being utilised in many large-scale projects in Australia,
with 3.75 MWh of storage capacity currently operational across five projects as of
2015 [12]. The technology has significant advantages in utility-scale storage,
summarised in Table 8. Disadvantages of the technology are presented in Table 9.
Table 8: Utility-Scale Lithium-Ion Battery Advantages
Battery Property Advantage
High round-trip efficiency (85%-98%) [29]
Lower system losses resulting in higher energy yield
Short response time [12] Can be discharged very quickly (ms) High energy density [12] More compact BESS Low self-discharge [12] Stored longer with no loss in capacity
Long cycle life [29] Long system lifetime Capable of 100% DoD [26] All battery capacity can be utilised
48
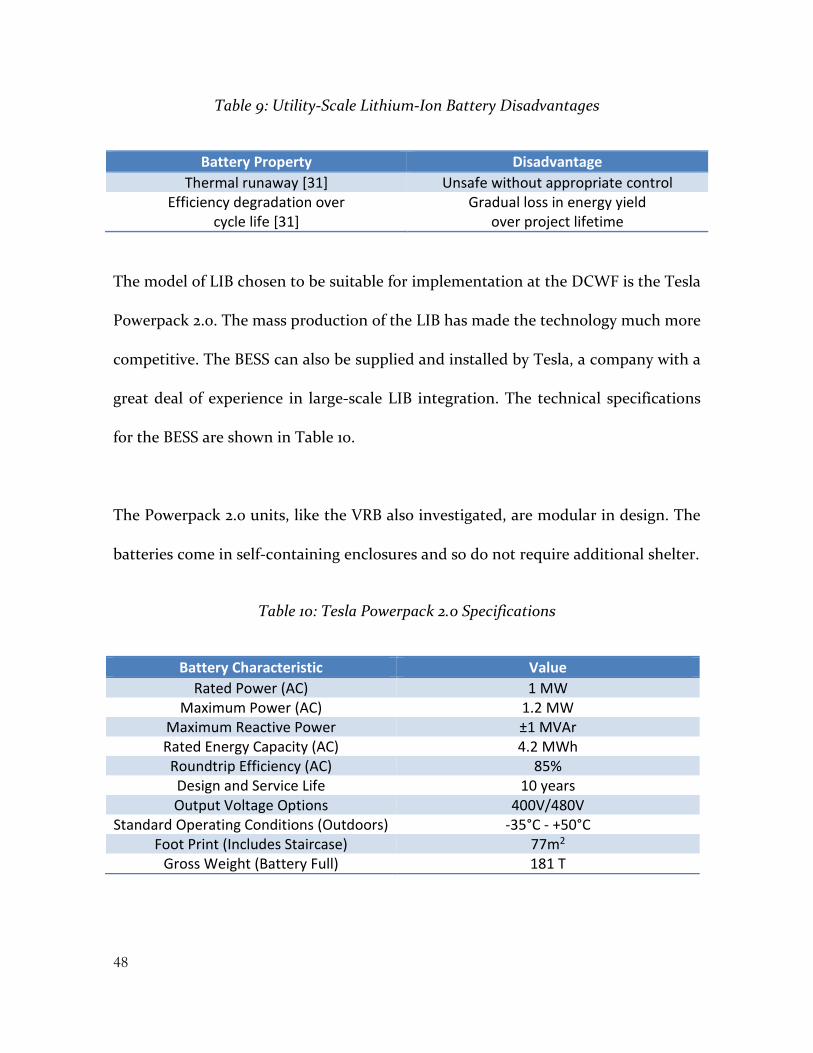
Table 9: Utility-Scale Lithium-Ion Battery Disadvantages
Battery Property Disadvantage
Thermal runaway [31] Unsafe without appropriate control Efficiency degradation over
cycle life [31] Gradual loss in energy yield
over project lifetime
The model of LIB chosen to be suitable for implementation at the DCWF is the Tesla
Powerpack 2.0. The mass production of the LIB has made the technology much more
competitive. The BESS can also be supplied and installed by Tesla, a company with a
great deal of experience in large-scale LIB integration. The technical specifications
for the BESS are shown in Table 10.
The Powerpack 2.0 units, like the VRB also investigated, are modular in design. The
batteries come in self-containing enclosures and so do not require additional shelter.
Table 10: Tesla Powerpack 2.0 Specifications
Battery Characteristic Value
Rated Power (AC) 1 MW Maximum Power (AC) 1.2 MW
Maximum Reactive Power ±1 MVAr Rated Energy Capacity (AC) 4.2 MWh Roundtrip Efficiency (AC) 85% Design and Service Life 10 years Output Voltage Options 400V/480V
Standard Operating Conditions (Outdoors) -35°C - +50°C Foot Print (Includes Staircase) 77m2
Gross Weight (Battery Full) 181 T
49
The efficiency of the LIB BESS is shown to be much greater than the VRB, which
would result in more annual production. The efficiency of the VRB suggests that the
BESS is not ideal for short term energy storage, but rather for time-shifting large
intervals of generation. Additionally, the footprint of the LIB BESS is much less than
that of the VRB BESS, which may be advantageous, as this would reduce the
additional land needed to be cleared on the DCWF site.
The LIB BESS lifetime, however, means that the system will need replacing halfway
through the project life. The VRB does not require replacing during the project
lifetime, and may not require replacing even after the lifetime of the project.
Both BESS options are operational in outside temperatures up to 50°C. The
maximum recorded temperature for the region, recorded at Albany airport
approximately 50 km away, is 40.6°C [32].

50
4.3 BESS Generation Analysis
There are a number of ways to operate a BESS at the DCWF depending on the
primary objective of the wind farm. The BESS can be operated to benefit the wind
farm operator, Denmark Community Windfarm Pty Ltd; the utility operator,
Western Power; or a combination of these depending on the time of year.
Additionally, the BESS can be operated to support a microgrid in the Denmark
region. This would reduce the Denmark region’s dependency on electricity
generated from fossil fuel sources. However, this mode of operation requires analysis
of load data for the Denmark region which has not become available for this project.
Thus, two modes of BESS operation will be investigated in the expansion of the
DCFW: Maximum Generation Mode (MGM) and Peak Shaving Mode (PSM).
4.3.1 Maximum Generation Mode
The first mode of operation that the expanded DCWF could utilise would maximise
the output from the wind farm. This would benefit Denmark Community Windfarm
Pty Ltd the most financially with the current power purchase agreement (PPA). The
current PPA stipulates that generation from the DCWF is sold at a set price
regardless of time of day or year.
51
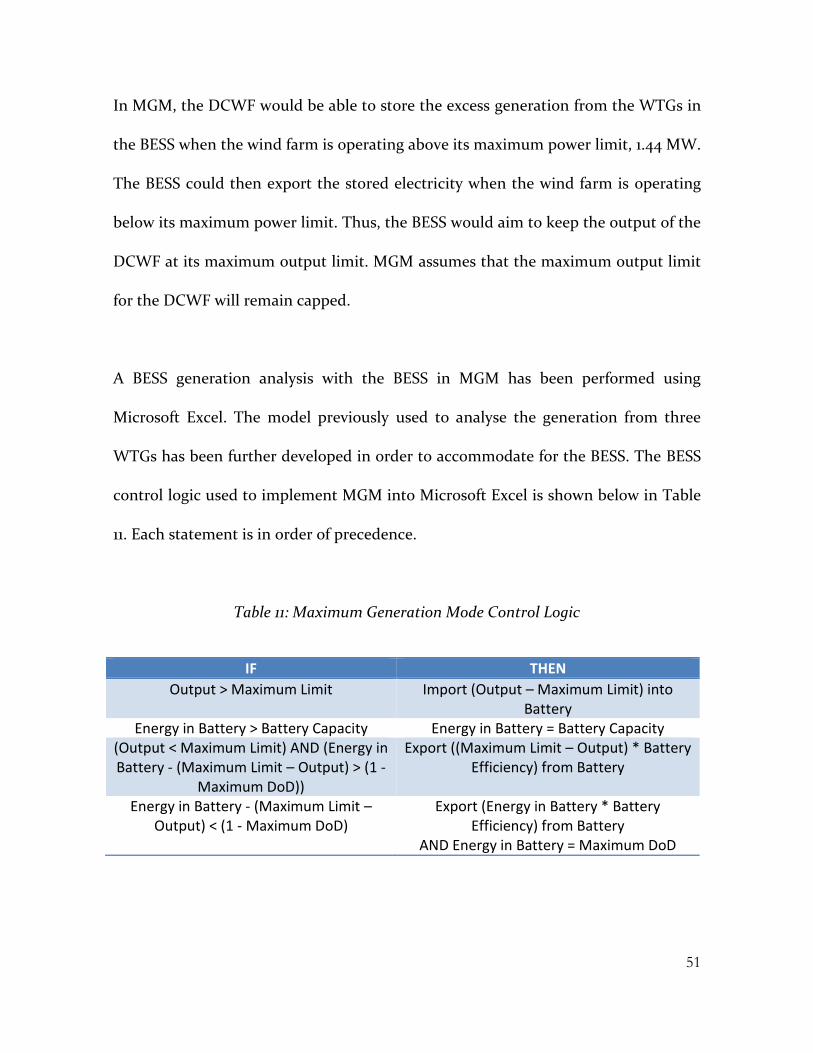
In MGM, the DCWF would be able to store the excess generation from the WTGs in
the BESS when the wind farm is operating above its maximum power limit, 1.44 MW.
The BESS could then export the stored electricity when the wind farm is operating
below its maximum power limit. Thus, the BESS would aim to keep the output of the
DCWF at its maximum output limit. MGM assumes that the maximum output limit
for the DCWF will remain capped.
A BESS generation analysis with the BESS in MGM has been performed using
Microsoft Excel. The model previously used to analyse the generation from three
WTGs has been further developed in order to accommodate for the BESS. The BESS
control logic used to implement MGM into Microsoft Excel is shown below in Table
11. Each statement is in order of precedence.
Table 11: Maximum Generation Mode Control Logic
IF THEN
Output > Maximum Limit Import (Output – Maximum Limit) into Battery
Energy in Battery > Battery Capacity Energy in Battery = Battery Capacity (Output < Maximum Limit) AND (Energy in Battery - (Maximum Limit – Output) > (1 -
Maximum DoD))
Export ((Maximum Limit – Output) * Battery Efficiency) from Battery
Energy in Battery - (Maximum Limit – Output) < (1 - Maximum DoD)
Export (Energy in Battery * Battery Efficiency) from Battery
AND Energy in Battery = Maximum DoD
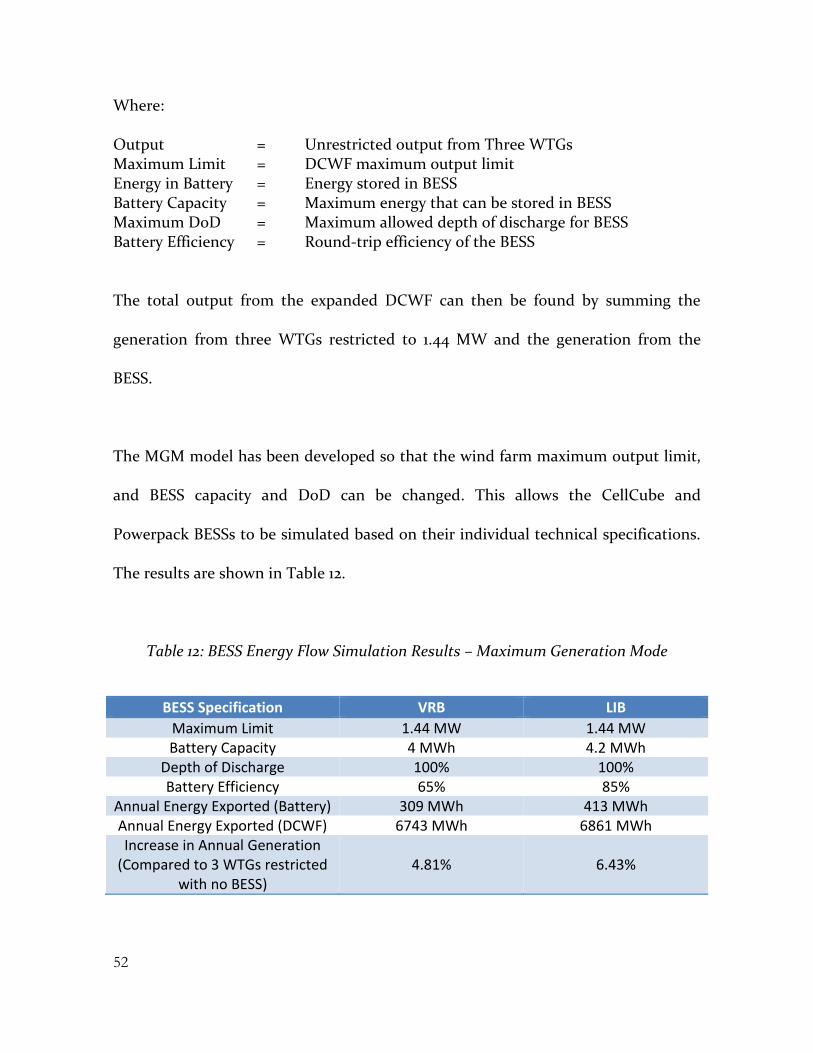
52
Where:
Output = Unrestricted output from Three WTGs Maximum Limit = DCWF maximum output limit Energy in Battery = Energy stored in BESS Battery Capacity = Maximum energy that can be stored in BESS Maximum DoD = Maximum allowed depth of discharge for BESS Battery Efficiency = Round-trip efficiency of the BESS
The total output from the expanded DCWF can then be found by summing the
generation from three WTGs restricted to 1.44 MW and the generation from the
BESS.
The MGM model has been developed so that the wind farm maximum output limit,
and BESS capacity and DoD can be changed. This allows the CellCube and
Powerpack BESSs to be simulated based on their individual technical specifications.
The results are shown in Table 12.
Table 12: BESS Energy Flow Simulation Results – Maximum Generation Mode
BESS Specification VRB LIB
Maximum Limit 1.44 MW 1.44 MW Battery Capacity 4 MWh 4.2 MWh
Depth of Discharge 100% 100% Battery Efficiency 65% 85%
Annual Energy Exported (Battery) 309 MWh 413 MWh Annual Energy Exported (DCWF) 6743 MWh 6861 MWh Increase in Annual Generation
(Compared to 3 WTGs restricted with no BESS)
4.81%
6.43%
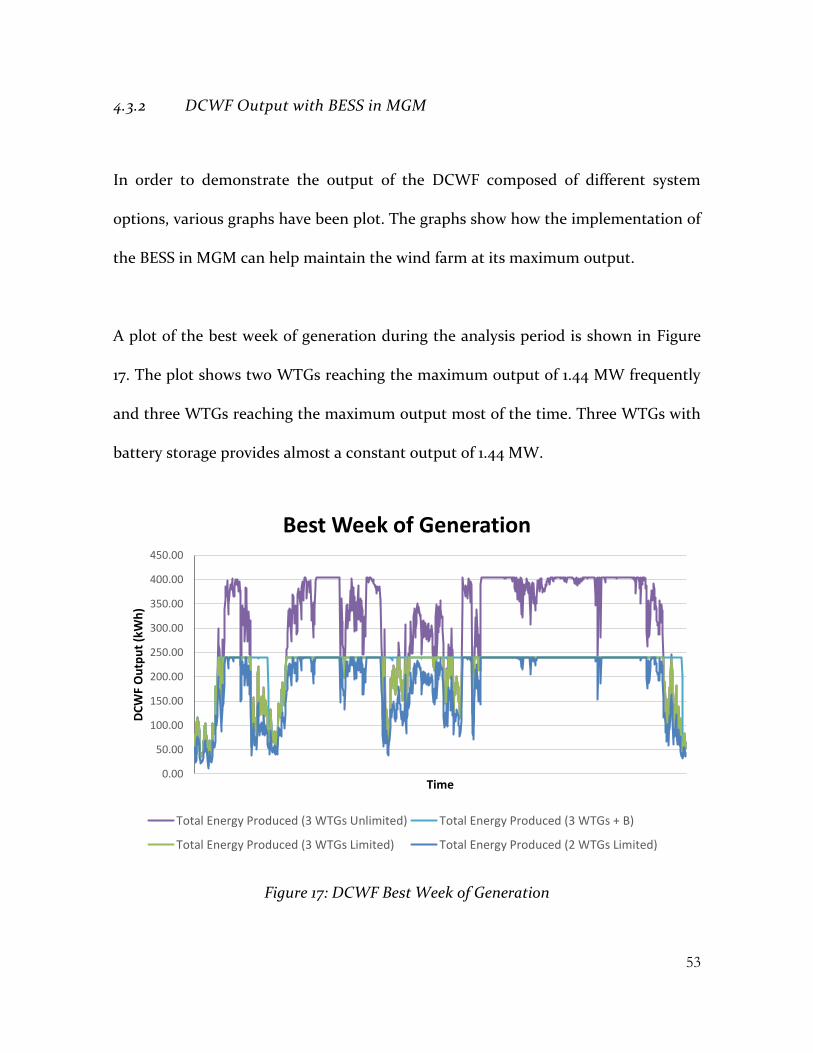
53
4.3.2 DCWF Output with BESS in MGM
In order to demonstrate the output of the DCWF composed of different system
options, various graphs have been plot. The graphs show how the implementation of
the BESS in MGM can help maintain the wind farm at its maximum output.
A plot of the best week of generation during the analysis period is shown in Figure
17. The plot shows two WTGs reaching the maximum output of 1.44 MW frequently
and three WTGs reaching the maximum output most of the time. Three WTGs with
battery storage provides almost a constant output of 1.44 MW.
Figure 17: DCWF Best Week of Generation
0.00
50.00
100.00
150.00
200.00
250.00
300.00
350.00
400.00
450.00
DC
WF
Ou
tpu
t (k
Wh
)
Time
Best Week of Generation
Total Energy Produced (3 WTGs Unlimited) Total Energy Produced (3 WTGs + B)
Total Energy Produced (3 WTGs Limited) Total Energy Produced (2 WTGs Limited)
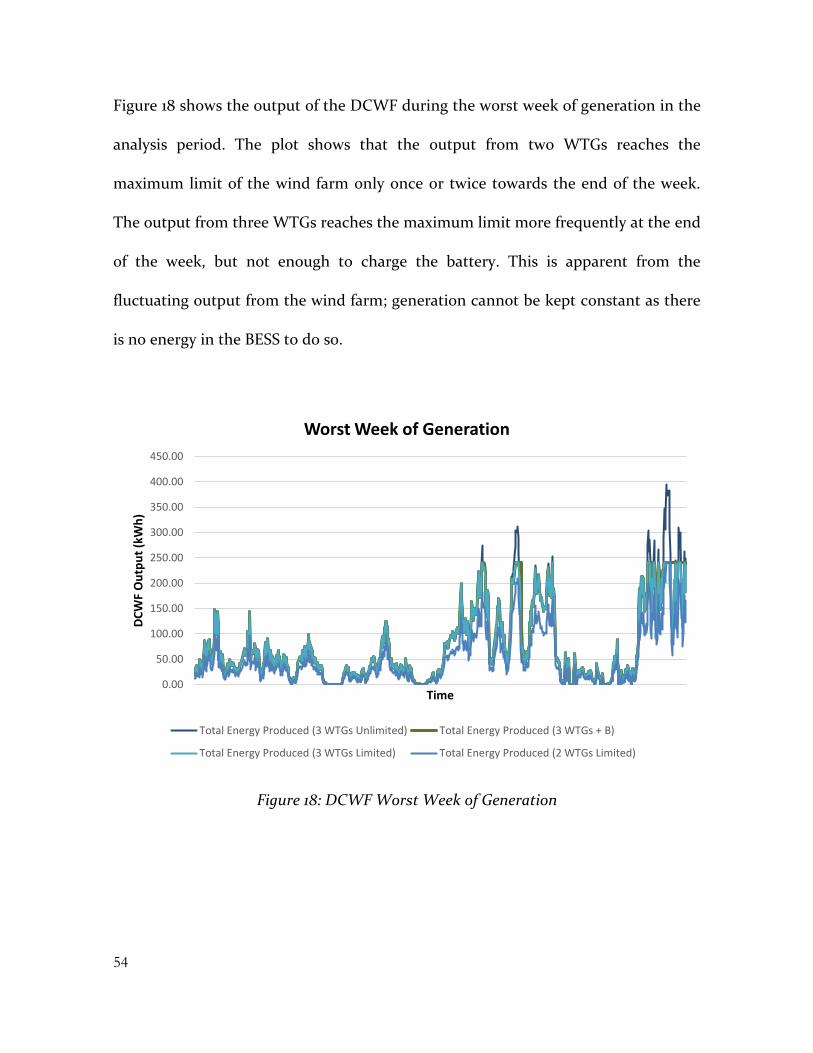
54
Figure 18 shows the output of the DCWF during the worst week of generation in the
analysis period. The plot shows that the output from two WTGs reaches the
maximum limit of the wind farm only once or twice towards the end of the week.
The output from three WTGs reaches the maximum limit more frequently at the end
of the week, but not enough to charge the battery. This is apparent from the
fluctuating output from the wind farm; generation cannot be kept constant as there
is no energy in the BESS to do so.
Figure 18: DCWF Worst Week of Generation
0.00
50.00
100.00
150.00
200.00
250.00
300.00
350.00
400.00
450.00
DC
WF
Ou
tpu
t (k
Wh
)
Time
Worst Week of Generation
Total Energy Produced (3 WTGs Unlimited) Total Energy Produced (3 WTGs + B)
Total Energy Produced (3 WTGs Limited) Total Energy Produced (2 WTGs Limited)

55
The output of the DCWF during an average week of generation is shown in Figure
19. The most average weekly yield from the wind farm during the analysis period has
been found through the analysis of the yearly data’s average and standard deviation.
The plot shows the output from two WTGs reaching the maximum limit of the wind
farm quite frequently. Three WTGs shows a higher output from the wind farm, and
the maximum output is reached more frequently.
The implementation of the BESS shows how the potential of three WTGs can be
utilised to maximise the generation from the DCWF, even when the wind farm is
restricted in its operation.
Figure 19: DCWF Average Week of Generation
0.00
50.00
100.00
150.00
200.00
250.00
300.00
350.00
400.00
450.00
DC
WF
Ou
tpu
t (k
Wh
)
Time
Average Week of Generation
Total Energy Produced (3 WTGs Unlimited) Total Energy Produced (3 WTGs + B)
Total Energy Produced (3 WTGs Limited) Total Energy Produced (2 WTGs Limited)
56
4.3.3 Peak Shaving Mode
The second mode of operation that the expanded DCWF could utilise is using the
BESS as a peak shaving device. In PSM, energy could be stored in the battery from
the WTGs during times of base load. The battery could then export this energy
during times of peak load. Using the battery in PSM would benefit the utility
operator the most, as this would substantially reduce the load on the LDF during
peak times.
Operation of the BESS in PSM could also benefit the DCWF financially if the wind
farm could arbitrage between on-peak and off-peak times. Furthermore, the
guarantee of output during peak demand would attract additional capacity credits.
However, this would require a new PPA, and so the financial benefits of operating
the BESS in PSM will not be investigated in this report.
A BESS generation analysis has been performed with the BESS operated in PSM. The
control logic used to implement the BESS PSM into the existing Microsoft Excel
model is shown in Table 13.

57
Table 13: Peak Shaving Mode Control Logic
IF THEN
Time = Off Peak Import Output into Battery Energy in Battery > Battery Capacity Energy in Battery = Battery Capacity
Time = On Peak AND Output > Maximum Limit
Export 0 from Battery
Time = On Peak AND Output < Maximum Limit AND (Energy in Battery - (Maximum
Limit – Output) > (1 - Maximum DoD))
Export (Maximum Limit – Output) * Battery Efficiency) from Battery
Time = On Peak AND Output < Maximum Limit AND (Energy in Battery - (Maximum
Limit – Output) < (1 - Maximum DoD))
Export (Energy in Battery * Battery Efficiency) from Battery
AND Energy in Battery = Maximum DoD
Where:
Time = Time of ten-minute interval tested Off Peak = Off-peak period1 On Peak = On-peak period2 Output = Unrestricted output from three WTGs Maximum Limit = DCWF maximum output limit Energy in Battery = Energy stored in BESS Battery Capacity = Maximum energy that can be stored in BESS
1 Off peak period defined as 21:00 to 15:00 [41] 2 On peak period defined as 15:00 to 21:00 [41]

58
Table 14: BESS Energy Flow Simulation Results – Peak Shaving Mode
BESS Specification VRB LIB
Maximum Limit 1.44 MW 1.44 MW Battery Capacity 4 MWh 4.2 MWh
Depth of Discharge 100% 100% Battery Efficiency 65% 85%
Annual Energy Exported (Battery) 585 MWh 787 MWh Annual Energy Exported (DCWF) 6487MWh 6494 MWh Percentage Increase in Annual Production (Compared with 3 WTGs restricted and no BESS)
0.83%
0.94%
Results from the simulation of the BESS in PSM show that although the BESS
contributes more to the DCWF’s annual production, the actual annual generation
from the DCWF is substantially lower than when the BESS is operated in MGM. The
BESS is cycled more deeply, but the energy flow of the system is mostly balanced;
the BESS imports generation off-peak, and the same generation is then exported on-
peak.
Effectively, the BESS provides a time-shift for generation to be consumed at peak
loads when operated in PSM. As previously mentioned, this may still benefit the
DCWF financially if a new PPA were arranged. However, additional financial
information would be required in order to assess the economic feasibility of the
BESS in PSM.

59
4.4 BESS Economic Analysis
Battery economics are changing very rapidly in today’s market due to their
increasing demand in home storage, electric vehicles, and renewable integration
[33]. Research and development, as well as mass production into battery storage
technologies have seen the price of BESSs decline in recent years [34], with prices
predicted to continue to decline. AECOM predicts that LIB prices will fall from $550
USD/kWh in 2014 to $200 USD/kWh in 2020 (64% reduction) [12]. Additionally, VRB
prices are predicted to fall from $680 USD/kWh in 2014 to $350 USD/kWh in 2020
(51% reduction) [12].
As the international market for BESSs continues to change, it is quite difficult to
provide accurate and reliable pricing for such systems. Effectively, prices given in
this report should be taken only as an approximate guide, with the figures presented
subject to change in years to come.
4.4.1 BESS Pricing
Quotations for both BESSs have been obtained from VSUN and Tesla, with the
prices as follows.
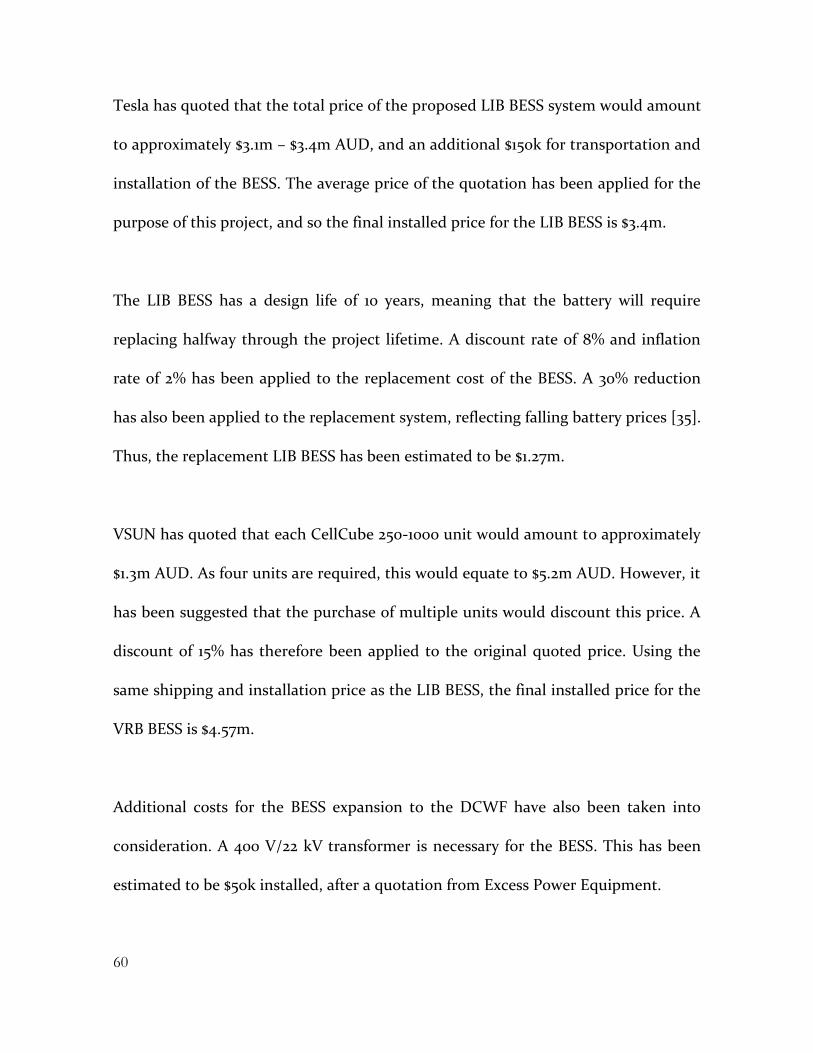
60
Tesla has quoted that the total price of the proposed LIB BESS system would amount
to approximately $3.1m – $3.4m AUD, and an additional $150k for transportation and
installation of the BESS. The average price of the quotation has been applied for the
purpose of this project, and so the final installed price for the LIB BESS is $3.4m.
The LIB BESS has a design life of 10 years, meaning that the battery will require
replacing halfway through the project lifetime. A discount rate of 8% and inflation
rate of 2% has been applied to the replacement cost of the BESS. A 30% reduction
has also been applied to the replacement system, reflecting falling battery prices [35].
Thus, the replacement LIB BESS has been estimated to be $1.27m.
VSUN has quoted that each CellCube 250-1000 unit would amount to approximately
$1.3m AUD. As four units are required, this would equate to $5.2m AUD. However, it
has been suggested that the purchase of multiple units would discount this price. A
discount of 15% has therefore been applied to the original quoted price. Using the
same shipping and installation price as the LIB BESS, the final installed price for the
VRB BESS is $4.57m.
Additional costs for the BESS expansion to the DCWF have also been taken into
consideration. A 400 V/22 kV transformer is necessary for the BESS. This has been
estimated to be $50k installed, after a quotation from Excess Power Equipment.
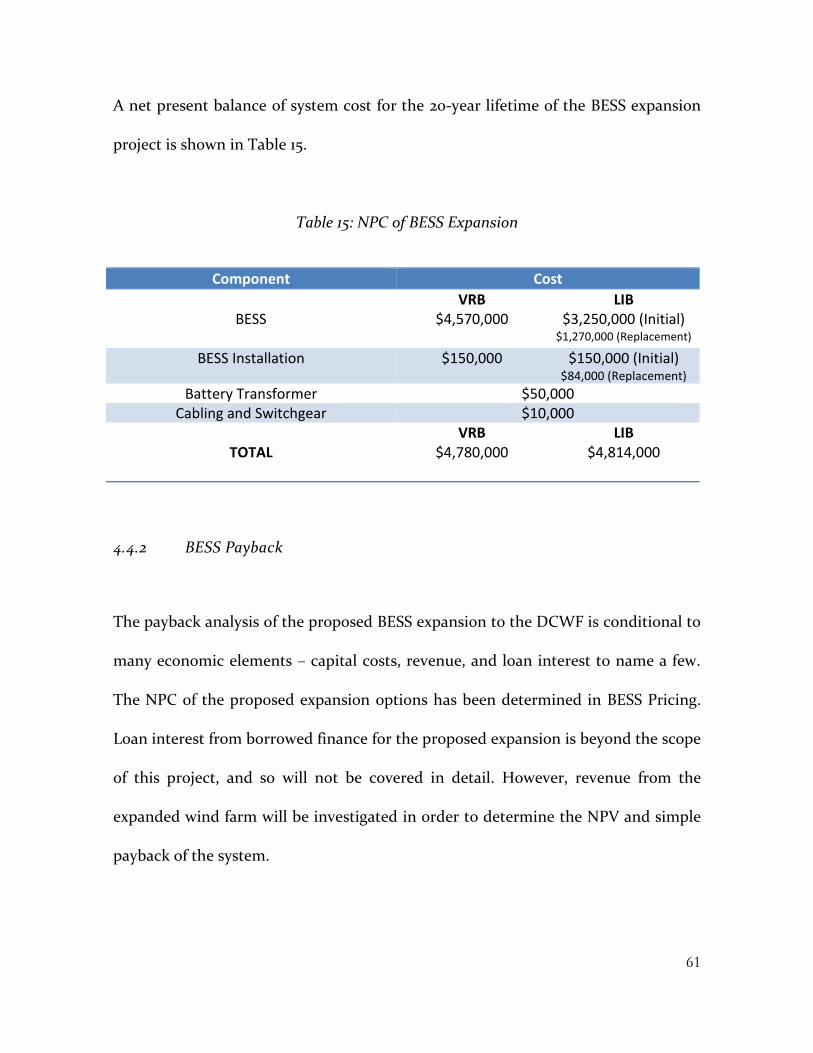
61
A net present balance of system cost for the 20-year lifetime of the BESS expansion
project is shown in Table 15.
Table 15: NPC of BESS Expansion
Component Cost
BESS
VRB LIB $4,570,000 $3,250,000 (Initial)
$1,270,000 (Replacement)
BESS Installation $150,000 $150,000 (Initial) $84,000 (Replacement)
Battery Transformer $50,000 Cabling and Switchgear $10,000
TOTAL
VRB LIB $4,780,000 $4,814,000
4.4.2 BESS Payback
The payback analysis of the proposed BESS expansion to the DCWF is conditional to
many economic elements – capital costs, revenue, and loan interest to name a few.
The NPC of the proposed expansion options has been determined in BESS Pricing.
Loan interest from borrowed finance for the proposed expansion is beyond the scope
of this project, and so will not be covered in detail. However, revenue from the
expanded wind farm will be investigated in order to determine the NPV and simple
payback of the system.

62
Revenue for the DCWF will include generation sales, Renewable Energy Certificates
(RECs), capacity credits, and government grants.
The revenue received by the DCWF for the sale of generated electricity is conditional
to the PPA between the wind farm and Synergy. Due to confidentiality reasons, the
wholesale price that the DCWF sells electricity for is not available. The price has
therefore been approximated from AEMO data. AEMO has stated that the average
Short Term Energy Market (STEM) price for the period 2016–2017 to be $50.09/MWh
[36]. Thus, $50/MWh will be used for the price of wholesale electricity in the
economic analysis of the proposed expansion to the DCWF.
The price of wholesale electricity is predicted to increase in coming years. A study
for AEMO by Jacobs predicts that the price of wholesale electricity will rise by 80%
throughout the 20-year lifetime of the project [37]. Consequently, a 3% increase in
the price of electricity has been factored into the proceeding analysis.
RECs, in the form of Large-scale Generation Certificates (LGCs), are a source of
revenue for energy wholesalers that generate electricity from renewable resources.
Each LGC is equivalent to 1 MWh. The current price of LGCs is $87.50 [38], with the
average price for the period of April 2016-December 2016 being approximately $85
[39]. The price of $85 for RECs will be used in the economic analysis of this report.

63
Capacity credits are purchased in the Wholesale Electricity Market (WEM) by
market customers to ensure that peak load demand can be met. The amount of
capacity credits that a generator receives is based on the generator’s forecast
contribution to peak demand [40]. The DCWF currently receives 1.118 MW of
capacity credits for the interval of 2016-2017 [40]. The Benchmark Reserve Capacity
Price (BRCP) is stated by AEMO to be $176,800 per MW per year for the 2016-2017
period. The capacity credits generated from the addition of the BESS has been
calculated based on the contribution of the BESS generation to total generation.
Government grants may also become available to the DCWF to help fund the BESS
expansion. Due to the inclusion of utility-scale battery storage, the DCWF could
apply for further funding from the Australian Renewable Energy Agency (ARENA).
However, this is beyond the scope of this project, and so has not been included in
the economic analysis.
A breakdown of all revenue that the DCWF may be entitled to is shown in Table 16.
For the purpose of the model, the BESS will be operated in PSM.

64
Table 16: DCWF Revenue with Third WTG and BESS
BESS Type Revenue Type Approximate Revenue
LIB
Electricity Generation
$50/MWh 413 MWh/year $20,650/year
RECs
$85/MWh 413 MWh/year $35,105/year
Capacity Credits $176,800/MW 0.93MW/year $164,424/year
VRB
Electricity Generation
$50/MWh 309 MWh/year $15,450/year
RECs
$85/MWh 309 MWh/year $26,265/year
Capacity Credits
$176,800/MW 0.69MW/year $121,992/year
The payback period for the BESS expansion to the DCWF has been calculated to be
longer than the lifetime of the project. This is shown graphically in Figure 20. The
net present value plots do not cross the break-even mark for either BESS. Thus, if
either BESS option were implemented in 2017, the project would not be
economically feasible.

65
Figure 20: Payback Period for BESS Expansion in 2017
The varying price of wholesale electricity, LGCs, and capacity credits has made it
difficult to determine whether the implementation of the proposed BESS expansion
at a future date will be economically feasible or not. Figure 21 shows the payback
period of the same BESS expansion options if they were implemented in 2020.
The prices of both systems have been reduced by 30%, as predicted by the
International Renewable Energy Agency [35]. However, the LIB replacement has
been kept at $1.27m as per the previous model. In addition to this, the LGC price has
been increased to $100/MWh and capacity credits have been increased to $190,000.
The POE has been left as previously modelled, rising 3% each year.
-6
-5
-4
-3
-2
-1
0
1
2
20
17
20
18
20
19
20
20
20
21
20
22
20
23
20
24
20
25
20
26
20
27
20
28
20
29
20
30
20
31
20
32
20
33
20
34
20
35
20
36
20
37
Ne
t R
eve
nu
e (
$)
Mill
ion
s
Year
BESS Payback Period - 2017
LIB BESS
VRB BESS

66
Figure 21: Payback Period for BESS Expansion in 2020
The payback period for the proposed BESS expansion options shown in Figure 21
demonstrates that both systems will pay themselves off before the end of the project
lifetime. The LIB option, although has a greater NPC, has a shorter payback period of
approximately 14 years. The NPV of the LIB is also greater at $1.52m. The VRB BESS
has a payback period of approximately 17 years, and a NPV of approximately $0.64m.
The results from the economic analysis show that it is not currently viable to
implement either of the proposed BESS expansion options at the DCWF. However,
the results also show that it may be a better option to implement the BESS in the
near future. This could be done after the installation of the third WTG. Another
option would be to install the BESS in stages; this is possible due to the system’s
modular design.
-5
-4
-3
-2
-1
0
1
2
20
20
20
21
20
22
20
23
20
24
20
25
20
26
20
27
20
28
20
29
20
30
20
31
20
32
20
33
20
34
20
35
20
36
20
37
20
38
20
39
20
40
Ne
t R
eve
nu
e
Mill
ion
s
Year
BESS Payback Period - 2020
LIB BESS
VRB BESS

67
5. OVERCOMING RESTRICTIVE POWER LIMITATIONS
5.1 BESS Inverter
The first option that could be employed in the overcoming of the maximum power
limit of the DCWF is the utilisation of the BESS. Both BESS options presented are
installed with inverters capable of reactive power injection or absorption.
Furthermore, they are able to operate at any power factor from 0 to 1, and so have
much more control over voltage at the POC than the WTG inverters. This would
allow the WTGs to operate at full capacity whilst the BESS absorbs reactive power,
limiting the rise in voltage.
However, utility-scale BESSs have been investigated and established to be too
expensive for implementation at the DCWF with the current market price. The
economics of such a system have not been modelled with full output from the wind
farm, though, due to time constraints within the project. This may be a concept for
scope of future works.
5.2 STATCOM
Implementation of a separate STATCOM at the DCWF was originally considered as
an option to overcome the maximum power limit of the wind farm. However, an
integrated STATCOM option is now available, which will be investigated further.

68
5.3 ENERCON WTG Technology
One other option that will be investigated to overcome the DCWF’s maximum
power limitation is the implementation of the third WTG with alternative
technology. The current WTGs at the DCWF are capable of reactive power injection
and absorption at 0.9 power factor. This would produce a reactive power capability
of up to ±387.46 kVAr. This reactive power is only available from the WTG when
there is active power generation. This is represented by Figure 22 [41].
Figure 22: Conventional E-48 WTG P-Q Characterisitc

69
ENERCON WTGs are also capable of installation with more reactive power control
capability. This is known as the Q+ option. The Q+ option allows the WTG to
operate at up to a power factor of 0.8 leading/lagging. This reactive power injection
or absorption from the WTG is then increased to ±600 kVAr. This would allow the
WTG to absorb more reactive power at times of high active power generation
without having adverse effects on system voltage. However, the WTG still needs to
generate active power in order to inject or absorb reactive power. This is represented
in Figure 23 [41].
Figure 23: E-48 WTG with Q+ P-Q Characteristic
Another option for the DCWF to consider is implementation of the third WTG with
the STATCOM option. This would allow the installation of the third WTG with a
70
dedicated STATCOM. The STATCOM would allow the WTG to have dynamic
control over the voltage at the POC. The option would allow the WTG to inject or
absorb reactive power even with no active power generation. ±600 kVAr is still the
maximum reactive power available; however, this is now available with no active
power generation. This is demonstrated in Figure 24 [41].
During times of no wind and no wind farm output, the WTG could inject reactive
power. This would raise the voltage at the POC. During times of where the wind
farm is operating at rated power, the WTG could absorb reactive power. This would
lower the voltage at the POC. Effectively, the voltage swing between no output and
maximum output is much less. Therefore, the wind farm may be able to operate at
rated power whilst keeping the network voltages within acceptable limits.
Figure 24: WTG with Q+ and STATCOM P-Q Characteristic

71
6. SIMULATION OF NETWORK VOLTAGES
The embedded generation source at the end of the LDF has been shown to cause
network voltage to rise beyond stipulated limits. As a result, the maximum output of
each WTG is limited so that this voltage rise at the POC is always held within
acceptable limits. Careful consideration must be taken to ensure wind farm
generation is maximized whilst keeping the distribution network stable.
In order to accurately assess the impact that the different DCWF expansion options
have on the Denmark distribution network, simulations of the different system
options have been carried out with the voltage at the DCWF’s POC studied.
A model of the original and expanded wind farm has been developed in DIgSILENT
PowerFactory, and simulations have been carried out to investigate network issues
and performance. Studies of distribution networks typically consider +6% and -10%
the operational limits for bus voltage [7]. For the purpose of this study, +7% has been
considered due to the simplified nature of the model.
Different expansion options simulated include two WTGs in limited and unlimited
operation; three WTGs in limited and unlimited operation; three WTGs with Q+ in
limited and unlimited operation; and 3 WTGS with Q+ and STATCOM in limited
and unlimited range.
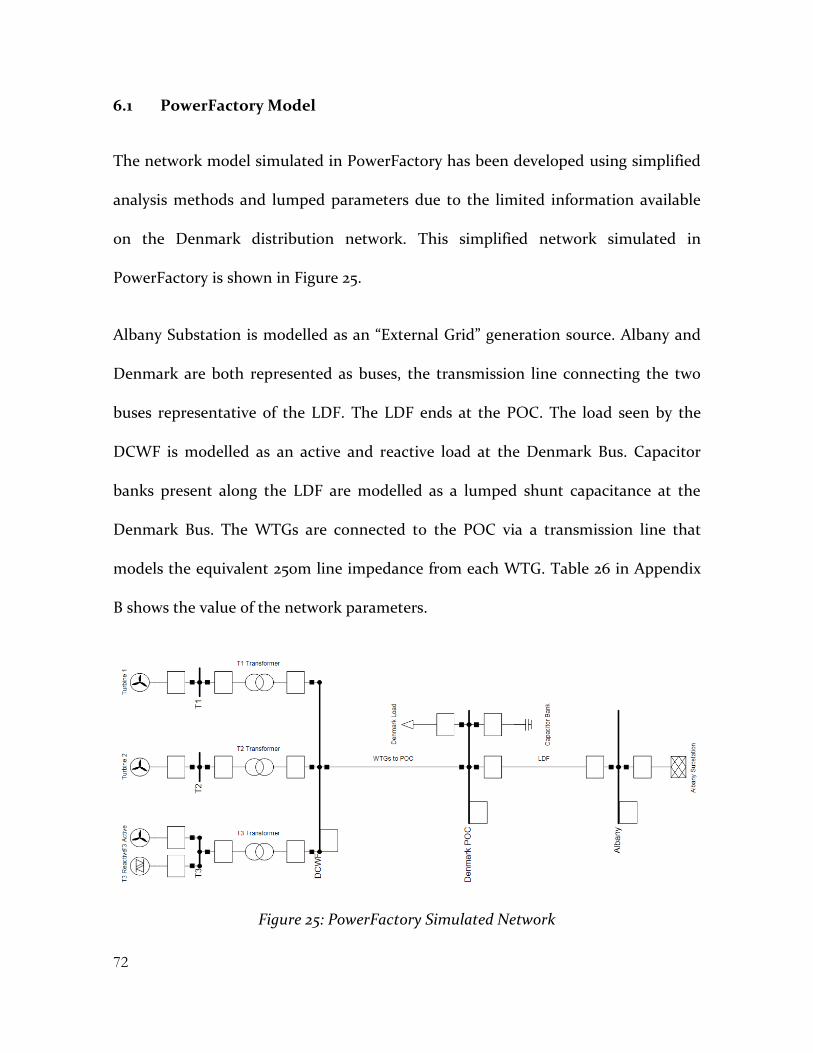
72
6.1 PowerFactory Model
The network model simulated in PowerFactory has been developed using simplified
analysis methods and lumped parameters due to the limited information available
on the Denmark distribution network. This simplified network simulated in
PowerFactory is shown in Figure 25.
Albany Substation is modelled as an “External Grid” generation source. Albany and
Denmark are both represented as buses, the transmission line connecting the two
buses representative of the LDF. The LDF ends at the POC. The load seen by the
DCWF is modelled as an active and reactive load at the Denmark Bus. Capacitor
banks present along the LDF are modelled as a lumped shunt capacitance at the
Denmark Bus. The WTGs are connected to the POC via a transmission line that
models the equivalent 250m line impedance from each WTG. Table 26 in Appendix
B shows the value of the network parameters.
Figure 25: PowerFactory Simulated Network
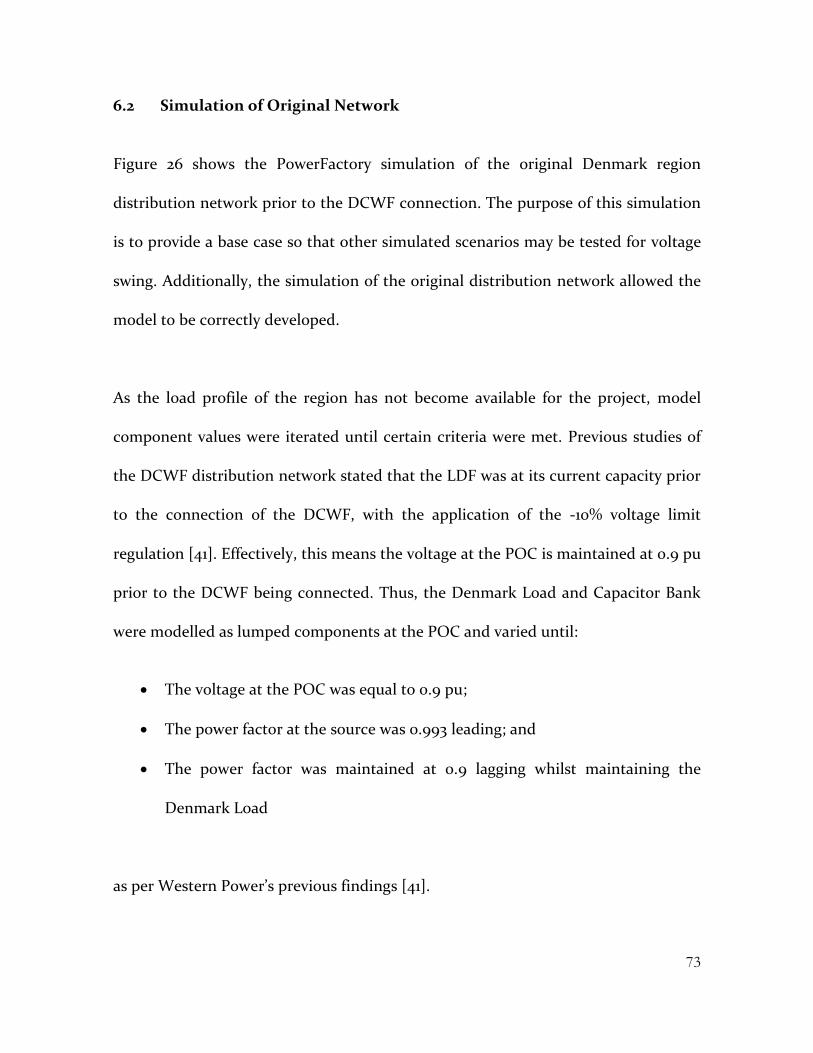
73
6.2 Simulation of Original Network
Figure 26 shows the PowerFactory simulation of the original Denmark region
distribution network prior to the DCWF connection. The purpose of this simulation
is to provide a base case so that other simulated scenarios may be tested for voltage
swing. Additionally, the simulation of the original distribution network allowed the
model to be correctly developed.
As the load profile of the region has not become available for the project, model
component values were iterated until certain criteria were met. Previous studies of
the DCWF distribution network stated that the LDF was at its current capacity prior
to the connection of the DCWF, with the application of the -10% voltage limit
regulation [41]. Effectively, this means the voltage at the POC is maintained at 0.9 pu
prior to the DCWF being connected. Thus, the Denmark Load and Capacitor Bank
were modelled as lumped components at the POC and varied until:
• The voltage at the POC was equal to 0.9 pu;
• The power factor at the source was 0.993 leading; and
• The power factor was maintained at 0.9 lagging whilst maintaining the
Denmark Load
as per Western Power’s previous findings [41].
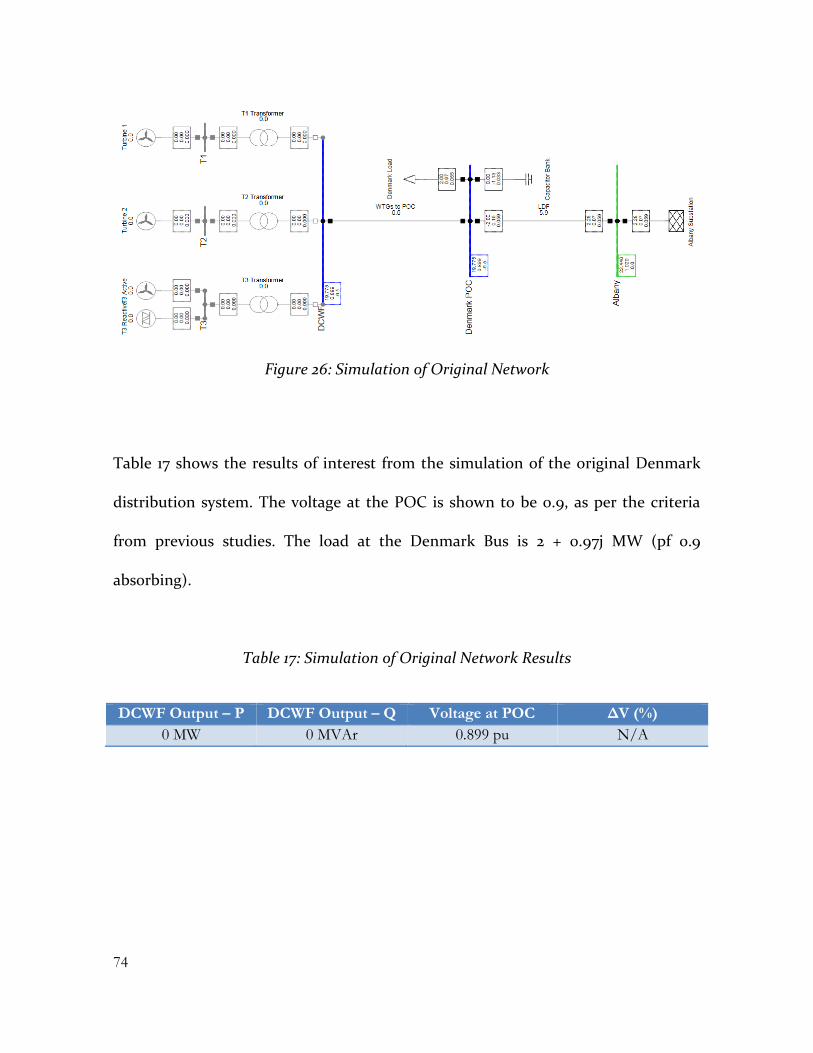
74
Figure 26: Simulation of Original Network
Table 17 shows the results of interest from the simulation of the original Denmark
distribution system. The voltage at the POC is shown to be 0.9, as per the criteria
from previous studies. The load at the Denmark Bus is 2 + 0.97j MW (pf 0.9
absorbing).
Table 17: Simulation of Original Network Results
DCWF Output – P DCWF Output – Q Voltage at POC ΔV (%)
0 MW 0 MVAr 0.899 pu N/A
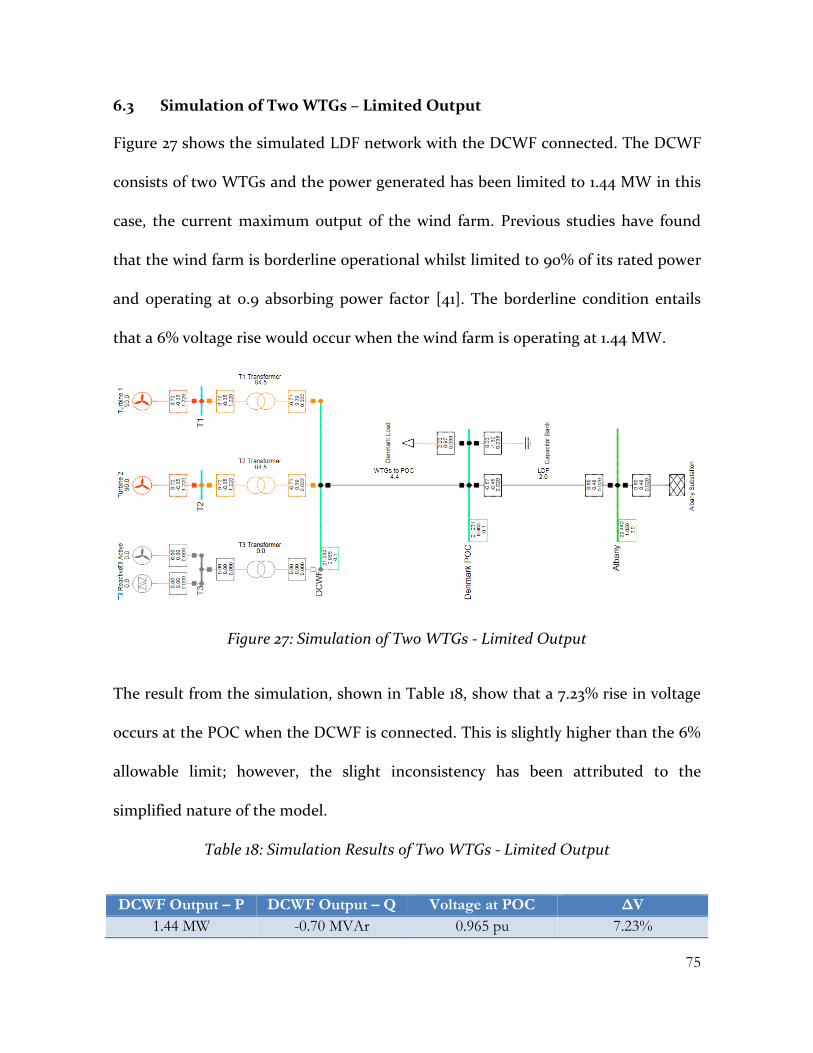
75
6.3 Simulation of Two WTGs – Limited Output
Figure 27 shows the simulated LDF network with the DCWF connected. The DCWF
consists of two WTGs and the power generated has been limited to 1.44 MW in this
case, the current maximum output of the wind farm. Previous studies have found
that the wind farm is borderline operational whilst limited to 90% of its rated power
and operating at 0.9 absorbing power factor [41]. The borderline condition entails
that a 6% voltage rise would occur when the wind farm is operating at 1.44 MW.
Figure 27: Simulation of Two WTGs - Limited Output
The result from the simulation, shown in Table 18, show that a 7.23% rise in voltage
occurs at the POC when the DCWF is connected. This is slightly higher than the 6%
allowable limit; however, the slight inconsistency has been attributed to the
simplified nature of the model.
Table 18: Simulation Results of Two WTGs - Limited Output
DCWF Output – P DCWF Output – Q Voltage at POC ΔV
1.44 MW -0.70 MVAr 0.965 pu 7.23%
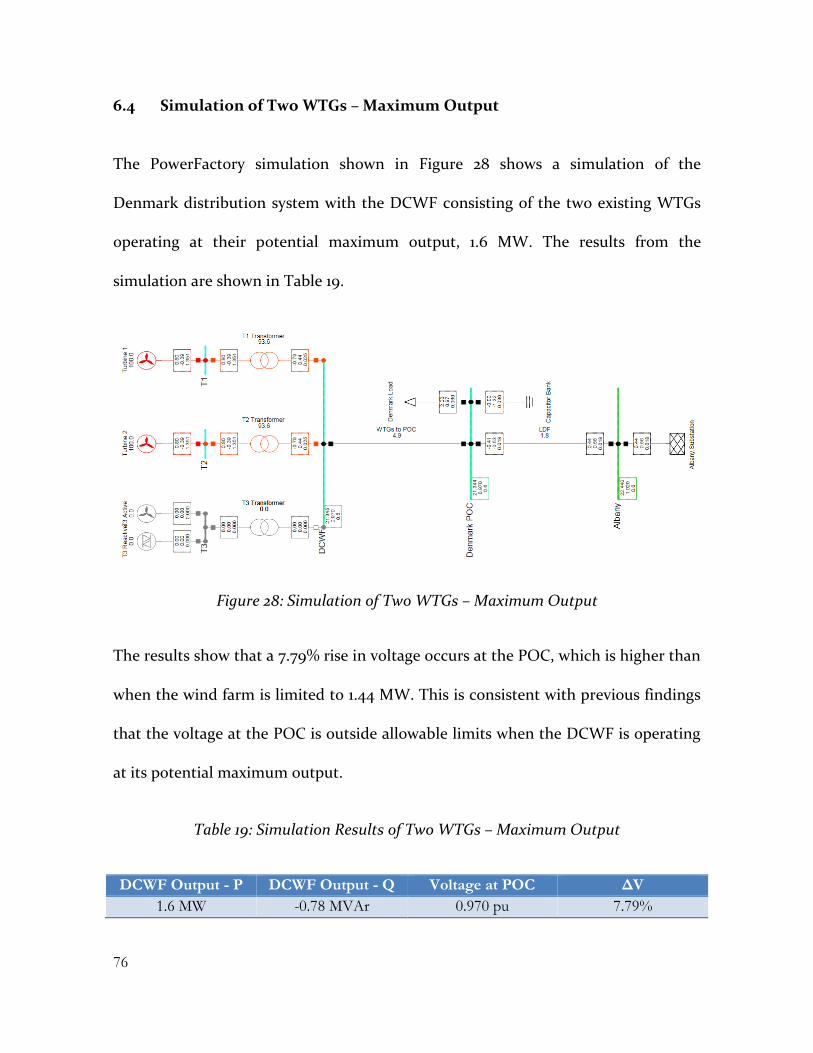
76
6.4 Simulation of Two WTGs – Maximum Output
The PowerFactory simulation shown in Figure 28 shows a simulation of the
Denmark distribution system with the DCWF consisting of the two existing WTGs
operating at their potential maximum output, 1.6 MW. The results from the
simulation are shown in Table 19.
Figure 28: Simulation of Two WTGs – Maximum Output
The results show that a 7.79% rise in voltage occurs at the POC, which is higher than
when the wind farm is limited to 1.44 MW. This is consistent with previous findings
that the voltage at the POC is outside allowable limits when the DCWF is operating
at its potential maximum output.
Table 19: Simulation Results of Two WTGs – Maximum Output
DCWF Output - P DCWF Output - Q Voltage at POC ΔV
1.6 MW -0.78 MVAr 0.970 pu 7.79%

77
6.5 Simulation of Three WTGs – Limited Output
Figure 30 shows a simulation of the Denmark distribution system with the expanded
DCWF inclusive of three WTGs connected. The WTGs have been limited to 1.44
MW, equally capped at 0.48 MW. This simulates the output of the wind farm if the
maximum limit of the DCWF is not raised immediately after implementing the third
WTG. The results from the simulation are shown in Table 20.
Figure 29: Simulation of Three WTGs - Limited Output
The results from the simulation are very similar to that of the simulation with the
DCWF consisting of two WTGs with limited output. This is expected, as the same
active and reactive power is generated and absorbed from the wind farm.
Table 20: Simulation Results of Three WTGs - Limited Output
DCWF Output – P DCWF Output – Q Voltage at POC ΔV
1.44 MW -0.70 MVAr 0.967 pu 7.46%

78
6.6 Simulation of Three WTGs – Maximum Output
A simulation of the Denmark distribution system has been carried out with the
expanded DCWF operating at maximum potential output, 2.4 MW. This is shown
below in Figure 30, with a summary of the results shown in Table 21.
Figure 30: Simulation of Three WTGs - Maximum Output
The voltage at the POC with the expanded DCWF operating at maximum generation
has been found to be 0.996 pu, 10.69% more than when the wind farm has no
output. This simulation shows that three WTGs at the DCWF would substantially
push voltages outside of limits.
Table 21: Simulation Results of Three WTGs - Maximum Output
DCWF Output – P DCWF Output – Q Voltage at POC ΔV
2.4 MW -1.16 MVAr 0.996 pu 10.69%
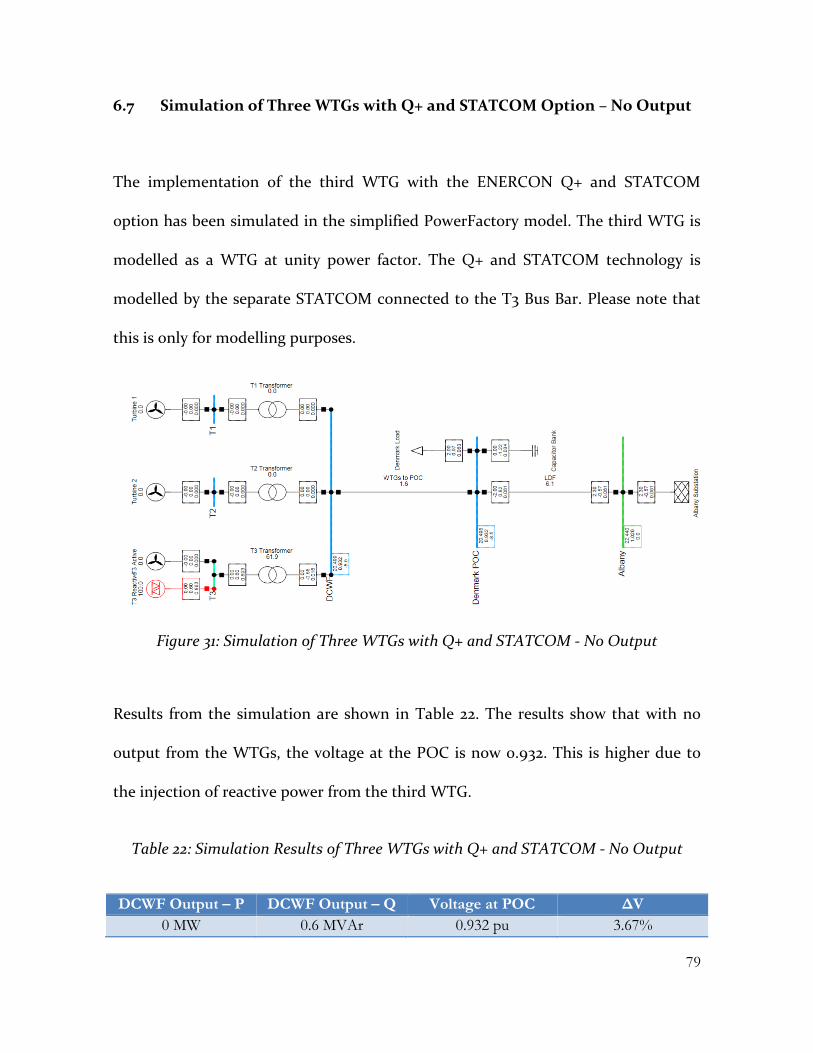
79
6.7 Simulation of Three WTGs with Q+ and STATCOM Option – No Output
The implementation of the third WTG with the ENERCON Q+ and STATCOM
option has been simulated in the simplified PowerFactory model. The third WTG is
modelled as a WTG at unity power factor. The Q+ and STATCOM technology is
modelled by the separate STATCOM connected to the T3 Bus Bar. Please note that
this is only for modelling purposes.
Figure 31: Simulation of Three WTGs with Q+ and STATCOM - No Output
Results from the simulation are shown in Table 22. The results show that with no
output from the WTGs, the voltage at the POC is now 0.932. This is higher due to
the injection of reactive power from the third WTG.
Table 22: Simulation Results of Three WTGs with Q+ and STATCOM - No Output
DCWF Output – P DCWF Output – Q Voltage at POC ΔV
0 MW 0.6 MVAr 0.932 pu 3.67%
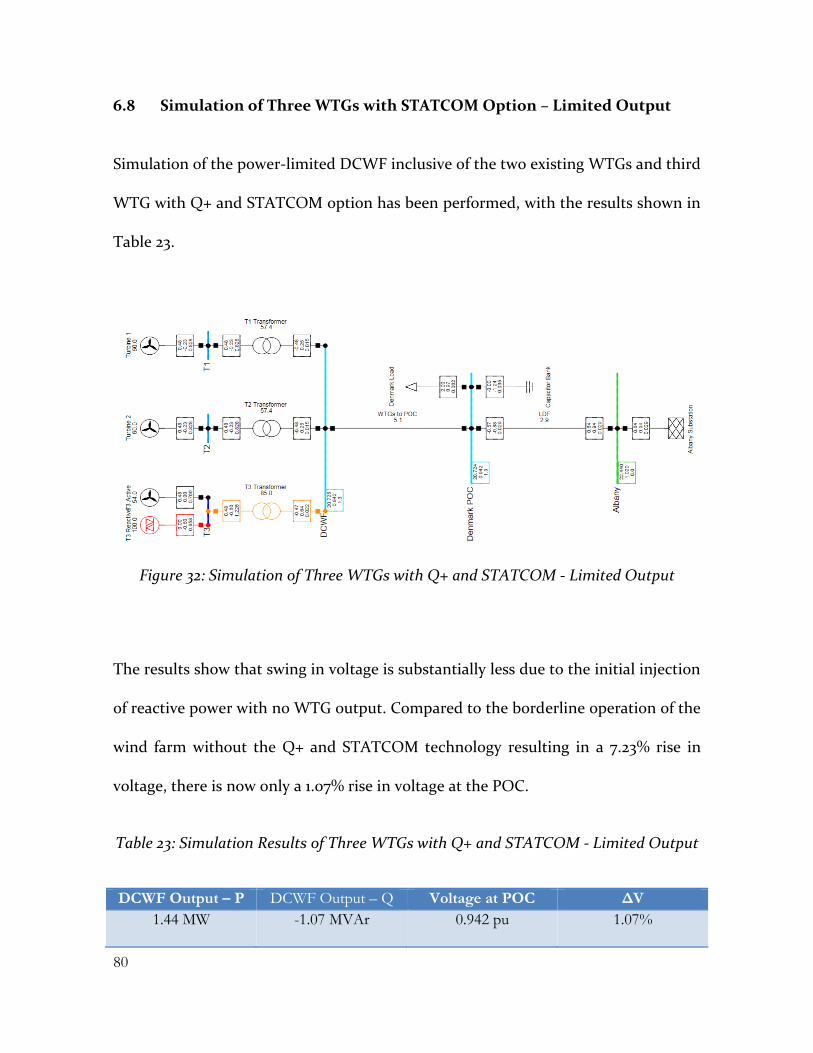
80
6.8 Simulation of Three WTGs with STATCOM Option – Limited Output
Simulation of the power-limited DCWF inclusive of the two existing WTGs and third
WTG with Q+ and STATCOM option has been performed, with the results shown in
Table 23.
Figure 32: Simulation of Three WTGs with Q+ and STATCOM - Limited Output
The results show that swing in voltage is substantially less due to the initial injection
of reactive power with no WTG output. Compared to the borderline operation of the
wind farm without the Q+ and STATCOM technology resulting in a 7.23% rise in
voltage, there is now only a 1.07% rise in voltage at the POC.
Table 23: Simulation Results of Three WTGs with Q+ and STATCOM - Limited Output
DCWF Output – P DCWF Output – Q Voltage at POC ΔV
1.44 MW -1.07 MVAr 0.942 pu 1.07%
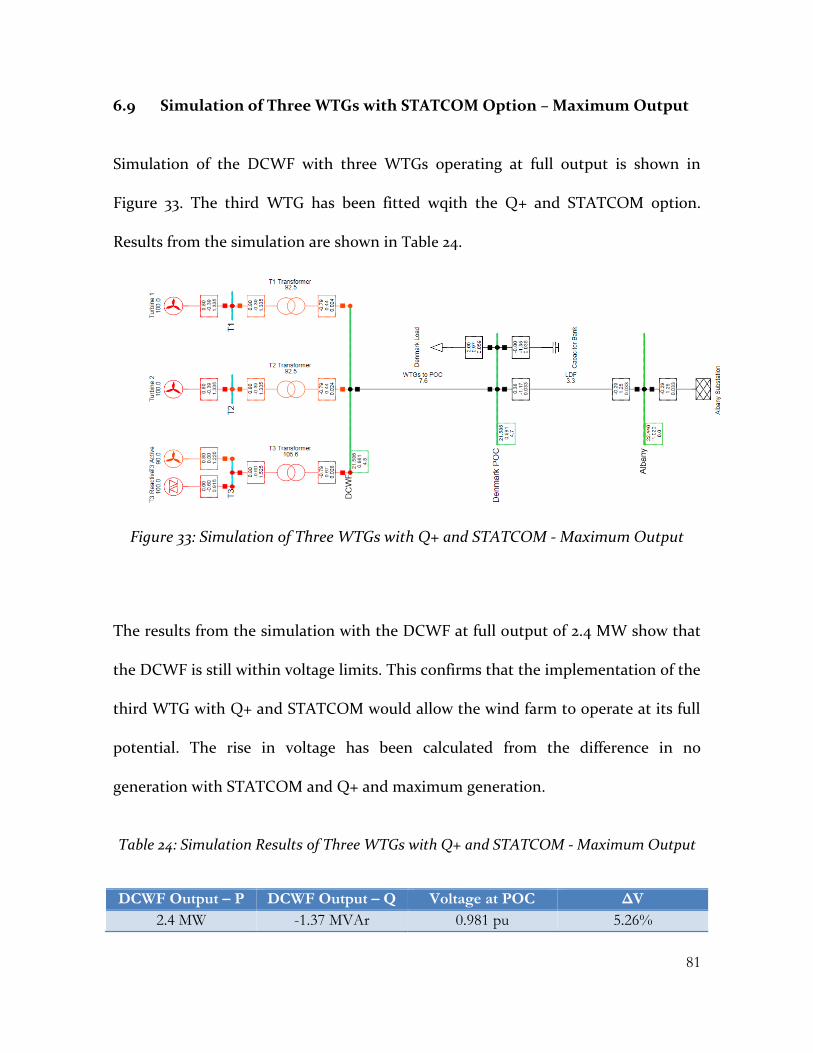
81
6.9 Simulation of Three WTGs with STATCOM Option – Maximum Output
Simulation of the DCWF with three WTGs operating at full output is shown in
Figure 33. The third WTG has been fitted wqith the Q+ and STATCOM option.
Results from the simulation are shown in Table 24.
Figure 33: Simulation of Three WTGs with Q+ and STATCOM - Maximum Output
The results from the simulation with the DCWF at full output of 2.4 MW show that
the DCWF is still within voltage limits. This confirms that the implementation of the
third WTG with Q+ and STATCOM would allow the wind farm to operate at its full
potential. The rise in voltage has been calculated from the difference in no
generation with STATCOM and Q+ and maximum generation.
Table 24: Simulation Results of Three WTGs with Q+ and STATCOM - Maximum Output
DCWF Output – P DCWF Output – Q Voltage at POC ΔV
2.4 MW -1.37 MVAr 0.981 pu 5.26%

83
7. PROJECT COMPLICATIONS
A large part of the preceding analyses has been heavily dependent on the data
acquired from the ESS. The ESS logged environmental and generation data for both
WTGs at the DCWF to an acceptable degree, but was not perfect in logging data for
every 10-minute interval. Quality controlling confirmed 1364 10-minute intervals
were missing from the downloaded data, accounting for 2.6% of the total data.
The missing data was determined to be as a result of power outages to the DCWF for
various reasons, such as wind farm or transmission network maintenance, and
switching events due to storms or blackouts. This can be confirmed with
examination of the DCWF Outage Report provided by SkyFarming. The outages for
the analysis period were taken to be representative of an average year for the DCWF,
and so all data (not) logged during these periods has been omitted from the analysis.
It is also important to recognize the limitations of data-handling equipment of the
ESS. Firstly, the resolution of some of the logged data has been problematic. As the
energy produced by T1 and T2 in any 10-minute period has only been logged to one
significant figure, results from the “ENERCON SCADA system” generation analysis
may be erroneous. However, the small difference in results from the two WTGs
restricted analysis does not suggest the data is too misleading.

84
A further problem highlighting the limitations of data-logging instruments in the
ESS is the anemometer on the E-48 WTG. The anemometer is situated on the nacelle
of the WTG, and so may be subject to shading from the blades of the WTG. The
anemometers logging wind speeds for the ESS have no recorded accuracy
specifications, and so it has been difficult to assess the instrument’s reliability for the
generation analyses of the project. However, it must be noted that some
anemometers apply a correction factor prior to logging them wind speeds [18]; this
has been assumed for the purpose of the project.
One other possible solution is to apply a scaling factor to the wind speed
measurements so that they are scaled up proportionally to equal the energy
production logged by the ESS. This has not been implemented in the project due to
the resolution of the ESS logged energy measurement.
85
8. CONCLUSION
The DCWF in its current state consisting of two WTGs does not currently lose much
annual generation due to the currently imposed maximum power limit. Only 2.2% of
annual generation is lost. The raising of the maximum power of the wind farm in
this scenario may not be viable if it requires a costly investment.
However, with the addition of a third WTG to the wind farm, the annual generation
lost due to the maximum power limit would increase to 18.7%. A third WTG
installed at the site with the currently imposed limit, even temporarily, would result
in an additional 29% in annual yield compared to two. It has been found that this
would produce a positive NPV of $2.8m with the system taking 8.7 years to pay back.
However, this would result in only 60% of the wind farms capacity being utilised.
The DCWF would produce 7639 MWh annually if a third WTG with no restrictions
were installed. The WTG would only take 4.8 years to pay itself off, with a NPV of
$7.1m. This is substantially more than if the WTG were installed when the wind farm
was restricted. Thus, it becomes apparent the need to increase the maximum power
limit.
The expansion of the DCWF with the installation of a 1 MW/ 4 MWh BESS would
result in the wind farm maintaining the maximum output for much longer.
Operating in MGM, the DCWF would gain an additional 309 MWh annually with
86
the selected VRB technology, or an additional 413 MWh annually with the selected
LIB technology. However, both BESS options took longer than the project lifetime to
pay back. Thus, the conclusion has been made that the implementation of utility-
scale battery storage at the DCWF is currently not economically feasible. However,
an economic model of the BESS options has been undertaken for three years’ time.
The systems have been shown to be much more economically feasible if installed in
near future.
Operation of the BESS in PSM may attract additional capacity credits and arbitrage if
a new PPA were agreed to. Although the economic feasibility of the battery
operating in this way has not been investigated in this report, the concept warrants
further investigation. This may be able to be researched in more detail in future if
additional financial information were acquired from the DCWF Board.
A solution has been presented that would allow the expanded DCWF to overcome
the problem of voltage rise and generate at its maximum potential. The
implementation of a third WTG with the Q+ and STATCOM feature would allow for
a much smaller swing in voltage from no wind farm output to full wind farm output.
The impact of this system on the Denmark distribution network has been simulated
in PowerFactory, with the outcome proving that the solution would satisfy the
voltage limits. However, the model has been greatly simplified due to the limited
amount of information available. In future, a more detailed PowerFactory model
could be developed that would provide a much more accurate study.

87
9. REFERENCES
[1] Denmark Community Windfarm, "Location," Denmark Community Windfarm Ltd, 2013. [Online]. Available: http://www.dcw.org.au/location.html. [Accessed December 2016].
[2] Denmark Community Windfarm Ltd, "History," 2013. [Online]. Available: http://www.dcw.org.au/history.html. [Accessed November 2016].
[3] Denmark Community Windfarm Ltd, "The Project," 2013. [Online]. Available: http://www.dcw.org.au/project.html. [Accessed November 2016].
[4] ENERCON, "ENERCON Product Overview," Germany, Aurich, 2015.
[5] Western Power, "What we do," Western Power, 2016. [Online]. Available: https://www.westernpower.com.au/about/what-we-do/. [Accessed Novemeber 2016].
[6] A. Woodroffe, Interviewee, A Tale of Two Windfarms (SkyFarming). [Interview]. 2016.
[7] C. L. Masters, "Voltage Rise The Big Issue When Connecting Embedded Generat On To Long 11 Kv Overhead Lines," Power Engineering Journal, vol. February, pp. 5-12, 2002.
[8] Western Power, "Technical Rules," Western Power, Perth, 2011.
[9] M. Calais, "Power Quality and Wind Power," Murdoch University, Perth, 2016.
[10] G. Boyle, Renewable Energy: Power for a Sustainable Future, Oxford: Oxford University Press, 2012.
[11] Clean Energy Council, "Energy Storage," Clean Energy Council, [Online]. Available: https://www.cleanenergycouncil.org.au/technologies/energy-storage.html. [Accessed 12 August 2016].
[12] AECOM, "Energy Storage Study," Australian Renewable Energy Agency, Sydney, 2015.
[13] Lazard, "Lazard's Levelised Cost of Storage Analysis," 2015.
[14] D. Elliott, Balancing Green Power, Bristol: IOP Publishing, 2016.
[15] M. Brower, Wind Resource Assessment: A Practical Guide to Developing a Wind Project, New Jersey: John Wiley & Sons, 2012.
[16] AWS Scientific, Inc., Wind Resource Assessment Handbook, New York: National Renewable Energy Laboratory, 1997.
[17] Australian Energy Market Operator, "Facility Scada," Australian Energy Market Operator, 2015/2016. [Online]. Available: http://data.wa.aemo.com.au/#facility-scada. [Accessed October 2016].
[18] C. Mademlis, "Influence of the Measurement Accuracy of Wind Sensors on Wind System Performance," Aristotle University of Thessaloniki, Greece.
[19] S. Stankovic, N. Campbell and A. Harries, Urban Wind Energy, London: Earthscan, 2009.
[20] UK Government, "Digest of UK Energy Statistics," 30 July 2015. [Online]. Available:
88
https://www.gov.uk/government/collections/digest-of-uk-energy-statistics-dukes. [Accessed 20 September 2016].
[21] T. Wizelius, Developing Wind Power Projects, London: Earthscan, 2007.
[22] D. A. J. R. R. M. Dell, Understanding Batteries, The Royal Society of Chemistry: Cambridge, 2001.
[23] X. Xie, "Vanadium Redox-Flow Battery," 25 November 2011. [Online]. Available: http://large.stanford.edu/courses/2011/ph240/xie2/. [Accessed December 2016].
[24] Hydro Tasmania, "King Island Renewable Energy Integration project," Hydro Tasmania, 2014. [Online]. Available: http://www.kingislandrenewableenergy.com.au/project-information/energy-storage-system. [Accessed january 2017].
[25] Australian Vanadium Limited, "Vanadium Batteries," Australian Vanadium Limited, 2017. [Online]. Available: http://australianvanadium.com.au/vanadium-batteries/. [Accessed January 2017].
[26] Gildemeister, "CellCube FB 250-1000," [Online]. Available: http://www.vsun.com.au/wp-content/uploads/CellCube-250-1000.pdf. [Accessed December 2016].
[27] e. a. Xing Luo, "Overview Of Current Development In Electrical Energy Storage Technologies And The Application Potential In Power System Operation," Applied Energy, vol. 137, pp. 511-536, 2015.
[28] Gildemeister, "Product Line Presentation CellCube," Gildemesiter, 2016.
[29] S. Santhanagopolan, Design and Analysis of Large Lithium-Ion Battery Systems, London: Artech House, 2015.
[30] Are We Any Closer, "Lithium Ion Battery Primer," Are We Any Closer, May 2013. [Online]. Available: https://areweanycloser.wordpress.com/2013/05/20/lithium-ion-battery-primer/. [Accessed December 2016].
[31] T. R. David Linden, Handbook of Batteries, New York: Mcgraw-Hill, 2002.
[32] Australian Government, "Bureau of Meteorology," Commonwealth of Australia, 2017. [Online]. Available: http://www.bom.gov.au/. [Accessed 6 January 2017].
[33] Climate Council, "Powerful Potential: Battery Storage for Renewable Energy and Electric Cars," Climate Council, Australia, 2015.
[34] S. Tachikawa and T. Yachi, "Economical Evaluation of Photovoltaic and Battery Systems under Real-time Pricing (RTP)," Tokyo University of Science, Tokyo, 2013.
[35] International Renewable Energy Agency, "Battery Storage For Renewables: Market Status And Technology Outlook," IRENA, Abu Dhabi, 2015.
[36] Australian Energy Market Operator, "Short-Term Energy Market (STEM) Summary," AEMO, 2016. [Online]. Available: https://www.aemo.com.au/Electricity/Wholesale-Electricity-Market-WEM/Data/Price-limits. [Accessed January 2017].
[37] Jacobs, "Retail Electricity Price History And Projections - Public," AEMO, Australia, 2016.
89
[38] Mercari, "LGC Closing Rates," Mercari, 17 January 2017. [Online]. Available: http://lgc.mercari.com.au/. [Accessed 7 January 2017].
[39] Green Energy Markets, "LGC Market Prices," Green Energy Markets, 2016. [Online]. Available: http://greenmarkets.com.au/resources/lgc-market-prices. [Accessed January 2017].
[40] Australian Energy Market Operator, "Assignment of Capacity Credits," 2016. [Online]. Available: https://www.aemo.com.au/Electricity/Wholesale-Electricity-Market-WEM/Reserve-capacity-mechanism/Assignment-of-capacity-credits. [Accessed January 2017].
[41] ENERCON, "Technical Data - ENERCON Grid Technology," ENERCON, 2016. [Online]. Available: http://www.enercon.de/en/technology/grid-technology/. [Accessed January 2017].
[42] Western Power, "Denmark Community Wind Farm Study Summary," Western Power, Perth, 2012.
[43] L. Z. William Shepherd, Electricity Generation Using Wind Power, England: World Scientific Pub Co Inc, 2011.
[44] Western Power, "Denmark Community Wind Farm Study Summary," Western Power, Perth, 2012.
[45] Western Power, "Guidelines for connection of generators," Western Power, Perth, 2016.
[46] C. A.-C. a. S. R.-M. Francisco Bañuelos-Ruedas, "Methodologies Used in the Extrapolation of Wind Speed Data at Different Heights and Its Impact in the Wind Energy Resource Assessment in a Region," 2011. [Online]. Available: http://www.intechopen.com/books/wind-farm-technical-regulations-potential-estimation-and-siting-assessment/methodologies-used-in-the-extrapolation-of-wind-speed-data-at-different-heights-and-its-impact-in-th. [Accessed 19 September 2016].
[47] Denmark Community Windfarm Ltd, "The Turbines," Denmark Community Windfarm Ltd, 2013. [Online]. Available: http://www.dcw.org.au/turbine.html. [Accessed November 2016].
[48] U.S. Department of Energy, "Vanadium Redox Flow Batteries," October 2012. [Online]. Available: https://energy.gov/sites/prod/files/VRB.pdf. [Accessed January 2017].
[49] Nexeon, "About Li-ion Batteries," Nexeon, 2017. [Online]. Available: https://www.nexeon.co.uk/about-li-ion-batteries/. [Accessed January 2017].
[50] Synergy, "Synergy Smart Home Plan," Synergy, 2017. [Online]. Available: https://www.synergy.net.au/Your-home/Energy-plans/Smart-Home-Plan. [Accessed January 2017].


91
10. LITERATURE REVIEW
10.1 Developing Wind Power Projects
This textbook, published in 2007, provides an insight into the overall development,
from planning to commissioning, of large-scale wind farms. It has been useful in
helping to develop a broad understanding of the concepts involved in the operation
of a wind farm; the text provides general information on all key steps involved,
instead of very detailed information on a particular step. Specifically, the text has
been referred for recollection of concepts previously learnt throughout university
studies, including wind characteristics (such as turbulence and roughness classes),
wind energy yield (such as speed and height relationships), and wind turbine types
and components (such as methods of power control and generator type). [21]
10.2 Urban Wind Energy
“Urban Wind Energy” is a textbook published in 2009 that has been very
knowledgeable in the feasibility analysis aspect of the thesis project. The book
provides various topics to consider when conducting a wind resource feasibility
analysis, including capacity factor of the site and potential energy yield in the wind.
Concepts have been used in the text to relate to the studies undertaken for the
DCWF thesis project; however, the book has been more useful in providing a means
to consider different ways of how the DCWF site could be analysed. [19]
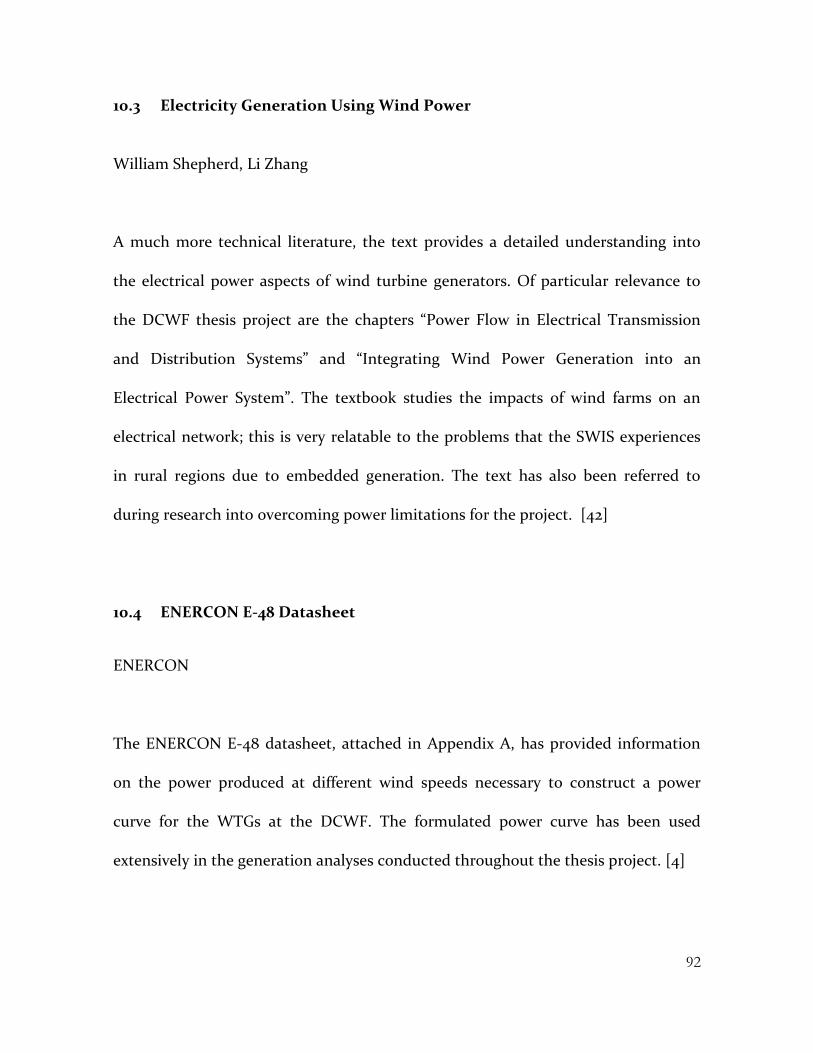
92
10.3 Electricity Generation Using Wind Power
William Shepherd, Li Zhang
A much more technical literature, the text provides a detailed understanding into
the electrical power aspects of wind turbine generators. Of particular relevance to
the DCWF thesis project are the chapters “Power Flow in Electrical Transmission
and Distribution Systems” and “Integrating Wind Power Generation into an
Electrical Power System”. The textbook studies the impacts of wind farms on an
electrical network; this is very relatable to the problems that the SWIS experiences
in rural regions due to embedded generation. The text has also been referred to
during research into overcoming power limitations for the project. [42]
10.4 ENERCON E-48 Datasheet
ENERCON
The ENERCON E-48 datasheet, attached in Appendix A, has provided information
on the power produced at different wind speeds necessary to construct a power
curve for the WTGs at the DCWF. The formulated power curve has been used
extensively in the generation analyses conducted throughout the thesis project. [4]

93
10.5 Wind Resource Assessment: A Practical Guide to Developing a Wind Project
Michael Brower, Daniel Bernadett, Kurt Elsholz
This recent (2012) online textbook provides detailed data monitoring, logging, and
handling techniques for wind projects. The chapter “Data Analysis and Resource
Assessment” gives a step by step process of how to correctly quality control and
validate logged data, which has been extremely useful in the preliminary stages of
the generation analyses of the DCWF. Due to the huge amounts of data acquired
from the ESS and its’ importance to proceeding parts of the project, it has been
important to understand how to handle it correctly. The treatment of suspect and
missing data is also an important concept covered by the text. [15]
10.6 Denmark Community Wind Farm Study Summary
Western Power
This document from Western Power is a study summary conducted in 2012 (Revision
2) for the connection of the DCWF in its current state of operation. The document is
extremely useful in that it provides various studies of the wind farm from the utility’s
point of view; it provides the rules and regulations that Western Power must impose
upon the wind farm to ensure network stability. Load models, feeder currents, and
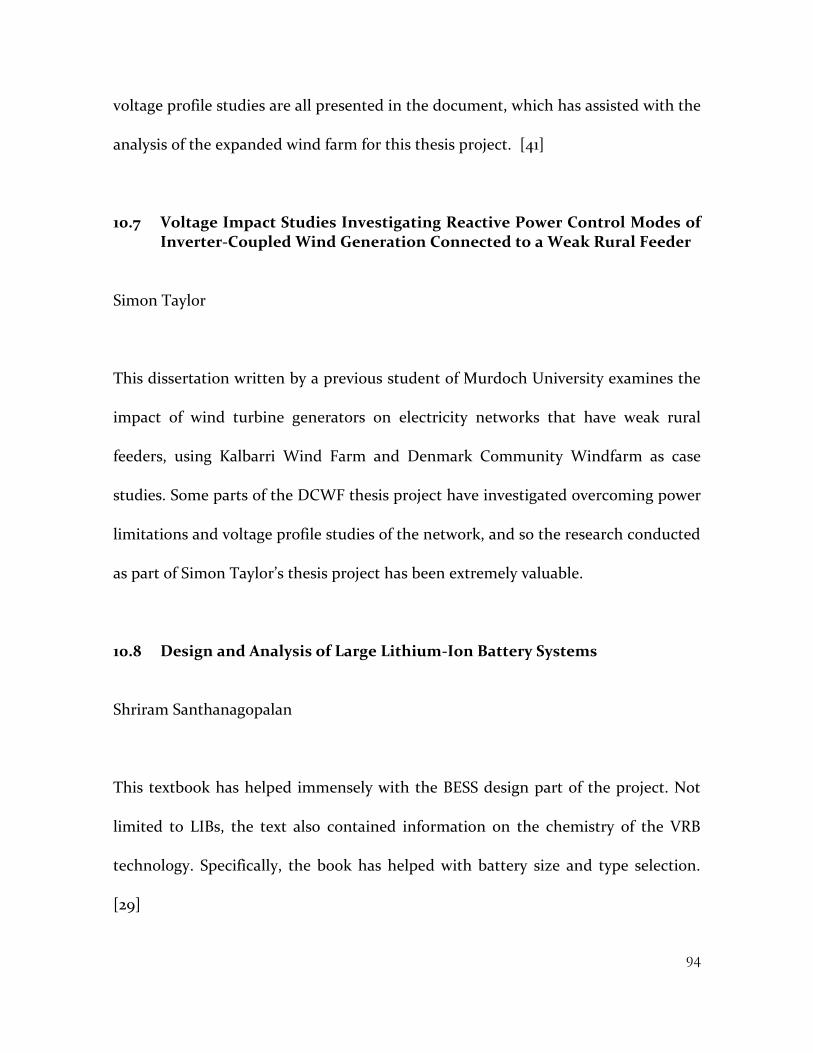
94
voltage profile studies are all presented in the document, which has assisted with the
analysis of the expanded wind farm for this thesis project. [41]
10.7 Voltage Impact Studies Investigating Reactive Power Control Modes of Inverter-Coupled Wind Generation Connected to a Weak Rural Feeder
Simon Taylor
This dissertation written by a previous student of Murdoch University examines the
impact of wind turbine generators on electricity networks that have weak rural
feeders, using Kalbarri Wind Farm and Denmark Community Windfarm as case
studies. Some parts of the DCWF thesis project have investigated overcoming power
limitations and voltage profile studies of the network, and so the research conducted
as part of Simon Taylor’s thesis project has been extremely valuable.
10.8 Design and Analysis of Large Lithium-Ion Battery Systems
Shriram Santhanagopalan
This textbook has helped immensely with the BESS design part of the project. Not
limited to LIBs, the text also contained information on the chemistry of the VRB
technology. Specifically, the book has helped with battery size and type selection.
[29]

95
11. APPENDICES
11.1 Appendix A: ENERCON E-48 WTG Specifications
Table 25: ENERCON E-48 WTG Power Produced Over Different Wind Speeds
Wind Speed (m/s)
Power (kW)
Power Coefficient
1 0.0 0.00
2 0.0 0.00
3 5.0 0.17
4 25.0 0.35
5 60.0 0.43
6 110.0 0.46
7 180.0 0.47
8 275.0 0.48
9 400.0 0.50
10 555.0 0.50
11 671.0 0.45
12 750.0 0.39
13 790.0 0.32
14 810.0 0.27
15 810.0 0.22
16 810.0 0.18
17 810.0 0.15
18 810.0 0.13
19 810.0 0.11
20 810.0 0.09
21 810.0 0.08
22 810.0 0.07
23 810.0 0.06
24 810.0 0.05
25 810.0 0.05
Developed Power Curve Equation
0.0107230392𝑥6 − 0.5116280162𝑥5 + 9.4788367194𝑥4 − 87.2620084372𝑥3 + 430.4929572715𝑥2 − 1,060.6424460003𝑥 + 1,017.3199263051

96
11.2 Appendix B: Powerfactory Model Parameters
Table 26: PowerFactory Network Parameters
Component Name Parameters
Grid Albany Substation V Setpoint = 1.02 pu
Bus Albany Nominal V = 22 kV
Distribution Line
Lower Denmark Feeder (LDF)
Z = 26.78 + 35.28j
Bus Denmark Point of Connection (POC)
Nominal V = 22 kV
Load Denmark Load P = 2 MW, Q = 0.969 MVAr
Shunt Capacitor Capacitor Bank Q = -1.4 Var
Distribution Line
WTGs to POC Z = 0.022 + 0.029j
Bus DCWF Nominal V = 22 kV
Transformer T1 Transformer 22 kV (D)/400 V (YN), Rated S = 1 MVA, Z = 6.25%, Losses = 7.75 kW
Transformer T2 Transformer 23 kV (D)/400 V (YN), Rated S = 1 MVA, Z = 6.25%, Losses = 7.75 kW
Transformer T3 Transformer 24 kV (D)/400 V (YN), Rated S = 1 MVA, Z = 6.25%, Losses = 7.75 kW
Bus T1 Nominal V = 400 V
Bus T2 Nominal V = 400 V
Bus T3 Nominal V = 400 V
Static Generator Turbine 1 P = Variable, Q = Variable, PF = 0.9 absorbing
Static Generator Turbine 2 P = Variable, Q = Variable, PF = 0.9 absorbing
Static Generator T3 Active P = Variable, Q = 0, PF = 1
Static Generator T3 Reactive P = 0 , Q = Variable, PF = 0