expanding regional freight information resources for the ... · for the upper midwest ... updated...
TRANSCRIPT

Expanding Regional Freight Information Resources for the Upper Midwest
Phase III:
The Great Lakes Maritime Information Delivery System: A Resource for the Regional Analysis of Intermodal Freight Flows in
the Great Lakes Region
Interim Report PI: Dr. Peter Lindquist The University of Toledo Associate Professor/ [email protected] Chair (419) 530-2545 Co-PI: Dr. Mark Vonderembse The University of Toledo Professor [email protected] (419) 530-4319 October 30, 2008 The University of Toledo Department of Geography and Planning, MS 932 2801 W. Bancroft Toledo, OH 43606
This report represents the results of research conducted by the authors and does not necessarily represent the views or policies of the Great Lakes Maritime Research Institute. This report does not contain a standard or specified technique. The authors and the Great Lakes Maritime Research Institute do not endorse products or manufacturers. Trade or manufacturers’ names appear herein solely because they are considered essential to this report.
Research funded in part by the Great Lakes Maritime Research Institute. This study was supported by the U.S. Maritime Administration
Grant # DTMA1-G-06-005

1

2
Table of Contents Chapter Page
Executive Summary
Introduction . . . . . . . . . . . . . . . . . . . . . . . . . . . . . . . . . . . . . . . . . . . . . . . . . . . . . . . . . . . . . .. 9
Dialog with the Great Lakes Maritime Industry . . . . . . . . . . . . . . . . . . . . . . . . . . . . . . . . . . 11
Data Collection and Development of the Project Web Site . . . . . . . . . . . . . . . . . . . . . . . . . 12 A Great Lakes Maritime Exchange . . . . . . . . . . . . . . . . . . . . . . . . . . . . . . . . . . . . . . . . . . . . 16 Conclusion . . . . . . . . . . . . . . . . . . . . . . . . . . . . . . . . . . . . . . . . . . . . . . . . . . . . . . . . . . . . . . . 17
References . . . . . . . . . . . . . . . . . . . . . . . . . . . . . . . . . . . . . . . . . . . . . . . . . . . . . . . . . . . . . . . 18 Dissemination of Results . . . . . . . . . . . . . . . . . . . . . . . . . . . . . . . . . . . . . . . . . . . . . . . . . . . 18 Appendix: Sample of Map Output from Midwest FreightView . . . . . . . . . . . . . . . . . . . . . . 20

3

4
Executive Summary
This project marked the third phase of a long-term endeavor to develop and manage the Great Lakes Maritime Transportation Delivery System (GLMTDS). The GLMTDS is designed to serve as a comprehensive data repository and information clearinghouse in support of intermodal maritime commerce in the Great Lakes and St. Lawrence Seaway region. The system is further envisioned to serve as a resource for public policy decisions and for drawing the link between maritime freight movements, economic viability, and environmental quality throughout the Great Lakes and St. Lawrence Seaway. This data gateway is particularly focused on providing support data for analysis in several key focus areas including:
Economic impact of Great Lakes shipping
Safety issues associated with diverting freight traffic to GL MTS
Environmental impacts/benefits compared to other modes
Shipper savings associated with GL MTS
Congestion effects of other modes in comparison to GL MTS
Competition effects of Maritime Transportation and rate increases in other modes
Shift in intermodal connections and transshipment costs (e.g., “full cost” studies – pavement damage, fuel, savings, crashes, etc.)
The value of shipping to states, cities, regions, etc.
Regional employment This project originally dealt with expanding an existing detailed GIS-based multimodal regional freight data reporting system named Midwest FreightView (MWFV). MWFV was developed in conjunction with the Upper Midwest Freight Corridor Study, a joint project carried out between the University of Wisconsin-Madison, The University of Illinois-Chicago, and The University of Toledo. The MWFV system was developed on a Citrix Metraframe installation at the Geographic Information Science and Applied Geographics (GISAG) Center at The University of Toledo using a specialized ArcView GIS application providing the user interface. Users can access MWFV with a web browser and Internet connection. All operations are carried out seamlessly on the Toledo Server—the users’ computers simply act as terminals. MWFV is presently undergoing a major transformation to accommodate the greater volumes of data added to the repository over the past three years and to improve the user interface in working with a more comprehensive database. This newly restructured delivery system will be introduced in a series of user workshops beginning in February, 2009. Presently the MWFV can be accessed through the Great Lakes Maritime Research Information Clearinghouse at http://maritime.utoledo.edu. In its present form users can take advantage of the GIS location-based query and selection capabilities as well as mapping functions to illustrate the linkage between freight movements to population characteristics and economic activity. In addition, work continues on the system to support advanced analysis capabilities such as routing, travel time and cost computations, location optimization and site selection. As a result, the system will continue to evolve into an effective tool for economic impact analysis and economic development planning using its capabilities in measuring accessibility to markets, locating bottlenecks in the network that

5
restrict freight flows, and identifying feasible locations for warehousing, manufacturing, retail and intermodal connection facilities. The scope of the project was expanded early in Phase I in response to recommendations from stakeholders in the maritime community during our June, 2006 Data Workshop in Detroit. In this meeting, participants effectively argued that the MWFV system would require a significant amount of training and practice; the system would be much more effective if it were expanded to include a more “user friendly” set of components consisting of prepared graphs, maps, bullet points, tables, and other features such as prepackaged reports in basic standard formats such as Annual Reports, Executive Summaries, and reports of studies completed by analysts who used data from the repository. The project team responded by working toward a system that will ultimately offer a variety of products and functions among varying degrees of expertise required by users. When fully developed, this system will include:
A detailed data repository for vessel movements, port functions, commodity flows, economic activities and environmental impacts, etc.
A GIS data viewer for advanced users to view and analyze a variety of data.
An information delivery site for maps, tables, graphics, text and other features in the form of the Atlas of Great Lakes Maritime Commerce.
Assembly of data and report information among different Geographic areas of impacts and jurisdictions (e.g., States and Provinces, Congressional districts, Cities, Counties, Ports, etc.).
A data exchange to support user inquiries and furnish information on demand.
Establishment of a communication link within the system (e.g., email access) for regional stakeholders to request specific information to be posted on the site.
Establishment of a system for data exchange to analysts in maritime agencies and organizations; also develop a site in the system for analysts within the region to publish the results of their analysis—particularly with regard to public policy issues of interest to the Great Lakes Maritime Industry.
Development of a library function in the form of a data clearinghouse that reviews and summarizes data from diverse sources--both public and commercial--and provide links for users to branch to from the site.
Development of a comprehensive centralized resource for providing linkages to additional data resources that do not necessarily represent core functions of the data
repository (e.g., links to taxes, fees, and other tangential data); this portion of the site would also serve as a gateway to maritime agencies (e.g., Coast Guard, USACE, etc.)
Acquisition of data continues to be a critical component in the development of the system. The project team has been able to acquire funds from additional sources to contribute to additional components of this comprehensive intermodal system. These sources include The U.S. Army Corps of Engineers, The Center for Freight Infrastructure Research and Education (CFIRE) at The University of Wisconsin-Madison, and The University of Toledo Intermodal Transportation Institute and University Transportation Center. As a result, data from a wider range of sources have continued to be added to the repository including:

6
Port/dock, lock locations—U.S. and Canada
Dock equipment, lock performance data—U.S. side only
Integrated Network—Great Lakes Waterway, Highway, Rail linked to Commercial Docks, Locks (Army Corps of Engineers)
Updated US Highway Network—Speed / Estimated Travel Times—linked to Rail Network through Intermodal Sites (BTS)
Economic Data:
Establishments and employment by NAICS classification—disaggregated and aggregated by county and MSA regions (Sources: BLS ES/202, County Business Patterns, Minnesota IMPLAN Group, Inc., Harris InfoData, Demographics Plus)
BEA gross domestic product by metropolitan area and by sector and by Year
Census of Agriculture (by county)
2000 Census of Population and Housing (including updates)
FAF Zones and Centroids
FAF2 OD Flows (National and Regional Scale)
ORNL National Rail Network
Geofreight database contents
Weather station data (NOAA, to approx. 60 Miles Inland)
Updated Canadian rail and highway networks
MARAD international vessel movements
Other data: Lake Carriers, etc. As work continues, the project team is making arrangements to carry out the following efforts and to acquire the following data:
Disaggregated FAF2 OD Flows (county-level—to be modeled)
USACE Foreign Traffic Vessel Entrances and Clearances
Transport Canada’s International Trade Data—Marine Mode
USACE Waterway Network Link Commodity Database
Highway Performance Data—Travel Time Reliability (ATRI)
Additional Port “Last Mile” Data
Updated ORNL National Rail Network
Dock/Terminal Data through USACE Master Docks Plus The project team has entered into a contract with the U.S. Army Corps of Engineers to assist in the development of a new system for collecting piers, wharves, and dock data for the new Master Docks Plus Database. The project team has been charged to develop and test new methods for data collection that include the use of satellite Imagery and Air Photos, Web-Based Data Entry and telephone surveys. Site visits are to be kept to minimum. These methods are to be tested at selected ports in the Great Lakes region. This parallel project

7
interfaces well with the current data collection efforts currently underway. This contract also allows the Toledo site to maintain collected data and to gain access to additional data for this data exchange system. An additional direction in data collection has focused on the compilation of aerial photography of Great Lakes docks and terminals and incorporating them into the database. Docks and terminals are spatially registered to the GIS database as a means to provide a backdrop for connecting the waterway, highway and rail networks into a comprehensive intermodal network. This “last mile” approach to establishing connectivity between modes provides a means for directly linking each mode within the system together in order to support the simulation transshipments of commodities and simulating wider flows over the entire transportation system. Other efforts by the project team are currently involving acquisition of AIS data to track vessel movements directly in the lakes. One of the charges to the project team early in this process was to find a means for long-term sustainability of the repository and information delivery system. The project team responded early in the process to this challenge by proposing that GLMRI and its partners in the industry consider the establishment of a Great Lakes Maritime Exchange (GLMX) in the form of a non-profit organization that would be financed through subscription fees by its partners in the industry. There are a number of such exchanges in the coastal regions of the United States and in British Columbia. These exchanges partner with one another through MISNA (Maritime Information Services of North America), an umbrella organization of non-profit 501(c)(6) maritime exchanges in the United States and British Columbia. Among the many functions specified by MISNA, data collection, management and analysis are identified as key components of maritime exchanges’ responsibilities in supporting maritime commerce. The project team has worked with MISNA and with the Lake Carriers Association to establish an exchange in the Great Lakes. The vision for the Great Lakes Maritime Information Delivery System has evolved over the course of the project to produce a multidimensional system that can support a wider array of functions that include data storage, delivery of prepared documents GIS functionality, and a clearinghouse of information for maritime commerce. The main objective originally envisioned for the project remains the same: to maintain long-term database and data distribution system that is available for port authorities, state transportation agencies, regional planning agencies and economic development organizations, as well as other interested decision makers and stakeholders within the region. The project team solicits feedback and suggestions for continuous improvement of the information delivery system; communication with the industry has been and will continue to be a major objective as this resource evolves and expands over the next several years.

8

9
Introduction The project described in this report represents the third phase of a long-term endeavor to develop and manage the Great Lakes Maritime Transportation Delivery System (GLMTDS). The GLMTDS is designed to serve as a comprehensive data repository and information clearinghouse in support of intermodal maritime commerce in the Great Lakes and St. Lawrence Seaway region. The system is further envisioned to serve as a resource for public policy decisions and for drawing the link between maritime freight movements, economic viability, and environmental quality throughout the Great Lakes and St. Lawrence Seaway. This web-based system is hosted at The University of Toledo (http://maritime.utoledo.edu). Figure 1 displays a snapshot of the home page of this system.
Figure 1. GL Maritime Research Information Clearinghouse Home Page In contrast to the previous phases of the project, a significant part of this phase of the project was geared toward implementation of a more formalized structured database that can provide data support for a variety of analyses dealing with vessel flows and commodity movements, evaluating the economic impact of great lakes shipping, computing vessel emissions, optimizing intermodal connections and short sea shipping. In addition, the project was expanded to develop prototypes for a wider array of features that will eventually include an atlas of maritime commerce, metadata and linkages to an extensive range of data sources, a secured ftp site for data delivery, and a publishing function for research in the Great Lakes Maritime Transportation System (GL MTS). Software development for expanded analytical features was also included in this project. Eventually these expanded features will build on the existing data distribution resource completed by the project team.
10
While efforts were devoted to development of a structured database and delivery system, much of the project team’s effort continued to be devoted to the assembly and management of data. In addition to the usual data acquisition and reformatting work performed by the project team, considerable “value added” features were also implemented which combine data from multiple sources into our data sets. An example is an integrated highway network that is being linked to the waterway network within the project database. This highway network is the synthesis of the Oak Ridge National Laboratory’s Center for Transportation Analysis’ highway network (ORNL Highway Network) and the FAF National Highway Planning Network (FAF NHPN). Each network contains a unique set of features and attributes not duplicated elsewhere; when these features are combined into a single network, they provide a detailed set of physical characteristics and travel information that can be adopted for a variety of planning and routing functions. In addition, the project team included speed limits to this integrated network that were not originally encoded. Eventually the data assembled into the repository will be combined with a wide range of support functions designed for the system. Many of these functions will incorporate analytical tools for evaluating intermodal transportation opportunities in the Great Lakes Region. Efforts began in Phase III to develop prototype software modules into the system that included:
modeling flows;
providing routing information;
computing access from origins to and destinations from ports;
displaying performance metrics for highways serving ports; and
performing site selection analyses for facilities (e.g., warehouses, distribution centers, manufacturing plants, etc.).
Software development for these functions are nearing completion in the next phase of the project; however some initial demonstrations of this software’s capabilities are presented in the appendix of this report based on work completed in Phase III (See Figures A12-A15). As mentioned in previous reports, the project team has continued to incorporate maritime data collected through GLMRI sponsorship into Midwest FreightView, a comprehensive GIS-based freight database for the Mississippi Valley Freight Coalition. Midwest FreightView places the project team in a unique position to incorporate the region’s maritime transportation system into a wider framework for intermodal transportation in the Midwest and beyond. This location-based GIS database will thus remain as the core delivery system for the maritime transportation database, but the project team is also expanding efforts to build a more comprehensive delivery system to include text, tabular, graphic and prepared maps for users. Many of these features will be included on the project site in the next phase of the project. It should be noted here that many of the functions reported here have been in the development stage; many prototype versions have been developed and tested. Those versions showing promise for data delivery have been added to the project web page. Others are still undergoing development and testing—they will be added to the GLMTDS in later phases of the project. At present, a number of features were added to the project site in Phase III. These include:

11
a directory of resources for Great Lakes Commerce;
documentation of the contents of the database;
access to a new update of Midwest FreightView, available through issue of a user ID and password from the project team (See project web page for contact information);
a new structured page for inclusion of maps, graphics, etc. built into the site;
a new structured page for viewing dock and terminal in the region; and
a new version of Midwest FreightView with updated network and economic data. As mentioned above, considerable effort was devoted to the continued acquisition and incorporation of data into the project database. Other examples of data collection include detailed and complete economic data that will now enable the project team to document patterns of activity among all of the economic sectors linked to freight movements. In conjunction with developing the maritime database, the project team has expanded their efforts in partnership with the Mississippi Valley Freight Coalition and the Michigan-Ohio University Transportation Center to draw input-output linkages among economic sectors throughout the region as a means to understand patterns of freight flows within the region. In addition, the project team began work with economists at The University of Minnesota Duluth to furnish data for an economic impact analysis of Great Lakes shipping on the regional economy. The system thus has begun to provide support for wider efforts dealing with estimated origins and destinations of freight movements and the role of maritime commerce in the regional economy. Dialog with the Great Lakes Maritime Industry
One of the first tasks undertaken by the project team was to establish a dialog with industry officials to identify data needs, priorities, and objectives for the project. To date, the Great Lakes Maritime Research Institute has hosted three Great Lakes Maritime Data Workshops to discuss data and information needs for government, commerce, education and other interests in the region. The first of these workshops took place in Detroit on June 9, 2006. The second was held in Toledo in conjunction with the ICHCA Short Sea Shipping Meeting on November 7, 2006. The latest workshop was also held in Toledo on October 26, 2007 during Phase III of the project. Representatives from the following organizations participated in these workshops:
US Army Corps of Engineers Lakes Carriers Association
American Great Lakes Ports Assn. Transport Canada
Canadian Chamber of Maritime Commerce Great Lakes Commission
US Maritime Administration St. Lawrence Seaway
NOAA Port of Duluth
Univ. Wisconsin-Superior (GLMRI) Detroit Port Authority
Univ. Minnesota Duluth (GLMRI) University of Toledo
Toledo/Lucas County Port Authority.

12
The dialog at each of the workshop sessions provided the impetus to keep the research team on task to continue efforts in data collection. The October 26, 2007 workshop produced recommendations regarding data quality standards and the need for continued expedited data collection through technological innovations (e.g., GPS, informatics, electronic forms, etc.). One result of this discussion was the initiation of a pilot project beginning in Phase III for AIS data acquisition in partnership with Great Lakes and Seaway Shipping Online, Inc. (GLSS), a designated a 501 (c)(3) nonprofit (incorporated in 2006). This organization has placed several AIS receivers at key points throughout the Great Lakes region and is currently planning to install additional sites. In addition, members of the project team have continued in efforts for the formation of a Great Lakes Maritime Exchange (GLMX), in partnership with the Lake Carriers Association and other stakeholders in the industry. This discussion has continued with the Lake Carriers Association and with the Maritime Information Services of North America (MISNA). The project team participated in a formal MISNA meeting in Cleveland on October 20th & 21st, 2008 where progress was made toward achieving this goal. As this organization progresses, the project team will have access to the AIS data through the GLMX. Data Collection and Development of the Project Web Site
Much of the data acquired in the first two phases of this project came from existing sources—both commercial and government. The data are currently being stored on designated server space at the GISAG Center at The University of Toledo. While the project team maintains a significant volume of data, not all of the repository’s contents are available on the project web site. Some data are proprietary and cannot be widely distributed. The economic data acquired in Phase III, for example, are available for analysis with partner institutions and joint projects, but cannot be displayed on the project web page. In other cases, the data must be reformatted for compatibility with the remainder of data in the repository and are not yet displayed on the project web page. The list of data currently residing in the repository are listed as follows with a notation of whether they are currently displayed on the project site.
1. Intrastate Employment patterns for each commodity type by SIC, NAICS, (displayed by counties and census tracts) (Demographics Plus, Inc. Business Counts Database) Available in MidwestFreightView.
2. Population and Socioeconomic data representing Market Demand within the region (displayed by counties and tracts) Available in MidwestFreightView.
3. ORNL CTA Highway and Rail networks (including RR interlining network) Available in MidwestFreightView.
4. Entire contents of North American Transportation Atlas (BTS) Available in MidwestFreightView.
5. Port Locations—U.S. (BTS National Transportation Atlas) Available in MidwestFreightView.
6. Dock Locations (Army Corps of Engineers) and attributes Available in MidwestFreightView.

13
7. Waterway Network—Great Lakes and Inland Waterways (Army Corps of Engineers) Base network Available in MidwestFreightView; prototype network connected to intermodal network not yet available on project web site.
8. FAF Zones and Centroids Available in MidwestFreightView.
9. Baseline FAF 2002 and provisional 2007 FAF2 commodity flows into and out of the Great Lakes Region (based on desire lines) obtained from the FHWA Freight Analysis Framework. Available in MidwestFreightView;
10. Employment by NAICS Classification among Counties and MSAs in Study Region (Source: Minnesota IMPLAN Group); Partially available in MidwestFreightView. Full database available for joint projects upon request from project team.
11. Lock Locations and lock performance statistics—U.S. side. In prototype format and not available on the project web site.
12. Weather Station Data (NOAA, to approx. 60 Miles Inland). Selected temperature data available in MidwestFreightView.
13. Updated US Highway Network that combines the HPMS and ORNL Network attributes and includes speeds and estimated travel times on links. Available in Midwest FreightView but not fully functional for modeling purposes.
14. Integrated Network—Great Lakes Waterway, Highway, Rail linked to Commercial Docks, Locks (Army Corps of Engineers). In prototype format but not available on project web site.
15. MARAD Annual Vessel Movements (1994-2004). Residing in repository but not displayed on project web site. Available for ftp upon request from the project team.
16. Import/Export Flows (Great Lakes East Coast and Gulf Ports). Residing in repository but not displayed on project web site. Available for ftp upon request from the project team.
17. Satellite Imagery/Aerial Photography of Dock Facilities Available on project web site.
18. Updated Mexican and Canadian Rail and Highway Networks Available in MidwestFreightView.
19. Vessel Inventory—Great Lakes Fleet Residing in repository but not yet displayed on project web site
Please refer to the Appendix for a set of maps prepared on MWFV that display a number of the data sets listed above. In contrast to earlier phases of this project, the work reported here focused on acquiring data on facilities and freight flows, and expanded into acquiring flow data in greater detail with respect to commodities, origins and destinations, vessel characteristics and weather data. The same challenges facing the project team in earlier phases continued to hamper efforts in acquiring data on commodity flows, vessel movements, and value of cargoes shipped through the system. The project team was successful in obtaining international vessel calls through the USACE Port Entrances and Clearances database, but had less success in tracking domestic freight movements.

14
It is anticipated that the project team’s proposed AIS data acquisition efforts for Phase IV of the project will help in overcoming these limitations in data acquisition. In other efforts, the USACE maritime transportation network was merged to the regional highway and rail networks at dock points in an effort to link freight movements and simulate cargo flows between modes at these key transshipment points. Given the significant number of nodes needed to connect these networks coupled with error checking and quality control, this integrated network is not yet ready to be displayed on the project web site. It is currently being tested in its prototype format. Landside networks were also linked to county centroids in an effort to provide opportunities to link freight movements between counties on the transportation network. As a result, this network will provide a framework for relating freight movements to the regional economy. The project team also developed a county-to-county distance and impedance table from the Oak Ridge National Laboratory’s Center for Transportation Analysis (ORNL CTA) that incorporates distances and impedances by mode (i.e., water, rail, highway) between every pair of counties within the US. A set of analytical tools measuring travel characteristics, accessibility, and location optimization accompanies this new data resource. See the appendix (Figures A12-A15) for maps produced using this software. Phase III also expanded efforts to acquire detailed and complete regional economic data for the system. In particular, the county-based IMPLAN ES202 data set was purchased and incorporated into the system. These data reside in a database outside of the MWFV data viewer. Given the tremendous volume of the database and disclosure agreements, only selected portions of the database have been added to the reporting system to date. However, additional data can be issued upon request to users in joint projects. One further development in Phase III of the project was the partnership of the project team with the U.S. Army Corps of Engineers Navigation Data Center to manage the MD+ Master Dock File for the Great Lakes. The project team has entered into a contract with the U.S. Army Corps of Engineers to assist in the development of data collection protocols for a new system for collecting piers, wharves, and dock data for the new Master Docks Plus Database. The project team has been charged to develop and test new methods for data collection that include the use of satellite Imagery and Air Photos, Web-Based Data Entry, and telephone surveys. Site visits are to be kept to minimum. These methods are to be tested at selected ports in the Great Lakes region. This work will continue during Phase IV of the current project. This parallel project interfaces well with the current data collection efforts currently underway. This contract also allows the Toledo site to maintain collected data and to gain access to additional data for this data exchange system. Progress was made in each of the categories listed below as originally outlined in the project proposal:
An expanded data delivery system that includes detailed regional economic data, weather and climatic data, dock and terminal facilities, commodity movements, intermodal connectivity, lock data and navigation facilities, movements, alternative transportation networks (including rail, highway and air);

15
An Atlas of Great Lakes Maritime Commerce on the project web site that includes maps for download in .pdf format (a limited number of maps have been displayed on the project web page—more will be added in later phases)
A data delivery function in the form of a secured FTP site; A sample of the progress in development of the project web page is the Great Lakes Maritime Atlas on the project site (see Figure 2). The project team’s student web designer incorporated aerial photography of each port into a regional map, where users can retrieve imagery from each port to activate the pop-up photos. In later phases, these photos will be enhanced with labels and additional support graphics. These images were the result of work involving the compilation of satellite imagery and/or aerial photography of GL docks and terminals and inserting them into the database. These images of docks and terminals were spatially registered to the GIS database as a means to provide a backdrop for connecting the waterway, highway and rail networks into a comprehensive seamless intermodal network. The USACE water network for the Great Lakes was then connected via transshipment links to the rail and highway networks at the docks and terminals on the lakes and the St. Lawrence Seaway system. This “last mile” approach was adopted to produce the seamless intermodal network for simulating commodity flows between modes in the system. The additional outcome of this process was the display of these images on the project web site in the atlas.
____________________________________________________
Figure 2. Facilities at the Port of Alpena highlighted in the Great Lakes Atlas
16
A Great Lakes Maritime Exchange
Another important development pursued in Phase III of the project is a Great Lakes Maritime Exchange to promote Maritime Commerce and regional economic development in the Great Lakes. One of the long-term objectives of this project is to develop a self-sustaining information delivery resource for the Great Lakes Region. Eventually this data repository and delivery system must be able to sustain itself financially as a member of the maritime industry in this region. To this end, the project team has been working with the Maritime Information Services of North America (MISNA) and the Lake Carriers Association in cooperation with GLMRI to establish a Great Lakes Maritime Exchange (GLMX) in the form of a non-profit organization that would be financed through subscription fees by its partners in the industry. There are a number of such exchanges in the coastal regions of the United States and in British Columbia. These exchanges partner with one another through MISNA, an umbrella organization of non-profit 501(c)(6) maritime exchanges in the United States and British Columbia. According to MISNA:
[these maritime exchanges] represent a broad cross section of maritime interests in their respective regions -- vessel owners and agents, ports, pilots, towboat companies, stevedores and terminal operators, admiralty lawyers, customs brokers and freight forwarders, ship repair firms, employer associations, insurance agencies, marine surveyors, maritime unions and oil spill response organizations, just to name a few. Collectively, over 8,000 private and public maritime businesses, agencies and associations are represented by MISNA [1].
Again, according to MISNA, the marine exchanges comprising this organization carry out a range of tasks that include:
Advance Vessel Schedule Information, including ETAs and ETDs Advance and real-time vessel movement monitoring (AIS) Actual Arrival and Departure Data Vessel Traffic Analysis Historical Vessel Movement Port and Terminal Utilization Studies Promote Maritime Interests Expert Maritime Analysis and Assistance with Regulatory Compliance [1].
The principal investigator on the project team was contacted by MISNA in June, 2006 with the proposal to begin a maritime exchange in the Great Lakes. Subsequently the principal investigator was invited to a MISNA National Meeting in Portland, Oregon in September, 2006. Project staff attended a second MISNA meeting in Cleveland in October, 2008.
One of the main functions for many of the maritime exchanges is real-time vessel tracking using the AIS System as shown in the Great Lakes/St. Lawrence Seaway system [2]. The advantages noted at their web site is that continuous tracking enhances safety, optimizes transit times through better traffic management, optimizes scheduling of lock passages, improves fleet management for ship owners and assists in navigation through the system, provides faster response times following accidents/incidents, provides data to support national security efforts, and assists in tracking hazardous cargoes [2].

17
It is further argued here that continuous tracking of vessels can provide a means for effective coordination of intermodal connections in short sea shipping. The system can also provide input functions for long-term vessel tracking such as with the Automated Secure Vessel Tracking System [3]. Long-term vessel tracking can provide useful data to track total vessel traffic over the entire system—including specific channels where dredging is needed or other navigation improvements are required. Continuous vessel tracking can also provide needed data to track vessel emissions and to demonstrate savings in overall emissions by diverting freight traffic from rail and highway to the lakes. It should be emphasized that maritime exchanges maintain strict confidentiality with their client organizations and do not disclose data among organizations without authorization. As discussed previously in this report, the same approach would be adopted in the Great Lakes. Thus a great lakes maritime exchange could serve as another partner with GLMRI and the maritime industry as a commercial resource and merits consideration.
Conclusion
The Great Lakes Maritime Information Delivery System has evolved over the course of the project to produce a multidimensional system that can support an array of functions that include data storage, delivery of prepared documents GIS functionality, and a clearinghouse of information for maritime commerce. Despite the evolving nature of this process, the main objective originally envisioned for the project remains the same: to maintain long-term database and data distribution system that is available for port authorities, state transportation agencies, regional planning agencies and economic development organizations, as well as other interested decision makers and stakeholders within the region. The combined vision of the Great Lakes Maritime Research Institute, the project team and our partners in the industry has led to the version of the Great Lakes Maritime Information Delivery System presented here. To date, the project has produced a multidimensional data gateway system that will ultimately support the following functions:
A detailed data repository for vessel movements, port functions, commodity flows, economic activities and environmental impacts, etc.
A GIS data viewer for advanced users to view and analyze a variety of data
An information delivery site for maps, tables, graphics, text and other features in the form of the Atlas of Great Lakes Maritime Commerce
A data exchange to support user inquiries and furnish information on demand.
Assembly of data and report information among different Geographic areas of impacts and jurisdictions (e.g., States and Provinces, Congressional districts, Cities, Counties, Ports, etc.)
Establishment of a communication link within the system (e.g., email access) for regional stakeholders to request specific information to be posted on the site. This function was agreed upon as essential if the information delivery was to be successful
Establishment of a system for data exchange to analysts in maritime agencies and organizations; also develop a site in the system for analysts within the region to publish the results of their analysis—particularly with regard to public policy issues of interest to the Great Lakes Maritime Industry

18
Development of a library function in the form of a data clearinghouse that reviews and summarizes data from diverse sources--both public and commercial--and provide links for users to branch to from the site.
The resulting system discussed here is designed provide the Great Lakes maritime community with a comprehensive centralized resource for data and information. However, it should be emphasized that this project represents a single phase of a continued work in progress; much of the project team’s efforts to date have been devoted to acquisition, reformatting, error checking, and incorporating the resulting data into the data repository. At the same time, the project team was also devoting considerable effort to development of the system architecture by building and testing several prototype databases. The results of these efforts are seen on the current version of the information delivery system launched in September, 2008. Additional efforts have also been devoted to the development of a set of analytical tools in the form of stand-alone software that will be incorporated into Midwest FreightView in later phases of the project. Phase III of this project represented the beginning of a shift in emphasis from data acquisition to data management and delivery to the wider community. As this project continues, more emphasis will be devoted to posting more detailed data and “valued added” forms of data that are not available elsewhere. Analytical functions will be added to the GIS system. More maps, tables and graphics will be added to the atlas page of the project site. As these tasks are completed, the project team will continue solicit feedback and suggestions for improvements of the system. Phase III of this project has also focused on seeking additional partners such as USACE, MISNA, GLSS, CFIRE, and UTITI (University of Toledo Intermodal Transportation Institute) to support the data collection efforts and identify expanded opportunities for the acquisition of a wider array of data. Continuous improvement of the information delivery system will remain a major objective as this resource evolves in the coming months and years. The project team will strive to maintain an open dialog with the members of the industry to assure success in this endeavor. Our dialog has also expanded to a wider audience through the dissemination of results shown in the references section of this report.

19
References Cited
[1] Maritime Information Service of North America (MISNA), (2004) (Internet), History of MISNA, (cited September, 2006), http://www.misnadata.org/content/history.php?m=15.
[2] Great Lakes/St. Lawrence Seaway System (SLSDC and SLSMC), (2006) (Internet), AIS Project (cited September, 2006), http://www.greatlakes-seaway.com/en/navigation/ais_project.html.
[3] Maritime Information Service of North America (MISNA), (2006) (Internet), Automated Secure Vessel Tracking System (ASVTS), (cited September, 2006), http://www.asvts.org
Dissemination of Results: Phase I-Phase III
Adams, T., S. Van Hecke, E. Wittwer, D.Szymkowski, and P.S. Lindquist. 2007 “Regional Approach to Improving Freight Transportation”, Transportation Research Board 86th Annual Meeting , January 23, 2007
Lindquist, P.S., 2008. “Recent Developments The Great Lakes Maritime Information Delivery System“, Mid-Continent Transportation Research Forum, Madison, Wisconsin, August, 2008. Lindquist, P.S., 2008. “A comprehensive Intermodal Transportation Network for Great Lakes Commerce”, Association of American Geographers Annual Meeting, Boston, Massachusetts, March, 2008. Lindquist, P.S., C.J. Wolosz, D. Singer and M.A. Vonderembse. 2007. “From Data to Markets to Shipping Opportunities”, Great Lakes Maritime Research Institute, University of Toledo Intermodal Transportation Institute, October 26, 2007. Lindquist, P.S., 2007. “The Great Lakes Maritime Information Delivery System”, in Research
on Great Lakes Maritime Commerce Session, 50th Annual Conference on Great Lakes Research, May 31, 2007, University Park, Pennsylvania.
Lindquist, P.S., 2007. “The Great Lakes Maritime Information Delivery System“, Association of American Geographers Annual Meeting, San Francisco, California, April 19, 2007. Lindquist, P.S., 2007. “The Great Lakes Maritime Information Delivery System“, Great Lakes
Martime Community Day Afternoon Plenary Session, Cleveland, Ohio, February 28, 2007 (Invited Presentation).
Lindquist, P.S., 2006. “Expanding Regional Freight Information Resources for the Upper
Midwest: The Great Lakes Maritime Information Delivery System”, Great Lakes Maritime Research Institute Affiliates Meeting, October 7, 2006, Duluth, MN.
Lindquist, P.S., 2006. “Progress Report: The Great Lakes Maritime Information Delivery
System”, Joint Conference on the Great Lakes: From Data to Markets to Shipping Opportunities, GLMRI, UT ITI, ICHCA International, Toledo, Ohio, November 7, 2006.
Schafer, S.E. 2008. Creating a Think Tank, Seaway Review 36(3): 54-55.

20
APPENDIX
Sample of Map Output from Midwest FreightView Great Lakes Maritime Database

21
Example 1: Basic Mapping Functions
Figure A.1 Initial display for the user Interface in Midwest FreightView.
Figure A.2 User activates pull down menu to open the highway network in the Great Lakes Region.
Figure A.3 MWFV provides users with the ability to highlight specific features in the display. In this case, interstate highways are highlighted according to projected 2010 Average Annual Daily Truck Traffic (Source: FAF).
22
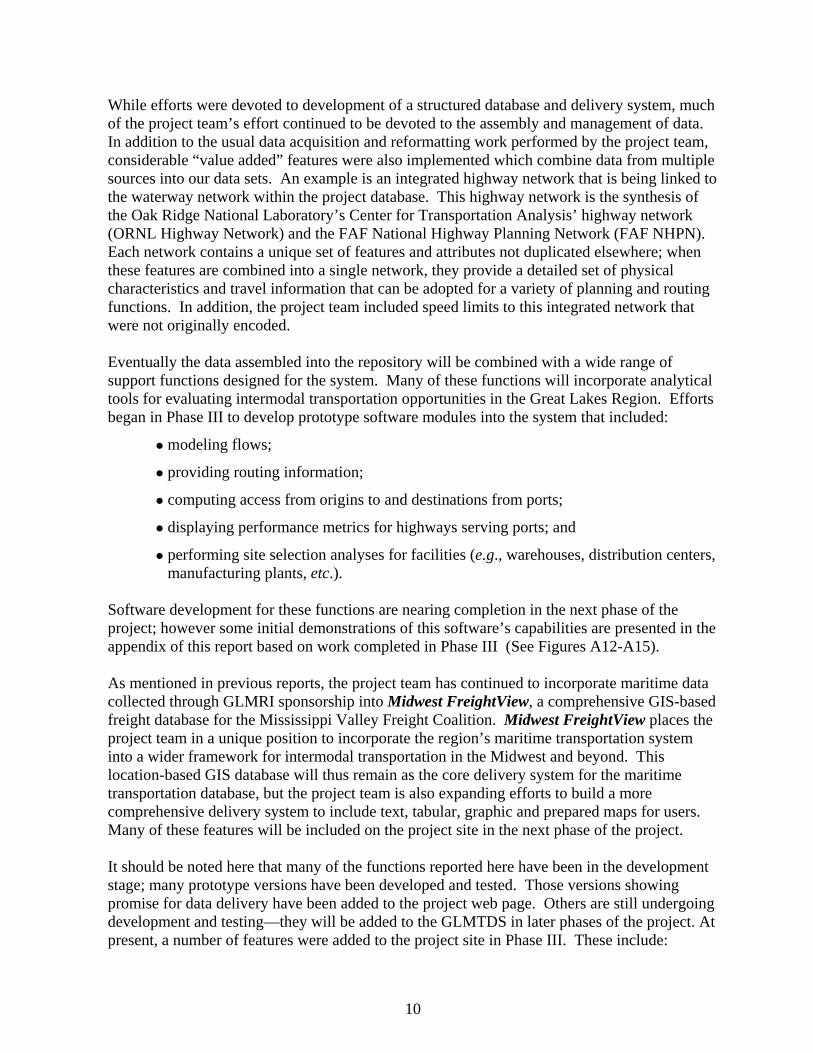
Figure A.4 MWFV displays integrated waterway network connecting docks/terminals, navigational locks, and waterway routes in the Great Lakes.
Figure A.5 A wider view of continental-scale waterway and highway networks connected to the Great Lakes Ports.
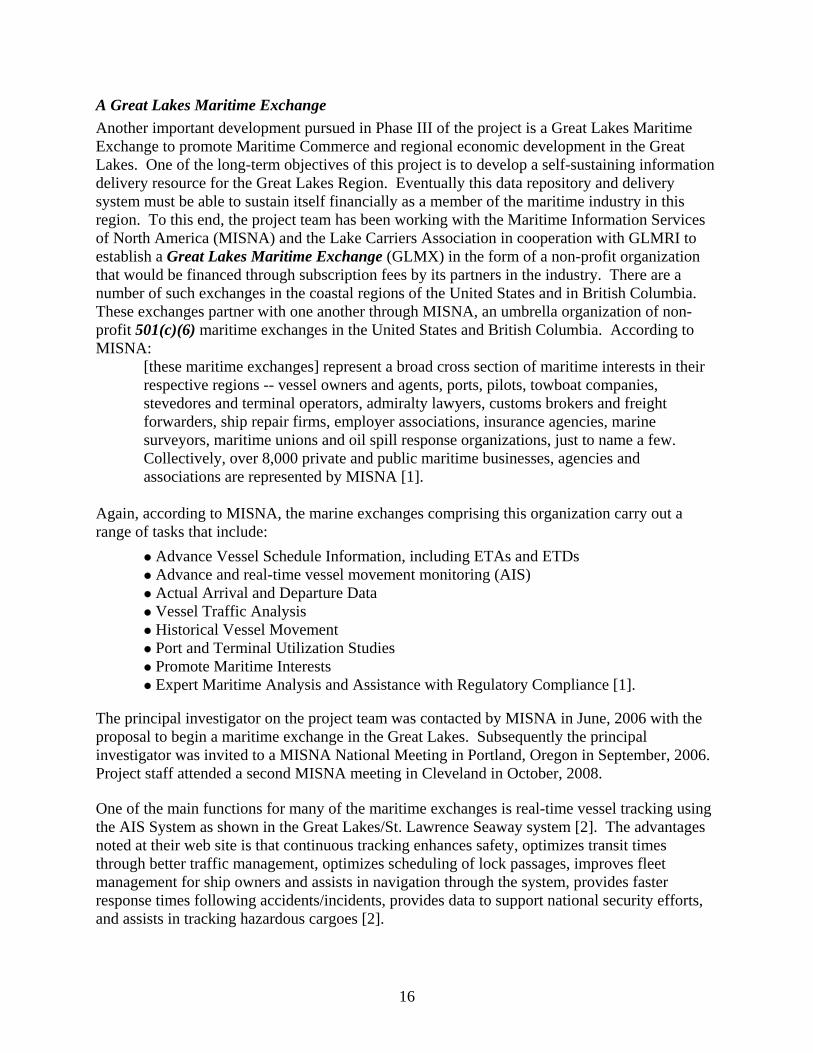
Example 2: Integrating the Waterway Network to the Landside Rail and Highway Networks at Terminals
Figure A.6
Aerial Photograph and GIS Data Layers: Port of Duluth / Superior
Superimposed Highway, Rail, Waterway and Dock Connections in Intermodal Network; Docks displayed by commodity
23
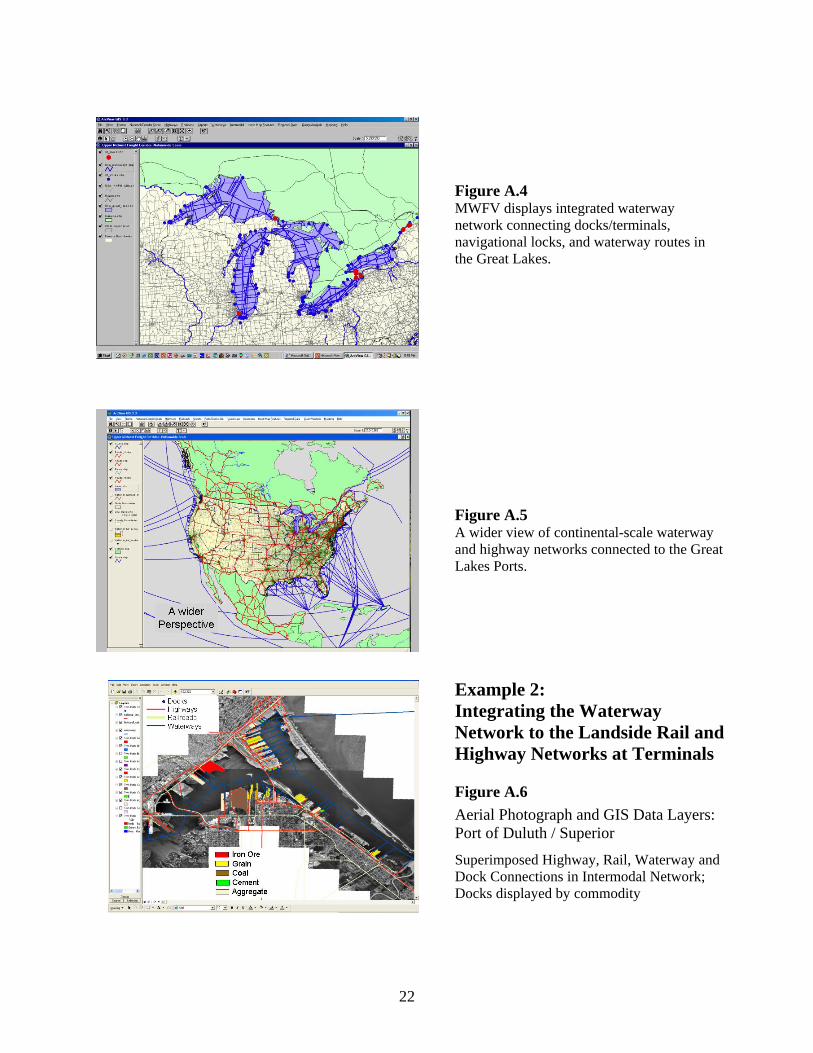
Example 3: Linking the Great Lakes System to the Regional Economy.
Figure A.7
User activates pull down menu to open the regional employment database. In this case, the user is opening employment data by census tract.
Figure A.8
MWFV displays a dot distribution map of cement manufacturing employment and Crushed Limestone Production alongside Great Lakes dock locations.
Figure A.9 MWFV displays a dot distribution map of Lumber and Building Material Wholesaler employment alongside Great Lakes dock locations—a potential market for imported building products.

24
Figure A.10
MWFV displays the distribution of coal mining employment and fossil fuel electric power generation within the Midwest superimposed on the rail network.
Figure A.11
MWFV now displays the distribution of coal mining employment and fossil fuel electric power generation within the Midwest and the flow of coal over the waterway system.
Figure A.12
MWFV now displays the results from newly-developed data analysis software. The map at the left displays the density of wholesale trade activity in the US by county. This density map shows the proximity of wholesale distributors relative to each county weighted by employment. Those regions in the darkest colors have the greatest accessibility to wholesale trade in the U.S.

25
Figure A.13
MWFV now uses the same software to display the density of heavy equipment manufacturing by county. This density map shows the proximity of heavy equipment manufacturers relative to each county weighted by employment. Those regions in the darkest colors have the greatest accessibility to this sector in the U.S.
Figure A.14 Accessibility from Great Lakes Ports to National Market
Another example of output from recently developed data analysis software in MWFV. Travel Time to US households from their nearest Great Lakes Ports by Highway. Figure A.15 Accessibility from Great Lakes Ports to National Manufacturing
Another example of output from recently developed data analysis software in MWFV. Travel Time to manufacturers from their nearest Great Lakes Ports by Highway.