existing self-employment: an analysis of asian immigrant-owned small businesses
TRANSCRIPT

ABSTRACT. Part of the uniqueness of the immigrant Asianbusiness community in the U.S. lies in the fact that manyamong the highly educated pursue self-employment insmall-scale, low-yielding retail and personal service fields.This study analyzes owner departure for a nationwide sampleof small businesses owned by Asian Indian and Filipinoimmigrants and a comparison group of Asian nonimmigrantfirm owners. Controlling for firm and owner traits, highlyeducated Asian immigrant owners are more likely than othersto exit self-employment over the 1987–1991 period; exit fromtraditional fields (retail and personal services) is pronounced.These exit patterns do not typify the comparison group.Findings are consistent with the hypothesis that self-employ-ment is often a form of underemployment among Asian immi-grants.
1. Introduction
The small business creation process is shaped bya complex push/pull dynamic. Many who pursueself-employment are lured (pulled) by attractiveopportunities and prospects of rising earnings.Others are pushed into self-employment, notbecause small business operation is their preferredcareer path, but because their access to good jobsis blocked by barriers including lack of educa-tional credentials, inappropriate work experience,and limited facility of the English language. Rapidgrowth in the number of small businesses ownedby Asian immigrants residing in the United Statespartially reflects the attractiveness of self-employ-ment as a career choice. Often, however, self-
employment offers meager returns, but it is takenup, nonetheless, because Asian immigrantsconfront poor labor force alternatives.
This study analyzes self-employed Asianimmigrants who have been pushed as well aspulled into the U.S. small business sector. Beingpushed into self-employment leads to subsequentbehavior patterns among business owners thatdiffer sharply from those who were pulled. Whilethe push dynamic creates business owners seekingto exit self-employment, pull factors producegreater firm longevity and higher profits. Poorutilization of owner human capital and lowearnings often typify firms of owners pushed intoself-employment. These effects are explored bycomparing the performance of Asian immigrant-owned small businesses to that of Asian non-immigrant firms.
Particularly successful entrepreneurs tend to behighly educated, their firms are well capitalized,and they are overrepresented in the growth sectorsof the small business world, the skill-intensiveservice industries, for example (Bates, 1990). Partof the uniqueness of the immigrant Asian businesscommunity in the U.S. lies in the fact that manyamong the highly educated pursue self-employ-ment in small-scale, low-yielding personal serviceand retail fields. Self-employment most oftendegenerates into underemployment in these linesof business. As recently as 1960, most self-employed Asian Americans worked in threetraditional fields – restaurants, grocery stores, andlaundries (Bates, 1987). While nonimmigrantAsian entrepreneurs have moved away from theselines of business, they are still major areas ofconcentration in the Asian immigrant communityof small firms (Bates, 1997).
Exiting Self-Employment: An Analysis of Asian Immigrant-Owned Small Businesses
Timothy Bates
Small Business Economics 13: 171–183, 1999. 1999 Kluwer Academic Publishers. Printed in the Netherlands.
Final version accepted on June 29, 1999
Wayne State UniversityCollege of Urban, Labor & Metropolitan Affairs3198 FABDetroit, MI 48202U.S.A.E-mail: [email protected]

2. Evidence of self-employment success 2. among Asian immigrants is lacking
Success measures of self-employment amongAsian immigrants have been analyzed in severalinstances: Boyd (1991) studied their earnings fromself-employment and Bates (1994a) investigatedfirm survival patterns from 1987–1991. Neitherstudy supported the stereotype of business success.Empirical studies in this field have mostcommonly sought simply to explain variations inthe rates of self-employment that immigrantgroups exhibit (Borjas, 1986; Evans, 1989; Kim,Hurh, and Fernandez, 1989). Studies are oftendescriptive (Bonacich and Light, 1988; Min,1986–1987; Fratoe, 1986), focusing upon ownertraits as well as the operating environment of theimmigrant firms.
Paucity of analytical empirical underpinningshas coexisted with the emergence of numerousstylized facts explaining patterns of self-employ-ment among Asian immigrants. Bonacich andLight (1988) imply that Korean immigrants havebeen successful pursuing self-employment in LosAngeles, where their penetration of small-scaleretailing has grown rapidly since the 1970s. Highself-employment rates and rapid expansion ofsmall business ownership are put forth as evidenceof success. Citing growth of immigrant enclaves,Borjas (1990) argues that entrepreneurial oppor-tunities for immigrants have increased in the pasttwo or three decades. Self-employment, finally, iswidely viewed as a strategy for escaping labormarket discrimination (Moore, 1983; Light, 1972).Kossoudji, for example, claims that Asian immi-grants lacking English fluency potentially facediminished labor market prospects, but they avoidearnings losses by pursuing self-employment(1988).
The conventional wisdom of Asian immigrantsuccess in self-employment rests, in fact, on aweak empirical foundation. One clearcut fact,however, is the rapid growth of self-employmentamong Asian Americans. U.S. Bureau of theCensus statistics document growth trends amongAsian-owned small businesses: numbers of firmsoperating nationwide rose from 187,700 in 1982to 355,300 in 1987 (1991); this growth was immi-grant-driven (Bates, 1994a). Using nationwideCensus Bureau data, Borjas (1986) found that
self-employed Asian immigrants reported highermean annual incomes than any other raciallydefined group – immigrant or nonimmigrant, self-employed or salaried. Fratoe (1986) analyzed theearnings of the fifty largest groups reporting asingle ancestry in the decennial census of popu-lation: two immigrant-dominated groups – AsianIndians and Filipinos – ranked first and fourth inmean self-employment earnings.
Sociologists often infer Asian immigrantsuccess in the small business realm from suchstatistics (Yoon, 1991; Waldinger, 1986), buteconomists have been more circumspect. Borjas(1990), after noting that self-employed immigrantmen earn about 48 percent more than salariedimmigrants, cautions that this earnings pattern isnot evidence of success in small business. Instead,Borjas finds that the self-employed, whethernatives or immigrants, have somewhat lowerincomes than demographically similar salariedworkers. Rapid self-employment growth is notnecessarily motivated by the attractiveness ofowning a small business. Increasing self-employ-ment propensities clearly do suggest a shift inrelative labor-market opportunities betweenemployee and self-employed sectors. But thedeterioration of the former (and not the attrac-tiveness of the latter) can encourage expandedsmall business ownership. Borjas (1994) notes a“structural shift in the rate of wage convergencefor Asian immigrants who migrated after 1970”(p. 1682). Asian immigrants aged 35–44 whoarrived in the U.S. between 1985 and 1989, forexample, faced a wage differential of –30.6percent in comparison to natives of the sameethnic background. This is over twice as large asthe corresponding wage differential reported by1965–1969 arrivals in the 1970 decennial census(Borjas, 1994). Poor opportunities for salariedemployment are clearly consistent with growingself-employment propensities.
3. Firm profitability and owner factor 3. endowments
This study analyzes small firms operating in 1987that were created by (or entered into) by theircurrent owner since 1979. Over 70 percent of allAsian-owned small businesses active in 1987, aswell as nearly 50 percent of all small firms, were
172 Timothy Bates

started during this time span. The data sourceutilized in the following analysis is theCharacteristics of Business Owners (CBO) database, which was complied in 1992 by the U.S.Bureau of the Census. The firms described beloware representative of all small businesses activein the U.S. that 1) generated gross revenues of atleast $5,000 in 1987, and 2) filed a small businessfederal income tax return (sole proprietorship,partnership, or corporate). The CBO data base isdescribed in detail in Bates (1997) and Nucci(1992).
Asian immigrant self-employment in the U.S.is dominated by five groups – Asian Indian,Filipino, Korean, Chinese, and Vietnamese – andmean self-employment earnings vary widely;Asian Indians possess the highest mean level ofeducational attainment among the self-employedand generate the highest earnings, whileVietnamese are in last place in both categories.This study focuses heavily upon the two highestearning Asian immigrant business-owning sub-groups – Asian Indian and Filipinos. Analysis oftheir self-employment income reveals that returnsfrom small business trail those of nonminority andAsian nonimmigrant comparison groups. In fact,African Americans – characterized as earning verylow self-employment returns by Fratoe (1986) –are shown to generate higher self-employmentreturns than Asian immigrant groups in a com-parison of firms started during the 1979–1987 timeperiod.
Two important pieces of context are illustratedin Table I. First, Asian immigrants entering self-employment invest, on average, much more ownerhuman and financial capital into their ventures that
nonminorities. Secondly, great heterogeneity existsacross self-employed groups, with Asian Indiansdevoting the largest investments to self-employ-ment, while Vietnamese invest the least financialcapital, on average. Because the high-earning self-employed Asian immigrant groups are more likelyto be driving the stereotype of small businesssuccess than low-income groups such asVietnamese, the following analyses of self-employment focus heavily on Asian Indian andFilipino small business owners.
Abundant owner human capital and financialcapital resources are advantages for young smallbusinesses, but they are potentially counterbal-anced by the limited English fluency that limitsoccupational choice for many Asian immigrants.Levels of English fluency vary enormously: over70 percent of Asian Indian immigrants residingin the U.S. reported that they spoke English verywell; only 20.8 percent of recent Vietnameseimmigrants were similarly highly proficient inEnglish. The majority of Filipino immigrants wereproficient in English. The high levels of profi-ciency reported by Asian Indians and Filipinosreflect the fact that English is commonly spokenin both countries, “particularly among the highlyeducated who have dominated recent immigrationfrom India and the Philippines” (U.S. Commissionon Civil Rights, 1988, p. 57).
Mean before-tax profits reported by immigrantAsian Indian/Filipinos, nonimmigrant Asians, andthe nonminority small business group in 1987were $14,088, $17,835, and, $15,838, respectively(Table II). Table II’s profitability analysis is basedupon the same general sampling frame as Table I:all firms filed a 1987 small business federal
Exiting Self-Employment 173
TABLE ITraits of selected groups of firms nationwide that were started between 1979 and 1987, by owner race, ethnicity
Nonminorities Immigrants only
All Asian Asian Koreans Vietnameseimmigrants Indians
Mean total firm capitalization at startup (equity and debt) $31,939 $53,562 $70,517 $54,107 $27,813
Percent of owners who are college graduates 0.37.7% 0.57.8% 0.82.8% 0.50.8% 0.23.7%Percent of owners having less than 4 years of
high school 0.10.4% 0.11.4% 00.3.0% 00.4.8% 0.17.1%
Source: CBO data base.

income tax return and all generated gross revenuesof at least $5,000. Asian nonimmigrants (excludedfrom Table I) are added as a comparison group.Recall that all of these are young firms, and manyof the owners pursued self-employment on apart-time basis.
Most of the firms under consideration operatedeither in the retailing or service fields. Retailingis noteworthy for its consistently low mean profits,which coexist with above average owner laborinput hours and financial capital investments intheir firms. Reported profits are lower and ownerhours of work in the firm are, in fact, higher inretailing than in any other major industry group,and this pattern holds for nonimmigrant Asian-and immigrant Asian-owned small business gen-erally, as well as the Asian Indian/Filipino-ownedfirms specifically (Bates, 1997). Services show theopposite pattern – higher profits and fewer ownerhours – for all owner groups. A firm profit perhour of owner labor input calculation provides acrude mean profitability measure illustrating thepronounced industry differences:
Retail Service
Asian Indian/Filipino immigrant $4.49 per hour $8.97 per hour
Nonimmigrant Asian $6.60 per hour $11.40 per hourNonminority $5.66 per hour $9.63 per hour
Owners of firms in service industries are moreoften college educated than those in retailing, andopportunity cost considerations alone suggest thathighly educated owners are likely to generate
greater reported profits than the less educated. Theprofitability figures reported below abstract fromthe phenomenon of part-time self-employment byexamining full-time (2000+ hours worked in thefirm) owners only, and they are disaggregated byowner educational background.1 Attributing a tenpercent opportunity cost to the owner’s startupinvestment of equity capital is one way to separateout returns to capital and labor. Resultant profits,net of equity opportunity costs, show the followingaverage returns to the labor time of ownersworking full-time in their firms:
College educated No college
Asian Indian/Filipino* $5.63 per hour $3.59 per hourNonimmigrant Asian $7.56 per hour $5.71 per hourNonminority $7.52 per hour $6.39 per hour
Corresponding figures for various other groupsidentically sampled and analyzed are:
Korean/Chinese* $6.02 per hour $3.40 per hourAfrican American $6.49 per hour $4.85 per hour
* Immigrants only.
Studies of Asian immigrant-owned smallbusiness frequently cite the utilization of unpaidfamily labor as a cause of the greater viability ofthese firms, relative to small businesses generallyand African Americans specifically (Fratoe, 1989;Min, 1986–87; Boyd, 1991). Use of family laboris not directly observable in CBO data, but thisphenomenon, if present, would widen the aboveprofit per hour differentials if family labor inputwas used in the applicable denominators.
174 Timothy Bates
TABLE II Traits of Asian and nonminority owners and the small businesses they operate (firms formed 1979–1987 only): mean values
Immigrant Nonimmigrant Asian Indian/Filipino Asian Nonminority
1987 before-tax profits, all firms $14,088 $17,835 $15,8381987 before-tax profits, owners worked at least 2000 + hours $19,760 $23,260 $21,611Annual owner labor input hours, full-time owners 2,958 2,900 2,832Equity capital, full-time owners $37,870 $28,860 $15,560Full-time owners: profits ÷ hours worked in 1987 $6.68 $8.02 $7.63Full-time owners: profits, less 10% opportunity cost of
equity capital ÷ hours worked in 1987 $5.39 $7.02 $7.08
Source: CBO data base.

A major strain of literature coexisting withstudies claiming Asian immigrant small businessviability argues that blocked mobility often forcesimmigrants to pursue self-employment. Waldinger,Aldrich, and Ward (1990) emphasize the interplaybetween situational constraints on job opportuni-ties and group characteristics of Asian immigrantsthat encourage self-employment. Kim, Hurh, andFernandez (1989) argue that American employersoften do not recognize the education and workexperience that immigrants have accumulated intheir native countries. Min (1984) claims thatcollege-educated Koreans often confront seriouslanguage barriers that hamper their employmentprospects, especially in jobs requiring collegeeducation and contact with the public. Waldinger(1986) has observed that Asian immigrants pursueself-employment less as a matter of preference andmore as a matter of blocked mobility: impedimentsto more attractive alternatives include poorEnglish language facility and foreign credentialsthat are viewed skeptically by potential employers.The self-employment behavior of Asian immi-grants often reflects their limited alternatives.Professionals with specific skills – pharmacists,for example – are often unable to pass applicablelicensing exams because of their limited Englishfluency. “Blocked mobility is a powerful spur tobusiness activity” (Waldinger, Aldrich, and Ward,1990, p. 32).
Thus blocked, the abundant human capitaland financial resources of Asian immigrants comeinto play, making small business ownership anoption for many (Bates, 1997). The self-employedamong Asian Indians and Filipinos appear to beless constrained than other immigrant Asians intheir choice of self-employment versus wagelabor. Being highly educated as a group – overtwice as likely as non-Hispanic, native-bornwhites to have college degrees – they are notlimited to the same extent as the less educatedgroups. The majority of Asian Indian and Filipinoimmigrants are fluent in English. Strong in classresources and English fluency, Asian Indians andFilipinos are expected to be the Asian immigrantgroups most likely pulled (not pushed) into self-employment; blocked mobility is expected to beweaker than it is among the less fluent immigrants.Yet the evidence of low self-employment returns(Table II) suggests that immigrant Asian
Indian/Filipinos may nonetheless be pushed intosmall business ownership.
4. Asian immigrant self-employed: 4. delineating push from pull
Absent blocked mobility, what sorts of businesseswould most likely attract Asian Indian/Filipinoimmigrant entrepreneurs well endowed with finan-cial and human capital resources? Bates (1997) hasshown that high net worth individuals are dispro-portionately drawn to the most capital-intensivelines of small business startup, manufacturing andwholesaling. But the Asian Indian/Filipino firmsdescribed in Table II are much less likely thancomparison groups to operate in these fields: 3.9percent operate in manufacturing/wholesaling,versus 7.1 percent and 6.8 percent for nonminori-ties and Asian nonimmigrants. College graduates(Bates, 1997) are disproportionately drawn toskill-intensive service2 self-employment, otherthings equal, and the highest yielding subfield inthis group is professional services. Among youngAsian Indian/Filipino firms operating in 1987,46.2 percent were in skill-intensive service fields,versus 36.4 percent among Asian nonimmigrantself-employed. Finally, Asian Indians/Filipinos areheavily concentrated in the lowest yielding self-employment fields – retailing and other services– where 38.0 percent of the young firms are found,versus 38.8 percent of Asian nonimmigrants.Among owners of the young firms under consid-eration (1979–1987 startups), the rough equalityin proportions of each group self-employed in thelow-yielding retailing and other services industriesmust be viewed in the context of owner humancapital resources: 76.6 percent of the AsianIndian/Filipino owners are college graduates,versus 45.4 percent of the Asian nonimmigrants.
The strong educational backgrounds of AsianIndian/Filipino owners are consistent with theirheavy overrepresentation in the highest-yieldingself-employment field, professional services,where 27.4 percent of their firms operate. Highlyeducated persons self-employed in high-yieldingfields: this is the portrait of persons pulled intoself-employment by attractive opportunities. The38.0 percent of self-employed Asian Indian/Filipino owners whose firms operate in retailingand other services, in contrast, are hypothesized
Exiting Self-Employment 175

to be the ones most apt to be pushed into self-employment by blocked mobility considerations.The two lowest yielding fields – retailing andpersonal services – are expected to harbor thehighest frequency of owners experiencing blockedmobility.
Studies of the labor market experiences ofAsian immigrants indicate that their earnings riseas their years of residence in the United Statesincrease (U.S. Commission on Civil Rights, 1988;Borjas, 1994; Kassoudji, 1988). Labor marketbarriers, it seems, decline over time reflecting theopening of broader opportunities to Asian immi-grant labor force participants. If Asian immigrantsare held in self-employment by a paucity ofopportunities and if opportunities expand overtime, then the circumstances dictating self-employment would gradually alter. Since self-employment was shown often to be a low-yieldingendeavor (Table II), then opportunity-cost con-siderations suggest that employee status would bethe logical choice in an environment of expandinglabor force opportunities. This is really a hypoth-esis, and it is tested in Tables III and IV, whichcompare owner longevity in self-employment forAsian Indian/Filipino immigrants and a compar-ison group of self-employed nonimmigrant AsianAmericans. A closely related hypothesis is thatAsian Indian/Filipino immigrants are most likelyto abandon self-employment in low-yieldingfields, and most likely to remain self-employedin high-yielding industries; i.e., those pushed intoself-employment are more likely to exit than thosewho were pulled into the realm of small businessownership. Firm and owner characteristics areused in the Tables III and IV logistic regressionexercises to explain owner pursuit of self-employ-ment over the 1987–late 1991 time period, delin-eating exiting owners from those remainingself-employed.
Over the period from 1987 to late 1991, morethan 25 percent of the small business owners ofrecord in 1987 among Asian Indians and Filipinosand nonimmigrant Asian Americans departedownership of their firm. What sorts of ownersclung to self-employment? How did these patternsdiverge for Asian Indian/Filipino immigrants asopposed to persons of Asian ancestry who wereborn in the U.S.? Past econometric studiesexplaining small business longevity identify
greater owner investments of human and finan-cial capital as factors that are strongly relatedpositively to small business survival chances(Holtz-Eakin, Joulfaian, and Rosen, 1994; Bates,1990). The well-capitalized firm started up by acollege graduate is more likely to remain inoperation than a poorly capitalized firm headed bya less educated owner. Among the Asian Indian/Filipino firms under consideration, mean startupcapital was $61,320 and 76.6 percent of the ownerswere college graduates; corresponding figures forthe nonimmigrant Asian comparison sample were$41,411 and 45.4 percent, respectively.
In the logistic regression exercises, quantity ofowner human capital is measured by owner hoursspent working in the business, as well as maritalstatus. Married persons living with their spousesare expected to benefit from the availability offamily labor, which potentially increases laborinput quantity. Human capital quality is proxiedby owner educational background and owner age,which is a broad measure of work experience.Financial capital is measured as the sum of equityand debt capital invested in the firm at startup.Applicable demographic traits include ownergender. Binary variables are introduced to identifythree types of small businesses: 1) traditional(proxy for blocked mobility), 2) skill-intensive(proxy for opportunity-motivated entry), and3) capital-intensive (manufacture and wholesale).The excluded industry groups include construc-tion, transportation and miscellaneous services.The youngest firm groups are identified to controlfor impacts of firm age upon longevity. Finally,firms selling in the general market are delineatedfrom those serving a minority clientele: Asianimmigrant firms that sell to nonminorities largelyhave been identified in the literature as moreviable (Bates, 1994a) and less viable (Evans,1989; Waldinger, Aldrich, and Ward, 1990) thanthose serving a predominantly minority clientele.Exact definitions of relevant explanatory variablesare summarized below:
Education 2: For owners completing four years ofhigh school, education 2 = 1, otherwise 0.
Education 3: For owners completing at least onebut less than four years of college (and thosenot attaining a bachelor’s degree), education3 = 1; otherwise 0.
176 Timothy Bates

Education 4: For owners awarded a bachelor’sdegree, education 4 = 1; otherwise 0.
Education 5: For owners who attended graduateschool, education 5 = 1; otherwise 0.
Immigrant: For owners born abroad, immigrant =1; otherwise 0.
Owner age: Age in years, as of 1987.Owner age sq.: Squared value of owner age.Traditional firm: For firms operating in retailing
or personal service fields, traditional firm = 1;otherwise 0.
Skill-intensive firm: For firms operating in pro-fessional services, business services, or finance,insurance, real estate fields, skill-intensive firm= 1; otherwise 0.
Capital-intensive firm: For firms operating inmanufacturing or wholesaling, capital-intensivefirm = 1; otherwise 0.
Labor input: Number of hours during the 1987calendar year spent by the owner working in therelevant small business, divided by 100.
Capital: The log of the sum of debt and equity
capital used to start or become owner of thebusiness.
Gender: For male owners, gender = 1; otherwise0.
Wed: For married owners living with their spouse,wed = 1; otherwise 0.
Minority clientele: If 75 percent or more of thefirm’s customers were minorities, minorityclientele = 1; otherwise 0.
Time 84–85: If the business was started or own-ership was acquired during 1984 or 1985, time84–85 = 1; otherwise 0.
Time 86: If the business was started or ownershipwas acquired during 1986, time 86 = 1; other-wise 0.
Time 87: If the business was started or ownershipwas acquired during 1987, time 87 = 1; other-wise 0.
In Table IV’s logistic regression exercise, theeducation variables (education 2 through educa-tion 5) are interacted with a binary variable,
Exiting Self-Employment 177
TABLE IIILogistic regression: Explaining owner perseverance in self-employment over the 1987–1991 period
(firms formed 1979–1987 only)
Asian Indian/ Nonimmigrant Asian Indian/ NonimmigrantFilipino Asian Filipino Asian
Variable Regression coefficient Regression coefficient Variable Variable(std. error) (std. error) mean mean
Constant 03.584* (1.060) –2.194* (0.930) 000– 000–Education 2 –0.522 *(0.400) –0.072 *(0.232) 0000.077 0000.155Education 3 –1.669* (0.375) 00.019 *(0.216) 0000.113 0000.284Education 4 –0.853* (0.361) 00.636* (0.234) 0000.401 0000.237Education 5 –0.943* (0.363) 01.018* (0.257) 0000.365 0000.217Owner age 00.063 *(0.048) 00.176* (0.043) 0040.72 0041.31Owner age sq. 00.000 *(0.000) –0.002* (0.000) 1735 1822Gender –0.091 *(0.121) 00.240 *(0.142) 0000.669 0000.741Wed 00.128 *(0.162) –0.496* (0.154) 0000.861 0000.735Labor input 00.022* (0.004) 00.003 *(0.006) 0018.67 0018.65Capital 00.083* (0.014) 00.056* (0.018) 0007.78 0007.83Traditional firm –0.716* (0.159) 00.219 *(0.178) 0000.201 0000.305Skill-intensive firm 00.265* (0.141) 00.054 *(0.165) 0000.457 0000.377Capital-intensive firm 00.461 *(0.332) 00.272 *(0.260) 0000.039 0000.076Minority clientele –0.472* (0.121) –0.024 *(0.138) 0000.263 0000.322Time 84–85 –0.077 *(0.184) –0.969* (0.207) 0000.239 0000.271Time 86 –0.956* (0.177) –0.677* (0.224) 0000.222 0000.207Time 87 –1.385* (0.166) –1.399* (0.205) 0000.283 0000.304
n 2091 1521–2 Log L (Chi square) 2063.7 *(293.8) 1619.2 *(154.2)
* Statistically significant at the 0.05 level.
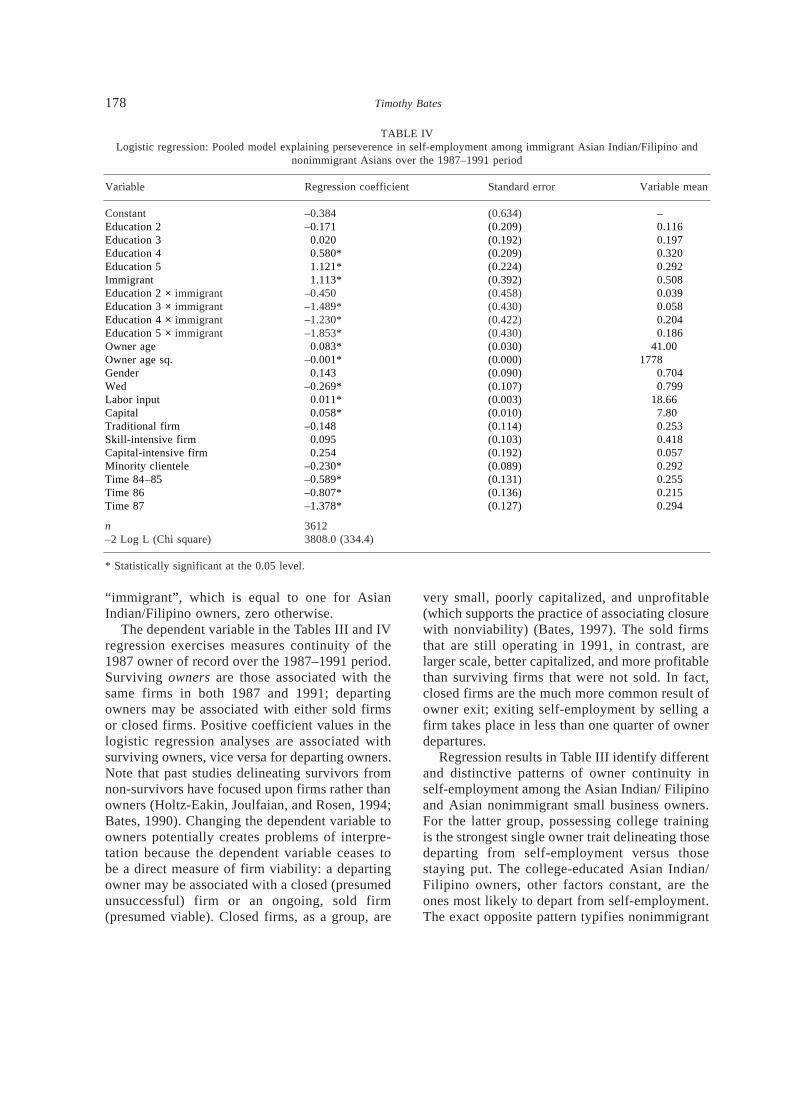
“immigrant”, which is equal to one for AsianIndian/Filipino owners, zero otherwise.
The dependent variable in the Tables III and IVregression exercises measures continuity of the1987 owner of record over the 1987–1991 period.Surviving owners are those associated with thesame firms in both 1987 and 1991; departingowners may be associated with either sold firmsor closed firms. Positive coefficient values in thelogistic regression analyses are associated withsurviving owners, vice versa for departing owners.Note that past studies delineating survivors fromnon-survivors have focused upon firms rather thanowners (Holtz-Eakin, Joulfaian, and Rosen, 1994;Bates, 1990). Changing the dependent variable toowners potentially creates problems of interpre-tation because the dependent variable ceases tobe a direct measure of firm viability: a departingowner may be associated with a closed (presumedunsuccessful) firm or an ongoing, sold firm(presumed viable). Closed firms, as a group, are
very small, poorly capitalized, and unprofitable(which supports the practice of associating closurewith nonviability) (Bates, 1997). The sold firmsthat are still operating in 1991, in contrast, arelarger scale, better capitalized, and more profitablethan surviving firms that were not sold. In fact,closed firms are the much more common result ofowner exit; exiting self-employment by selling afirm takes place in less than one quarter of ownerdepartures.
Regression results in Table III identify differentand distinctive patterns of owner continuity inself-employment among the Asian Indian/ Filipinoand Asian nonimmigrant small business owners.For the latter group, possessing college trainingis the strongest single owner trait delineating thosedeparting from self-employment versus thosestaying put. The college-educated Asian Indian/Filipino owners, other factors constant, are theones most likely to depart from self-employment.The exact opposite pattern typifies nonimmigrant
178 Timothy Bates
TABLE IVLogistic regression: Pooled model explaining perseverence in self-employment among immigrant Asian Indian/Filipino and
nonimmigrant Asians over the 1987–1991 period
Variable Regression coefficient Standard error Variable mean
Constant –0.384 (0.634) 000–Education 2 –0.171 (0.209) 0000.116Education 3 00.020 (0.192) 0000.197Education 4 00.580* (0.209) 0000.320Education 5 01.121* (0.224) 0000.292Immigrant 01.113* (0.392) 0000.508Education 2
× immigrant –0.450 (0.458) 0000.039Education 3 × immigrant –1.489* (0.430) 0000.058Education 4 × immigrant –1.230* (0.422) 0000.204Education 5 × immigrant –1.853* (0.430) 0000.186Owner age 00.083* (0.030) 0041.00Owner age sq. –0.001* (0.000) 1778Gender 00.143 (0.090) 0000.704Wed –0.269* (0.107) 0000.799Labor input 00.011* (0.003) 0018.66Capital 00.058* (0.010) 0007.80Traditional firm –0.148 (0.114) 0000.253Skill-intensive firm 00.095 (0.103) 0000.418Capital-intensive firm 00.254 (0.192) 0000.057Minority clientele –0.230* (0.089) 0000.292Time 84–85 –0.589* (0.131) 0000.255Time 86 –0.807* (0.136) 0000.215Time 87 –1.378* (0.127) 0000.294
n 3612–2 Log L (Chi square) 3808.0 (334.4)
* Statistically significant at the 0.05 level.
Asian Americans: college graduate owners werethe ones most likely to remain self-employed.Traditional lines of business – the blockedmobility proxy for Asian Indian/Filipinos – werestrongly associated with owner departure fromself-employment, other things equal, but this rela-tionship was trivial among nonimmigrant Asians.The skill-intensive firm owners were more likelythan others to remain in operation for AsianIndian/Filipinos, but the nonimmigrant Asianowners.
Comparison of owner continuity in self-employment across the Asian Indian/Filipino andnonimmigrant Asian groups (Table III) does yielda few similarities. Owners of both groups areclearly more likely to depart from self-employ-ment if they operate very young firms and, orpoorly capitalized firms. It is among the humancapital variables where regression coefficientdifferences are most pronounced. Owner age, theproxy for work experience, was highly positiveand significant, identifying older, presumablymore experienced Asian Americans as the onesmost likely to remain self-employed. The squaredterm for owner age indicates, furthermore, that oldage was positively associated with departure fromself-employment, other things equal. Yet none ofthese age – self-employment continuity relation-ships were statistically significant among AsianIndians/Filipinos.
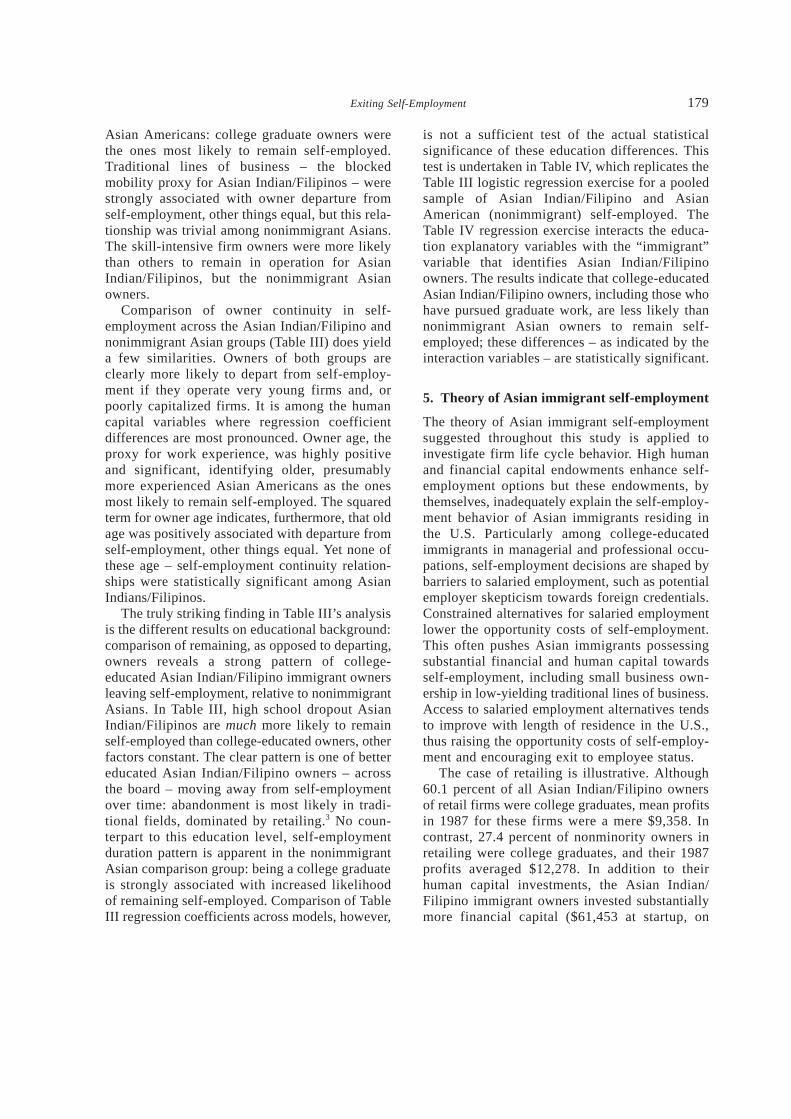
The truly striking finding in Table III’s analysisis the different results on educational background:comparison of remaining, as opposed to departing,owners reveals a strong pattern of college-educated Asian Indian/Filipino immigrant ownersleaving self-employment, relative to nonimmigrantAsians. In Table III, high school dropout AsianIndian/Filipinos are much more likely to remainself-employed than college-educated owners, otherfactors constant. The clear pattern is one of bettereducated Asian Indian/Filipino owners – acrossthe board – moving away from self-employmentover time: abandonment is most likely in tradi-tional fields, dominated by retailing.3 No coun-terpart to this education level, self-employmentduration pattern is apparent in the nonimmigrantAsian comparison group: being a college graduateis strongly associated with increased likelihoodof remaining self-employed. Comparison of TableIII regression coefficients across models, however,
is not a sufficient test of the actual statisticalsignificance of these education differences. Thistest is undertaken in Table IV, which replicates theTable III logistic regression exercise for a pooledsample of Asian Indian/Filipino and AsianAmerican (nonimmigrant) self-employed. TheTable IV regression exercise interacts the educa-tion explanatory variables with the “immigrant”variable that identifies Asian Indian/Filipinoowners. The results indicate that college-educatedAsian Indian/Filipino owners, including those whohave pursued graduate work, are less likely thannonimmigrant Asian owners to remain self-employed; these differences – as indicated by theinteraction variables – are statistically significant.
5. Theory of Asian immigrant self-employment
The theory of Asian immigrant self-employmentsuggested throughout this study is applied toinvestigate firm life cycle behavior. High humanand financial capital endowments enhance self-employment options but these endowments, bythemselves, inadequately explain the self-employ-ment behavior of Asian immigrants residing inthe U.S. Particularly among college-educatedimmigrants in managerial and professional occu-pations, self-employment decisions are shaped bybarriers to salaried employment, such as potentialemployer skepticism towards foreign credentials.Constrained alternatives for salaried employmentlower the opportunity costs of self-employment.This often pushes Asian immigrants possessingsubstantial financial and human capital towardsself-employment, including small business own-ership in low-yielding traditional lines of business.Access to salaried employment alternatives tendsto improve with length of residence in the U.S.,thus raising the opportunity costs of self-employ-ment and encouraging exit to employee status.
The case of retailing is illustrative. Although60.1 percent of all Asian Indian/Filipino ownersof retail firms were college graduates, mean profitsin 1987 for these firms were a mere $9,358. Incontrast, 27.4 percent of nonminority owners inretailing were college graduates, and their 1987profits averaged $12,278. In addition to theirhuman capital investments, the Asian Indian/Filipino immigrant owners invested substantiallymore financial capital ($61,453 at startup, on
Exiting Self-Employment 179
average) than cohort nonminority owners, whosemean financial capital outlay to enter retailing was$51,828. The Asian Indian/Filipino owners gen-erated average 1987 revenues of $253,563 in theirretail firms, while nonminorities – less endowedwith human capital (college degrees) and financialcapital – generated mean firm revenues of$274,214. The mean owner in both groups workedover 40 hours per week (over 2080 hours for allof 1987) and firm profits, net of a ten percentopportunity cost on owner investment of equitycapital, averaged $3.15 per hour of owner laborinput for Asian Indians and Filipinos, versus $4.67for nonminority retail firm owners. Recall thatthese are young firms (1979–1987 startups) only.Thus, the nonminority owner group generatedincome per hour of owner labor input that wasnearly 50 percent higher than the correspondingfigure for Asian Indian/Filipino immigrants. Bates(1994b) found that Korean immigrant owners ofretail firms lagged behind nonminorities – theirhigher firm investments of owner human andfinancial capital coexisted with lower levels ofgross revenues and profits, on average, per firm.
If Asian immigrant owners of small businesses
are indeed exiting low-yielding niches such asretailing, statistics describing the small businesslife cycle will reflect this fact. Specifically, logisticregression findings from Table III indicated apattern of owner exit from the lowest-yieldinglines of small business, along with retention ofowners in the highest-yielding skilled-servicesindustries. Thus, the older Asian immigrant-ownedfirms should exhibit a different industry distribu-tion than the young businesses.
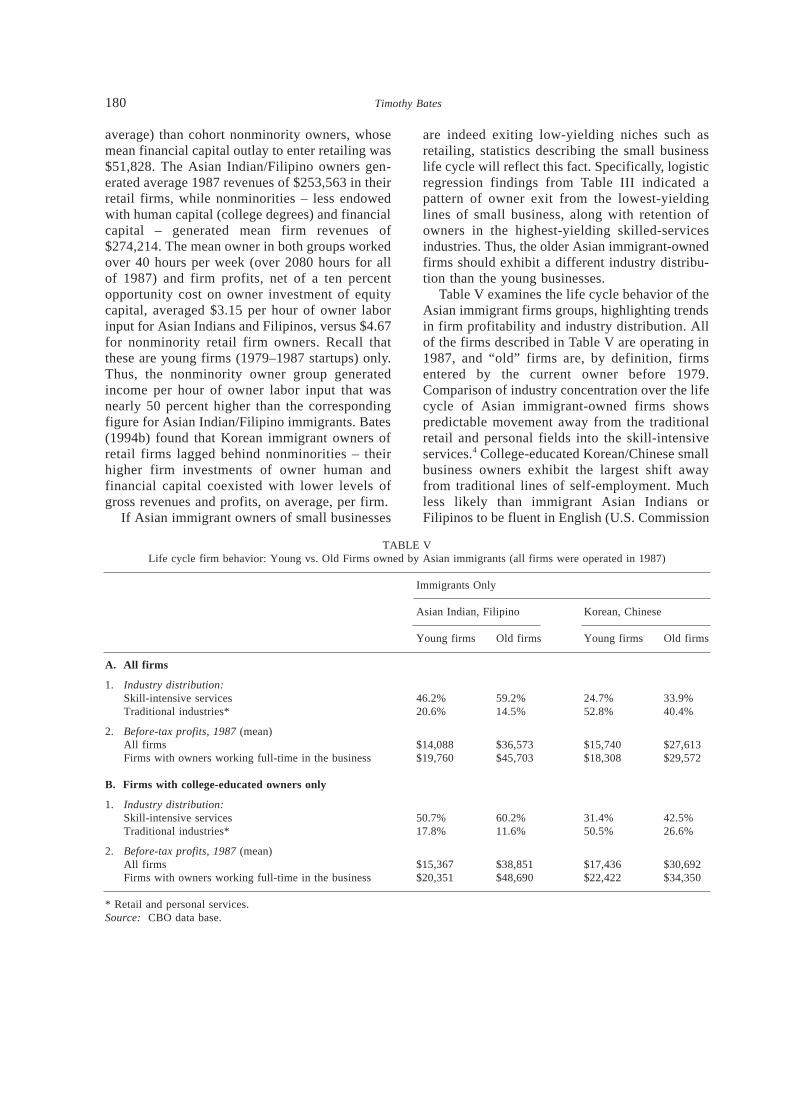
Table V examines the life cycle behavior of theAsian immigrant firms groups, highlighting trendsin firm profitability and industry distribution. Allof the firms described in Table V are operating in1987, and “old” firms are, by definition, firmsentered by the current owner before 1979.Comparison of industry concentration over the lifecycle of Asian immigrant-owned firms showspredictable movement away from the traditionalretail and personal fields into the skill-intensiveservices.4 College-educated Korean/Chinese smallbusiness owners exhibit the largest shift awayfrom traditional lines of self-employment. Muchless likely than immigrant Asian Indians orFilipinos to be fluent in English (U.S. Commission
180 Timothy Bates
TABLE VLife cycle firm behavior: Young vs. Old Firms owned by Asian immigrants (all firms were operated in 1987)
Immigrants Only
Asian Indian, Filipino Korean, Chinese
Young firms Old firms Young firms Old firms
A. All firms
1. Industry distribution:Skill-intensive services 46.2% 59.2% 24.7% 33.9%Traditional industries* 20.6% 14.5% 52.8% 40.4%
2. Before-tax profits, 1987 (mean)All firms $14,088 $36,573 $15,740 $27,613Firms with owners working full-time in the business $19,760 $45,703 $18,308 $29,572
B. Firms with college-educated owners only
1. Industry distribution:Skill-intensive services 50.7% 60.2% 31.4% 42.5%Traditional industries* 17.8% 11.6% 50.5% 26.6%
2. Before-tax profits, 1987 (mean)All firms $15,367 $38,851 $17,436 $30,692Firms with owners working full-time in the business $20,351 $48,690 $22,422 $34,350
* Retail and personal services.Source: CBO data base.
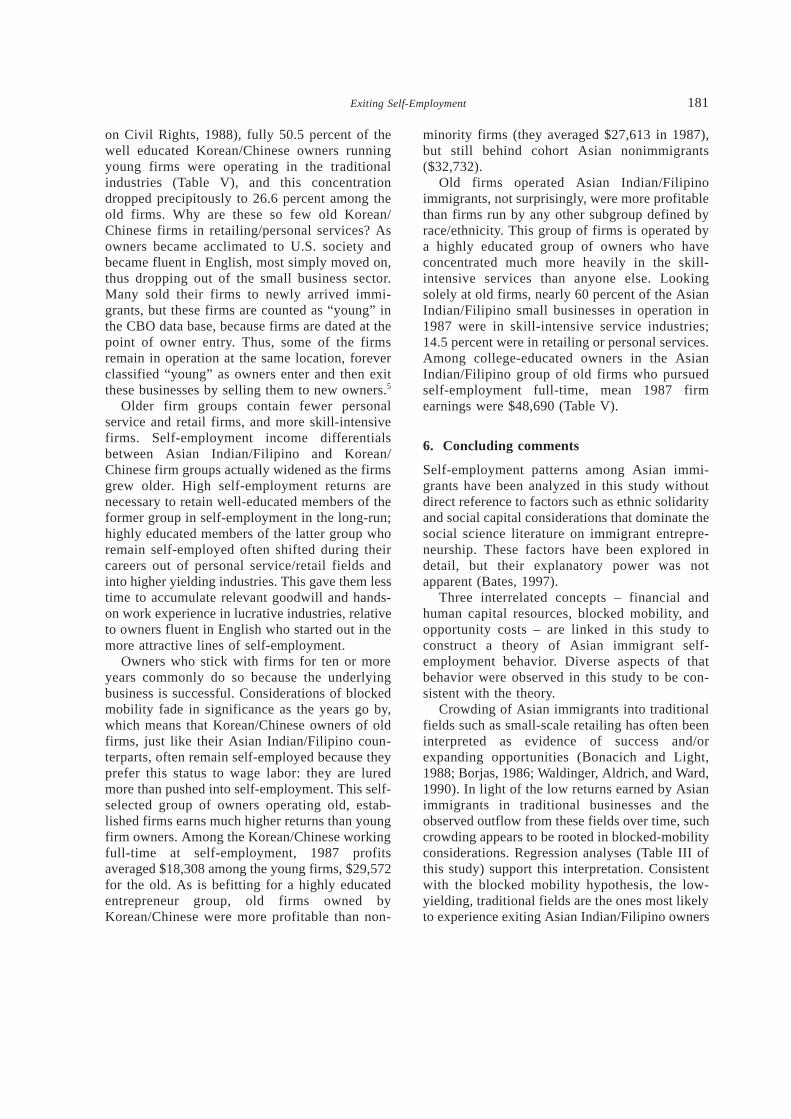
on Civil Rights, 1988), fully 50.5 percent of thewell educated Korean/Chinese owners runningyoung firms were operating in the traditionalindustries (Table V), and this concentrationdropped precipitously to 26.6 percent among theold firms. Why are these so few old Korean/Chinese firms in retailing/personal services? Asowners became acclimated to U.S. society andbecame fluent in English, most simply moved on,thus dropping out of the small business sector.Many sold their firms to newly arrived immi-grants, but these firms are counted as “young” inthe CBO data base, because firms are dated at thepoint of owner entry. Thus, some of the firmsremain in operation at the same location, foreverclassified “young” as owners enter and then exitthese businesses by selling them to new owners.5
Older firm groups contain fewer personalservice and retail firms, and more skill-intensivefirms. Self-employment income differentialsbetween Asian Indian/Filipino and Korean/Chinese firm groups actually widened as the firmsgrew older. High self-employment returns arenecessary to retain well-educated members of theformer group in self-employment in the long-run;highly educated members of the latter group whoremain self-employed often shifted during theircareers out of personal service/retail fields andinto higher yielding industries. This gave them lesstime to accumulate relevant goodwill and hands-on work experience in lucrative industries, relativeto owners fluent in English who started out in themore attractive lines of self-employment.
Owners who stick with firms for ten or moreyears commonly do so because the underlyingbusiness is successful. Considerations of blockedmobility fade in significance as the years go by,which means that Korean/Chinese owners of oldfirms, just like their Asian Indian/Filipino coun-terparts, often remain self-employed because theyprefer this status to wage labor: they are luredmore than pushed into self-employment. This self-selected group of owners operating old, estab-lished firms earns much higher returns than youngfirm owners. Among the Korean/Chinese workingfull-time at self-employment, 1987 profitsaveraged $18,308 among the young firms, $29,572for the old. As is befitting for a highly educatedentrepreneur group, old firms owned byKorean/Chinese were more profitable than non-
minority firms (they averaged $27,613 in 1987),but still behind cohort Asian nonimmigrants($32,732).
Old firms operated Asian Indian/Filipinoimmigrants, not surprisingly, were more profitablethan firms run by any other subgroup defined byrace/ethnicity. This group of firms is operated bya highly educated group of owners who haveconcentrated much more heavily in the skill-intensive services than anyone else. Lookingsolely at old firms, nearly 60 percent of the AsianIndian/Filipino small businesses in operation in1987 were in skill-intensive service industries;14.5 percent were in retailing or personal services.Among college-educated owners in the AsianIndian/Filipino group of old firms who pursuedself-employment full-time, mean 1987 firmearnings were $48,690 (Table V).
6. Concluding comments
Self-employment patterns among Asian immi-grants have been analyzed in this study withoutdirect reference to factors such as ethnic solidarityand social capital considerations that dominate thesocial science literature on immigrant entrepre-neurship. These factors have been explored indetail, but their explanatory power was notapparent (Bates, 1997).
Three interrelated concepts – financial andhuman capital resources, blocked mobility, andopportunity costs – are linked in this study toconstruct a theory of Asian immigrant self-employment behavior. Diverse aspects of thatbehavior were observed in this study to be con-sistent with the theory.
Crowding of Asian immigrants into traditionalfields such as small-scale retailing has often beeninterpreted as evidence of success and/orexpanding opportunities (Bonacich and Light,1988; Borjas, 1986; Waldinger, Aldrich, and Ward,1990). In light of the low returns earned by Asianimmigrants in traditional businesses and theobserved outflow from these fields over time, suchcrowding appears to be rooted in blocked-mobilityconsiderations. Regression analyses (Table III ofthis study) support this interpretation. Consistentwith the blocked mobility hypothesis, the low-yielding, traditional fields are the ones most likelyto experience exiting Asian Indian/Filipino owners
Exiting Self-Employment 181

in an environment where impediments to mobilitydecline over time. Further, the high-yielding skill-intensive services offer opportunities for fullerutilization of owner human capital and higherearnings; blocked mobility had less relevance tothis line of self-employment.
The contrast between the more fluent AsianIndian/Filipino immigrants and Korean/Chinese,who are much less apt to speak English, is instruc-tive. Young firms owned by Korean/Chineseimmigrants are more concentrated in traditionalindustries than those of Asian Indians/Filipinos,particularly among college-educated owners.Facing greater labor market barriers than AsianIndians and Filipinos (Bates, 1997), Korean/Chinese immigrant entrepreneurs are more likelythan others to work full-time in their smallbusiness and to rely upon that source for most oftheir household income. Long self-employmenthours reduce household involvement in other laborforce activities that might supplement the earningsderived from operating a young firm. The laggardperformance of the Korean/Chinese self-employedstands out most clearly in the comparative figuresof college-educated owners with 1987 householdincomes under $15,000 – 21.5 percent, versus 11.9percent among Asian Indian/Filipinos who enteredself-employment in the 1979–1987 period. At theother end of the spectrum, Asian Indian/Filipinoimmigrants operating young firms are two and onehalf times more likely than Chinese/Koreans to bein the $75,000+ household income bracket.6
Concentration in traditional lines of business gen-erates low earnings among Asian immigrants,including the college-educated, and this, in turn,encourages owner exit.
The finding that college-educated Asian immi-grants often earn low returns in traditional lines ofself-employment has ramifications for compar-isons of small business ownership patterns amongminority groups. The assumption that a prolifera-tion of Asian immigrant-owned small businessessignals opportunities has caused scholars to spec-ulate about why African Americans have shownless inclination towards self-employment thanimmigrant groups such as Koreans (Bonacich andLight, 1988; Waldinger, Aldrich, and Ward, 1990).The recognition of higher self-employment returnsamong African Americans – after controlling for
human and financial capital investments – putscomparisons of black and Asian immigrantbusiness viability into a different light. An alter-native to the literature asserting relative weaknessin the black business community is the hypoth-esis that college-educated African Americans areunwilling to operate retail stores because ofopportunity cost considerations.
The research agenda in the fields of immigrantand minority self-employment is rich and varied.The purpose of this study is to suggest reorienta-tions in emphasis that may enrich our under-standing of immigrant self-employment and smallbusiness behavior generally.
Acknowledgements
This study was supported by the Woodrow WilsonInternational Center for Scholars. Data analysiswas conducted on-site at the Center for EconomicStudies (CES), U.S. Bureau of the Census. Viewsexpressed in this study do not necessarily reflectthose of the CES. The assistance of Afred Nucciis gratefully acknowledged.
Notes1 Statistics on self-employment cited in this study are drawnfrom the U.S. Bureau of the Census Characteristics ofBusiness Owners (CBO) data base, unless otherwise stated.The CBO data are accessible to researchers willing to workon-site at approved Census Bureau locations.2 Includes professional services, finance, insurance, and realestate, and business services.3 Numerous interesting variations of these regression exer-cises are possible. When the Table III exercises werereplicated using nonminority self-employed, results closelyapproximated those for nonimmigrant Asian owners.4 Self-employed Vietnamese are excluded from Table V. Thefour dominant groups in the Asian immigrant small businesscommunity – Asian Indian, Filipino, Korean, and Chinese –are all quite similar in the sense that, relative to nonminori-ties, the average business startup owner is more highlyeducated (more likely to be a college graduate) and the firmbegins operation with significantly greater financial capital.Vietnamese firms, in contrast, do not fit the high humancapital, high financial capital profile of the Asian immigrantsmall business community.5 The CBO data base did not record age of firm, as such, inits data files: firms were dated by years of current ownerinvolvement only.6 The source of these total household income figures is theCBO data base.
182 Timothy Bates

References
Bates, T., 1987, ‘Self Employed Minorities: Traits andTrends’, Social Science Quarterly 68, 539–551.
Bates, T., 1990, ‘Entrepreneurial Human Capital Inputs andSmall Business Longevity’, The Review of Economics andStatistics 72, 551–559.
Bates, T., 1994, ‘Social Resources Generated by GroupSupport Networks May Not Be Beneficial to AsianImmigrant-Owned Firms’, Social Forces 72, 671–689.
Bates, T., 1994, ‘An Analysis of Korean Immigrant-OwnedSmall Business Startups with Comparisons to AfricanAmerican and Nonminority-Owned Firms’, Urban AffairsQuarterly 31, 206–225.
Bates, T., 1997, Race, Self-Employment, and Upward Mobility,John Hopkins University Press.
Bonacich, E. and I. Light, 1988, Immigrant Entrepreneurs:Koreans in Los Angeles 1965–1982, University ofCalifornia Press.
Borjas, G., 1986, ‘The Self-Employment Experience ofImmigrants’, The Journal of Human Resources 21,485–506.
Borjas, G., 1990, Friends or Strangers: The Impact ofImmigrants on the U.S. Economy, Basic Books.
Borjas, G., 1994, ‘The Economics of Immigration’, Journalof Economic Literature 32, 1667–1717.
Boyd, R., 1991, ‘Inequality in the Earnings of Self-EmployedAfrican and Asian Americans’, Sociological Perspectives34, 447–472.
Evans, M. D. R., 1989, ‘Immigrant Entrepreneurship: Effectsof Ethnic Market Size and Isolated Labor Pool’, AmericanSociological Review 54, 950–962.
Fratoe, F., 1986, ‘A Sociological Analysis of MinorityBusiness’, The Review of Black Political Economy 15,5–29.
Fratoe, F., 1988, ‘Social Capital and Small Business Owners’,The Review of Black Political Economy 16, 33–50.
Holtz-Eakin, D., D Joulfaian, and H. Rosen, 1994, ‘StickingIt Out: Entrepreneurial Survival and Liquidity Constraints’,Journal of Political Economy 102, 53–75.
Jovanovic, B., 1982, ‘Selection and the Evolution of Industry’,Econometica 50, 649–670.
Kassoudji, S., 1988, ‘English Language Abilities and theLabor Market Opportunities of Hispanic and East AsianMen’, Journal of Labor Economics 6, 205–228.
Kim, K., W. Hurh, and M. Fernandez, 1989, ‘IntragroupDifferences in Business Participation: Three AsianImmigrant Groups’, International Migration Review 23,73–95.
Light, I., 1972, Ethnic Enterprise in America, University ofCalifornia Press.
Min, P., 1984, ‘A Structural Analysis of Korean Business inthe United States’, Ethnic Groups 6, 1–25.
Min, P., 1986, ‘Filipino and Korean Immigrants in SmallBusiness: A Comparative Analysis’, Amerasia Journal 13,53–71.
Moore, R., 1983, ‘Employer Discrimination: Evidence fromSelf-Employed Workers’, The Review of Economics andStatistics 65, 496–500.
Nucci, A., 1992, ‘The Characteristics of Business Owners DataBase’, U.S. Bureau of the Census Center for EconomicStudies discussion paper, Washington, D.C.
U.S. Bureau of the Census, 1991, Survey of Minority BusinessEnterprises: Summary, Government Printing Office.
U.S. Commission on Civil Rights, 1988, ‘The Economic Statusof Americans of Asian Descent’, ClearinghousePublication 95, Washington, D.C.
Waldinger, R., 1986, Through the Eye of the Needle, NYUPress.
Waldinger, R., H. Aldrich, and R. Ward, 1990, EthnicEntrepreneurs, Sage.
Yoon, I., 1991, ‘The Changing Significance of Ethnic andClass Resources in Immigrant Businesses’, InternationalMigration Review 25, 301–331.
Exiting Self-Employment 183