exhibit n – acoustical study acoustical study evaluated the sound levels from the ... obtained...
TRANSCRIPT
Petition for a Declaratory Ruling
Exhibits
Exhibit N – Acoustical Study

Petition for a Declaratory Ruling
Exhibits
This page intentionally left blank.

ACOUSTICAL STUDY
Tobacco Valley Solar Farm Simsbury, Connecticut
PREPARED FOR DWW Solar II, LLC 56 Exchange Terrace, Suite 300 Providence, Rhode Island 02903
PREPARED BY
100 Great Meadow Road Suite 200 Wethersfield, Connecticut 06109
JUNE 2017


Acoustical Study
i Table of Contents \\vhb\proj\Wethersfield\42256.00\tech\Noise\Report\Tobacco Valley Solar Farm Acoustical Study_FINAL_6-26-2017.docx
Table of Contents
Introduction .................................................................................................................................................... 1
Project description ....................................................................................................................................................................... 1 Fundamentals of Noise .............................................................................................................................................................. 1 Noise Impact Criteria .................................................................................................................................................................. 4
Acoustical Assessment ................................................................................................................................... 5
Methodology ................................................................................................................................................................................. 5 Receptor Locations ......................................................................................................................................................... 6
Existing Conditions ...................................................................................................................................................................... 8 Future Conditions ........................................................................................................................................................................ 8
Findings ......................................................................................................................................................... 10
Conclusion of Acoustical Assessment ............................................................................................................................... 10 Construction Activities ............................................................................................................................................................ 10
Acoustical Study
ii Table of Contents \\vhb\proj\Wethersfield\42256.00\tech\Noise\Report\Tobacco Valley Solar Farm Acoustical Study_FINAL_6-26-2017.docx
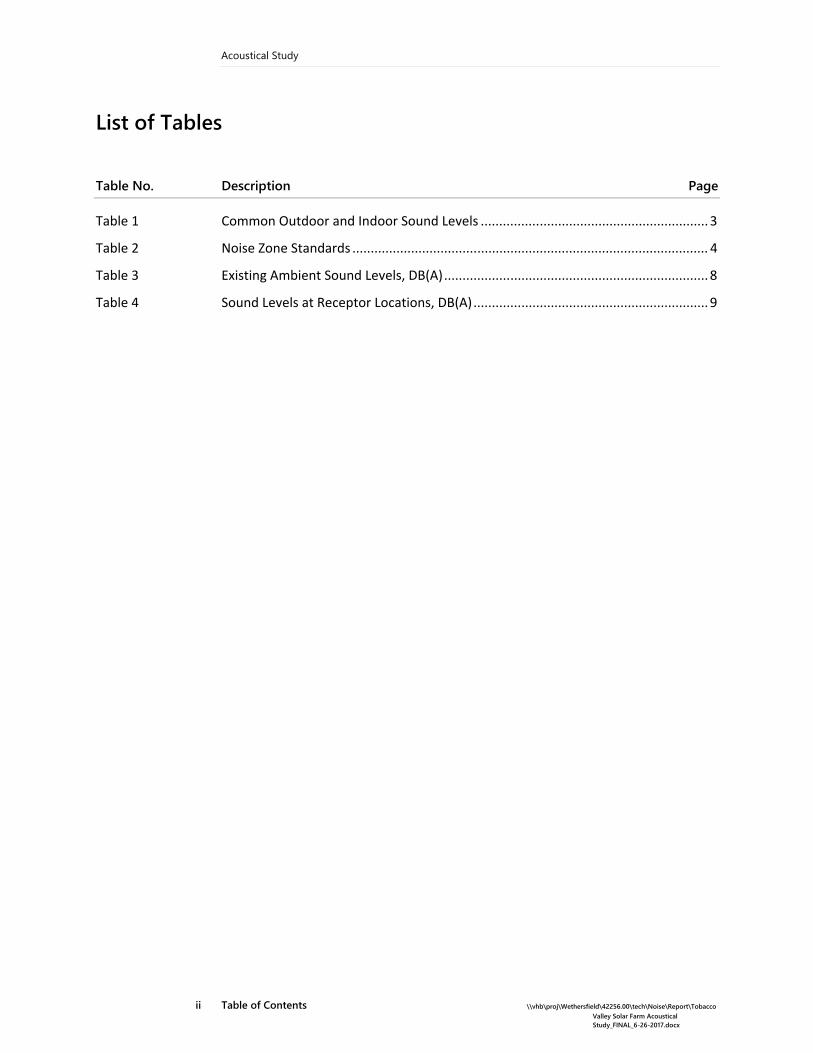
List of Tables
Table No. Description Page
Table 1 Common Outdoor and Indoor Sound Levels .............................................................. 3
Table 2 Noise Zone Standards ................................................................................................. 4
Table 3 Existing Ambient Sound Levels, DB(A) ........................................................................ 8
Table 4 Sound Levels at Receptor Locations, DB(A) ................................................................ 9

Acoustical Study
iii Table of Contents \\vhb\proj\Wethersfield\42256.00\tech\Noise\Report\Tobacco Valley Solar Farm Acoustical Study_FINAL_6-26-2017.docx
List of Figures
Figure No. Description Page
Figure 1 Monitoring and Receptor Locations ........................................................................... 7


Acoustical Study
1 Acoustical Assessment
1 Introduction The purpose of this acoustical study is to evaluate the potential noise impacts associated with construction of the proposed Tobacco Valley Solar Project located in Simsbury, Connecticut. This acoustical assessment evaluated the potential sound levels generated by the inverters and transformers associated with the Project. The sound levels were compared to the Connecticut Department of Energy and Environmental Protection’s (CT DEEP) noise control regulations (Regulations of Connecticut State Agencies (RCSA), Title 22a, Section 22a-69-1 to 22a 69-7).
Project description DWW Solar II LLC (DWW) is proposing the Tobacco Valley Solar Project (the Project) on approximately 289 acres of land in Simsbury Connecticut. The Project is proposed on five parcels of land identified by the Town of Simsbury Tax Assessor as G03-403-032, G03-403-012, G03-403-026-32H, G03-403-014, and H05-103-024, collectively referred to herein as the Project Site. The Project will develop approximately 156 acres of the Site which is described herein as the Project Area.
Fundamentals of Noise Noise is defined as unwanted or excessive sound. Sound becomes unwanted when it interferes with normal activities such as sleep, communication, work, or recreation. How people perceive sound depends on several measurable physical characteristics, which include the following:
› Intensity – Sound intensity is often equated to loudness. › Frequency – Sounds are comprised of acoustic energy distributed over a variety
of frequencies. Acoustic frequencies, commonly referred to as tone or pitch, are

Acoustical Study
2 Acoustical Assessment
typically measured in Hertz. Pure tones have all their energy concentrated in a narrow frequency range.
Sound levels are most often measured on a logarithmic scale of decibels (dB). The decibel scale compresses the audible acoustic pressure levels which can vary from the threshold of hearing (zero dB) to the threshold of pain (120 dB). Because sound levels are measured in dB, the addition of two sound levels is not linear. Adding two equal sound levels creates a 3 dB increase in the overall level. Research indicates the following general relationships between sound level and human perception:
› A 3 dB increase is a doubling of acoustic energy and is the threshold of perceptibility to the average person.
› A 10 dB increase is a tenfold increase in acoustic energy but is perceived as a doubling in loudness to the average person.
The human ear does not perceive sound levels from each frequency as equally loud. To compensate for this phenomenon in perception, a frequency filter known as A weighted [dB(A)] is used to evaluate environmental noise levels. Table 1 presents a list of common outdoor and indoor sound levels.

Acoustical Study
3 Acoustical Assessment
Table 1 Common Outdoor and Indoor Sound Levels
Outdoor Sound Levels
Sound Pressure (Pa)*
Sound Level
dB(A)** Indoor Sound Levels 6,324,555 - 110 Rock Band at 5 m Jet Over Flight at 300 m - 105 2,000,000 - 100 Inside New York Subway Train Gas Lawn Mower at 1 m - 95 632,456 - 90 Food Blender at 1 m Diesel Truck at 15 m - 85 Noisy Urban AreaDaytime 200,000 - 80 Garbage Disposal at 1 m - 75 Shouting at 1 m Gas Lawn Mower at 30 m 63,246 - 70 Vacuum Cleaner at 3 m Suburban Commercial Area - 65 Normal Speech at 1 m 20,000 - 60 Quiet Urban AreaDaytime - 55 Quiet Conversation at 1 m 6,325 - 50 Dishwasher Next Room Quiet Urban AreaNighttime - 45 2,000 - 40 Empty Theater or Library Quiet SuburbNighttime - 35 632 - 30 Quiet Bedroom at Night Quiet Rural AreaNighttime - 25 Empty Concert Hall Rustling Leaves 200 - 20 - 15 Broadcast and Recording Studios 63 - 10 - 5 Reference Pressure Level 20 - 0 Threshold of Hearing
Source: Highway Noise Fundamentals. Federal Highway Administration, September 1980. * mPA – MicroPascals, which describe pressure. The pressure level is what sound level monitors measure. ** dB(A) – A weighted decibels, which describe sound pressure logarithmically with respect to 20 mPa (the reference pressure
level).
A variety of sound level indicators can be used for environmental noise analysis. These indicators describe the variations in intensity and temporal pattern of the sound levels. The indicators used in this analysis are defined as follows:
› Leq is the A-weighted sound level, which averages the background sound levels with short-term transient sound levels and provides a uniform method for comparing sound levels that vary over time.
› L10 is the A-weighted sound level, which is exceeded for 10 percent of the time during the time period.
› L90 is the A-weighted sound level, which is exceeded for 90 percent of the time during the time period. The L90 is generally considered to be the background sound level. It should be noted that the L90 eliminates the highest 10 percent of the sound levels that occur in the study area.

Acoustical Study
4 Acoustical Assessment
Noise Impact Criteria The CT DEEP has developed noise impact criteria that establish sound level thresholds deemed to result in adverse impacts. The acoustic analysis for the Project used these criteria to evaluate whether the project will generate sound levels that result in adverse impacts.
The CT DEEP’s noise control regulations identify the limits of sound that can be emitted from specific premises and what activities are exempt. The noise control regulations (Title 22a, §§ 22a-69-1 to 22a 69-7) are contained in the RCSA. Even though the proposed Project would be considered a Class C (Industrial) emitter, the acoustic analysis for the Project assumed the more stringent noise standard for a Class B (Commercial) Emitter Zone and a Class A (Residential) Receptor Noise Zone for the receptor locations. A Class C land use is defined as generally industrial where protection against damage to hearing is essential, and the necessity for conversation is limited. The land use for Class B is defined as generally commercial in nature, where human beings converse and such conversations are essential to the intended use of the land. The land use in Class A is defined as generally residential where human beings sleep or areas where serenity and tranquility are essential to the intended use of the land.
The CT DEEP policy states that a source (emitter) located in the various zones shall not emit noise exceeding the levels stated in Table 2 at the adjacent noise zones.
Table 2 Noise Zone Standards
Emitter Zone
Receptor Noise Zone Class A
(Daytime) Class A
(Nighttime) Class B Class C Class A (Residential) 55 45 55 62 Class B (Commercial) 55 45 62 62 Class C (Industrial) 61 51 66 70
Source: Control of Noise (Title 22a, Section 22a-69-1 to 22a-69-7.4), RCSA, Revised 2015-3-6.

Acoustical Study
5 Acoustical Assessment
2 Acoustical Assessment Methodology This acoustical study evaluated the sound levels from the mechanical equipment associated with the Project. The noise sources consist of the electrical inverters and transformers used to convert the solar energy to usable electric. The noise analysis consists of two components: existing ambient sound levels and Project contributions. The existing condition sound levels were determined by conducting sound level measurements at sensitive receptor locations surrounding the Project Site. The Project-generated sound levels were calculated using manufacturer’s sound data and the principles of acoustical propagation of sound over distance.
Sound level monitoring was conducted to determine the existing ambient sound levels in the vicinity of the Project Site. Monitoring was conducted at six locations that were selected as representative of the residential neighborhoods surrounding the Project Site. The measurements were conducted for a 24-hour period to capture typical weekday daytime and nighttime periods.
The Project-generated sound levels were calculated for each sensitive receptor location based on manufacturer-provided reference sound level data. The reference sound level data (76 dBA at 3.3 feet) for the inverters were obtained from manufacturer’s specifications of the potential equipment. Since the Project is in the early stages of design, the details for the transformers are not known at the time of this acoustical study. Therefore, under the directive of the proponent, the reference sound level data (63 dBA at 6 feet) for the transformers were based on data obtained from the National Electrical Manufacturers Association (NEMA) standards1 for transformers. These sound levels were adjusted to reflect the distances to the
1 NEMA TR 1-2013 Transformers, Step Voltage Regulators and Reactors, National Electrical Manufacturers Association, 2014

Acoustical Study
6 Acoustical Assessment
sensitive receptor locations. The project-generated sound levels were projected to the receptor locations using the properties of sound propagation for soft ground terrain in the acoustic modeling software CadnaA2 (Computer Aided Noise Abatement).
Finally, the existing and proposed Project-generated sound levels were added together to determine the proposed mechanical equipment’s’ potential impact on existing sound levels. These results were compared to the CT DEEP noise impact criteria for determining compliance.
Receptor Locations Sixteen receptor locations were identified in the vicinity of the Project Site. The receptor locations were selected based on their proximity to the Site and their land use. These receptor locations represent the most sensitive locations in the immediate area that may experience changes in sound levels once the Project is in operation. These receptor locations represent the residential parcels that surround the Project Site. They include:
› R1 – Munnisunk Drive, › R2 – Halwood Lane, › R3 – Knollwood Circle North, › R4 – Knollwood Circle South, › R5 – Howard Street, › R6 – Ojakian Commons, › R7 – Eastpointe at Dorset Crossing Apartment, › R8 – Hoskins Road, › R9 – Flintlock Ridge, › R10 – Musket Trail, › R11 – Squadron Line School, › R12 – 85 Hoskins Road, › R13 – County Road, › R14 – Saxton Brook Drive, › R15 – Berkshire Way, and › R16 – Litchfield Drive.
The primary land use in the vicinity of the Project Site is residential. The receptor and monitoring locations used in the analysis are presented in Figure 1. These receptor locations, selected based on land use considerations, represent the most sensitive locations in the vicinity of the Project Site.
2 DataKustik GmbH, 2014. Computer Aided Noise Abatement Model.

GG
GG
G
G
G
G
G
G
GG
GG
G
!(
!(
!(
!(
!(
!(!(
!(
!(!(
!(!(
!(
!(
!(!(!(
!(
!(
!(
!(
!(M6
M5
M4
M3
M2
M1
R9
R8
R7R6
R5
R4
R3
R2
R1
R16 R15
R14
R13
R12R11
R10
logos
Tobacco Valley Solar Project Simsbury, ConnecticutFigure 1Monitoring and Receptor Locations
i 0 690 1380345 Feet
\\vhb
\proj
\Midd
letow
n\422
56.00
\tech
\Nois
e\GIS\
Figure
1 Mo
nitori
ng Lo
catio
ns.m
xd
!( Monitoring Locations
G Inverter/Transformer Location!( Receptor Locations
Project Property Limits
M# R#


Acoustical Study
8 Acoustical Assessment
Existing Conditions A monitoring program was developed to measure existing ambient sound levels. The existing sound levels were measured using a Type 1 sound analyzers (Larson Davis SoundExpert LxT and 831). Measurements were conducted for a 24-hour period at each monitoring location from approximately 9:30 AM on March 8, 2017 to approximately 12:00 PM on March 10, 2017. During the daytime period, the measured sound levels data under existing conditions were composed of noise from vehicles on local roadways in the vicinity of the monitoring locations. The existing measured sound level data are presented in Table 3.
Table 3 Existing Ambient Sound Levels, DB(A)
CTDEEP Residential Zone Noise Standard
Measured L90 Sound Levels
Monitoring Location1 Daytime2 Nighttime3 Daytime Nighttime M1 – Howard/Gordon St 55 45 26-44 20-29 M2 – Knollwood Cir 55 45 27-48 22-30 M3 – Berkshire Way/Litchfield Dr. 55 45 24-40 19-28 M4 – Existing Substation 55 45 40-46 40-42 M5 – County Rd 55 45 33-46 20-39 M6 – Flintlock Ridge 55 45 30-42 24-33
1 Refer to Figure 1 for monitoring locations. 2 Daytime is from 7:00 AM to 10:00 PM. 3 Nighttime is from 10:00 PM to 7:00 AM.
The L90 sound levels range from 24 dB(A) to 48 dB(A) during the daytime period and from 19 dB(A) to 42 dB(A) during the nighttime period. The result of the monitoring program indicates that the daytime and nighttime sound levels within the study area are currently below the CT DEEP’s daytime and nighttime standard of 55 dB(A) and 45 dB(A), respectively.
Future Conditions The acoustical analysis evaluated the potential sound level impacts associated with the Project’s proposed mechanical equipment. The analysis evaluated the potential sound level impacts at the nearby sensitive receptor locations.
The potential sound level impact associated with the proposed generate was determined by comparing existing and future sound levels to the CT DEEP’s noise standards. The existing sound levels were based upon sound level measurements. The future sound levels were calculated by combining existing sound levels and sound levels from the proposed equipment. The sound levels were adjusted based upon distance, properties of sound propagation over terrain, applicable blockage, and, if necessary, noise attenuation measures, which may include an acoustical wall.

Acoustical Study
9 Acoustical Assessment
The results of the acoustical analysis demonstrated that the operation of electrical inverters and transformers will meet CT DEEP’s noise standards at the sensitive receptor locations. The abutting residential receptor locations will experience the greatest potential impacts during the nighttime when ambient sound levels are the lowest. With the equipment operating at full load, the receptor locations will experience sound levels ranging from approximately 33 dB(A) to 43 dB(A). These sound levels are below CT DEEP criteria of 55 dB(A) during the daytime period and 45 dB(A) during the nighttime period. Table 4 summarizes the sound levels at the receptor locations.
Table 4 Sound Levels at Receptor Locations, DB(A)
Receptor Locations
CTDEEP Noise Standard Daytime*
CTDEEP Noise Standard
Nighttime*
Project Generated
Sound Levels R1 – Munnisunk Drive 55 45 34 R2 – Halwood Lane 55 45 35 R3 – Knollwood Circle North 55 45 37 R4 – Knollwood Circle South 55 45 37 R5 – Howard Street 55 45 38 R6 – Ojakian Commons 55 45 34 R7 – Eastpointe at Dorset Crossing Apartment 55 45 33 R8 – Hoskins Road 55 45 37 R9 – Flintlock Ridge 55 45 35 R10 – Musket Trail 55 45 35 R11 – Squadron Line School 55 45 34 R12 – 85 Hoskins Road 55 45 43 R13 – County Road 55 45 43 R14 – Saxton Brook Drive 55 45 37 R15 – Berkshire Way 55 45 40 R16 – Litchfield Drive 55 45 38
* Noise standard for nighttime for Class B emitter and Class A receptor.

Acoustical Study
10 Acoustical Assessment
3 Findings Conclusion of Acoustical Assessment The acoustical analysis evaluated the sound levels associated with the Project’s mechanical equipment. This analysis determined that the residential properties abutting the Project Site currently experiences sound levels below CTDEEP’s daytime and nighttime noise standards. Due to the low noise equipment and anticipated location of the proposed equipment located relatively in the center of the Project Site, the sound levels associated with the Project’s mechanical equipment are expected to have no adverse noise impacts at nearby sensitive receptor locations during both daytime and nighttime periods.
Construction Activities Construction activities may result in temporarily increases of nearby sound levels due to the intermittent use of heavy machinery during the construction of the proposed project. The Project is expected to generate typical sound levels from construction activities, including truck movements, heavy equipment operations, and general construction activities. Heavy machinery, such as front end loaders, graders, bull dozers, and backhoes, would be used intermittently throughout the proposed project’s construction.
Section 22a-69-1.8(g) of the CT DEEP’s noise control regulation states that noise associated with construction activities are exempt from the regulation. However, even though construction noise is exempt from the regulation, construction activities such as site excavation/grading and installation of the solar panel systems would typically be limited to normal daytime working hours. Construction activities

Acoustical Study
11 Acoustical Assessment
beyond normal daytime work hours would be minimized to the extent practicable and would adhere to local noise regulations.
If noise concerns arise during construction, the Proponent will evaluate and implement appropriate noise abatement measures to reduce or minimize noise from the construction activities. Construction vehicles and equipment would be required to maintain their original engine noise control equipment. Specific mitigation measures may include, but not limited to, the following:
› Install and properly operate appropriate noise muffler systems on construction equipment;
› Implement appropriate traffic management techniques during the construction period to minimize roadway traffic noise impact;
› Implement procedures for proper operation and maintenance, and prohibition of excessive idling of construction equipment engines;
› Install quieter-type (manually adjustable or ambient-sensitive) backup alarms on construction vehicles.