exercises on slide design (pdf) - writing guidelines for engineering
TRANSCRIPT

Rethinking the Design of Presentation Slides
Presentations on Slide Design Penn State, 2007 (pdf) USGS, 2005 (wmv) Virginia Tech, 2004 (pdf)
Criticism of PowerPoint Jaffe, Wall Street Journal Keller, Chicago Tribune Parker, New Yorker Schwartz, New York Times Tufte, Wired
Research on Slide Design FIE (October 2005) Tech Comm (February 2005) Tech Comm (November 2005) Tech Comm (May 2006)
Resources and Templates Teaching Slide Design PowerPoint Template
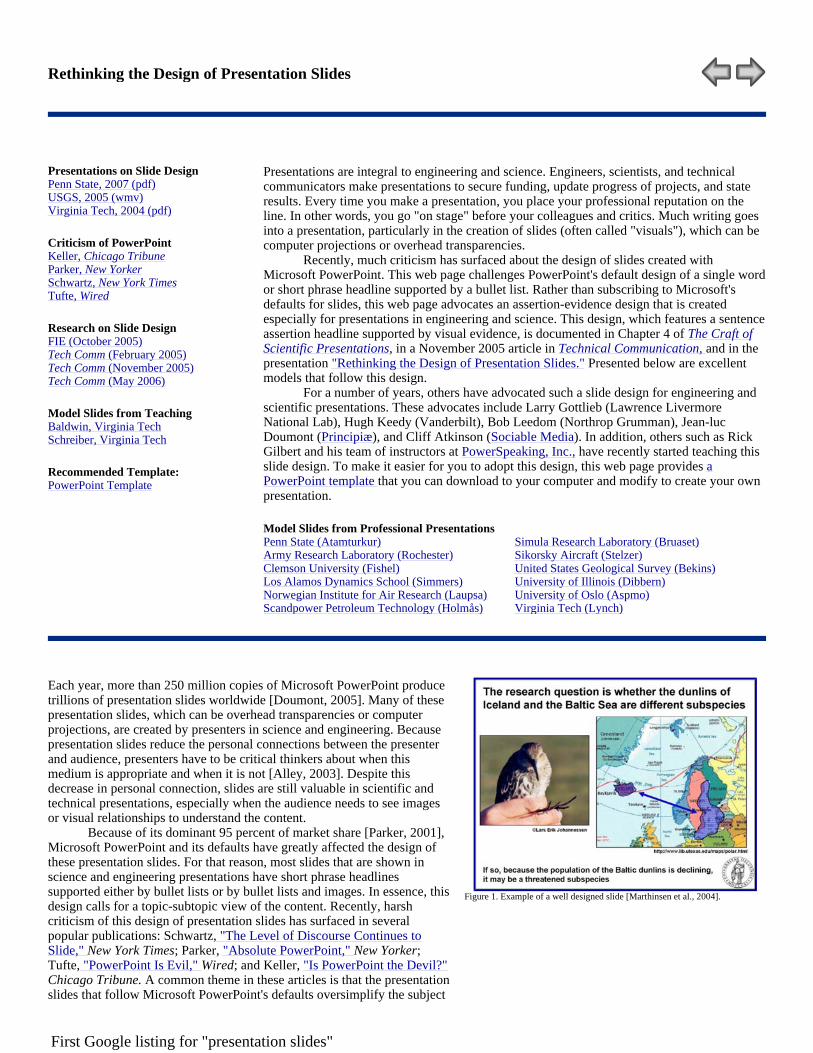
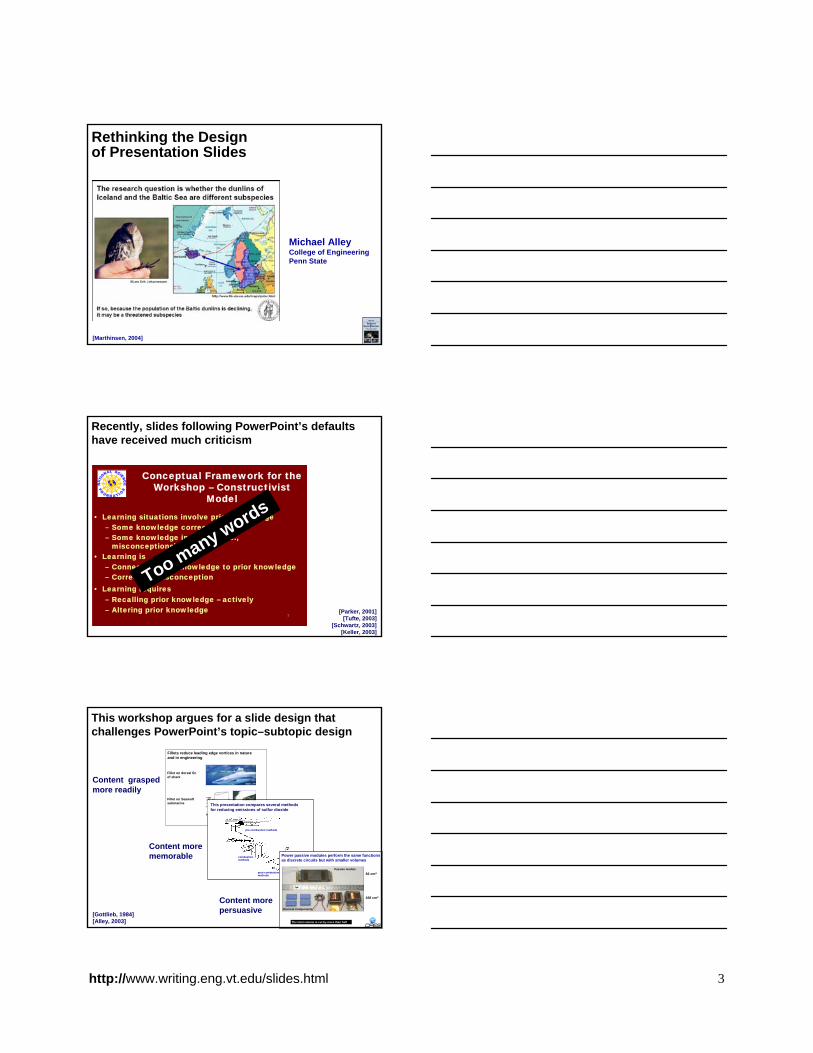
Recently, much criticism has arisen about the design of slides created with Microsoft PowerPoint. This web page challenges PowerPoint's default design of a single word or short phrase headline supported by a bullet list. Rather than subscribing to Microsoft's topic-subtopic design for slides, this web page advocates an assertion-evidence design, which serves presentations that have the purpose of informing and persuading audiences about technical content. This design, which features a sentence-assertion headline supported by visual evidence, is documented in Chapter 4 of The Craft of Scientific Presentations, a November 2005 article in Technical Communication, and the presentation "Rethinking the Design of Presentation Slides."
Three key assumptions exist for using this assertion-evidence design. The first is that slides are an appropriate visual aid for the presentation (too often, slides are projected when no visual aid would better serve the presentation). Second, the success of the presentation hangs on the audience understanding the content. Finally, the primary purpose of the slides is to help the audience understand the content, rather than to provide talking points for the speaker.
For a number of years, others have advocated an assertion-evidence slide design for engineering and scientific presentations. These advocates include Larry Gottlieb (Lawrence Livermore National Lab), Hugh Keedy (Vanderbilt), Bob Leedom (Northrop Grumman), Jean-luc Doumont (Principiæ), and Cliff Atkinson (Sociable Media). In addition, instructors such as Rick Gilbert and his team of trainers at PowerSpeaking, Inc., have recently started teaching this slide design. To make it easier for you to adopt this design, this web page provides a special PowerPoint template that you can download to your computer and modify to communicate your content to your audience. Also, to provide you with models, this web-page presents several professional examples, given below, that follow this design.
Assertion-Evidence Slides: Students Penn State (Atamturkur) University of Oslo (Aspmo) Clemson University (Fishel) University of Illinois (Dibbern) Los Alamos Dynamics School (Simmers) Virginia Tech (Lynch)
Assertion-Evidence Slides: Professionals Sikorsky Aircraft (Stelzer) Army Research Laboratory (Rochester) Norwegian Institute for Air Research (Laupsa) Scandpower Petroleum Technology (Holmås) United States Geological Survey (Bekins) Simula Research Laboratory (Bruaset)
Each year, more than 250 million copies of Microsoft PowerPoint produce trillions of presentation slides worldwide [Doumont, 2005]. Many of these presentation slides, which can be overhead transparencies or computer projections, are created by presenters in science and engineering. Because presentation slides reduce the personal connections between the presenter and audience, presenters have to be critical thinkers about when this medium is appropriate and when it is not [Alley, 2003]. Despite this decrease in personal connection, slides are still valuable in scientific and technical presentations, especially when the audience needs to see images or visual relationships to understand the content.
Because of its dominant 95 percent of market share [Parker, 2001], Microsoft PowerPoint and its defaults have greatly affected the design of these presentation slides. For that reason, most slides that are shown in science and engineering presentations have short phrase headlines supported either by bullet lists or by bullet lists and images. In essence, this design calls for a topic-subtopic view of the content. Recently, harsh criticism of this design of presentation slides has surfaced in several popular publications: Schwartz, "The Level of Discourse Continues to Slide," New York Times; Parker, "Absolute PowerPoint," New Yorker; Tufte, "PowerPoint Is Evil," Wired; and Keller, "Is PowerPoint the Devil?"
Figure 1. Example of a well designed slide [Zess and Thole, 2001].
First Google listing for "presentation slides"
Selected Slides That Reveal a Presentation’s Organization
http://writing.eng.vt.edu/slides.html 2
Atmospheric Mercury Depletion Events (AMDEs) in Polar Regions During Arctic Spring
Katrine AspmoTorunn BergNorwegian Institute for Air Research
Grethe WibetoeUniversity of Oslo, Dept. of Chemistry
June 16, 2004
0
0.5
1
1.5
2
2.5
01.01 02.03 01.05 30.06 29.08 28.10 27.12
ng/m
3
AMDE
Ny-Ålesund, 78°54’ N, 11°53’E, 474 m.a.s.l.
1
Theory for Hg cycling in Arctic springtime
Measurements from Zeppelin Air Monitoring Station
This talk compares theory with measurements and gives the environmental implications
Environmental implications of AMDEs
2
A theory exists for the cycling of mercury during depletion events in the Arctic springtime
[Sunlight, Halogens, O3…]
Hg° HgII
Me-Hg
[Bacteria, …]
HgII
RGM
PM
4
[Lindberg et al., 2002; Steffen et al., 2003]
Springtime measurements from Zeppelin mountain agree well with this theory
Reactive Gaseous Mercury (RGM)
Particulate Mercury (PM)
6
Global warming may increase the extent of AMDEs
Arctic biota show highly elevated Hg levels and are still increasing
10
Hg in polar bears
[Lindberg et al., 2002]Questions?
A significant fraction of the deposited Hg is bio-available
Deposited Hg can be re-emitted
AMDEs can increase as polar climate warms
In summary, AMDEs lead to increased Hg input to Arctic ecosystems
12
0.0
0.5
1.0
1.5
2.0
2.5
10.04.2003 15.04.2003 20.04.2003 25.04.2003 30.04.2003 05.05.2003 10.05.2003
GEM
(ng/
m3 )
0
20
40
60
80
100
120
Tota
l Hg
in s
urfa
ce s
now
(ng/
l)
Hg in surface snow GEM

Selected Slides That Reveal a Presentation’s Organization
3http://writing.eng.vt.edu/slides.html
Modifying a Self-Sensing Circuit to Increase the Stability of Vibration Control
Eddie SimmersJeff HodgkinsDavid Mascarenas
Mentors:Gyuhae ParkHoon Sohn
Dynamics Summer SchoolLos Alamos, New Mexico
This talk presents modifications made to a bridge circuit to increase control stability
Experimental Verification
Analytical Modeling
⎥⎥⎥⎥⎥⎥⎥⎥⎥
⎦
⎤
⎢⎢⎢⎢⎢⎢⎢⎢⎢
⎣
⎡
−−−−
−−−−=
4200024000
0320002300
0022000220
0001200021
10000000010000000010000000010000
ζωωζωω
ζωωζωωA
3
Analytical Simulation
The piezo-beam, self-sensing bridge, and feedback control were modeled analytically
ZP
Zeq
Zm
Circuit/PPF transfer functions were calculated using impedance
Bridge was modeled with piezoelectric constitutive and dynamic beam equations
4
A simulation was developed to identify how CP and Cm related to stability
CP<Cm
CP=Cm
CP>Cm
6
The simulation results were verified experimentally by using an aluminum cantilever beam
10
Two new design schemes have increased control stability
Schemes can become more effective, but at the cost of increased power
Both new design schemes were validated experimentally
In summary, we quantified dynamic characteristics of the self-sensing actuation for the first time
13
Questions?
0
2
4
6
8
10
12
14
16
No AddedCapacitor
Capacitor inSeries
Capacitor inParallel
Percentage above Cm forinstability
Settling time at Cp 10% <Cm (s)
Selected Slides That Reveal a Presentation’s Organization
http://writing.eng.vt.edu/slides.html 4
Manning StelzerCURE / EngineeringSikorsky Aircraft
April 30, 2004
70302-10915-104 Ice Detector
Failure Analysis of an Ice Detector in the Austria 13 Helicopter
Bench testing in Sikorsky QA Lab confirmed the malfunction during performance of the Austria 13
Failed step 5.4.1: Probe heater of ice detector
2
This talk presents the root cause of malfunctions of an ice detector removed from the Austria 13
Teardown Examination
Determination of Root Cause
3
Close examination revealed wire in contact with housing and exposed wire at point of contact
Photo shows that wire in contact with housing
Microscopic photography reveals abraded insulation
6
Material transferred from conductor to housing confirms abrasion and therefore short circuit
Abraded wire insulation exposing conductor
Copper from wire transferred to housing at point of abrasion
7
In summary, the unit failed because of a short-circuit created by abrasion of wire insulation
Questions?
Wires not harnessed to prevent contact with housing
Wire abraded against housing, exposing conductor
Short circuit to ground created where wire contacted housing
8
Exercise: Create a title slide that follows the assertion–evidence design
5http://writing.eng.vt.edu/slides.html
Example
Your Slide
Atmospheric Mercury Depletion Events in Polar Regions During Arctic Spring
Katrine AspmoTorunn BergNorwegian Institute for Air Research
Grethe WibetoeUniversity of Oslo, Dept. of Chemistry
June 16, 2004
0
0.5
1
1.5
2
2.5
01.01 02.03 01.05 30.06 29.08 28.10 27.12
ng/m
3
Event
Ny-Ålesund, 78°54’ N, 11°53’E

Exercise: Create a mapping slide that follows the assertion–evidence design
6http://writing.eng.vt.edu/slides.html
Example
Your Slide
[Schmidt, 1989]
Three classes of methods exist forreducing emissions of sulfur dioxide
post-combustionmethods
combustionmethods
pre-combustion methods
This presentation compares methods for reducing emissions of sulfur dioxide from coal power plants

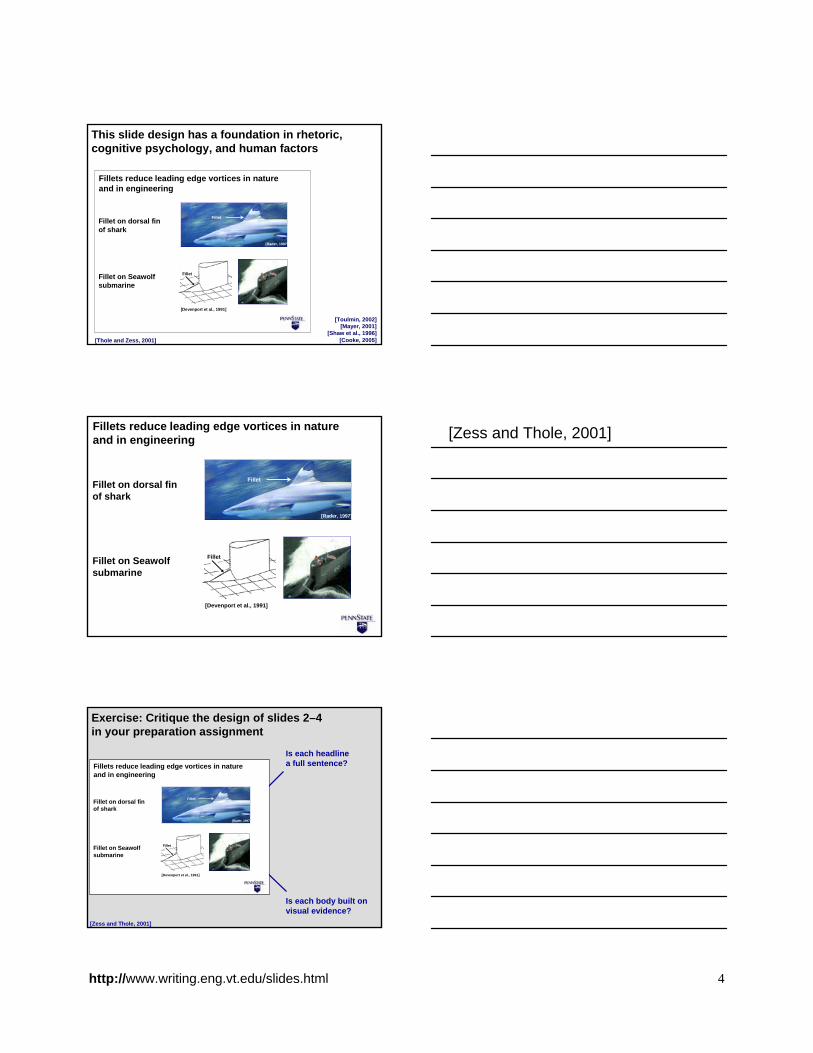
Exercise: Create a body slide that follows the assertion–evidence design
7http://writing.eng.vt.edu/slides.html
Example
Your Slide
[Zess and Thole, 2001]
Fillet on dorsal fin of shark
Fillet on Seawolfsubmarine
Fillet
Fillet
[Devenport et al., 1991]
[Rader, 1997]
Fillets reduce leading edge vortices in nature and in engineering


A C C I D E N T I N V E S T I G A T I O N B O A R D
COLUMBIAA C C I D E N T I N V E S T I G A T I O N B O A R D
COLUMBIA
1 9 0 R e p o r t V o l u m e I A u g u s t 2 0 0 3 1 9 1R e p o r t V o l u m e I A u g u s t 2 0 0 3
The Debris Assessment Team presented its analysis in a formal briefing to the Mission Evaluation Room that relied on Power-Point slides from Boeing. When engineering analyses and risk assessments are condensed to fit on a standard form or overhead slide, information is inevitably lost. In the process, the prior-ity assigned to information can be easily misrepresented by its placement on a chart and the language that is used. Dr. Edward Tufte of Yale University, an expert in information presentation who also researched communications failures in the Challenger accident, studied how the slides used by the Debris Assessment Team in their briefing to the Mission Evaluation Room misrep-resented key information.38
The slide created six levels of hierarchy, signified by the title and the symbols to the left of each line. These levels prioritized information that was already contained in 11 simple sentences. Tufte also notes that the title is confusing. “Review of Test Data Indicates Conservatism” refers not to the predicted tile damage, but to the choice of test models used to predict the damage.
Only at the bottom of the slide do engineers state a key piece of information: that one estimate of the debris that struck Columbia was 640 times larger than the data used to calibrate the model on which engineers based their damage assessments. (Later analy-sis showed that the debris object was actually 400 times larger). This difference led Tufte to suggest that a more appropriate headline would be “Review of Test Data Indicates Irrelevance of Two Models.” 39
Tufte also criticized the sloppy language on the slide. “The vaguely quantitative words ʻsignificant ̓and ʻsignificantly ̓are used 5 times on this slide,” he notes, “with de facto meanings ranging from ʻdetectable in largely irrelevant calibration case study ̓to ʻan amount of damage so that everyone dies ̓to ʻa dif-ference of 640-fold. ̓” 40 Another example of sloppiness is that “cubic inches” is written inconsistently: “3cu. In,” “1920cu in,” and “3 cu in.” While such inconsistencies might seem minor, in highly technical fields like aerospace engineering a misplaced decimal point or mistaken unit of measurement can easily engender inconsistencies and inaccuracies. In another phrase “Test results do show that it is possible at sufficient mass and velocity,” the word “it” actually refers to “damage to the protec-tive tiles.”
As information gets passed up an organization hierarchy, from people who do analysis to mid-level managers to high-level leadership, key explanations and supporting information is fil-tered out. In this context, it is easy to understand how a senior manager might read this PowerPoint slide and not realize that it addresses a life-threatening situation.
At many points during its investigation, the Board was sur-prised to receive similar presentation slides from NASA offi-cials in place of technical reports. The Board views the endemic use of PowerPoint briefing slides instead of technical papers as an illustration of the problematic methods of technical com-munication at NASA.
Review Of Test Data Indicates Conservatism for TilePenetration
The existing SOFI on tile test data used to create Crater was reviewed along with STS-107 Southwest Research data
•– Crater overpredicted penetration of tile coating
significantly• Initial penetration to described by normal velocity
Varies with volume/mass of projectile(e.g., 200ft/sec for3cu. In)
• Significant energy is required for the softer SOFI particle to penetrate the relatively hard tile coating
Test results do show that it is possible at sufficient massand velocity
• Conversely, once tile is penetrated SOFI can cause significant damage
Minor variations in total energy (above penetration level)can cause significant tile damage
– Flight condition is significantly outside of test database • Volume of ramp is 1920cu in vs 3 cu in for test
The vaguely quantitative words "significant" and"significantly" are used 5 times on this slide, with de factomeanings ranging from "detectable in largely irrelevantcalibration case study" to "an amount of damage so thateveryone dies" to "a difference of 640-fold." None ofthese 5 usages appears to refer to the technical meaningof "statistical significance."
The low resolution of PowerPoint slides promotesthe use of compressed phrases like "Tile Penetration."As is the case here, such phrases may well be ambiquous.(The low resolution and large font generate 3 typographicorphans, lonely words dangling on a seperate line.)
This vague pronoun reference "it" alludes to damageto the protective tiles,which caused the destruction of theColumbia. The slide weakens important material withambiquous language (sentence fragments, passive voice,multiple meanings of "significant"). The 3 reportswere created by engineers for high-level NASA officials who were deciding whether the threat of wing damagerequired further investigation before the Columbiaattempted return. The officials were satisfied that thereports indicated that the Columbia was not in danger,and no attempts to further examine the threat weremade. The slides were part of an oral presentation andalso were circulated as e-mail attachments.
In this slide the same unit of measure for volume(cubic inches) is shown a different way every time
3cu. in 1920cu. in 3 cu. inrather than in clear and tidy exponential form 1920 in3.Perhaps the available font cannot show exponents.Shakiness in units of measurement provokes concern.Slides that use hierarchical bullet-outlines here do nothandle statistical data and scientific notation gracefully.If PowerPoint is a corporate-mandated format for allengineering reports, then some competent scientifictypography (rather than the PP market-pitch style) isessential. In this slide, the typography is so choppy andclunky that it impedes understanding.
2/21/03 6
The analysis by Dr. Edward Tufte of the slide from the Debris Assessment Team briefing. [SOFI=Spray-On Foam Insulation]
ENGINEERING BY VIEWGRAPHS