executive summary wind vision - department of energy · wind vision: a new era for wind power in...
TRANSCRIPT
Wind Vision:A New Era for Wind Power
in the United States
Executive Summary

Table of Contents ii
Table of ContentsMessage from the Director ..................................................................................................................................... xiii
Acronyms .......................................................................................................................................................................xv
Executive Summary: Overview ...........................................................................................................................xxiii
Executive Summary: Key Chapter Findings ..................................................................................................xxviiES.1 Introduction ........................................................................................................................................................................xxvii
ES.1.1 Project Perspective and Approach ......................................................................................................................xxviiES.1.2 Understanding the Future Potential for Wind Power ....................................................................................xxixES.1.3 Defining a Credible Scenario to Calculate Costs, Benefits, and Other Impacts .....................................xxxi
ES.2 State of the Wind Industry: Recent Progress, Status and Emerging Trends ................................................xxxivES.2.1 Wind Power Markets and Economics ................................................................................................................xxxvES.2.2 National Social and Economic Impacts of Wind ..........................................................................................xxxviES.2.3 Wind Technology, Manufacturing, and Logistics .........................................................................................xxxviiES.2.4 Wind Integration and Delivery .......................................................................................................................xxxviiiES.2.5 Wind Deployment: Siting, Regulation, and Collaboration ........................................................................xxxix
ES.3 Costs, Benefits, and Other Impacts of the Study Scenario ..................................................................................... xlES.3.1 Wind Industry and Electric Sector Impacts .......................................................................................................... xlES.3.2 Costs of the Wind Vision Study Scenario ............................................................................................................ xlvES.3.3 Benefits of the Study Scenario ............................................................................................................................. xlviES.3.4 Additional Impacts Associated with the Study Scenario .............................................................................. xlixES.3.5 Impacts Specific to Offshore and Distributed Wind ...........................................................................................li
ES.4 The Wind Vision Roadmap: A Pathway Forward ..........................................................................................................liES.4.1 Core Roadmap Actions ................................................................................................................................................liiES.4.2 Risk of Inaction ............................................................................................................................................................ lvi
ES.5 Conclusions ........................................................................................................................................................................... lviES.5.1 The Opportunity ........................................................................................................................................................... lviES.5.2 The Challenge ............................................................................................................................................................. lviiES.5.3 Moving Forward ......................................................................................................................................................... lvii
1 Introduction to the Wind Vision ............................................................................................................................ 11.0 Wind Vision—Historical Context ........................................................................................................................................... 3
1.1 Key Trends Motivating the Wind Vision ..........................................................................................................................................61.1.1 Wind Business Evolution .................................................................................................................................................. 61.1.2 Electric Sector Evolution ................................................................................................................................................ 61.1.3 Wind Manufacturing Sector Impacts .......................................................................................................................... 71.1.4 Economic and Environmental Impacts ....................................................................................................................... 7
1.2 Understanding the Future Potential for Wind Power .................................................................................................... 8
1.3 Defining a Scenario for Calculating Costs, Benefits, and Other Impacts ................................................................. 11
1.4 Project Implementation .........................................................................................................................................................14
1.5 Report Organization ................................................................................................................................................................ 15
Chapter 1 References ......................................................................................................................................................................16
Tabl
e of
Con
tent
s
iii
2 Wind Power in the United States .......................................................................................................................212.0 Introduction ............................................................................................................................................................................. 23
2.1 Wind Power Markets and Economics ................................................................................................................................262.1.1 Global Market Trends ......................................................................................................................................................262.1.2 Domestic Market Trends ............................................................................................................................................... 272.1.3 Domestic Cost and Pricing Trends ............................................................................................................................292.1.4 U.S. Electricity Supply and Demand ........................................................................................................................342.1.5 Market Drivers and Policy ............................................................................................................................................382.1.6 Conclusions ..................................................................................................................................................................... 40
2.2 Offshore Wind ....................................................................................................................................................................... 402.2.1 Status of the Offshore Industry ................................................................................................................................. 402.2.2 Offshore Costs .................................................................................................................................................................412.2.3 Offshore Deployment and Siting ..............................................................................................................................422.2.4 Conclusions .....................................................................................................................................................................46
2.3 Distributed Wind ....................................................................................................................................................................462.3.1 Conclusions ......................................................................................................................................................................49
2.4 Economic and Social Impacts of Wind for the Nation ................................................................................................502.4.1 GHG Emissions ................................................................................................................................................................502.4.2 Economic Development ...............................................................................................................................................512.4.3 Workforce ........................................................................................................................................................................ 522.4.4 Air Pollution Impacts....................................................................................................................................................552.4.5 Water Use ........................................................................................................................................................................552.4.6 Risk and Diversity..........................................................................................................................................................562.4.7 Conclusions ..................................................................................................................................................................... 57
2.5 Wind Technology and Performance .................................................................................................................................582.5.1 U.S. Wind Power Resource and Resource Characterization ............................................................................. 602.5.2 Wind Plant Technology Status ..................................................................................................................................622.5.3 Wind Plant Performance and Reliability.................................................................................................................682.5.4 Aftermarket Upgrades and Repowering ................................................................................................................ 722.5.5 Offshore Technology .................................................................................................................................................... 722.5.6 Conclusions .....................................................................................................................................................................76
2.6 Supply Chain, Manufacturing, and Logistics .................................................................................................................. 772.6.1 Manufacturing Capacity and Demand...................................................................................................................... 772.6.2 Transportation and Design Impacts .........................................................................................................................792.6.3 Installation ........................................................................................................................................................................812.6.4 Conclusions .....................................................................................................................................................................83
2.7 Wind Integration and Delivery ...........................................................................................................................................832.7.1 Wind Integration Studies ..............................................................................................................................................842.7.2 Operational Experience ................................................................................................................................................862.7.3 Flexibility .........................................................................................................................................................................882.7.4 Transmission System Capacity ................................................................................................................................ 902.7.5 Industry Organizations are Addressing Wind Integration .................................................................................932.7.6 Conclusions ......................................................................................................................................................................94
2.8 Wind Siting, Permitting, and Deployment ......................................................................................................................952.8.1 Public Acceptance and Environmental Concerns .................................................................................................962.8.2 Regulatory Environment ........................................................................................................................................... 1072.8.3 Conclusions ................................................................................................................................................................... 108
Tabl
e of
Con
tent
s
Table of Contents
iv
2.9 Collaboration, Education, and Outreach ....................................................................................................................... 1092.9.1 Federal ............................................................................................................................................................................. 1092.9.2 State ................................................................................................................................................................................ 1092.9.3 NGO Activities ............................................................................................................................................................... 1102.9.4 Regional Organizations .............................................................................................................................................. 1102.9.5 Collaborative Efforts .................................................................................................................................................... 1102.9.6 Industry Activities ........................................................................................................................................................ 1102.9.7 International Collaboration ..........................................................................................................................................1112.9.8 Conclusions ......................................................................................................................................................................111
Chapter 2 References ....................................................................................................................................................................112
3 Impacts of the Wind Vision ............................................................................................................................... 1293.0 Introduction ............................................................................................................................................................................ 141
3.1 Impacts Assessment Methods and Scenarios ............................................................................................................... 1423.1.1 Regional Energy Deployment System (ReEDS) Model ...................................................................................... 1423.1.2 Model Outputs to Assess the Impacts of the Wind Vision ............................................................................... 1443.1.3 Scenario Framework .................................................................................................................................................... 145
3.2 Summary of ReEDS Inputs ................................................................................................................................................ 1483.2.1 Wind Power Technologies.......................................................................................................................................... 1483.2.2 Other Renewable Power .............................................................................................................................................1533.2.3 Non-Renewable Power Technologies .................................................................................................................... 1543.2.4 Market Variables .......................................................................................................................................................... 1543.2.5 Policy Assumptions ..................................................................................................................................................... 1563.2.6 Summary of Inputs ......................................................................................................................................................157
3.3 Wind Capacity Additions and Investment ..................................................................................................................... 1613.3.1 Capacity Additions ........................................................................................................................................................ 1613.3.2 Distribution of Capacity ............................................................................................................................................. 1623.3.3 Wind Capital and Operating Expenditures .......................................................................................................... 164
3.4 Economic Impacts ............................................................................................................................................................... 1653.4.1 National Average Retail Electricity Price Impacts .............................................................................................. 1653.4.2 Present Value of Total System Cost ....................................................................................................................... 168
3.5 Electricity Sector Impacts .................................................................................................................................................. 1703.5.1 Evolution of the Electricity Sector under the Study Scenario ...........................................................................171
3.5.2 Comparing the Electric Sector under the Study Scenario and Baseline Scenario ..........................................1723.5.3 The Evolution of the Electricity Sector is Dependent on Future Fuel Prices ............................................174
3.6 Transmission and Integration Impacts ............................................................................................................................1743.6.1 Integrating Variable and Uncertain Wind Energy ................................................................................................1753.6.2 Transmission Expansion Needed to Support the Wind Vision .......................................................................179
3.7 Greenhouse Gas Emissions Reductions .......................................................................................................................... 1813.7.1 Wind Energy Reduces GHG Emissions ....................................................................................................................1823.7.2 Economic Benefits of Wind Energy in Limiting Climate Change Damages ............................................... 184
3.8 Air Pollution Impacts ........................................................................................................................................................... 1883.8.1 Methods ........................................................................................................................................................................... 1903.8.2 Air Pollution Benefits of Wind Energy ................................................................................................................... 191
Tabl
e of
Con
tent
s
Table of Contents
vv
3.9 Water Usage Reduction ..................................................................................................................................................... 1963.9.1 Wind Energy Reduces National Water Usage .....................................................................................................1973.9.2 Regional Water Usage Trends ................................................................................................................................. 1993.9.3 Economic and Environmental Considerations of Water Use Reduction ....................................................200
3.10 Energy Diversity and Risk Reduction ........................................................................................................................... 2013.10.1 Reducing Uncertainty in Electric System Costs ................................................................................................ 2023.10.2 Wind and Natural Gas: Competitors and Partners in the Electric Sector ................................................ 204
3.11 Workforce and Economic Development Impacts .................................................................................................... 2073.11.1 Methods and Assumptions ....................................................................................................................................... 2073.11.2 Gross Employment and Economic Development Impacts ............................................................................ 2093.11.3 Occupational Needs ....................................................................................................................................................212
3.12 Local Impacts ........................................................................................................................................................................2123.12.1 Local Economic Development Impacts ................................................................................................................2133.12.2 Land and Offshore Use .............................................................................................................................................2133.12.3 Wildlife Impacts .......................................................................................................................................................... 2163.12.4 Aviation Safety and Radar Impacts .......................................................................................................................2173.12.5 Aesthetics and Public Acceptance .........................................................................................................................2183.12.6 Potential Health and Safety Impacts .....................................................................................................................218
3.13 Unique Benefits of Offshore and Distributed Wind .................................................................................................. 2193.13.1 Offshore Wind .............................................................................................................................................................. 2193.13.2 Distributed Wind .........................................................................................................................................................221
Chapter 3 References ..................................................................................................................................................................223
4 The Wind Vision Roadmap: A Pathway Forward .................................................................................... 2454.0 Introduction .......................................................................................................................................................................... 248
4.1 Wind Power Resources and Site Characterization ......................................................................................................253
4.2 Wind Plant Technology Advancement ..........................................................................................................................255
4.3 Supply Chain, Manufacturing, and Logistics ............................................................................................................... 260
4.4 Wind Power Performance, Reliability, and Safety..................................................................................................... 264
4.5 Wind Electricity Delivery and Integration ....................................................................................................................267
4.6 Wind Siting and Permitting ..............................................................................................................................................275
4.7 Collaboration, Education, and Outreach .......................................................................................................................279
4.8 Workforce Development .....................................................................................................................................................281
4.9 Policy Analysis ......................................................................................................................................................................283
Chapter 4 References................................................................................................................................................................. 286
Tabl
e of
Con
tent
s
Table of Contents

vi vi
List of FiguresFigure ES.1-1. Wind generation and average new capacity additions under BAU ............................................................................. xxx
Figure ES.1-2. Wind Vision Study Scenario relative to BAU and sensitivities .......................................................................................xxxi
Figure ES.1-3. The Wind Vision Study Scenario and Baseline Scenario ...............................................................................................xxxiii
Figure ES.2-1. Utility-scale wind deployment through 2013 ....................................................................................................................xxxiv
Figure ES.2-2. Wind power progress since the 2008 DOE Report, 20% Wind Energy by 2030 ..................................................xxxv
Figure ES.2-3. Historical wind deployment variability and the PTC ......................................................................................................xxxvi
Figure ES.2-4. Estimated emissions and water savings resulting from wind generation in 2013 ................................................xxxvii
Figure ES.2-5. Wind technology scale-up trends and the levelized cost of electricity ..................................................................xxxviii
Figure ES.3-1. Historical and forward-looking wind power capacity in the Central Study Scenario ................................................ xli
Figure ES.3-2. Study Scenario distribution of wind capacity by state in 2030 and 2050 .................................................................. xlii
Figure ES.3-3. Summary of wind industry and other electric sector impacts in the Central Study Scenario .............................. xliii
Figure ES.3-4. Lifecycle GHG emissions in the Central Study Scenario and Baseline Scenario ........................................................ xlvi
Figure ES.3-5. Change in water consumption used in electricity generation from 2013 to 2050 for the Baseline Scenario and Central Study Scenario ................................................................................................................... xlvii
Figure ES.3-6. Monetized impacts of the Study Scenario relative to the Baseline Scenario in 2020, 2030, and 2050 ............... xlviii
Figure ES.3-7. Cumulative (2013-2050) present value of monetized impacts of the Study Scenario relative to the Baseline Scenario ........................................................................................................................................................... xlviii
Figure ES.3-8. Summary of costs, benefits, and other outcomes associated with the Study Scenario relative to the Baseline Scenario by 2050 .................................................................................................................................................l
Figure 1–1. Historical wind deployment variability and the PTC ............................................................................................................. 3
Figure 1–2. Wind power progress since the 2008 DOE report, 20% Wind Energy by 2030 ........................................................... 5
Figure 1–3. Wind generation and average new capacity additions under BAU .................................................................................10
Figure 1–4. Wind Vision Study Scenario relative to BAU Scenario and Sensitivities .......................................................................... 11
Figure 1–5. Wind penetration levels studied in recent literature ............................................................................................................ 12
Figure 1–6. The Wind Vision Study Scenario and Baseline Scenario ...................................................................................................... 13
Figure 2-1. Global cumulative installed wind capacity, 1996–2013 .......................................................................................................26
Figure 2-2. Global trends in wind power investment, 2004–2013 ........................................................................................................ 27
Figure 2-3. U.S. installed wind capacity, 1999–2013 .................................................................................................................................. 27
Figure 2-4. U.S. utility-scale wind power capacity and share of in-state generation, year-end 2013.........................................28
Figure 2-5. Relative contribution of generation types in U.S. capacity additions, 2000–2013 ....................................................28
Figure 2-6. Average LCOE in good to excellent wind sites ......................................................................................................................30
Figure 2-7. Generation-weighted average, levelized wind PPA prices by PPA execution date and region ...............................31
Figure 2-9. Installed wind power project costs over time ........................................................................................................................ 32
Figure 2-8. Components of installed capital cost for a land-based, utility-scale reference wind turbine................................. 32
Figure 2-10. Cost of 15-year debt and tax equity for utility-scale wind projects over time ............................................................ 33
Figure 2-11. AEO projected load growth cases vs. actual ........................................................................................................................34
Figure 2-12. Natural gas and coal prices and projections from two AEO Reference Cases ........................................................... 35
Figure 2-13. Historical and projected U.S. electricity generation by fuel in AEO Reference Case 2014 ...................................... 35
Figure 2-14. Actual natural gas prices and AEO forecasts ......................................................................................................................36
Figure 2-15. Historical wind deployment variability and the PTC ...........................................................................................................38
Figure 2-16. BOEM-defined wind energy areas for the Eastern seaboard as of November 2013 ................................................45
Figure 2-17. Distributed wind system applications in relation to centralized power generation...................................................48
Tabl
e of
Con
tent
s
List of Figures

vii
Tabl
e of
Con
tent
s Figure 2-18. Fire Island 17.6-MW project in Alaska .......................................................................................................................................49
Figure 2-19. Economic ripple effects of wind development ......................................................................................................................51
Figure 2-20. Active wind-related manufacturing facilities and wind projects in 2013 ...................................................................... 53
Figure 2-21. Types of jobs supporting wind power development, 2007–2013 .................................................................................... 53
Figure 2-22. Types of institutions offering wind power programs .......................................................................................................... 53
Figure 2-23. Estimated emissions and water savings resulting from wind generation in 2013 ...................................................... 57
Figure 2-24. Illustration of components in a typical MW-scale wind turbine.......................................................................................59
Figure 2-25. Annual average U.S. land-based and offshore wind speed at 100 m above the surface ..........................................61
Figure 2-26. Wind technology scale-up trends and the levelized cost of electricity .........................................................................63
Figure 2-27. Characteristics of utility-scale land-based wind turbines 1998–2013 .............................................................................63
Figure 2-28. Turbine blade diagram ..................................................................................................................................................................65
Figure 2-29. Wind plant controls, including LIDAR sensor signals for feed-forward control and integrated wind plant control ..........................................................................................................................................................................67
Figure 2-30. Wind project capacity-weighted average capacity factors for 2013 by commercial operation date for project vintages 1998–2012 ........................................................................................................................................69
Figure 2-31. Average turbine size, rotor size, and hub height for commercial offshore wind plants ........................................... 73
Figure 2-32. Technology trends in offshore wind turbines, 2000–2016 ................................................................................................ 74
Figure 2-33. Characteristics of offshore wind projects in Europe, 2013................................................................................................. 74
Figure 2-34. Illustrations of three classes of floating wind turbine technology .................................................................................. 75
Figure 2-35. Elements of the U.S. wind power supply chain mapped to sections in this report.................................................... 77
Figure 2-36. Domestic wind turbine nacelle assembly, blade, and tower manufacturing capacity vs. U.S. wind turbine installations ............................................................................................................................................................ 78
Figure 2-37. Rotor diameter and hub height trends of wind turbines, 2011–2013 ..............................................................................80
Figure 2-38. Example of wind turbine blades transportation obstacles .................................................................................................81
Figure 2-39. Estimates of trucking and capital costs for conventional tubular towers, 2013 .........................................................82
Figure 2-40. Flowchart of a full wind integration study..............................................................................................................................85
Figure 2-41. Key grid operating areas experiencing high instantaneous contributions from wind, 2012–2013 ........................88
Figure 2-42. Characteristics that help facilitate wind power integration .............................................................................................90
Figure 2-43. Utility-scale wind deployment through 2013 .........................................................................................................................95
Figure 3-1. Historical and forward-looking wind power capacity in the Central Study Scenario ................................................131
Figure 3-2. Study Scenario distribution of wind capacity by state in 2030 and 2050 ..................................................................132
Figure 3-3. Summary of wind industry and other electric sector impacts in the Central Study Scenario ...............................133
Figure 3-4. Change in annual generation between the Central Baseline Scenario and the Central Study Scenario by technology type...................................................................................................................................................................... 134
Figure 3-5. Life-cycle GHG emissions in the Central Study Scenario and Baseline Scenario .......................................................135
Figure 3-6. Change in water consumption used in electricity generation from 2013 to 2050 for the Baseline Scenario and Central Study Scenario .....................................................................................................................136
Figure 3-7. Monetized impacts of the Study Scenario relative to the Baseline Scenario in 2020, 2030, and 2050 ..................137
Figure 3-8. Cumulative (2013–2050) present value of monetized impacts of the Study Scenario relative to the Baseline Scenario ...................................................................................................................................................................137
Figure 3-9. Summary of costs, benefits, and other outcomes associated with the Central Study Scenario relative to the Baseline Scenario by 2050 .............................................................................................................................139
Figure 3-10. Wind penetration levels for the Study Scenario ................................................................................................................. 145
Figure 3-11. Study Scenario and Baseline Scenario framework with associated sensitivities ...................................................... 146
Figure 3-12. Land-based wind changes in LCOE by sensitivity (2014–2050, Interior region) ...................................................... 149
Figure 3-13. Offshore wind changes in LCOE by sensitivity (2014–2050) ..........................................................................................152
Figure 3-14. Combined land-based and offshore wind resource supply curve, based on estimated costs in 2012 ....................153
List of Figures

viii
Tabl
e of
Con
tent
s
List of Figures
Figure 3-15. Estimated age-based and announced cumulative retirements and retirements by share of the operating fleet ........................................................................................................................................................................155
Figure 3-16. Base coal and natural gas fuel cost trajectories applied in the Wind Vision .............................................................. 156
Figure 3-17. Historical and forward-looking wind power capacity in the Central Study Scenario ................................................161
Figure 3-18. Study Scenario distribution of wind capacity by state in 2030 and 2050 ..................................................................163
Figure 3-19. Wind industry investments by market segment in the Central Study Scenario ........................................................ 164
Figure 3-20. National average retail electricity price trajectories for the Study Scenario and Baseline Scenario (across sensitivities) ................................................................................................................................................................... 166
Figure 3-21. Incremental average electricity prices in Study Scenario sensitivities relative to the Baseline Scenario ................167
Figure 3-22. Present value of total system cost for the Baseline Scenario and Study Scenario (across sensitivities) .......... 169
Figure 3-23. Incremental system costs of Study Scenario sensitivities relative to the Baseline Scenario ................................. 170
Figure 3-24. Annual generation and installed capacity by technology type and year under the Central Study Scenario ..............171
Figure 3-25. Difference in annual generation between the Central Study Scenario and Baseline Scenario by technology type.......................................................................................................................................................................173
Figure 3-26. Regional annual wind penetration for 2030 and 2050 under the Central Study Scenario .....................................177
Figure 3-27. Cumulative transmission expansion under the Baseline Scenario and Study Scenario ...........................................179
Figure 3-28. New (2013–2050) transmission expansion under the Central Baseline Scenario and Study Scenario............... 180
Figure 3-29. Greenhouse gas emissions in the Central Study Scenario and Baseline Scenario .....................................................182
Figure 3-30. Summary of systematic review of estimates of life-cycle GHG emissions from electricity generation technologies .............................................................................................................................................................183
Figure 3-31. IWG social cost of carbon estimates ...................................................................................................................................... 186
Figure 3-32. Estimated benefits of the Study Scenario due to avoided climate change damages ............................................. 186
Figure 3-33. Range of health-related costs from air pollutant emissions from electricity generation technologies ............. 189
Figure 3-34. Electric sector SO2, NOX, and PM2.5 emissions in Study and Baseline Scenarios ........................................................192
Figure 3-35. Estimated benefits of the Study Scenario due to reduced SO2, NOX, and PM2.5 emissions .....................................192
Figure 3-36. Water use rates for various types of power plants ............................................................................................................ 196
Figure 3-37. Electric sector water withdrawals for the Central Study Scenario and Baseline Scenarios (2012–2050), and by fuel type and cooling system .......................................................................................................... 198
Figure 3-38. Electric sector water consumption for the Study and Baseline Scenarios from 2012 to 2050, and by fuel type and cooling system .............................................................................................................................................. 198
Figure 3-39. Percentage change in water withdrawals in 2050 compared with 2012 for the Baseline and Study Scenarios ............................................................................................................................................................................ 199
Figure 3-40. Percentage change in water consumption in 2050 compared with 2012 for the Baseline Scenario and the Study Scenario ........................................................................................................................................................200
Figure 3-41. Electric system cost variability under a range of fuel price scenarios ........................................................................ 202
Figure 3-42. Reduction in demand for, and price of, fossil fuels under the Study Scenario ......................................................... 204
Figure 3-43. Qualitative framework for evaluating investment in new natural gas or wind projects by risk source, magnitude, and time scale ................................................................................................................................ 206
Figure 3-44. Factors that could increase or decrease domestic content of wind equipment installed in the United States .................................................................................................................................................................... 208
Figure 3-45. Wind-related gross employment estimates, including on-site, supply chain, and induced jobs: 2012–2050 ........................................................................................................................................................... 210
Figure 3-46. Wind-related employment estimates for land-based and offshore wind ................................................................... 210
Figure 3-47. Estimated on-site wind project employment, 2050 ...........................................................................................................213
Figure 3-48. Land-based and offshore area requirements for Study Scenario, 2030 ......................................................................215
Figure 3-49. Land-based and offshore area requirements for Study Scenario, 2050 ......................................................................215
Figure 4–1. Increased balancing area size and faster scheduling reduce regulation requirements. .........................................272

ixix
List of TablesTable ES.1-1. Modeling Inputs and Assumptions in Business-as-Usual Scenario Modeling,, .........................................................xxix
Table ES.1-2. Wind Penetration (% share of end-use demand) in BAU Scenario, BAU Sensitivities, and the Study Scenario .......................................................................................................................................................xxxii
Table ES.3-1. Transmission Impacts in the Central Study Scenario ........................................................................................................ xliv
Table ES.3-2. Change in Electricity Prices for the Study Scenario Relative to the Baseline Scenario .......................................... xlv
Table ES.3-3. Health Benefits in 2050 of Reduced Air Pollution in the Central Study Scenario ...................................................xlvi
Table ES.4-1. Roadmap Strategic Approach .....................................................................................................................................................liii
Table 1–1. Trends in Global Wind Capacity Additions ................................................................................................................................7
Table 1–2. Modeling Inputs and Assumptions in Business-as-Usual Scenario Modeling ................................................................ 9
Table 1–3. Wind Penetration (% Share of End-Use Demand) in the BAU Scenario, BAU Sensitivities, and the Study Scenario ...................................................................................................................................................................10
Table 2-1. EPA Rules under Development in 2014 Affecting Power Plants ...................................................................................... 37
Table 2-2. U.S. Small Wind Turbine Manufacturers’ Exports and Domestic Sales ..........................................................................47
Table 2-3. U.S. Employment Linked to Wind Power Development ..................................................................................................... 52
Table 2-4. U.S. Wind Power Technical Resource Potential .....................................................................................................................60
Table 2-5. Aggregated Utility-Scale Wind Turbine Downtime by Turbine Subsystem for 2007 and 2012 .............................70
Table 2-6. Crawler Crane Availability in 2013 Relative to Wind Turbine Hub Heights ...................................................................82
Table 2-7. Estimated Wind Curtailment by Area in GWh (and as a Percentage of Potential Wind Generation) ..................92
Table 2-8. Estimated Annual Bird Mortality Rates from Collisions with Engineered Structures ................................................97
Table 3-1. Transmission Impacts in the Central Study Scenario...................................................................................................... 134
Table 3-2. Example Economic and Health Benefits from Reduced Air Pollution in the Central Study Scenario Relative to the Baseline Scenario........................................................................................................................................ 135
Table 3-3. Estimated Average Annual Wind Deployment across Wind Cost Sensitivities ..........................................................162
Table 3-4. Changes in Electricity Prices for the Study Scenario Relative to the Baseline Scenario (Across Sensitivities) ................................................................................................................................................................... 168
Table 3-5. Accumulated Emissions, Monetized Benefits, and Mortality and Morbidity Benefits over 2013–2050 for the Study Scenario Relative to the Baseline Scenario ............................................................................................. 194
Table 3-6. Domestic Content Assumptions for Land-Based and Offshore Wind ........................................................................ 209
Table 3-7. Construction-Phase Estimated FTE Jobs ................................................................................................................................211
Table 3-8. Operation-phase Estimated FTE Jobs .....................................................................................................................................211
Table 4–1. Wind Vision Roadmap Strategic Approach Summary ..................................................................................................... 250
Table 4–2. Texas Installed Wind Capacity and ERCOT Curtailment during CREZ Transmission Consideration, Approval, and Construction (2007–2013) .......................................................................................................................... 269
Tabl
e of
Con
tent
s
List of Figures

x This page is intentionally left blank

xi
This report is being disseminated by the Department of Energy. As such, the document was prepared in compli-ance with Section 515 of the Treasury and General Government Appropriations Act for Fiscal Year 2001 (Public Law 106-554) and information quality guidelines issued by the Department of Energy. Though this report does not constitute “influential” information, as that term is defined in DOE’s information quality guidelines or the Office of Management and Budget’s Information Quality Bulletin for Peer Review (Bulletin), as detailed in Appen-dix N, the report was reviewed both internally and externally prior to publication.
NOTICE
This report was prepared as an account of work sponsored by an agency of the United States government. Neither the United States government nor any agency thereof, nor any of their employees, makes any warranty, express or implied, or assumes any legal liability or responsibility for the accuracy, completeness, or usefulness of any information, apparatus, product, or process disclosed, or represents that its use would not infringe privately owned rights. Reference herein to any specific commercial product, process, or service by trade name, trade-mark, manufacturer, or otherwise does not necessarily constitute or imply its endorsement, recommendation, or favoring by the United States government or any agency thereof. The views and opinions of authors expressed herein do not necessarily state or reflect those of the United States government or any agency thereof.
Available electronically at http://www.osti.gov/scitech
Available for a processing fee to U.S. Department of Energy and its contractors, in paper, from:U.S. Department of EnergyOffice of Scientific and Technical Information P.O. Box 62Oak Ridge, TN 37831-0062phone: 865.576.8401fax: 865.576.5728email: [email protected]
Available for sale to the public, in paper, from:U.S. Department of Commerce National Technical Information Service 5285 Port Royal RoadSpringfield, VA 22161phone: 800.553.6847fax: 703.605.6900email: [email protected] online ordering: http://www.ntis.gov/help/ordermethods.aspx

xii This page is intentionally left blank

xiii
Message from the Director
The wind industry can be characterized by the substantial growth of domestic manufacturing and the level of wind deployment seen in recent years. Wind power systems are now seen as a viable and competitive source of electricity across the nation. Wind power’s emerging role is an important option in a portfolio of new energy solutions for future generations. More than 4.5% of our nation’s electricity came from wind power in 2013, placing the industry at a crossroads between the opportunities of higher energy penetration and the challenges of increased competition, policy uncertainty, access to transmission and lower energy demand.
The primary goal of the Wind Vision was to gain insights, after analyzing and quantifying a future scenario for wind energy, that consider our domestic manufacturing capacity, current and projected cost trends, sensitivities to future demand and fuel prices, and transmission needs. The Wind Vision was accomplished by bringing together leaders in energy in an effort to pool their insights, build upon their advancements, and learn from their accomplishments to project a credible future supported by the economic and societal benefits of wind energy.
In writing the Wind Vision, we recognize that the Energy Department is not the sole agent to drive a new future for the industry, but the federal Wind Program can provide focus and direction by leading efforts to accelerate the development of next-generation wind power technologies and assisting in solving key market challenges.
I would like to express my deepest sense of gratitude to the hundreds of individuals across our agency, industry, academia, and our national labs for their support, feedback and strategic interest in a renewed vision for wind energy. Their level of involvement signals a bright future for the wind industry.
The stakes for the nation are high. I am confident that, with sustained leadership in innovation, U.S. wind power will continue to make a significant contribution to the ever-evolving energy landscape. The Wind Vision is intended to assist in prioritizing the decisions needed to increase the economic competitiveness of the U.S. wind industry throughout the 21st century.
José Zayas
Director, Wind and Water Power Technologies Office
U.S. Department of Energy
March 12, 2015

xiv This page is intentionally left blank
xv
Acr
onym
sAcronyms
AC alternating current
AEO Annual Energy Outlook
AP2 (formerly APEEP)
Air Pollution Emission Experiments and Policy
AWEA American Wind Energy Association
AWC Atlantic Wind Connection
AWST AWS Truepower
AWWI American Wind Wildlife Institute
BA(s) balancing area(s)
BAU Business as Usual or Business-as-Usual
BLM Bureau of Land Management
BMP(s) best management practice(s)
BOEM Bureau of Ocean Energy Management
BPT benefit per ton
Btu British thermal unit
CAPEX capital expenditures
CBO Congressional Budget Office
CCS carbon capture and sequestration (or storage)
CF capacity factor
CO2 carbon dioxide
CREZ Competitive Renewable Energy Zone
Acronyms

CRS Congressional Research Service
CSAPR Cross-State Air Pollution Rule
CSP concentrating solar power
DC direct current
DMME Department of Minerals, Mines, and Energy (Virginia)
DoD U.S. Department of Defense
DOE U.S. Department of Energy
DOI U.S. Department of the Interior
DWEA Distributed Wind Energy Association
EIA U.S. Energy Information Administration
EIPC Eastern Interconnection Planning Collaborative
ELI Environmental Law Institute
EPA U.S. Environmental Protection Agency
ERCOT Electric Reliability Council of Texas
ESA Endangered Species Act
FAA Federal Aviation Administration
FAU Florida Atlantic University
FCR fixed charge rate
FERC Federal Energy Regulatory Commission
ft feet
FTE full-time equivalent (jobs)
xvi
Acr
onym
s
Acronyms

xvii
GAO U.S. Government Accountability Office
GCC grid connection cost
GCF gross capacity factor
GHG greenhouse gas
GW gigawatt(s)
GWEC Global Wind Energy Council
HCl hydrogen chloride
HCP Habitat Conservation Plan
HUC Hydraulic Unit Code
HVDC high-voltage direct-current
HVAC high-voltage alternating current
IEA International Energy Agency
IEC International Electrotechnical Commission
IEEE Institute of Electrical and Electronics Engineers
IGCC integrated gasification combined cycle
I-O input-output
IP Interim Policy
ISO independent system operator
ITC investment tax credit
IVGTF Integration of Variable Generation Task Force (of NERC)
IWG Interagency Working Group (on Social Cost of Carbon)
Acronyms
Acr
onym
s
xviii
JEDI Jobs and Economic Development Impacts (model)
K kindergarten
kg kilogram(s)
km kilometer(s)
kV kilovolt(s)
kW kilowatt(s)
kWh kilowatt-hour(s)
lb pound(s)
LBNL Lawrence Berkeley National Laboratory
LCA life-cycle assessment
LCOE levelized cost of electricity
LWST Low wind speed technology
MassCEC Massachusetts Clean Energy Center
Metocean meteorological and oceanographic
m meter(s)
m/s meters per second
MACRS modified accelerated cost recovery system
MATS Mercury and Air Toxics Standards
MBTA Migratory Bird Treaty Act
MMBtu million British thermal unit
MISO Midcontinent Independent System Operator
Acronyms
Acr
onym
s
xix
MW megawatt(s)
MWh megawatt-hour
NEPA National Environmental Policy Act
NERC North American Electric Reliability Corporation
NGCC natural gas–combined cycle
NGCCS natural gas with carbon capture and storage
NGCT natural gas-fired combustion turbine
NGO(s) non-governmental organization(s)
NOAA National Oceanic and Atmospheric Administration
NOX nitrogen oxides
NRC National Research Council
NREL National Renewable Energy Laboratory
NWTC National Wind Technology Center
O&M operations and maintenance
OCC overnight capital cost
OCS outer continental shelf
OEM original equipment manufacturer
OPEX operating expenses (or expenditures)
ORNL Oak Ridge National Laboratory
OSW offshore wind
PM particulate matter (PM10 and PM2.5)
Acronyms
Acr
onym
s
xx
PPA power purchase agreement
PTC production tax credit
PV photovoltaic
R&D research and development
REC(s) renewable energy credit(s)
ReEDS Regional Energy Deployment System (model)
RIA Regulatory Impact Analysis
RPM revolutions per minute
RPS renewable portfolio standard
RTO(s) regional transmission organization(s)
SAIC Science Applications International Corporation
SCC social cost of carbon
SO2 sulfur dioxide
SolarDS Solar Deployment System (model)
STEM science, technology, engineering, and math
SWiFT Scaled Wind Farm Technology
t metric tonne
TES thermal energy storage
TRG(s) techno-resource group(s)
TSS Traffic Separation Schemes
TWh terawatt-hour(s); trillion kWh
Acronyms
Acr
onym
s

xxi
UK United Kingdom
UNEP United Nations Environment Program
U.S.C. United States Code
USCG U.S. Coast Guard
USFWS U.S. Fish and Wildlife Service
UVIG Utility Variable-Generation Integration Group
WAC watts alternating current
WDC watts direct current
WACC weighted average cost of capital
WEA wind energy area (offshore)
WinDS Wind Deployment System (now ReEDS)
WV Wind Vision
WWPTO Wind and Water Power Technologies Office (DOE)
Acronyms
Acr
onym
s

xxii

xxiiiExecutive Summary | Overview
Executive Summary: OverviewThe U.S. Department of Energy’s (DOE’s) Wind and Water Power Technologies Office led a comprehen-sive analysis to evaluate future pathways for the wind industry. Through a broad-based collaborative effort, the Wind Vision had four principal objectives:
1. Documentation of the current state of wind power in the United States and identification of key tech-nological accomplishments and societal benefits over the decade leading up to 2014;
2. Exploration of the potential pathways for wind power to contribute to the future electricity needs of the nation, including objectives such as reduced carbon emissions, improved air quality, and reduced water use;
3. Quantification of costs, benefits, and other impacts associated with continued deployment and growth of U.S. wind power; and
4. Identification of actions and future achievements that could support continued growth in the use and application of wind-generated electricity.
The conclusions of this collaborative effort, summa-rized below, demonstrate the important role that wind power has in the U.S. power sector and highlight its potential to continue to provide clean, reliable and affordable electricity to consumers for decades to come. The Wind Vision study does not evaluate nor recommend policy actions, but analyzes feasibility, costs, and benefits of increased wind power deploy-ment to inform policy decisions at the federal, state, tribal, and local levels.
A High U.S. Wind Penetration Future is Achievable, Affordable and BeneficialWind power is one of the fastest-growing sources of new electricity capacity and the largest source of new renewable power generation added in the United States since 2000. Changes in wind power market dynamics, costs, technology, and deployment since the 2008 DOE report, 20% Wind Energy by 2030, are documented through analysis of recent history, current status (as of 2013), and projected trends. The analysis of wind installation and operational experi-ence as of 2013 concludes that:
• Wind deployment, including associated manufac-turing and installation activities, has demonstrated the ability to scale to satisfy rapid build demands, including the deployment levels of the Wind Vision Study Scenario described below;
• Wind generation variability has a minimal and manageable impact on grid reliability and related costs; and
• Environmental and competing use challenges for local communities, including land use, wildlife con-cerns, and radar interference issues, can be effec-tively managed with appropriate planning, technol-ogy, and communication among stakeholders.
The Wind Vision report deepens the understanding of U.S. wind power’s potential contributions to clean, reliable electricity generation and related economic and other societal benefits. Results are provided from analyses of U.S. greenhouse gas (GHG) and pollution reductions, electricity price impacts, job and manu-facturing trends, and water and land use impacts—for the years 2020, 2030, and 2050. A high U.S. wind penetration is achievable but will require actions as identified in the Wind Vision Roadmap.
Study SummaryThe Wind Vision report results from a collaboration of the DOE with over 250 experts from industry, electric power system operators, environmental stewardship organizations, state and federal governmental agen-cies, research institutions and laboratories, and siting and permitting stakeholder groups. The Wind Vision report updates and expands upon the DOE’s 2008 report, 20% Wind Energy by 2030, through analysis of scenarios of wind power supplying 10% of national end-use electricity demand by 2020, 20% by 2030, and 35% by 2050. This Study Scenario provides a framework for conducting detailed quantitative impact
Deployment of wind technology for U.S. electricity generation provides a domestic, sustainable, and essentially zero-carbon, zero-pollution and zero-water use U.S. electricity resource.
Exec
utiv
e Su
mm
ary
| O
verv
iew
Executive Summary | Overviewxxiv
analyses. The Wind Vision analysis concludes that it is both viable and economically compelling to deploy U.S. wind power generation in a portfolio of domestic, low-carbon, low-pollutant power generation solutions at the Study Scenario levels. Realizing these levels of deployment, however, would depend upon both immediate and long-term actions—principally identi-fying continued wind cost reductions, adding needed transmission capacity, and supporting and enhancing siting and permitting activities—to complement any federal, state, tribal, and local policies that may be enacted. Described in the Wind Vision Roadmap, these actions focus on specific key challenges and stake-holder actions that should be considered.
Analysis OverviewThe Wind Vision analysis models three core scenar-ios in order to better understand the sensitivities in deployment to various external drivers and, subsequently, to understand the likely economic and environmental effects of those drivers on the scenar-ios; a Baseline Scenario, with U.S. wind capacity held constant at 2013 levels of 61 gigawatts (GW); a Busi-ness-as-Usual Scenario (BAU), and a Study Scenario. The BAU Scenario is used to evaluate the industry’s domestic economic competitiveness today and into the future based on central expectations of future fossil fuel and renewable costs, energy demand, scheduled existing fleet retirements, and federal and state policies enacted as of January 1, 2014.
The Study Scenario starts with current manufacturing capacity (estimated at 8-10 GW of nacelle assembly and other large turbine components within the U.S. today) and applies central projections for variables such as wind power costs, fossil fuel costs, and energy demand in order to arrive at a credible projected pathway that would maintain the existing industry, for purposes of calculating potential social and economic benefits. The Study Scenario is a plausible outcome, representing what could come about through a variety of pathways, including aggressive wind cost reduc-tions, high fossil fuel costs, federal or state policy sup-port, high demand growth, or different combinations of these factors. The resulting Study Scenario—10% by 2020, 20% by 2030, and 35% by 2050 wind energy as a share of national end-use electricity demand—is compared against the Baseline Scenario to estimate costs, benefits, and other impacts associated with potential future wind deployment.
The Wind Vision study concludes that with continued investments in technology innovation, coupled with a transmission system that can provide access to high resource sites and facilitate grid integration reliably and cost-effectively, the Study Scenario is an ambi-tious yet viable deployment scenario. Further, the analysis concluded that the U.S. wind supply chain has capacity to support Study Scenario wind deploy-ment levels, with cumulative installations of 113 GW of generating capacity by 2020, 224 GW by 2030, and 404 GW by 2050, building from 61 GW installed as of the end of 2013.
Results: Overall Positive Benefit to the Nation The Wind Vision concludes that U.S. wind deployment at the Study Scenario levels would have an overall positive economic benefit for the nation. Numerous economic outcomes and societal benefits for the Study Scenario were quantified, including:*
• An approximately 1% increase in electricity costs through 2030, shifting to long-term cost savings of 2% by 2050. This results in cumulative system cost savings of $149 billion by 2050.
• Cumulative benefits of $400 billion (net present value 2013-2050) in avoided global damage from GHGs with 12.3 gigatonnes of avoided GHG emissions through 2050. Monetized GHG benefits exceed the associated costs of the Study Scenario in 2020, 2030, and 2050 and on a cumulative basis are equivalent to a levelized global benefit from wind energy of 3.2¢/kWh of wind.
• Cumulative benefits of $108 billion through 2050 for avoided emissions of fine particulate matter (PM), nitrogen oxides (NOX), and sulfur dioxides (SO2). Monetized criteria air pollutant benefits exceed the associated costs of the Study Scenario
National average wind costs are rapidly approaching cost competitive levels, but, without incentives, these costs are higher than the national average for natural gas and coal costs as of 2013. With continued cost reductions, the Wind Vision analysis envisions new wind power generation costs to be below national average costs for both new and existing fossil plants within the next decade.
Exec
utiv
e Su
mm
ary
| O
verv
iew
* Quantitative results presented in this Overview are based on the Central Study Scenario, defined on Page xxviii. Modeling analysis is based on current (as of 2013) and projected trend data to inform inputs, assumptions, and other constraints. Financial results are reported in 2013$ except where otherwise noted.
xxvExecutive Summary | Overview
in 2020, 2030, and 2050, and on a cumulative basis are equivalent to a levelized public health benefit from wind energy of 0.9¢/kWh of wind.
• Quantified consumer cost savings of $280 billion through 2050 from reduced natural gas prices out-side of the electricity sector, in response to reduced demand for natural gas and its price elasticity. This is equivalent to a levelized consumer benefit from wind energy of 2.3¢/kWh of wind.
• A 23% reduction in water consumed by the electric sector in 2050, with significant value in locations with constrained water availability.
• Transmission capacity expansion similar to recent national transmission installation levels of 870 miles per year, assuming equivalent single-circuit 345-kilovolt lines with a 900-MW carrying capacity.
• Land use requirements for turbines, roads, and other wind plant infrastructure of 0.04% of contig-uous U.S. land area in 2050.
The Study Scenario also identifies certain other impacts, such as those to wildlife and local com-munities. It does not, however, monetize these impacts, which are highly dependent on specific locational factors.
Roadmap for Key Stakeholder Actions The Wind Vision analysis concludes that, while the Study Scenario is technically viable and econom-ically attractive over the long run, a number of stakeholder actions should be considered to achieve the associated wind deployment levels. Improving wind’s competitive position in the market can help the nation maintain its existing wind manufacturing infrastructure and the wide range of public benefits detailed in the Wind Vision, including reducing carbon emissions. The Wind Vision report outlines a roadmap for moving forward and identifies the following key activities, developed collaboratively with industry and stakeholders:
• Reducing wind power costs;
• Expanding the developable areas for wind power; and
• Deploying wind in ways that increase economic value for the nation, including support for U.S. jobs and U.S. manufacturing.
Wind cost reductions do not depend on disruptive technological breakthroughs, but do rely on contin-ued cost improvements, including rotor scale-up; taller towers to access higher wind speeds; overall plant efficiency improvements achieved through advanced controls; improved plant designs enabled by deepened understanding of atmospheric physics; installation of both intra-region and inter-region transmission capacity to high quality wind resource locations; and collaboration and co-existence strate-gies for local communities and wildlife that support the timely and cost-effective installation of wind power plants.
Risk of InactionWind’s growth over the decade leading to 2014 has been driven largely by wind technology cost reduc-tions and federal and state policy support. Without actions to support wind’s competitive position in the market going forward, the nation risks losing its exist-ing wind manufacturing infrastructure and much of the public benefit illustrated by the Wind Vision analysis.
ConclusionsThe Wind Vision analysis demonstrates the economic value that wind power can bring to the nation, a value exceeding the costs of deployment. Wind’s environ-mental benefits can address key societal challenges such as climate change, air quality and public health, and water scarcity. Wind deployment can provide U.S. jobs, U.S. manufacturing, and lease and tax revenues in local communities to strengthen and support a transition of the nation’s electricity sector towards a low-carbon U.S. economy. The path needed to achieve 10% wind by 2020, 20% by 2030, and 35% by 2050 requires new tools, priorities, and emphases beyond those forged by the wind industry in growing to 4.5% of current U.S. electricity demand. Consid-eration of new strategies and updated priorities as identified in the Wind Vision could provide substantial positive outcomes for future generations.

xxvi Executive Summary | Overview
The Study Scenario results in cumulative savings, benefits, and an array of additional impacts by 2050.
System Costsa Benefitsb,c
$149 billion (3%) lower cumulative electric sector expenditures
14% reduction in cumulative GHG emissions (12.3 giga-tonnes CO2-equivalents), saving $400 billion in avoided global damages
$108 billion savings in avoided mortality, mor bidity, and economic damages from cumulative reductions in emissions of SO2, NOX, and PM
21,700 premature deaths from air pollution avoided
23% less water consump-tion and 15% less water withdrawals for the electric power sector
Additional Impacts
Energy Diversity Jobs Local Revenues Land UsePublic Acceptance
and Wildlife
Increased wind power adds fuel diversity, making the overall electric sector 20% less sensitive to changes in fossil fuel costs.
The predictable, long-term costs of wind power create down-ward price pressure on fossil fuels that can cumula tively save con sumers $280 billion from lower natural gas prices out side the electric sector.
Approximately 600,000 wind-related gross jobs spread across the nation.
$1 billion in annual land lease payments
$440 million annual lease payments for offshore wind plants
More than $3 billion in annual property tax payments
Less than 1.5% (106,000 km2) of contiguous U.S. land area occupied by wind power plants
Less than 0.04% (3,300 km2) of contiguous U.S. land area impacted by turbine pads, roads, and other associated infrastructure
Careful siting, continued research, thoughtful public engagement, and an emphasis on opti-mizing coexistence can support con-tinued responsible deployment that minimizes or eliminates negative impacts to wildlife and local communities
Note: Cumulative costs and benefits are reported on a Net Present Value basis for the period of 2013 through 2050 and reflect the difference in impacts between the Central Study Scenario and the Baseline Scenario. Results reported here reflect central estimates within a range; see Chapter 3 for additional detail. Financial results are reported in 2013$ except where otherwise noted.
a. Electric sector expenditures include capital, fuel, and operations and maintenance for transmission and generation of all technologies modeled, but excludes consideration of estimated benefits (e.g., GHG emissions).
b. Morbidity is the incidence of disease or rate of sickness in a population.
c. Water consumption refers to water that is used and not returned to the source. Water withdrawals are eventually returned to the water source.
Executive Summary | Key Chapter Findings xxvii
Exec
utiv
e Su
mm
ary
| Ke
y C
hapt
er F
indi
ngsExecutive Summary: Key Chapter Findings
ES.1 IntroductionWind power is one of the fastest-growing sources of new electricity supply and the largest source of new renewable power generation added in the United States since 2000. Wind power generation in the United States has tripled, increasing from 1.5% of annual electricity end-use demand in 2008 to 4.5% through 2013. As of 2013, there were more than 61 gigawatts (GW) of wind generating capacity installed, and electric system operators and utilities throughout the country routinely consider wind power as part of a diverse electricity generation portfolio. Interest in wind power is stimulated by its abundant resource potential (more than 10 times current electricity demand); competitive, long-term stable pricing; economic development potential; and environmental attributes, including its ability to sup-port reduced carbon emissions, improved air quality, and reduced water use.
At the same time, low natural gas prices, low whole-sale electricity prices, and reduced demand for electricity since 2008 are impacting investments for all new electric generation. Annual U.S. wind capac-ity additions have varied dramatically as a function of these factors as well as trends in wind power costs and policy.
In this context, DOE initiated the Wind Vision analysis. Led by the Wind and Water Power Technol-ogies Office in DOE’s Office of Energy Efficiency and Renewable Energy, the collaboration that resulted in the Wind Vision represents more than 250 energy experts with an array of specialties and includes grid operators, the wind industry, science-based organiza-tions, academia, governmental agencies, and environ-mental stewardship organizations. The Wind Vision serves as an update and significant expansion of an earlier DOE report, 20% Wind Energy by 2030.1
1. 20% Wind Energy by 2030: Increasing Wind Energy’s Contribution to U.S. Electricity Supply. U.S. Department of Energy. Washington, DC: DOE, 2008. Accessed Feb. 4, 2015: http://energy.gov/eere/wind/20-wind-energy-2030-increasing-wind-energys-contribution-us- electricity-supply.
At its core, the Wind Vision is intended to inform a broad set of stakeholders—including the industry, policymakers, and the public—on the implications of continued U.S. wind deployment. The analysis conducted does not result in a prediction or forecast of the future, but instead assesses the incremental costs associated with the deployment of wind power as a major part of the nation’s energy future, and compares these costs to the value of the resulting benefits. One of the greatest challenges for the 21st century will be bringing affordable, secure, clean energy to the world. This report considers the contri-bution of U.S. wind power in resolving that challenge.
ES.1.1 Project Perspective and ApproachIn 2008, DOE evaluated the technical feasibility of a scenario in which 20% of the nation’s annual electricity consumption was served by wind power in 2030. The resulting report, 20% Wind Energy by 2030, concluded that the U.S. power system could support a 20% wind penetration scenario with an increase in electric sector expenditures of 2% over the time frame of the study (2008–2030), relative to a future with no new wind. The report also identified key activities to be addressed, including expanding transmission infrastructure, reducing the cost of wind power, integrating wind reliably into the bulk power system, and addressing potential concerns related to siting and permitting of wind plants. Since the release of 20% Wind Energy by 2030, wind power’s installed capacity has increased by a factor of three. As of 2013, annual installations have surpassed the initial levels envisioned in the 20% scenario and progress has been made across the challenges that were identified. The Wind Vision documents the industry’s progress since the 2008 report, leveraging the past to inform future opportunities.

Executive Summary | Key Chapter Findingsxxviii
2030, and 35% by 2050. This scenario, called the Wind Vision Study Scenario, was identified as an ambitious but credible scenario after conducting a series of exploratory scenario modeling runs under Business-as-Usual conditions. In order to quantify the costs, benefits, and other impacts of future wind deployment, the outcomes of the Study Scenario are compared against those of a reference Baseline Scenario that fixes installed wind capacity at year-end 2013 levels of 61 GW. The Baseline Scenario and Study Scenario are not goals or future projections of wind power. Rather they comprise an analytical framework that supports detailed analysis of potential costs, benefits, and other impacts associated with future wind deployment. These three scenarios—Study Scenario, Baseline Scenario, and Business-as-Usual Scenario—are summarized above and constitute the primary analytical framework of the Wind Vision.
The Wind Vision analysis also seeks to provide better understanding of the future potential of wind power and quantify the costs and benefits of continued investment in wind power. The analysis, modeling inputs, and conclusions presented are based on the best available information from the fields of science, technol-ogy, economics, finance, and engineering, and include the historical experience gained from industry growth and maturation in the decade leading up to 2014.
Finally, the Wind Vision is action-oriented. It exam-ines the continued development and use of wind power in the United States. The Wind Vision roadmap identifies key challenges and the means by which they might be resolved. Priorities aim at positioning wind power to support the continued transformation of the nation’s electric power sector.
Although policy is a key variable that is expected to impact the future of wind power in the United States, no policy recommendations are included in the Wind Vision. Such recommendations are outside the scope of the current effort. Nonetheless, the Wind Vision, and in particular the assessment of costs and benefits, is intended to facilitate informed discus-sions among diverse stakeholder groups regarding the future of wind power within the electric power sector of the United States. Points of emphasis in the Wind Vision analysis are divided into three discrete time-scales: near-term (2020), mid-term (2030), and long-term (2050).
The primary analysis of the Wind Vision centers on a future scenario in which wind energy serves 10% of the nation’s end-use demand by 2020, 20% by
Exec
utiv
e Su
mm
ary
| Ke
y C
hapt
er F
indi
ngs
Analytical Framework of the Wind Vision
Wind Vision Study Scenario
The Wind Vision Study Scenario, or Study Scenario, applies a trajectory of 10% of the nation’s end-use demand served by wind by 2020, 20% by 2030, and 35% by 2050. It is the primary analysis scenario for which costs, benefits, and other impacts are assessed. The Study Scenario comprises a range of cases spanning plausible variations from central values of wind power and fossil fuel costs. The specific Study Scenario case based on those central values is called the Central Study Scenario.
Baseline ScenarioThe Baseline Scenario applies a constraint of no additional wind capacity after 2013 (wind capacity fixed at 61 GW through 2050). It is the primary reference case to support comparisons of costs, benefits, and other impacts against the Study Scenario.
Business-as-Usual Scenario
The Business-as-Usual (BAU) Scenario does not prescribe a wind future trajectory, but instead models wind deployment under policy conditions current on January 1, 2014. The BAU Scenario uses demand and cost inputs from the Energy Information Administration’s Annual Energy Outlook 2014.
Note: Percentages characterize wind’s contribution to the electric sector as a share of end-use electricity demand (net wind generation divided by consumer electricity demand).
The Wind Vision analysis conducts an assessment of future wind power growth projections using a “Business-as-Usual” framework and sensitivities on key variables such as wind power costs, fossil fuel prices, and electricity demand to understand the opportunities for wind (presented in Chapter 1 of the Wind Vision report). This evaluation assists in identifying a credible scenario for further analysis of costs and benefits and in highlighting specific future actions that could support continued wind growth, including continued cost reductions.

xxixExecutive Summary | Key Chapter Findings
ES.1.2 Understanding the Future Potential for Wind PowerIn order to structure a model to consider the future potential for wind power, the Wind Vision starts with Business-as-Usual, or BAU, conditions. Analysis was performed using the National Renewable Energy Laboratory’s Regional Energy Deployment System2
2. The Regional Energy Deployment System (ReEDS) is a long-term capacity-expansion model for the deployment of electric power gener-ation technologies and transmission infrastructure throughout the contiguous United States. ReEDS is designed to analyze critical issues in the electric sector, especially with respect to potential energy policies, such as clean energy and renewable energy standards or carbon restrictions. See http://www.nrel.gov/analysis/reeds/ for more information.
Table ES.1-1. Modeling Inputs and Assumptions in Business-as-Usual Scenario Modeling3,4,5
Modeling Variables Business-as-Usual (BAU) Scenario Sensitivity Variables
Electricity demand AEO 2014 Reference Case (annual electric demand growth rate 0.7%)
1: AEO 2014 High Economic Growth Case (annual electric demand growth rate 1.5%)
2: AEO 2014 Low Economic Growth Case (annual electric demand growth rate 0.5%)
Fossil fuel prices AEO 2014 Reference Case
1: Low Oil and Gas Resource and High Coal Cost cases (AEO 2014)
2: High Oil and Gas Resource and Low Coal Cost cases (AEO 2014)
Fossil technology and nuclear power costs AEO 2014 Reference Case None
Wind power costsMedian 2013 costs, with cost reductions in future years derived from literature review
1: Low costs: median 2013 costs and maximum annual cost reductions reported in literature
2: High costs: constant wind costs from 2014–2050
Other renewable power costs
Literature-based central 2013 estimate and future cost characterization None
Policy Policies as current and legislated on January 1, 2014 None
Transmission expansion
Pre-2020 expansion limited to planned lines; post-2020, economic expansion, based on transmission line costs from Eastern Interconnection Planning Collaborative
None
3. Annual Energy Outlook 2014. DOE/EIA-0383(2014). Washington, DC: U.S. Department of Energy, Energy Information Administration, 2014. Accessed Dec. 14, 2014: http://www.eia.gov/forecasts/aeo/.
4. Phase 2 Report: DOE Draft—Parts 2–7, Interregional Transmission Development and Analysis for Three Stakeholder Selected Scenarios. Work performed by Eastern Interconnect Planning Collaboration under contract DE-OE0000343. Washington, DC: U.S. Department of Energy, December 2012. Accessed Feb. 4, 2015: http://www.eipconline.com/Phase_II_Documents.html.
5. Electric Power Monthly. U.S. Department of Energy, Energy Information Administration, 2014. Accessed Dec. 14, 2014: www.eia.gov/electricity/monthly/.
(ReEDS) capacity expansion model and other sup-porting models and analyses. The ReEDS model relies on system-wide least-cost optimization to estimate the type and location of fossil, nuclear, renewable, and storage resource development; the transmission infrastructure expansion requirements of those instal-lations; and the generator dispatch and fuel needed

xxx Executive Summary | Key Chapter Findings
to satisfy regional demand requirements and maintain grid system adequacy. The model also considers technology, resource, and policy constraints.
BAU conditions assume a future scenario under enacted federal and state policies as of January 1, 2014. Modeling inputs were extracted from the published literature as well as the DOE Energy Information Administration’s Annual Energy Outlook (AEO) 2014. Literature sources were used to develop future projections of renewable power cost and performance. The AEO was the source for fossil and nuclear technology cost and performance projections, as well as the source for fuel prices and electricity load growth projections. The sources of modeling inputs are summarized in Table ES.1-1.
BAU conditions indicate that growth in wind gen-eration and capacity will be limited through 2030 (Figure ES.1-1), with more robust growth occur-ring between 2030 and 2050. Wind generation is projected to settle at about 7% of total electricity demand in 2016 after projects currently under con-struction (and qualifying for the federal production tax credit) are placed into service. BAU modeling projects minimal further growth to 10% by 2030. For the period 2015–2030, average annual new capacity additions are estimated at 3 GW/year, substantially below recent (as of 2013) capacity additions. Negative impacts to the wind industry manufacturing sector
and employment would be expected under BAU. After 2030, however, wind becomes more competitive as a result of continued cost improvements, projected increases in fossil fuel prices, and increased demand for new power generation. As a share of total U.S. electricity demand, wind power reaches 25% in 2050 under the BAU Scenario, with average annual new capacity additions from 2031 to 2050 corresponding generally to historical levels of capacity additions between 2009 and 2013.
Analysis results are informed by an array of sensi-tivities with market conditions that are unfavorable to wind. These conditions were developed to under-stand wind growth assuming no further cost reduc-tions, AEO 2014 low coal and natural gas prices, and AEO 2014 low electricity demand growth. An array of factors could shift growth in wind capacity and generation even later in the study period (e.g., after 2040), such as continued low fossil fuel prices and no further reductions in wind power costs.
Other factors and market conditions, however, such as low wind power costs, high fossil fuel prices, or high electricity demand can accelerate future wind growth and drive wind penetration (as a share of total U.S. electricity demand) (Figure ES.1-2). In combination, low wind power costs and high fossil fuel prices support wind generation levels approach-ing 10% by 2020, 25% by 2030, and 40% by 2050.
Historical and Average New Wind Capacity Additions Under BAU Scenario
Period GW/year% End-Use
Electricity Demand
2009–2013 (actual) 7 4.5%
2014–2020 4 7%
2021–2030 3 10%
2031–2050 8 25%
Note: The BAU Scenario assumes AEO Reference Case fuel costs, AEO Reference Case electricity demand, median values for renewable energy costs derived from literature, and policy as current and legislated on January 1, 2014. Percentage of end-use electricity demand data are contributions as of the end of the indicated period (e.g., 2009–2013).
AEO Reference Electricity Demand
Ener
gy G
ener
atio
n (T
Wh/
year
)
0
1,000
2,000
3,000
4,000
5,000
20502040203020202010
Wind generation under BAU Scenario
Under BAU Scenario conditions, wind stagnates and annual installations fall to levels 50% or more below the latest five-year average.
Figure ES.1-1. Wind generation and average new capacity additions under BAU

xxxiExecutive Summary | Key Chapter Findings
Figure ES.1-2. Wind Vision Study Scenario relative to BAU and sensitivities6
Analysis results are informed by an array of sensi-tivities with conditions that are favorable to wind. These conditions were developed to understand wind growth assuming aggressive wind cost reductions, AEO 2014 high coal and natural gas prices, and AEO 2014 high demand growth (Figure ES.1-2). When imposed independently, changes in these variables support levels of new wind capacity additions that are comparable to recent historical levels (e.g., 7 GW/year from 2009 to 2013) in the near-term (2020) and in excess of historical levels from 2030 to 2050. In combination, these variables can support levels of new wind growth on the order of 10–15 GW/year throughout the period of analysis.
ES.1.3 Defining a Credible Scenario to Calculate Costs, Benefits, and Other ImpactsDrawing from the analysis described in Section ES.1.2, the Wind Vision Study Scenario was identi-fied as a credible scenario that extends current wind deployment trends, leverages the existing domestic wind industry manufacturing base, and comple-ments the broader literature. In the near-term (2020), the wind deployment in the Study Scenario is consistent with the growth found with aggressive
6. See Analytical Framework of the Wind Vision at the beginning of the Executive Summary for a brief description of the Wind Vision Study scenarios analyzed.
wind cost reductions and relatively high fossil fuel prices. It also extends recent (as of 2013) deployment trends and maintains the existing domestic manu-facturing base. In the mid-term (2030), the Study Scenario falls between modeled wind generation under aggressive cost reductions or aggressive cost
The Study Scenario falls within the range of economic sensitivities on the BAU Scenario.
Study ScenarioBAU Scenario
Low Wind Costs High Fossil Fuel Costs
Low Wind Costs and High Fossil Fuel CostsBaseline Scenario
WIn
d En
ergy
(TW
h/ye
ar)
205020402030202020100
500
1,000
1,500
2,000
2,500
3,000
10% WindPenetration
20% WindPenetration
35% WindPenetration
The Study Scenario falls within the range of economic sensitivities around the BAU Scenario.
At the core of the Wind Vision analysis is an assessment of costs, benefits, and other impacts from continued wind deployment. Evaluation of costs and benefits requires the development of a future scenario, identified as the Wind Vision Study Scenario (or Study Scenario), and a reference case, identified as the Baseline Scenario. The Study Scenario is grounded in the range of credible scenarios examined in the BAU and related sensitivity analyses, with specific bounds based on aggressive wind power cost reduction, high fossil fuel prices, or a combination of both. This approach illuminates key opportunities and challenges associated with continued wind power growth, and compares them against an array of environmental and other benefits associated with the scenarios.

xxxii Executive Summary | Key Chapter Findings
Table ES.1-2. Wind Penetration (% share of end-use demand) in BAU Scenario, BAU Sensitivities, and the Study Scenario7
reliance on the prescribed Study Scenario trajectory (10% wind penetration by 2020, 20% by 2030, and 35% by 2050).
The Study Scenario trajectory falls within the range of credible future scenarios, identified in BAU and the sensitivity analyses described earlier and illustrated in Figure ES.1-2. The Study Scenario seeks to understand the implications of maintaining consistency with U.S. wind installation trends and performance as well as domestic manufacturing, and leverages up-to-date insights into grid integration management and transmission capacity. Distributed wind applications8 are not explicitly represented but are considered as part of the broader land-based capacity associated with the Study Scenario.
Although U.S. wind generation as of 2013 was entirely land-based, the Wind Vision analysis recog-nizes that offshore wind reached 6.5 GW globally in 2013 and an array of offshore projects in the United States are advancing through the development pro-cess. The Study Scenario includes explicit allocations for land-based and offshore wind (Figure ES.1-3). Near-term (through 2020) offshore contributions are estimated based on projects in advanced stages of development in the United States and on global
7. See Analytical Framework of the Wind Vision at the beginning of the Executive Summary for a brief description of the Wind Vision Study scenarios analyzed.
8. Distributed wind applications refer to wind power plants or turbines that are connected either physically or virtually on the customer side of the meter.
reductions coupled to high fossil fuel prices, while continuing to build from the existing manufacturing base and maintaining consistency with the 2008 study. In the long-term (2050), the Study Scenario is grounded by modeled results under low wind costs—i.e., land-based wind levelized cost of electric-ity (LCOE) reduction of 24% by 2020, 33% by 2030, and 37% by 2050; and offshore wind LCOE reduction of 22% by 2020, 43% by 2030, 51% by 2050 (Figure ES.1-2 and Table ES.1-2.).
The Study Scenario is represented by wind power penetration levels, as a share of total U.S. electricity demand, of 10% by 2020, 20% by 2030, and 35% by 2050. Sensitivity analyses within the Study Sce-nario, maintaining the same wind penetration levels, are used to assess the robustness of key results and highlight the impacts of varying wind power costs and fossil fuel prices. In the Wind Vision, many of the results emphasize outcomes across the full range of sensitivities; however, the Executive Summary primarily presents impacts for a single Central case. The Central case, or Central Study Scenario, applies common inputs with the BAU Scenario for technology cost and performance, fuel pricing, and policy treat-ment, but is distinguished from that scenario by its
Year BAU Scenario
BAU Sensitivities
Study ScenarioHigh Fossil
Fuel CostsLow Wind
Costs
High Fossil Fuel Costs and Low
Wind Costs
2013 (actual) 4.5% 4.5% 4.5% 4.5% 4.5%
2020 7% 7% 8% 10% 10%
2030 10% 17% 16% 24% 20%
2050 25% 32% 34% 41% 35%
Note: Percentages characterize wind’s contribution to the electric sector as a share of end-use electricity demand (net wind generation divided by consumer electricity demand).
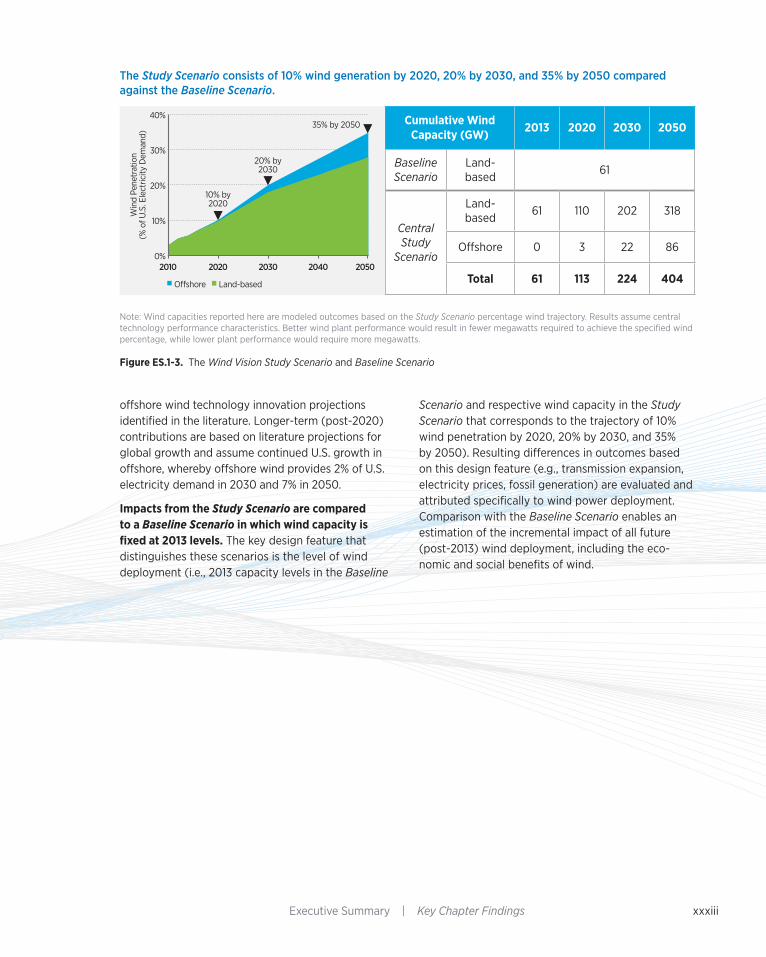
xxxiiiExecutive Summary | Key Chapter Findings
offshore wind technology innovation projections identified in the literature. Longer-term (post-2020) contributions are based on literature projections for global growth and assume continued U.S. growth in offshore, whereby offshore wind provides 2% of U.S. electricity demand in 2030 and 7% in 2050.
Impacts from the Study Scenario are compared to a Baseline Scenario in which wind capacity is fixed at 2013 levels. The key design feature that distinguishes these scenarios is the level of wind deployment (i.e., 2013 capacity levels in the Baseline
Scenario and respective wind capacity in the Study Scenario that corresponds to the trajectory of 10% wind penetration by 2020, 20% by 2030, and 35% by 2050). Resulting differences in outcomes based on this design feature (e.g., transmission expansion, electricity prices, fossil generation) are evaluated and attributed specifically to wind power deployment. Comparison with the Baseline Scenario enables an estimation of the incremental impact of all future (post-2013) wind deployment, including the eco-nomic and social benefits of wind.
The Study Scenario consists of 10% wind generation by 2020, 20% by 2030, and 35% by 2050 compared against the Baseline Scenario.
Figure ES.1-3. The Wind Vision Study Scenario and Baseline Scenario
Cumulative Wind Capacity (GW) 2013 2020 2030 2050
Baseline Scenario
Land-based 61
CentralStudy
Scenario
Land-based 61 110 202 318
Offshore 0 3 22 86
Total 61 113 224 404
Win
d Pe
netr
atio
n(%
of U
.S. E
lect
ricity
Dem
and)
O�shore Land-based
0%
10%
20%
30%
40%
20502040203020202010
10% by 2020
20% by 2030
35% by 2050
Note: Wind capacities reported here are modeled outcomes based on the Study Scenario percentage wind trajectory. Results assume central technology performance characteristics. Better wind plant performance would result in fewer megawatts required to achieve the specified wind percentage, while lower plant performance would require more megawatts.

xxxiv
Through 2008
2009 through 2013
Total Wind Deployment
Note: Distributed wind projects with less than 1 MW have been installed in all 50 states.
Top 5 States in 2013by total capacity (GW)
0
3
6
9
12
15
OregonIllinoisIowaCaliforniaTexas
12.3
5.8 5.23.6 3.2
In 2013, cumulative utility-scale wind deployment reached 61 GW across 39 states.
603015
Total Capacity (GW)
5≤ 1
Executive Summary | Key Chapter Findings
ES.2 State of the Wind Industry: Recent Progress, Status and Emerging TrendsWith more than 61 GW installed across 39 states at the end of 2013, utility-scale wind power is a cost- effective source of low-emissions power generation in those regions where substantial wind potential exists. From 2008 to 2013, wind power installations expanded in geographic deployment and cumulative capacity (Figure ES.2-1), with corresponding growth in the domestic supply chain. Arizona, Delaware, Maryland and Nevada each added their first utili-ty-scale wind projects between 2008 and 2013.
Wind power costs have declined by more than one- third since 2008 and the U.S. manufacturing base
Wind power is becoming a mainstream power source in the U.S. electricity portfolio, supplying 4.5% of the nation’s electricity demand in 2013. Since the 2008 publication of the DOE report, 20% Wind Energy by 2030, the industry has scaled its domestic manu-facturing capacity and has driven down wind power costs by more than one-third. A review of these industry developments is sum marized in Chapter 2, and these insights were used to inform the modeling inputs and assumptions of the Study Scenario.
Figure ES.2-1. Utility-scale wind deployment through 2013
In 2013, cumulative utility-scale wind deployment reached 61 GW across 39 states.
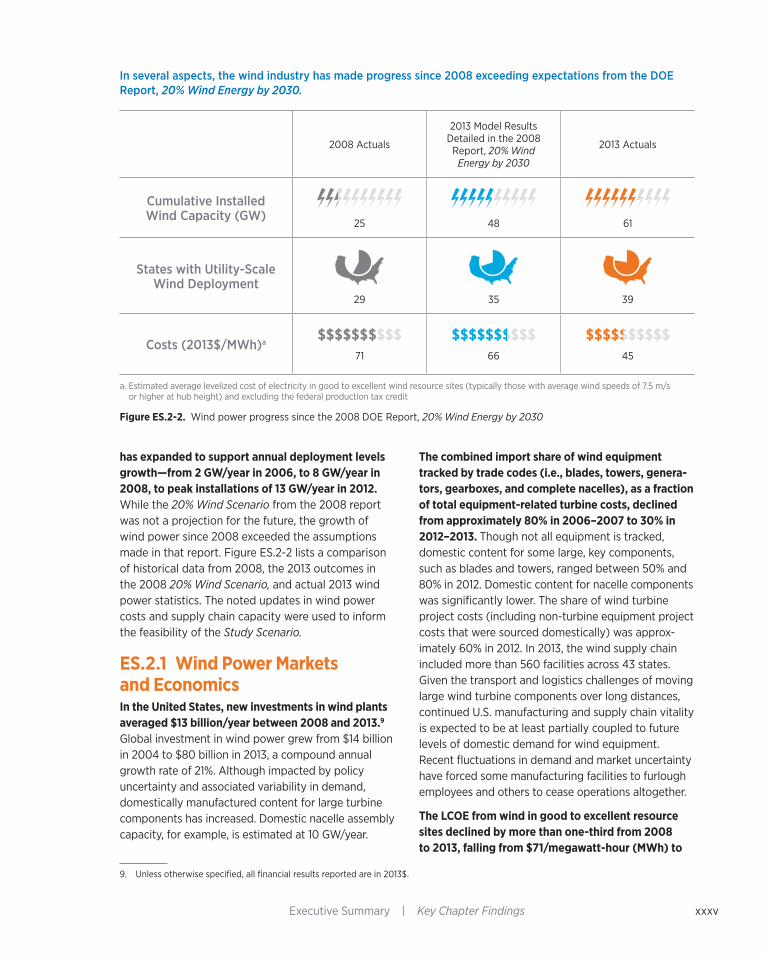
xxxvExecutive Summary | Key Chapter Findings
has expanded to support annual deployment levels growth—from 2 GW/year in 2006, to 8 GW/year in 2008, to peak installations of 13 GW/year in 2012. While the 20% Wind Scenario from the 2008 report was not a projection for the future, the growth of wind power since 2008 exceeded the assumptions made in that report. Figure ES.2-2 lists a comparison of historical data from 2008, the 2013 outcomes in the 2008 20% Wind Scenario, and actual 2013 wind power statistics. The noted updates in wind power costs and supply chain capacity were used to inform the feasibility of the Study Scenario.
ES.2.1 Wind Power Markets and EconomicsIn the United States, new investments in wind plants averaged $13 billion/year between 2008 and 2013.9 Global investment in wind power grew from $14 billion in 2004 to $80 billion in 2013, a compound annual growth rate of 21%. Although impacted by policy uncertainty and associated variability in demand, domestically manufactured content for large turbine components has increased. Domestic nacelle assembly capacity, for example, is estimated at 10 GW/year.
9. Unless otherwise specified, all financial results reported are in 2013$.
The combined import share of wind equipment tracked by trade codes (i.e., blades, towers, genera-tors, gearboxes, and complete nacelles), as a fraction of total equipment-related turbine costs, declined from approximately 80% in 2006–2007 to 30% in 2012–2013. Though not all equipment is tracked, domestic content for some large, key components, such as blades and towers, ranged between 50% and 80% in 2012. Domestic content for nacelle components was significantly lower. The share of wind turbine project costs (including non-turbine equipment project costs that were sourced domestically) was approx-imately 60% in 2012. In 2013, the wind supply chain included more than 560 facilities across 43 states. Given the transport and logistics challenges of moving large wind turbine components over long distances, continued U.S. manufacturing and supply chain vitality is expected to be at least partially coupled to future levels of domestic demand for wind equipment. Recent fluctuations in demand and market uncertainty have forced some manufacturing facilities to furlough employees and others to cease operations altogether.
The LCOE from wind in good to excellent resource sites declined by more than one-third from 2008 to 2013, falling from $71/megawatt-hour (MWh) to
In several aspects, the wind industry has made progress since 2008 exceeding expectations from the DOE Report, 20% Wind Energy by 2030.
2008 Actuals
2013 Model Results Detailed in the 2008
Report, 20% Wind Energy by 2030
2013 Actuals
Cumulative Installed Wind Capacity (GW)
25 48 61
States with Utility-Scale Wind Deployment
29 35 39
Costs (2013$/MWh)a
71 66 45
a. Estimated average levelized cost of electricity in good to excellent wind resource sites (typically those with average wind speeds of 7.5 m/s or higher at hub height) and excluding the federal production tax credit
Figure ES.2-2. Wind power progress since the 2008 DOE Report, 20% Wind Energy by 2030
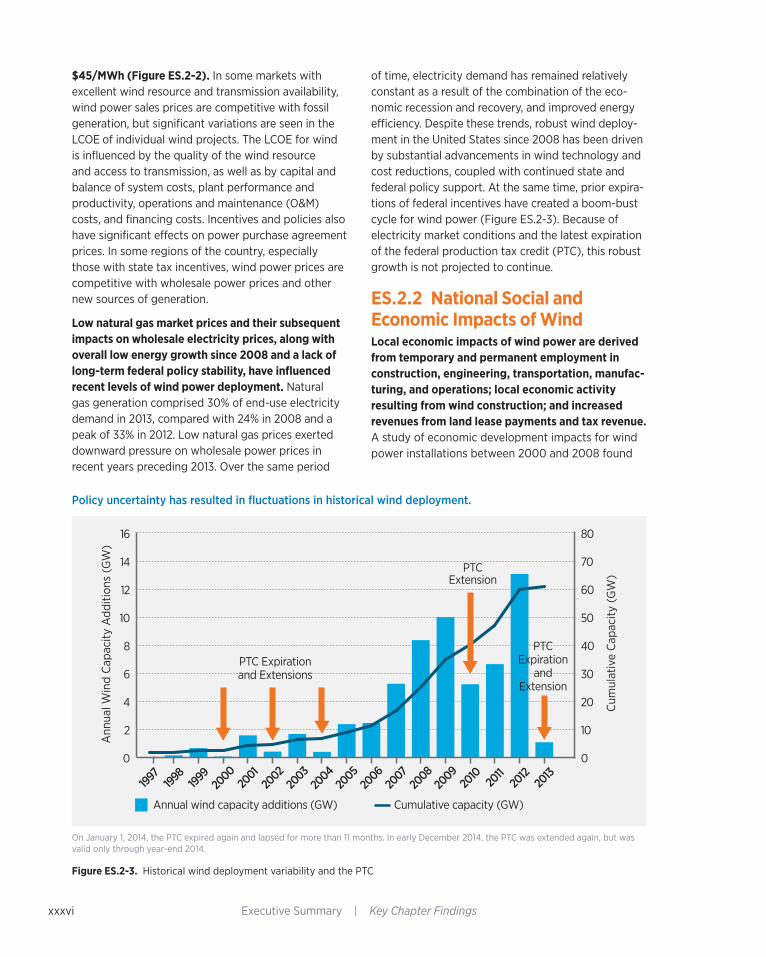
xxxvi Executive Summary | Key Chapter Findings
$45/MWh (Figure ES.2-2). In some markets with excellent wind resource and transmission availability, wind power sales prices are competitive with fossil generation, but significant variations are seen in the LCOE of individual wind projects. The LCOE for wind is influenced by the quality of the wind resource and access to transmission, as well as by capital and balance of system costs, plant performance and productivity, operations and maintenance (O&M) costs, and financing costs. Incentives and policies also have significant effects on power purchase agreement prices. In some regions of the country, especially those with state tax incentives, wind power prices are competitive with wholesale power prices and other new sources of generation.
Low natural gas market prices and their subsequent impacts on wholesale electricity prices, along with overall low energy growth since 2008 and a lack of long-term federal policy stability, have influenced recent levels of wind power deployment. Natural gas generation comprised 30% of end-use electricity demand in 2013, compared with 24% in 2008 and a peak of 33% in 2012. Low natural gas prices exerted downward pressure on wholesale power prices in recent years preceding 2013. Over the same period
of time, electricity demand has remained relatively constant as a result of the combination of the eco-nomic recession and recovery, and improved energy efficiency. Despite these trends, robust wind deploy-ment in the United States since 2008 has been driven by substantial advancements in wind technology and cost reductions, coupled with continued state and federal policy support. At the same time, prior expira-tions of federal incentives have created a boom-bust cycle for wind power (Figure ES.2-3). Because of electricity market conditions and the latest expiration of the federal production tax credit (PTC), this robust growth is not projected to continue.
ES.2.2 National Social and Economic Impacts of WindLocal economic impacts of wind power are derived from temporary and permanent employment in construction, engineering, transportation, manufac-turing, and operations; local economic activity resulting from wind construction; and increased revenues from land lease payments and tax revenue. A study of economic development impacts for wind power installations between 2000 and 2008 found
0
2
4
6
8
10
12
14
16
0
10
20
30
40
50
60
70
80
2013
2012
2011
2010
2009
2008
2007
2006
2005
2004
2003
2002
2001
2000
1999
1998
1997
PTC Expirationand Extensions
PTCExtension
PTCExpiration
andExtension
Annual wind capacity additions (GW) Cumulative capacity (GW)
Ann
ual W
ind
Cap
acity
Add
ition
s (G
W)
Cum
ulat
ive
Cap
acity
(G
W)
Note: As of January 1, 2014 the PTC expired again and lapsed for a period of nearly 12 months. In December 2014 the PTC was extended again, although only through year-end 2014.On January 1, 2014, the PTC expired again and lapsed for more than 11 months. In early December 2014, the PTC was extended again, but was
valid only through year-end 2014.
Figure ES.2-3. Historical wind deployment variability and the PTC
Policy uncertainty has resulted in fluctuations in historical wind deployment.

xxxviiExecutive Summary | Key Chapter Findings
Note: Emissions and water savings calculated using the EPA’s Avoided Emissions and Generation Tool (AVERT). ‘Uncontrolled coal plants’ are those with no emissions control technology.
Figure ES.2-4. Estimated emissions and water savings resulting from wind generation in 201310
10. The Clean Air Benefits of Wind Energy. Washington, DC: American Wind Energy Association. Accessed February 3, 2015: http://www.awea.org/Advocacy/Content.aspx?ItemNumber=5552.
ES.2.3 Wind Technology, Manufacturing, and LogisticsContinued advancements and scale-up of turbine technology have helped reduce wind power costs and enable broader geographic deployment of wind power. Significant effort has been applied to improve performance and reliability of individual wind turbines. These improvements have included design of longer blades and taller towers (Figure ES.2-5), developments in innovative drive train designs, and increased use of improved controls and sensors that collectively capture energy from the wind more cost effectively. Wind technology improvements have made lower wind speed sites more economically viable, even in regions previously thought to have little or no wind potential. In 2013, wind project development was underway in nearly every U.S. state and the focus of innovation was shifting from individ-ual turbine performance to overall plant performance characteristics, which will continue to drive down wind electricity generation costs.
Wind generation in 2013 provided a range of environmental benefits.
Carbon Dioxidereduced by
115,000,000metric tonnes
Equivalent to CO2 emissions from
270 millionbarrels of oil
CO2
Sulfur Dioxidereduced by
157,000metric tonnes
SO2
Nitrogen Oxidereduced by
97,000metric tonnes
Water Consumptionreduced by
36.5 billiongallons
NOX H2O
Equivalent to annual emissions of
12 uncontrolled coal plants
Equivalent to annual emissions of
10 uncontrolled coal plants
Equivalent to116 gallons/
person in the U.S.
Note: Emissions and water savings calculated using the EPA’s Avoided Emissions and Generation Tool (AVERT). ‘Uncontrolled coal plants’ are those with no emissions control technology.
that total county personal income was 0.2% higher and employment 0.4% higher in counties with installed wind power, relative to those without wind power installations. Another study on four rural counties in west Texas found cumulative economic activity resulting from wind investments in local communities to be nearly $520,000 (2011$) per MW of installed capacity over the 20-year lifetime of the wind plant. In 2013, an estimated total of more than 50,000 onsite and supply chain jobs were supported nationally by wind investments.
Wind deployment delivers public health and environ mental benefits today, including reduced greenhouse gas (GHG) emissions, reduced air pollutants, and reduced water consumption and withdrawals. The power sector is the largest contrib-utor to GHG emissions and a major source of criteria air pollutants such as sulfur dioxide (SO2) and nitrous oxides (NOX). Wind power is already reducing these emissions from the power sector (Figure ES.2-4). Future wind deployment levels will affect the magni-tude of these benefits.

xxxviii Executive Summary | Key Chapter Findings
Technology advancements now center on com-plementing larger wind turbines with enhanced siting strategies and advanced control systems for arrays of wind turbines. A better understanding of wind resources and continued technology develop-ments are leading trends in improved performance, increased reliability, and reduced cost of wind elec-tricity. As turbine technology advances and compo-nents like blades and towers increase in size, trans-portation costs could increase and manufacturing may become more complex. The industry is working to balance costs and benefits, with innovative trans-port solutions across the supply chain. Continued innovation in turbine design, manufacturing, trans-portation, and construction can allow industry to address logistical barriers for the next generation of larger wind turbines.
Domestic manufacturing could continue to expand, provided domestic demand remains stable. Domes-tic wind components and skilled labor requirements will continue to be dependent on near-term domestic demand. Lack of stable domestic demand for wind power could reverse the trend of higher domestic content in wind turbine manufacturing.
ES.2.4 Wind Integration and Delivery Large amounts of wind power are reliably and effec-tively integrated into the electric power system. Wind power contributed 4.5% of U.S. electricity demand and 3.2% of global electricity demand through 2013; two states, Iowa and South Dakota, exceeded 25% of in-state generation from wind in 2013; and seven other states operated with greater than 12% of their annual electricity generation from wind (Colorado, Idaho, Kansas, Minnesota, North Dakota, Oklahoma, and Oregon). Power system operators who have experience with wind now view its use routinely as a dependable component in the portfolio of generating options. Wind power has been successfully integrated into the power system and can contribute to grid management services in flexible power systems. Improved wind forecasting, wind plant controls, and expanding the geographical area for reserve sharing and demand response have all contributed to increased power system flexibility.
0
50
100
150
200
250
Presen
t
2005–
2010
2000–2
005
1995–
2000
1990–19
95
1980
–1990
17 m30 m
50 m
70 m 80 m
100 m
125 m
150 m
Hub
Hei
ght (
met
ers)
LCO
E (2
013$
/MW
h)
Note: LCOE is estimated in good to excellent wind resource sites (typically those with average wind speeds of 7.5 m/s or higher), excluding the federal production tax credit. Hub heights reflect typical turbine model size for the time period.
Hub height (meters)LCOE (2013 $/MWh)
Future
$0
$120
$240
$360
$480
$600
Scale-up of wind technology has supported cost reductions.
Note: LCOE is estimated in good to excellent wind resource sites (typically those with average wind speeds of 7.5 m/s or higher), excluding the federal production tax credit. Hub heights reflect typical turbine model size for the time period.
Figure ES.2-5. Wind technology scale-up trends and the levelized cost of electricity

xxxixExecutive Summary | Key Chapter Findings
Many potential sites with high quality wind energy resources have minimal or no access to electrical transmission facilities. This creates a bottleneck to cost-effective wind deployment. Various efforts have yielded progress nationally on overcoming transmission barriers. For example, the Competitive Renewable Energy Zones Plan in Texas enabled transmission expansion to connect wind-rich resources in the Texas Panhandle to population cen-ters in the central and eastern regions of the state. Prior to the Competitive Renewable Energy Zones Plan, 7 GW of wind power were operating within Texas. By early 2014, interconnection agreements had been signed for proposed projects totaling an addi-tional 7 GW, and applications had been submitted for 24 GW of wind power. Dedicated efforts like those In Texas could be a model for transmission expansion in other regions of the country.
ES.2.5 Wind Deployment: Siting, Regulation, and Collaboration Extensive experience and focused research have shown that adverse impacts to wildlife and local communities resulting from wind deployment need to be managed through careful siting, thoughtful public engagement, and mitigation strategies. Emphasis is now on optimizing co-existence, address-ing community and regulatory concerns in the devel-opment process, and using mutually agreed-upon strategies to reduce or eliminate potential negative impacts, all while supporting responsible wind power deployment. Siting concerns are being addressed by on-going research. One example of this work is a 2014 DOE study produced by Lawrence Berkeley National Laboratory. Findings from this study indicate no statistical impact on home property values near wind
facilities. Another example is a recent American Wind Wildlife Institute study that provides the most recent assessment of the avian mortality impact of wind plants. Open collaboration with a community and its leaders provides increased public involvement and understanding of best practices for both land-based and offshore wind deployment.
A number of government agencies, industry orga-nizations, researchers, academics, non-government organizations, and collaborative groups are working to address wind-related issues, from permitting and environmental oversight to manufacturing and workforce training. Work by collaborative groups has shifted from the basic sharing of information and best practices to active engagement aimed at solving specific problems at the local, regional, and national levels. Example collaborative bodies in this effort include the American Wind Wildlife Institute, the Bats and Wind Energy Cooperative, the National Wind Coordinating Collaborative, and the Utility Vari-able-Generation Integration Group. These parties have enhanced education to help stakeholders understand the role and impact of wind on the energy market, communities, and the environment.
The wind power community has addressed sub-stantive siting and regulatory issues, and continues to work closely with regulatory organizations to streamline regulatory processes. Requirements can vary widely by state, locality, site ownership and oversight, project size, grid interconnection, and other project attributes. As a result, wind power projects across the country must adhere to different and changing regulatory standards, leaving uncertainties in development timelines and increasing risks to successful project development.
xl Executive Summary | Key Chapter Findings
ES.3 Costs, Benefits, and Other Impacts of the Study Scenario The Wind Vision analysis considered an array of impacts for the Study Scenario (10% wind pene-tration by 2020, 20% by 2030, and 35% by 2050) relative to the Baseline Scenario. Modeling inputs for these scenarios are consistent with those applied in the prior BAU Scenario and sensitivities (see Table ES.1-1) except wind power deployment is fixed at Study Scenario levels. Under BAU conditions, wind power deployment occurs if and where wind power is economically competitive. In the Study Scenario, wind deployment begins in 2013 at 61 GW and then is added in future years to reach levels of 10% wind penetration by 2020, 20% by 2030, and 35% by 2050. In the Baseline Scenario, wind power deploy-ment begins in 2013 at 61 GW and then remains fixed at 61 GW for all future years. Although the Study Scenario does not precisely replicate the prior BAU or related sensitivity outcomes, aggressive wind cost reductions (land-based wind LCOE reduction of 24% by 2020, 33% by 2030, and 37% by 2050 and offshore wind LCOE reduction of 22% by 2020, 43% by 2030, 51% by 2050), high fossil fuel prices (e.g., $3/MMBtu coal price and $7/MMBtu electric sector natural gas price), or various combinations of the two could support the level of wind penetration achieved in the Study Scenario.
ES.3.1 Wind Industry and Electric Sector ImpactsIn the Central Study Scenario, total installed wind capacity increases from the 61 GW installed at year-end 2013 to approximately 113 GW by 2020, 224 GW by 2030, and 404 GW by 2050. This growth represents nearly three doublings of installed capacity and includes all wind market segments: land-based, distributed, and offshore wind. Of these installed capacity amounts, offshore wind comprises 3 GW, 22 GW, and 86 GW for 2020, 2030, and 2050, respec-tively. The amount of installed capacity needed to meet the deployment levels considered in the Study
Scenario will depend on future wind technologies. For example, with improvements in wind technology yielding higher capacity factors, only 382 GW of wind capacity is needed to reach the 35% penetration level in 2050. Conversely, 459 GW would be required using today’s technologies without further advancements. Growth in the Study Scenario utilizes approximately 5% of the available land-based wind resource (after exclusions for environmentally sensitive or other protected areas) and 5.5% of the available offshore wind resource of the nation.
The Study Scenario supports new capacity additions at levels comparable to the recent (as of 2013) past, but drives increased demand for new wind turbine equipment as a function of repowering needs. Demand for wind turbines averages approximately 8 GW/year from 2014 to 2020 and 12 GW/year from 2021 to 2030, and increases to 18 GW/year from 2031 to 2050. While aggregate demand trends upward (Figure ES.3-1), it is primarily concentrated in the new land-based segment in the near-term. Deployment of offshore plants and repowering (the replacement of turbine equipment at the end of its useful life with new state-of-the-art turbine equipment) become more significant segments of the industry in the 2031–2050 timeframe.
Although electricity rates increase by 1% between 2020 and 2030, the Central Study Scenario results in a net savings of $149 billion relative to the Baseline Scenario for the period of 2013–2050. Savings are incurred from 2031 to 2050 as fossil fuel prices trend upward and aging power infrastructure requires replacement. Increasing wind generation to the levels of the Study Scenario simultaneously reduces carbon dioxide (CO2) emissions, improves air quality resulting in lower levels of illness and premature loss of life, and reduces demand on water resources, among other impacts.

xliExecutive Summary | Key Chapter Findings
In the Study Scenario, wind industry expenditures (new capital and development expenditures, annual operating expenditures, and repowered capital expenditures) grow to more than $30 billion/year from 2020 to 2030, and are estimated at approxi-mately $70 billion/year by 2050. By 2050, annual expenditures exceed $20 billion/year for operations, $25 billion/year for repowering, and $25 billion/year for new greenfield development.
The Study Scenario suggests continued geographical diversity in wind power deployment. Figure ES.3-2 illustrates the state-level distribution of utility-scale wind capacity (land-based and offshore) in 2030 and 2050 under the Central Study Scenario. By 2030, installed wind capacity exists in all but one state, with 37 states having more than 1 GW of capacity. By 2050, wind capacity exists in all 50 states, with 40 states having more than 1 GW of installed wind capacity. As of 2013, wind installations of 62 MW and 206 MW exist in Alaska and Hawaii respectively. While future wind deployment in these states is expected
and could potentially grow beyond 1 GW, these states are not counted among the states with more than 1 GW in 2030 or 2050 because the modeling analysis was restricted to the 48 contiguous states.
Variations in wind resource quality, relative dis-tances to load centers, and existing infrastructure drive regional differences in modeled wind penetra-tion levels. Based on model outcomes from the Study Scenario, most of the western and central parts of the United States have penetration levels that exceed the 10% nationwide level by 2020, with some regions approaching or exceeding 30% penetration. By 2050, wind penetration levels exceed 40% across much of the West and upper Midwest, with less substantial—but still sizeable—levels in other parts of the country. In the Southeast, wind penetration levels are lower than in other regions, but are significantly higher than levels found in that region in 2013, particularly for coastal areas.
The Study Scenario results in relatively constant new capacity additions but also supports increased demand for turbines due to repowering.
0
5
10
15
20
25
20502045204020352030202520202015201020052000
New land-based RepowerNew o�shore
Ann
ual W
ind
Inst
alla
tions
(GW
/yea
r)
13 GW Peak Installation Year
Historical Study Scenario
Note: New capacity installations include capacity added at a new location to increase the total cumulative installed capacity or to replace retiring capacity elsewhere. Repowered capacity reflects turbine replacements occurring after plants reach their useful lifetime. Wind installations shown here are based on model outcomes for the Central Study Scenario and do not represent projected demand for wind capacity.
The Study Scenario results in relatively constant new capacity additions but also supports increased demand for turbines due to repowering.
Note: New capacity installations include capacity added at a new location to increase the total cumulative installed capacity or to replace retiring capacity elsewhere. Repowered capacity reflects turbine replacements occurring after plants reach their useful lifetime. Wind installations shown here are based on model outcomes for the Central Study Scenario and do not represent projected demand for wind capacity.
Figure ES.3-1. Historical and forward-looking wind power capacity in the Central Study Scenario
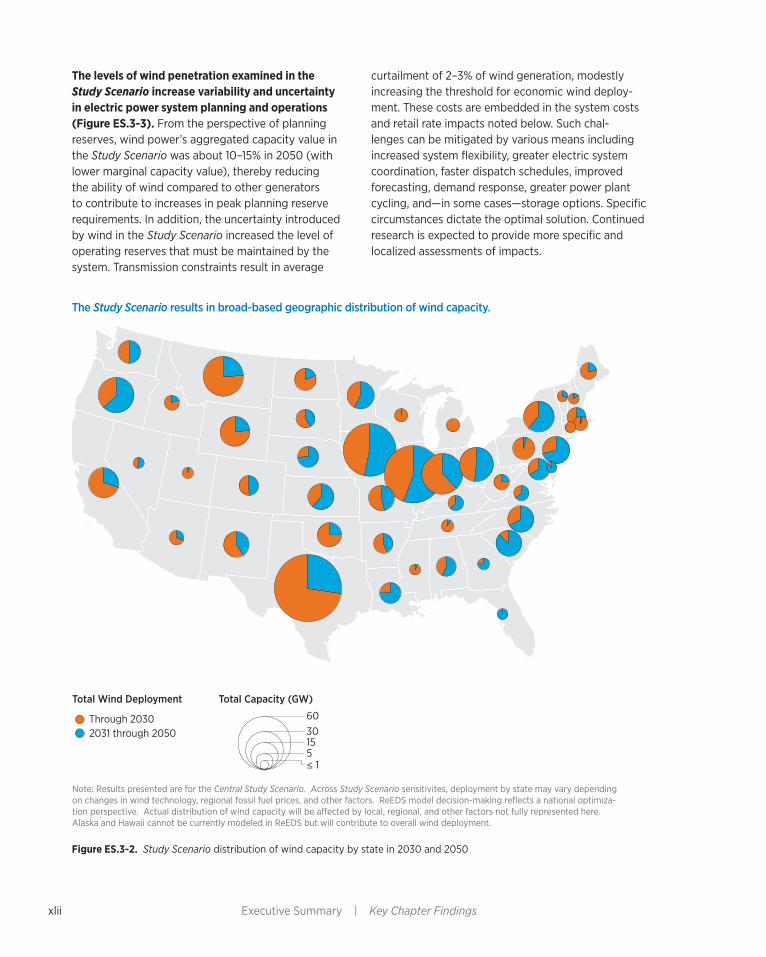
xlii
Through 20302031 through 2050
Total Wind Deployment
The Study Scenario results in broad-based geographic distribution of wind capacity.
Note: Results presented are for the Central Study Scenario. Across Study Scenario sensitivites, deployment by state may vary depending on changes in wind technology, regional fossil fuel prices, and other factors. ReEDS model decision-making reflects a national optimiza-tion perspective. Actual distribution of wind capacity will be a�ected by local, regional, and other factors not fully represented here. Alaska and Hawaii cannot be currently modeled in ReEDS but will contribute to overall wind deployment.
603015
Total Capacity (GW)
5≤ 1
Executive Summary | Key Chapter Findings
The levels of wind penetration examined in the Study Scenario increase variability and uncertainty in electric power system planning and operations (Figure ES.3-3). From the perspective of planning reserves, wind power’s aggregated capacity value in the Study Scenario was about 10–15% in 2050 (with lower marginal capacity value), thereby reducing the ability of wind compared to other generators to contribute to increases in peak planning reserve requirements. In addition, the uncertainty introduced by wind in the Study Scenario increased the level of operating reserves that must be maintained by the system. Transmission constraints result in average
curtailment of 2–3% of wind generation, modestly increasing the threshold for economic wind deploy-ment. These costs are embedded in the system costs and retail rate impacts noted below. Such chal-lenges can be mitigated by various means including increased system flexibility, greater electric system coordination, faster dispatch schedules, improved forecasting, demand response, greater power plant cycling, and—in some cases—storage options. Specific circumstances dictate the optimal solution. Continued research is expected to provide more specific and localized assessments of impacts.
The Study Scenario results in broad-based geographic distribution of wind capacity.
Figure ES.3-2. Study Scenario distribution of wind capacity by state in 2030 and 2050

xliiiExecutive Summary | Key Chapter Findings
The Study Scenario includes impacts that will require investments by the wind industry and the electric sector at large.
Industry Investment Deployment Integrationb Transmissionc Offshore Wind
• 8–11 GW/year average net capacity additions throughout the 2013–2050 period
• 18 GW/year annual turbine demand as more wind plants are repowered from 2031 to 2050
• $70 billion/yeara by 2050 annual wind industry invest-ment from new capacity additions, repowered capacity, and operations and maintenance
• 404 GW of cumu-lative capacity by 2050 for 35% wind energy
• All 50 states with wind deployment by 2050
• 37 states by 2030 and 40 by 2050 with more than 1 GW of wind power (within the con tiguous United States)
• Increased system flexibility is re-quired, but can be acquired from many sources
• 2–3% average cur-tailment of annual wind generation; estimated wind capacity value of 10–15% by 2050
• Integration solu-tions required, but will vary by region
• 2.7x incremental transmission needs by 2030; 4.2x by 2050
• 10 million MW-miles incremental trans-mission capacity required by 2030
Cumulatively 29 million incremental MW-miles required by 2050
• Through 2020: incremental 350 circuit miles/year needed
2021–2030: incremental 890 circuit miles/year, and
2031–2050: incremental 1,050 circuit miles/year
• Established U.S. offshore wind market and supply chain by 2020
• 22 GW installed by 2030 and 86 GW installed by 2050
• By 2050, offshore wind in multiple regions, including the East Coast, West Coast, Great Lakes, and Gulf of Mexico
a. Expenditures in 2013$
b. Increased costs associated with greater demand for system flexibility and wind curtailments are embedded in the system costs and retail rate impacts reported in Chapter 3.
c. All transmission estimates reported are the incremental difference between the Study Scenario and Baseline Scenario. Estimated circuit miles assume a single circuit 345 kV transmission line with a nominal carrying capacity of 900 MW. ReEDS transmission capacity additions exclude those added for reliability purposes only and conductor replacement on existing infrastructure. Estimates shown here represent point to point transfers, for which explicit corridors have not been identified.
Figure ES.3-3. Summary of wind industry and other electric sector impacts in the Central Study Scenario
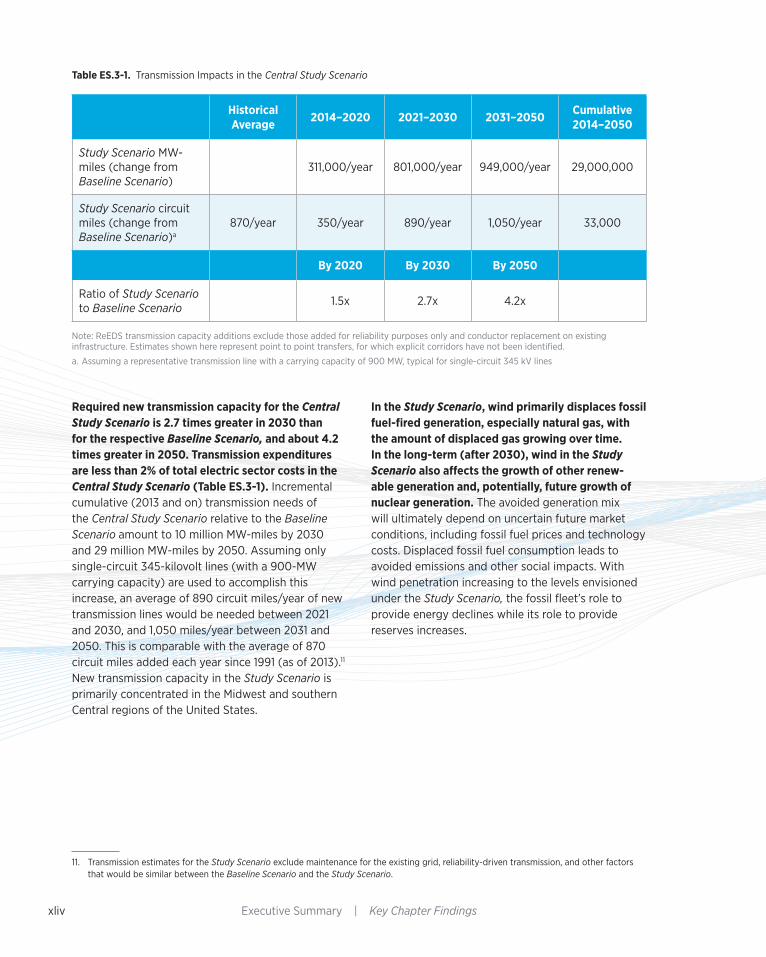
xliv Executive Summary | Key Chapter Findings
Table ES.3-1. Transmission Impacts in the Central Study Scenario
Historical Average 2014–2020 2021–2030 2031–2050 Cumulative
2014–2050
Study Scenario MW-miles (change from Baseline Scenario)
311,000/year 801,000/year 949,000/year 29,000,000
Study Scenario circuit miles (change from Baseline Scenario)a
870/year 350/year 890/year 1,050/year 33,000
By 2020 By 2030 By 2050
Ratio of Study Scenario to Baseline Scenario 1.5x 2.7x 4.2x
Note: ReEDS transmission capacity additions exclude those added for reliability purposes only and conductor replacement on existing infrastructure. Estimates shown here represent point to point transfers, for which explicit corridors have not been identified.
a. Assuming a representative transmission line with a carrying capacity of 900 MW, typical for single-circuit 345 kV lines
Required new transmission capacity for the Central Study Scenario is 2.7 times greater in 2030 than for the respective Baseline Scenario, and about 4.2 times greater in 2050. Transmission expenditures are less than 2% of total electric sector costs in the Central Study Scenario (Table ES.3-1). Incremental cumulative (2013 and on) transmission needs of the Central Study Scenario relative to the Baseline Scenario amount to 10 million MW-miles by 2030 and 29 million MW-miles by 2050. Assuming only single-circuit 345-kilovolt lines (with a 900-MW carrying capacity) are used to accomplish this increase, an average of 890 circuit miles/year of new transmission lines would be needed between 2021 and 2030, and 1,050 miles/year between 2031 and 2050. This is comparable with the average of 870 circuit miles added each year since 1991 (as of 2013).11 New transmission capacity in the Study Scenario is primarily concentrated in the Midwest and southern Central regions of the United States.
11. Transmission estimates for the Study Scenario exclude maintenance for the existing grid, reliability-driven transmission, and other factors that would be similar between the Baseline Scenario and the Study Scenario.
In the Study Scenario, wind primarily displaces fossil fuel-fired generation, especially natural gas, with the amount of displaced gas growing over time. In the long-term (after 2030), wind in the Study Scenario also affects the growth of other renew-able generation and, potentially, future growth of nuclear generation. The avoided generation mix will ultimately depend on uncertain future market conditions, including fossil fuel prices and technology costs. Displaced fossil fuel consumption leads to avoided emissions and other social impacts. With wind penetration increasing to the levels envisioned under the Study Scenario, the fossil fleet’s role to provide energy declines while its role to provide reserves increases.
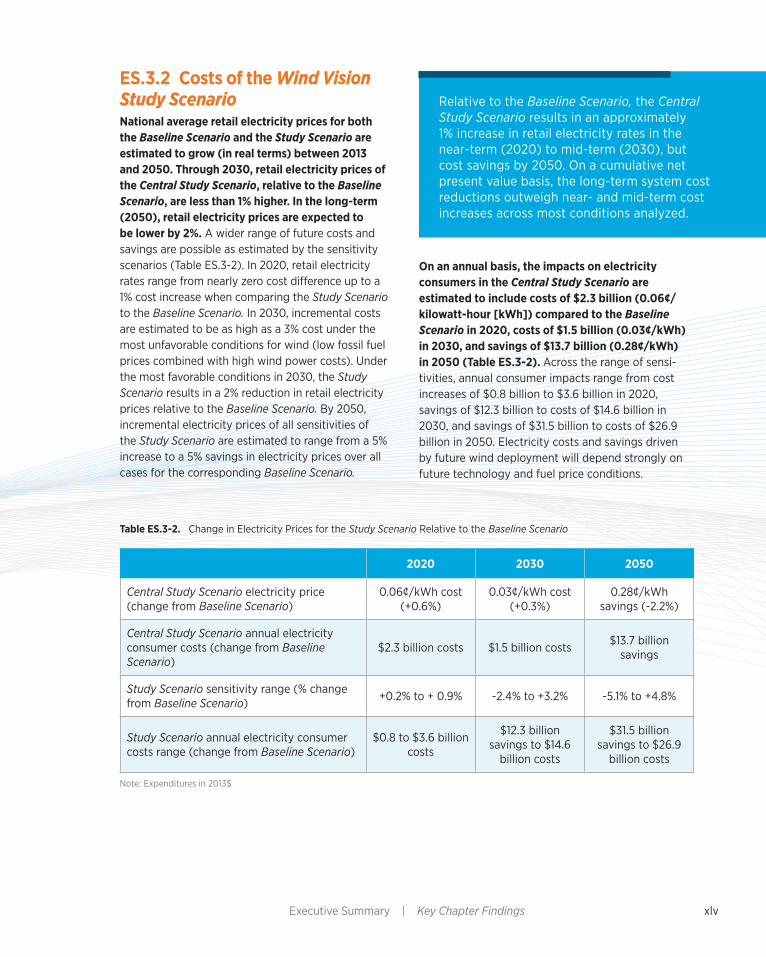
xlvExecutive Summary | Key Chapter Findings
Table ES.3-2. Change in Electricity Prices for the Study Scenario Relative to the Baseline Scenario
2020 2030 2050
Central Study Scenario electricity price (change from Baseline Scenario)
0.06¢/kWh cost (+0.6%)
0.03¢/kWh cost (+0.3%)
0.28¢/kWh savings (-2.2%)
Central Study Scenario annual electricity consumer costs (change from Baseline Scenario)
$2.3 billion costs $1.5 billion costs $13.7 billion savings
Study Scenario sensitivity range (% change from Baseline Scenario) +0.2% to + 0.9% -2.4% to +3.2% -5.1% to +4.8%
Study Scenario annual electricity consumer costs range (change from Baseline Scenario)
$0.8 to $3.6 billion costs
$12.3 billion savings to $14.6
billion costs
$31.5 billion savings to $26.9
billion costs
Note: Expenditures in 2013$
ES.3.2 Costs of the Wind Vision Study ScenarioNational average retail electricity prices for both the Baseline Scenario and the Study Scenario are estimated to grow (in real terms) between 2013 and 2050. Through 2030, retail electricity prices of the Central Study Scenario, relative to the Baseline Scenario, are less than 1% higher. In the long-term (2050), retail electricity prices are expected to be lower by 2%. A wider range of future costs and savings are possible as estimated by the sensitivity scenarios (Table ES.3-2). In 2020, retail electricity rates range from nearly zero cost difference up to a 1% cost increase when comparing the Study Scenario to the Baseline Scenario. In 2030, incremental costs are estimated to be as high as a 3% cost under the most unfavorable conditions for wind (low fossil fuel prices combined with high wind power costs). Under the most favorable conditions in 2030, the Study Scenario results in a 2% reduction in retail electricity prices relative to the Baseline Scenario. By 2050, incremental electricity prices of all sensitivities of the Study Scenario are estimated to range from a 5% increase to a 5% savings in electricity prices over all cases for the corresponding Baseline Scenario.
On an annual basis, the impacts on electricity consumers in the Central Study Scenario are estimated to include costs of $2.3 billion (0.06¢/kilowatt-hour [kWh]) compared to the Baseline Scenario in 2020, costs of $1.5 billion (0.03¢/kWh) in 2030, and savings of $13.7 billion (0.28¢/kWh) in 2050 (Table ES.3-2). Across the range of sensi-tivities, annual consumer impacts range from cost increases of $0.8 billion to $3.6 billion in 2020, savings of $12.3 billion to costs of $14.6 billion in 2030, and savings of $31.5 billion to costs of $26.9 billion in 2050. Electricity costs and savings driven by future wind deployment will depend strongly on future technology and fuel price conditions.
Relative to the Baseline Scenario, the Central Study Scenario results in an approximately 1% increase in retail electricity rates in the near-term (2020) to mid-term (2030), but cost savings by 2050. On a cumulative net present value basis, the long-term system cost reductions outweigh near- and mid-term cost increases across most conditions analyzed.

xlvi Executive Summary | Key Chapter Findings
In present value terms, cumulative electric sector expenditures (fuel, capital, operating, and trans-mission) are lower for the Study Scenario than for the Baseline Scenario under Central conditions and many sensitivities. From 2013 to 2050, the Central Study Scenario results in cumulative present value (3% real discount rate) savings of approximately $149 billion (-3%). Potential electricity sector expenditures range from savings of $388 billion (-7%) to a cost increase of $254 billion (+6%), depending on future wind power cost trends and fossil fuel prices.
ES.3.3 Benefits of the Study ScenarioThe Central Study Scenario reduces electric sector life-cycle GHG emissions by 6% in 2020 (0.13 gigatonnes CO2-equivalents), 16% in 2030 (0.38 gigatonnes CO2-equivalents), and 23% in 2050 (0.51 gigatonnes CO2-equivalents), compared to the Baseline Scenario. Cumulative GHG emissions are reduced by 12.3 gigatonnes CO2-equivalents from 2013 to 2050 (14%) (Figure ES.3-4). Based on the U.S. Interagency Working Group’s Social Cost of Carbon estimates, these reductions yield global avoided climate change damages estimated at $85–$1,230 billion, with a central estimate of $400 billion (2013–2050 discounted present value). This
The Central Study Scenario results in a 16% reduction in carbon dioxide (CO2) emissions by 2030 and 23% by 2050 from the electricity sector, relative to the Baseline Scenario. Other air pollutants affecting public health also decrease and water savings accrue in many regions of the country, including arid water-stressed regions in the Southwest. The estimated value of CO2 reductions ranges from $85–$1,230 billion, while reductions in other air pollutants are valued at $52–$272 billion.
Life
-Cyc
le G
HG
Em
issi
ons
in E
lect
ric S
ecto
r (g
igat
onne
s CO
2e/y
ear)
Cumulative Reductions:
2013–2030: 3.3 gigatonnes CO2e (8%)
2013–2050: 12.3 gigatonnes CO2e (14%)
Baseline Scenario Study Scenario
0.0
0.5
1.0
1.5
2.0
2.5
3.0
2010 2020 2030 2040 2050
Note: Life-cycle GHG emissions consider upstream emissions (e.g., manu-facturing and raw materials), ongoing combustion and non-combustion emissions, and downstream emissions (e.g., decommissioning).
Life-cycle GHG emissions are lower in the Central Study Scenario than in the Baseline Scenario.Life-cycle GHG emissions are lower in the Central Study Scenario than in the Baseline Scenario.
Note: Life-cycle GHG emissions consider upstream emissions (e.g., manufacturing and raw materials), ongoing combustion and non-combustion emissions, and downstream emissions (e.g., decommissioning).
Figure ES.3-4. Lifecycle GHG emissions in the Central Study Scenario and Baseline Scenario
Table ES.3-3. Health Benefits in 2050 of Reduced Air Pollution in the Central Study Scenario
Type of Benefit Amounts
Cumulative monetized benefits (2013$) $108 billion
Avoided premature deaths 21,700
Avoided emergency room visits for asthma due to PM2.5 effects
10,100
Avoided school loss days due to ozone effects 2,459,600
Note: Central estimate results are presented, which follow the ‘EPA Low’ methodology for calculating benefits, further detailed in Chapter 3. Monetized benefits are discounted at 3%, but mortality and mor-bidity values are simply accumulated over the 2013–2050 time period. Health impacts presented here are a subset of those analyzed. PM2.5 is particulate matter of diameter 2.5 microns or less. The full set of results is presented in detail in Chapter 3.
is equivalent to a benefit of wind energy that ranges from 0.7¢–10¢/kWh of wind, with a central benefit estimate of 3.2¢/kWh of wind.
The Central Study Scenario results in reductions in other air pollutants (e.g., PM, SO2, and NOx), yielding societal health and environmental benefits that range from $52–$272 billion (2013–2050, dis-counted present values) depending on the methods of quantification. The majority of the benefits come from reduced premature mortality due to reductions in SO2 emissions in the eastern United States. In total, the health and environmental benefits are equivalent to a benefit of wind energy that ranges from 0.4¢/kWh of wind to 2.2¢/kWh of wind. Table ES.3-3 highlights some of the air pollution benefits.

xlviiExecutive Summary | Key Chapter Findings
The Central Study Scenario results in reduced national electric-sector water withdrawals (1% in 2020, 4% in 2030, and 15% in 2050) and water consumption (4% in 2020, 11% in 2030, and 23% in 2050) compared to the Baseline Scenario. Antici-pated reductions, relative to the Baseline Scenario, exist in many parts of the United States, including the water-stressed arid states in the Southwest (Figure ES.3-5). Reductions in water use driven by the Study Scenario would have environmental and economic benefits, and would help reduce competition for scarce water resources.
The value of reduced GHG and air pollution emis-sions in the Central Study Scenario relative to the Baseline Scenario exceeds the under 1% cost increase in electricity rates in 2020 and 2030. By 2050, the
Central Study Scenario results in savings across all three categories—electricity rates, GHG emissions, and air pollution emissions (Figure ES.3-6). Savings are also incurred on a cumulative basis across all three metrics (Figure ES.3-7). The range of GHG benefits was estimated following the Interagency Working Group’s Social Cost of Carbon methodology and varying discount rates. The range of air pollution benefits was calculated following methodologies of the U.S. Environmental Protection Agency (EPA) and the Air Pollution Emission Experiments and Policy model, known as AP2. Several other categories of impacts such as water use are analyzed but not mon-etized, due to a lack of established peer-reviewed, national-scale methodologies.
Electric sector water consumption is 23% lower in the Central Study Scenario relative to the Baseline Scenario by 2050.
Figure ES.3-5. Change in water consumption used in electricity generation from 2013 to 2050 for the Baseline Scenario and Central Study Scenario
Percent Change-60 to -100-30 to -600 to -3000 to 1010 to 2020 to 40Baseline Scenario (2050) Study Scenario (2050)
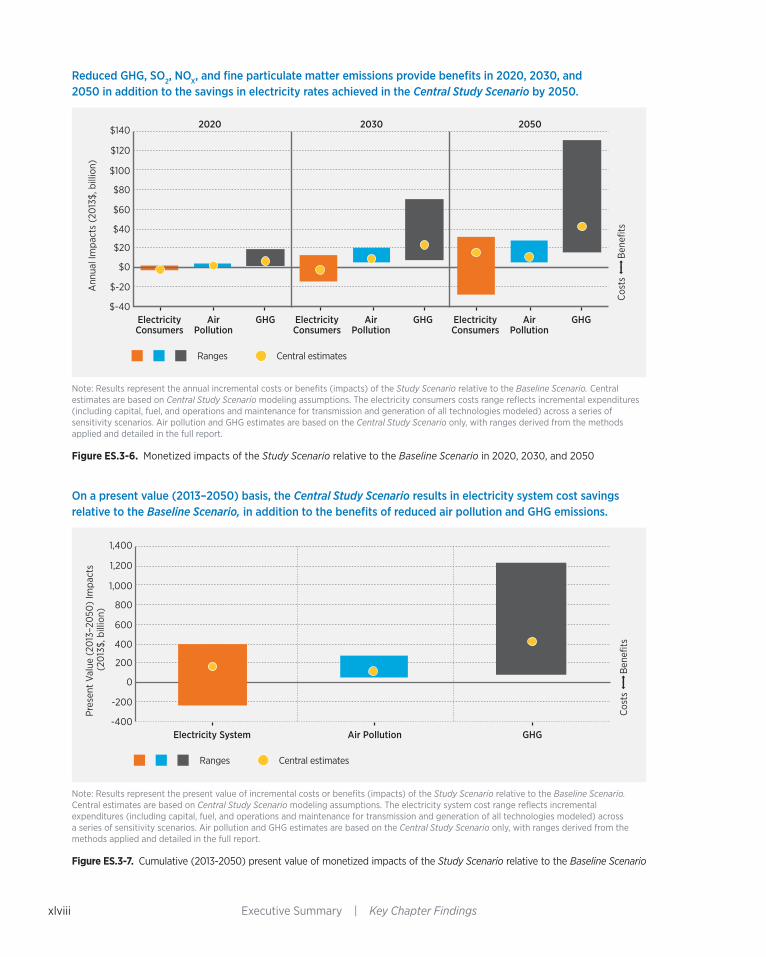
xlviii Executive Summary | Key Chapter Findings
Ranges Central estimates
Ann
ual I
mpa
cts
(20
13$,
bill
ion)
$-40
$-20
$0
$20
$40
$60
$80
$100
$120
$140
GHGAirPollution
ElectricityConsumers
Cos
ts ©ª
Ben
efits
GHGAirPollution
ElectricityConsumers
GHGAirPollution
ElectricityConsumers
2020 2030 2050
Note: Results represent the present value of incremental costs or benefits (impacts) of the Study Scenario relative to the Baseline Scenario. Central estimates are based on Central Study Scenario modeling assumptions. The electricity consumer costs range reflects incremental expenditures (including capital, fuel, and O&M for transmission and generation of all technologies modeled) across a series of sensitivity scenarios. Air pollution and GHG estimates are based on the Central Study Scenario only, with ranges derived from the methods applied and detailed in the full report.
Ranges Central estimates
Pres
ent
Valu
e (2
013
–20
50)
Impa
cts
(20
13$,
bill
ion)
-200
-400
0
200
400
600
800
1,000
1,200
1,400
Cos
ts ©ª
Ben
efits
Electricity System Air Pollution GHG
Note: Results represent the present value of incremental costs or benefits (impacts) of the Study Scenario relative to the Baseline Scenario. Central estimates are based on Central Study Scenario modeling assumptions. The electricity system cost range reflects incremental expenditures (including capital, fuel, and O&M for transmission and generation of all technologies modeled) across a series of sensitivity scenarios. Air pollution and GHG estimates are based on the Central Study Scenario only, with ranges derived from the methods applied and detailed in the full report.
Reduced GHG, SO2, NOX, and fine particulate matter emissions provide benefits in 2020, 2030, and 2050 in addition to the savings in electricity rates achieved in the Central Study Scenario by 2050.
On a present value (2013–2050) basis, the Central Study Scenario results in electricity system cost savings relative to the Baseline Scenario, in addition to the benefits of reduced air pollution and GHG emissions.
Note: Results represent the annual incremental costs or benefits (impacts) of the Study Scenario relative to the Baseline Scenario. Central estimates are based on Central Study Scenario modeling assumptions. The electricity consumers costs range reflects incremental expenditures (including capital, fuel, and operations and maintenance for transmission and generation of all technologies modeled) across a series of sensitivity scenarios. Air pollution and GHG estimates are based on the Central Study Scenario only, with ranges derived from the methods applied and detailed in the full report.
Figure ES.3-6. Monetized impacts of the Study Scenario relative to the Baseline Scenario in 2020, 2030, and 2050
Note: Results represent the present value of incremental costs or benefits (impacts) of the Study Scenario relative to the Baseline Scenario. Central estimates are based on Central Study Scenario modeling assumptions. The electricity system cost range reflects incremental expenditures (including capital, fuel, and operations and maintenance for transmission and generation of all technologies modeled) across a series of sensitivity scenarios. Air pollution and GHG estimates are based on the Central Study Scenario only, with ranges derived from the methods applied and detailed in the full report.
Figure ES.3-7. Cumulative (2013-2050) present value of monetized impacts of the Study Scenario relative to the Baseline Scenario

xlixExecutive Summary | Key Chapter Findings
ES.3.4 Additional Impacts Associated with the Study ScenarioThe Study Scenario contributes to a reduction in both long-term natural gas price risk and natural gas prices, compared to the Baseline Scenario. The Central Study Scenario results in total electric system costs that are 20% less sensitive to long-term fluctuations in coal and natural gas prices (Figure ES.3-8). Additionally, the Central Study Scenario leads to a potential $280 billion in consumer savings due to reduced natural gas prices outside the electric sector, equivalent to a levelized consumer benefit from wind energy of 2.3¢/kWh of wind.
The Study Scenario supports a robust domestic wind industry, with wind-related gross jobs from invest-ments in new and operating wind plants ranging from 201,000–265,000 in 2030 and increasing to 526,000–670,000 in 2050 (Figure ES.3-8). Actual future wind-related jobs (on-site, supply chain, and induced) will depend on the future strength of the domestic supply chain and additional training and educational programs as necessary.
Wind project development examined in the Wind Vision affects local communities through land lease payments and local property taxes. Under the Central Study Scenario, wind power capacity addi-tions lead to land-based lease payments that increase from $350 million in 2020 to $650 million in 2030, to $1,020 million in 2050. Offshore wind lease payments increase from $15 million in 2020 to $110 million in 2030, to $440 million in 2050. Property tax payments associated with wind projects are estimated to be $900 million in 2020; $1,770 million in 2030; and $3,200 million in 2050.
Under the Central Study Scenario, the land area occupied by turbines, roads, and other infrastructure equates to 0.03% of total land area in the contigu-ous United States in 2030 and 0.04% in 2050. This land area equates to less than one-third of total land area occupied by U.S. golf courses in 2013. Total land area occupied by wind plants in 2050 (accounting for requisite turbine spacing and typical densities) equates to less than 1.5% of the total land area in the contiguous United States.
Continued wind deployment will need to account for the potential impacts on avian, bat, and other wildlife populations; the local environment; the landscape; and communities and individuals living in proximity to wind projects. Continued research, technological solutions (e.g., strategic operational strategies and wildlife deterrents), and experience are anticipated to make siting and mitigation more effective and efficient.
Other impacts from the Study Scenario include reduced sensitivity (20% less) to future fossil fuel price volatility, support for a vibrant wind industry supply chain (526,000–670,000 jobs by 2050), and increased tax revenue and lease payments to local communities. In addition, the Study Scenario results in manageable but non-trivial impacts to land use, local wildlife populations, and host communities.

l Executive Summary | Key Chapter Findings
The Study Scenario results in cumulative savings, benefits, and an array of additional impacts by 2050.
System Costsa Benefitsb,c
$149 billion (3%) lower cumulative electric sector expenditures
14% reduction in cumulative GHG emissions (12.3 giga-tonnes CO2-equivalents), saving $400 billion in avoided global damages
$108 billion savings in avoided mortality, mor bidity, and economic damages from cumulative reductions in emissions of SO2, NOX, and PM
21,700 premature deaths from air pollution avoided
23% less water consump-tion and 15% less water withdrawals for the electric power sector
Additional Impacts
Energy Diversity Jobs Local Revenues Land UsePublic Acceptance
and Wildlife
Increased wind power adds fuel diversity, making the overall electric sector 20% less sensitive to changes in fossil fuel costs.
The predictable, long-term costs of wind power create down-ward price pressure on fossil fuels that can cumula tively save con sumers $280 billion from lower natural gas prices out side the electric sector.
Approximately 600,000 wind-related gross jobs spread across the nation.
$1 billion in annual land lease payments
$440 million annual lease payments for offshore wind plants
More than $3 billion in annual property tax payments
Less than 1.5% (106,000 km2) of contiguous U.S. land area occupied by wind power plants
Less than 0.04% (3,300 km2) of contiguous U.S. land area impacted by turbine pads, roads, and other associated infrastructure
Careful siting, continued research, thoughtful public engagement, and an emphasis on opti-mizing coexistence can support con-tinued responsible deployment that minimizes or eliminates negative impacts to wildlife and local communities
Note: Cumulative costs and benefits are reported on a Net Present Value basis for the period of 2013 through 2050 and reflect the difference in impacts between the Central Study Scenario and the Baseline Scenario. Results reported here reflect central estimates within a range; see Chapter 3 for additional detail. Financial results are reported in 2013$ except where otherwise noted.
a. Electric sector expenditures include capital, fuel, and operations and maintenance for transmission and generation of all technologies modeled, but excludes consideration of estimated benefits (e.g., GHG emissions).
b. Morbidity is the incidence of disease or rate of sickness in a population.
c. Water consumption refers to water that is used and not returned to the source. Water withdrawals are eventually returned to the water source.
Figure ES.3-8. Summary of costs, benefits, and other outcomes associated with the Study Scenario relative to the Baseline Scenario by 2050

liExecutive Summary | Key Chapter Findings
ES.3.5 Impacts Specific to Offshore and Distributed WindThe Study Scenario contributions from offshore wind are characterized by an industrial base that evolves from its nascent state in 2013 to one that can supply more than 80 GW of offshore capacity by 2050. This deployment represents just 5.5% of the resource potential for offshore areas adjacent to the 28 coastal and Great Lakes states. Under this scenario, the offshore wind industry would complement and bolster a strong land-based industry through the use of common supply chain components and the devel-opment of workforce synergies.
The cost of offshore wind needs to be aggressively reduced. Through innovation and increasing scale, however, this market segment could bring notable potential benefits. In particular, offshore wind offers the ability to reduce wholesale market power clearing prices and consumer costs in transmission-con-gested coastal areas, supports local jobs and port
development opportunities, and offers geographic proximity to densely populated coastal regions with limited renewable power alternatives.
Distributed wind applications, including custom-er-sited wind and wind turbines embedded in distribution networks, offer a number of unique and relevant attributes. On-site distributed wind turbines allow farmers, schools, and other energy users to ben-efit from reduced utility bills, predictable costs, and a hedge against the possibility of rising retail electricity rates. At the same time, decentralized generation such as distributed wind can benefit the electrical grid. Distributed wind also supports a domestic market; U.S. suppliers dominate the domestic small wind turbine market with 93% of 2013 sales on a unit basis and 88% on a capacity basis. These suppliers also maintain domestic content levels of 80–95% for turbine and tower hardware and are well positioned to capitalize on export opportunities, including the growing demand for decentralized electricity around the globe.
ES.4 The Wind Vision Roadmap: A Pathway ForwardThe roadmap was developed through a collaborative effort led by DOE, with contributions and rigorous peer review from industry, the electric power sector, environmental stewardship organizations, academia, national labs, and participants at various levels of government. It defines specific top-level activities for all major stakeholder sectors, including the wind industry, the wind research community, and others. Though the roadmap includes actions intended to inform analysis of various policy options, it is beyond the scope and purview of the Wind Vision to suggest policy preferences or recommendations, and no attempt is made to do so.
The objective of the Wind Vision roadmap is to identify the challenges and actions necessary to increase the opportunities for U.S. wind deployment. This portfolio of actions (Chapter 4 and Appendix M) builds upon the successes of wind power to date and addresses remaining gaps. The actions cover the major domestic wind applications on land (including
distributed applications) and offshore. Additionally, the roadmap provides a framework from which others can define specific activities at greater levels of detail.
The Wind Vision Study Scenario was created for the purpose of examining costs and benefits. Although it represents a potential future for wind growth, it is unlikely to be realized without continued technology and systems improvements. In aggregate, the road-map actions are a series of steps that can be expected to increase the likelihood of achieving wind power growth at the levels considered in the Study Scenario.
The Wind Vision includes a detailed roadmap of technical and institutional actions necessary to overcome the challenges to wind power making a significant contribution to a cleaner, low-carbon, domestic energy economy.

lii Executive Summary | Key Chapter Findings
ES.4.1 Core Roadmap ActionsOptimizing wind contributions requires coordination among multiple parties who can implement a set of complementary approaches around three agreed-upon themes (Table ES.4-1):
1. Reduce Wind Costs: Chapter 3 of the Wind Vision report indicates that the costs associated with the Study Scenario can be reduced across the range of sensitivities with wind cost reductions. Accordingly, reductions in LCOE are a priority focus. This theme includes actions to reduce capital costs; reduce annual operating expenses; optimize annual energy production and reduce curtailment and system losses; reduce financing expenses; reduce grid inte-gration and operating expenses; and reduce market barrier costs, including regulatory and permitting, environmental, and radar mitigation costs.
2. Expand Developable Areas: Expansion of wind power into high-quality resource areas is also important for realizing the Study Scenario at cost levels described in Chapter 3 of the Wind Vision report. Key actions within this theme include actions to expand transmission; responsibly expand developable geographic regions and sites; improve the potential of low-wind-speed locales; improve the potential of ocean and Great Lakes offshore regions; improve the potential in areas requiring careful consideration of wildlife, aviation, telecommunication, or other environmental issues; and improve the potential of high wind resource locations that have poor access to electricity transmission infrastructure. National parks, densely populated locations, and sensitive areas such as federally designated critical habitat are generally excluded from the roadmap actions, since they are likely not to be developed as wind sites.
3. Increase Economic Value for the Nation: The Study Scenario projects substantial benefits for the nation, but additional steps are needed to ensure these benefits are realized and maximized. This theme includes actions to provide detailed and accurate data on costs and benefits for decision makers; grow and maintain U.S. manufacturing throughout the supply chain; train and hire a U.S. workforce; provide diversity in the electricity gen-erating portfolio; and provide a hedge against fossil fuel price increases. The overall aim is to ensure that wind power continues to provide enduring value for the nation.
High-level roadmap actions are summarized in Text Box ES.4-1 and explained in detail in the Wind Vision report (Chapter 4 and Appendix M). These core roadmap actions fall into nine action areas: wind power resources and site characterization; wind plant technology advancement; supply chain, man-ufacturing, and logistics; wind power performance, reliability, and safety; wind electricity delivery and integration; wind siting and permitting; collaboration, education, and outreach; workforce development; and policy analysis.
The roadmap is the beginning of an evolving, collab-orative, and necessarily dynamic process. The Wind Vision roadmap is not prescriptive. It does not detail how suggested actions are to be accomplished; it is left to the responsible organizations to determine the optimum timing and sequences of specific activities. It suggests an approach of continual updates to assess impacts and redirect activities as necessary and appropriate through 2050. These updates, which are intended to be conducted at least every two years, would be informed by analysis and would ensure that the roadmap adapts to changing technol-ogy, market, and political factors.
The Wind Vision depicts a future in which wind power has the potential to be a significant con-tributor to a cost-effective, reliable, low-carbon U.S. energy portfolio. Optimizing U.S. wind power’s impact and value will require strategic planning and continued contributions across a wide range of stakeholders, such as state and federal agencies and government, utility companies, equipment research and development organizations, manufacturers, national laboratories, and academic institutions. Bringing these participants together on a regular basis to revisit this roadmap and update priorities will be essential to maintaining and sustaining focus on wind power’s long-term future for the nation.

liiiExecutive Summary | Key Chapter Findings
Table ES.4-1. Roadmap Strategic Approach
Core Challenge
Wind has the potential to be a significant and enduring contributor to a cost-effective, reliable, low carbon, U.S. energy portfolio. Optimizing U.S. wind power’s impact and value will require strategic planning and continued contributions across a wide range of participants.
Key Themes
Reduce Wind CostsCollaboration to reduce wind costs through wind technology capital and operating cost reductions, increased energy capture, improved reliability, and development of planning and operating practices for cost-effective wind integration.
Expand Developable AreasCollaboration to increase market access to U.S. wind resources through improved power system flexibility and transmission expansion, tech-nology development, stream-lined siting and permitting processes, and environmental and competing use research and impact mitigation.
Increase Economic Value for the NationCollaboration to support a strong and self-sustaining domestic wind industry through job growth, improved competitiveness, and articu-lation of wind’s benefits to inform decision making.
Issues Addressed
Continuing declines in wind power costs and improved reliability are needed to improve market competition with other electricity sources.
Continued reduction of deployment barriers as well as enhanced mitigation strategies to responsibly improve market access to remote, low wind speed, offshore, and environmentally sensitive locations.
Capture the enduring value of wind power by analyzing job growth opportunities, evaluating existing and proposed policies, and disseminating credible information.
Wind Vision Study
Scenario Linkages
Levelized cost of electricity reduction trajectory of 24% by 2020, 33% by 2030, and 37% by 2050 for land-based wind power technology and 22% by 2020, 43% by 2030, and 51% by 2050 for offshore wind power technology to substantially reduce or eliminate the near- and mid-term incremental costs of the Study Scenario.
Wind deployment sufficient to enable national wind electricity generation shares of 10% by 2020, 20% by 2030, and 35% by 2050.
A sustainable and competitive regional and local wind industry supporting substantial domestic employment. Public benefits from reduced emissions and consumer energy cost savings.
Roadmap Action Areasa
• Wind Power Resources and Site Characterization
• Wind Plant Technology Advancement
• Supply Chain, Manufac-turing, and Logistics
• Wind Power Performance, Reliability, and Safety
• Wind Electricity Delivery and Integration
• Wind Siting and Permitting• Collaboration, Education,
and Outreach• Workforce Development• Policy Analysis
• Wind Power Resources and Site Characterization
• Wind Plant Technology Advancement
• Supply Chain, Manufacturing, and Logistics
• Wind Electricity Delivery and Integration
• Wind Siting and Permitting• Collaboration, Education,
and Outreach• Policy Analysis
• Supply Chain, Manufacturing, and Logistics
• Collaboration, Education, and Outreach
• Workforce Development• Policy Analysis
a. Several action areas address more than one key theme.

liv Executive Summary | Key Chapter Findings
Text Box ES-1. High-Level Wind Vision Roadmap Actions
1 Wind Power Resources and Site CharacterizationAction 1.1 – Improve Wind Resource Characterization. Collect data and develop models to improve wind forecast-ing at multi ple temporal scales—e.g., minutes, hours, days, months, years.
Action 1.2 – Understand Intra-Plant Flows. Collect data and improve models to understand intra-plant flow, including turbine-to-turbine interactions, micro-siting, and array effects.
Action 1.3 – Characterize Offshore Wind Resources. Collect and analyze data to characterize offshore wind resources and external design conditions for all coastal regions of the United States, and to validate forecasting and design tools and models at heights at which offshore turbines operate.
2 Wind Plant Technology AdvancementAction 2.1 – Develop Next-Generation Wind Plant Tech-nology. Develop next-generation wind plant technology for rotors, controls, drivetrains, towers, and offshore founda-tions for continued improvements in wind plant perfor-mance and scale-up of turbine technology.
Action 2.2 – Improve Standards and Certification Processes. Update design standards and certification processes using validated simulation tools to enable more flexibility in application and reduce overall costs.
Action 2.3 – Improve and Validate Advanced Simulation and System Design Tools. Develop and validate a compre-hensive suite of engineering, simulation, and physics-based tools that enable the design, analysis and certification of advanced wind plants. Improve simulation tool accuracy, flexibility, and ability to handle innovative new concepts.
Action 2.4 – Establish Test Facilities. Develop and sustain world-class testing facilities to support industry needs and continued innovation.
Action 2.5 – Develop Revolutionary Wind Power Systems. Invest research and development (R&D) into high-risk, potentially high-reward technology innovations.
3 Supply Chain, Manufacturing and LogisticsAction 3.1 – Increase Domestic Manufacturing Competi-tiveness. Increase domestic manufacturing competitiveness with investments in advanced manufacturing and research into innovative materials.
Action 3.2 – Develop Transportation, Construction, and Installation Solutions. Develop transportation, construction and installation solutions for deployment of next-generation, larger wind turbines.
Action 3.3 – Develop Offshore Wind Manufacturing and Supply Chain. Establish domestic offshore manufacturing, supply chain, and port infrastructure.
4 Wind Power Performance, Reliability, and SafetyAction 4.1 – Improve Reliability and Increase Service Life. Increase reliability by reducing unplanned maintenance through better design and testing of components, and through broader adoption of condition monitoring systems and maintenance.
Action 4.2 – Develop a World-Class Database on Wind Plant Operation under Normal Operating Conditions. Collect wind turbine performance and reliability data from wind plants to improve energy production and reliability under normal operating conditions.
Action 4.3 – Ensure Reliable Operation in Severe Operating Environments. Collect data, develop testing methods, and improve standards to ensure reliability under severe oper-ating conditions including cold weather climates and areas prone to high force winds.
Action 4.4 – Develop and Document Best Practices in Wind O&M. Develop and promote best practices in operations and maintenance (O&M) strategies and procedures for safe, optimized operations at wind plants.
Action 4.5 – Develop Aftermarket Technology Upgrades and Best Practices for Repowering and Decommissioning. Develop aftermarket upgrades to existing wind plants and establish a body of knowledge and research on best prac-tices for wind plant repowering and decommissioning.
Continues next page

lvExecutive Summary | Key Chapter Findings
Text Box ES-1. (Continued) High-Level Wind Vision Roadmap Actions
5 Wind Electricity Delivery and IntegrationAction 5.1 – Encourage Sufficient Transmission. Collabo-rate with the electric power sector to encourage sufficient transmission to deliver potentially remote generation to electricity consumers and provide for economically efficient operation of the bulk power system over broad geographic and electrical regions.
Action 5.2 – Increase Flexible Resource Supply. Collaborate with the electric power sector to promote increased flexi-bility from all resources including conventional generation, demand response, wind and solar generation, and storage.
Action 5.3 – Encourage Cost-Effective Power System Operation with High Wind Penetration. Collaborate with the electric power sector to encourage operating practices and market structures that increase cost-effectiveness of power system operation with high levels of wind power.
Action 5.4 – Provide Advanced Controls for Grid Integra-tion. Optimize wind power plant equipment and control strategies to facilitate integration into the electric power system, and provide balancing services such as regulation and voltage control.
Action 5.5 – Develop Optimized Offshore Wind Grid Architecture and Integration Strategies. Develop optimized subsea grid delivery systems and evaluate the integration of offshore wind under multiple arrangements to increase utility confidence in offshore wind.
Action 5.6 – Improve Distributed Wind Grid Integration. Improve grid integration of and increase utility confidence in distributed wind systems.
6 Wind Siting and PermittingAction 6.1 – Develop Mitigation Options for Competing Human Use Concerns. Develop impact reduction and mitigation options for competing human use concerns such as radar, aviation, maritime shipping, and navigation.
Action 6.2 – Develop Strategies to Minimize and Mitigate Siting and Environmental Impacts. Develop and disseminate relevant information as well as minimization and mitigation strategies to reduce the environmental impacts of wind power plants, including impacts on wildlife.
Action 6.3 – Develop Information and Strategies to Mitigate the Local Impact of Wind Deployment and Operation. Continue to develop and disseminate accurate information to the public on local impacts of wind power deployment and operations.
Action 6.4 – Develop Clear and Consistent Regulatory Guidelines for Wind Development. Streamline regulatory guidelines for responsible project development on federal, state, and private lands, as well as in offshore areas.
Action 6.5 – Develop Wind Site Pre-Screening Tools. Develop commonly accepted standard siting and risk assessment tools allowing rapid pre-screening of potential development sites.
7 Collaboration, Education, and OutreachAction 7.1 – Provide Information on Wind Power Impacts and Benefits. Increase public understanding of broader societal impacts of wind power, including economic impacts; reduced emissions of carbon dioxide, other greenhouse gases, and chemical and particulate pollutants; less water use; and greater energy diversity.
Action 7.2 – Foster International Exchange and Collab-oration. Foster international exchange and collaboration on technology R&D, standards and certifications, and best practices in siting, operations, repowering, and decommissioning.
8 Workforce DevelopmentAction 8.1 – Develop Comprehensive Training, Workforce, and Educational Programs. Develop comprehensive training, workforce, and education programs, with engagement from
primary schools through university degree programs, to encourage and anticipate the technical and advanced-degree workforce needed by the industry.
9 Policy AnalysisAction 9.1 – Refine and Apply Energy Technology Cost and Benefit Evaluation Methods. Refine and apply methodologies to comprehensively evaluate and compare the costs, benefits, risks, uncertainties, and other impacts of energy technologies.
Action 9.2 – Refine and Apply Policy Analysis Methods. Refine and apply policy analysis methodologies to under-stand federal and state policy decisions affecting the electric sector portfolio.
Action 9.3 – Maintain the Roadmap as a Vibrant, Active Process for Achieving the Wind Vision Study Scenario. Track wind technology advancement and deployment progress, prioritize R&D activities, and regularly update the wind roadmap.
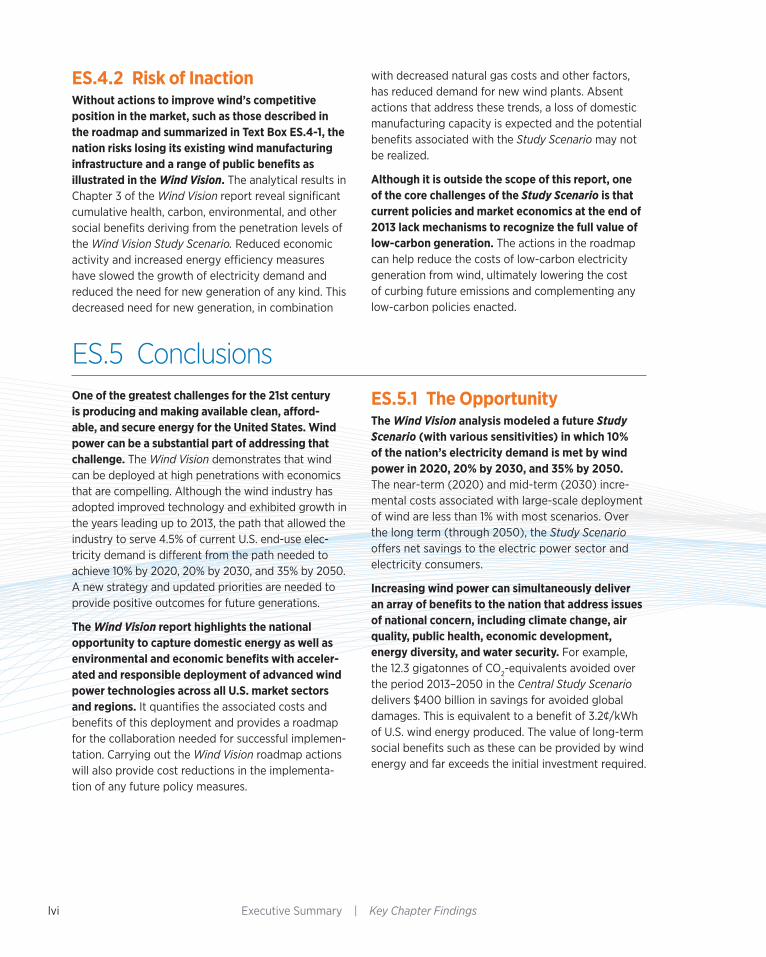
lvi Executive Summary | Key Chapter Findings
ES.4.2 Risk of InactionWithout actions to improve wind’s competitive position in the market, such as those described in the roadmap and summarized in Text Box ES.4-1, the nation risks losing its existing wind manufacturing infrastructure and a range of public benefits as illustrated in the Wind Vision. The analytical results in Chapter 3 of the Wind Vision report reveal significant cumulative health, carbon, environmental, and other social benefits deriving from the penetration levels of the Wind Vision Study Scenario. Reduced economic activity and increased energy efficiency measures have slowed the growth of electricity demand and reduced the need for new generation of any kind. This decreased need for new generation, in combination
with decreased natural gas costs and other factors, has reduced demand for new wind plants. Absent actions that address these trends, a loss of domestic manufacturing capacity is expected and the potential benefits associated with the Study Scenario may not be realized.
Although it is outside the scope of this report, one of the core challenges of the Study Scenario is that current policies and market economics at the end of 2013 lack mechanisms to recognize the full value of low-carbon generation. The actions in the roadmap can help reduce the costs of low-carbon electricity generation from wind, ultimately lowering the cost of curbing future emissions and complementing any low-carbon policies enacted.
ES.5 ConclusionsOne of the greatest challenges for the 21st century is producing and making available clean, afford-able, and secure energy for the United States. Wind power can be a substantial part of addressing that challenge. The Wind Vision demonstrates that wind can be deployed at high penetrations with economics that are compelling. Although the wind industry has adopted improved technology and exhibited growth in the years leading up to 2013, the path that allowed the industry to serve 4.5% of current U.S. end-use elec-tricity demand is different from the path needed to achieve 10% by 2020, 20% by 2030, and 35% by 2050. A new strategy and updated priorities are needed to provide positive outcomes for future generations.
The Wind Vision report highlights the national opportunity to capture domestic energy as well as environmental and economic benefits with acceler-ated and responsible deployment of advanced wind power technologies across all U.S. market sectors and regions. It quantifies the associated costs and benefits of this deployment and provides a roadmap for the collaboration needed for successful implemen-tation. Carrying out the Wind Vision roadmap actions will also provide cost reductions in the implementa-tion of any future policy measures.
ES.5.1 The OpportunityThe Wind Vision analysis modeled a future Study Scenario (with various sensitivities) in which 10% of the nation’s electricity demand is met by wind power in 2020, 20% by 2030, and 35% by 2050. The near-term (2020) and mid-term (2030) incre-mental costs associated with large-scale deployment of wind are less than 1% with most scenarios. Over the long term (through 2050), the Study Scenario offers net savings to the electric power sector and electricity consumers.
Increasing wind power can simultaneously deliver an array of benefits to the nation that address issues of national concern, including climate change, air quality, public health, economic development, energy diversity, and water security. For example, the 12.3 gigatonnes of CO2-equivalents avoided over the period 2013–2050 in the Central Study Scenario delivers $400 billion in savings for avoided global damages. This is equivalent to a benefit of 3.2¢/kWh of U.S. wind energy produced. The value of long-term social benefits such as these can be provided by wind energy and far exceeds the initial investment required.
lviiExecutive Summary | Key Chapter Findings
ES.5.2 The ChallengeWhile the wind industry is maturing, many future actions and efforts remain critical to further advancement of domestic wind energy. Continued technology development is essential to minimizing costs in the near term and maximizing savings in the long term. Shifts in bulk power market and institu-tional practices could ease delivery and integration of even higher penetrations of wind power. Engagement with the public, regulators, and local communities can enable wind energy deployment to proceed with minimal negative impacts and applicable benefits to host communities and local wildlife. Continued research and analysis on energy policy as well as wind costs, benefits, and impacts is important to provide accurate information to policymakers and the public discourse. Finally, a commitment to regularly revisit the Wind Vision roadmap and update priorities across stakeholder groups and disciplines is essential to ensuring a robust wind future.
ES.5.3 Moving ForwardThe Wind Vision roadmap identifies a high-level portfolio of new and continued actions and collabo-rations across many fronts to help the United States realize significant long-term benefits and protect the nation’s energy, environmental, and economic interests. Near-term and mid-term investments, such as those experienced in the years leading up to 2013, are needed. These investments are more than offset by long-term savings and social benefits. Stakehold-ers and other interested parties needs to take the next steps in refining, expanding, operationalizing, and implementing the high-level roadmap actions. These steps could be developed in formal working groups or informal collaborations and will be critical in overcoming the challenges, capitalizing on the opportunities, and realizing the national benefits detailed within the Wind Vision.

DOE publication number • November 2014Cover photo by
Wind Vision: A New Era for Wind Power in the United States
DOE/GO-102015-4557 • April 2015Cover photos from iStock 30590690, 11765469