executive summary - eiti.org · executive summary the indonesia eiti report 2015 is developed to...
TRANSCRIPT

COORDINATING MINISTRY FOR ECONOMIC AFFAIRS REPUBLIC OF INDONESIA
EXECUTIVE SUMMARY2015EITI INDONESIA REPORT
1


COORDINATING MINISTRY FOR ECONOMIC AFFAIRS OF REPUBLIC OF INDONESIA
EITI INDONESIA REPORT 2015 EXECUTIVE SUMMARY
VOLUME ONE
KAP HELIANTONO & REKAN

EITI INDONESIA REPORT 2015 EXECUTIVE SUMMARY
4 Executive Summary

EXECUTIVE SUMMARY
The Indonesia EITI Report 2015 is developed to demonstrate Indonesia’s commitment to Extractive Industries Transparency Initiative (EITI) program as well as to the principles of transparency and accountability in Indonesian extractive industry.
This report intends to encourage the participation of the Indonesian extractive industry stakeholders in providing better understanding to the Indonesian society of how the Government of Indonesia (GOI) manage the natural resources specifically in this context; oil, gas, mineral and coal, that the society has entrusted by law to the GOI.
EITI Indonesia Report 2015 consists off our volumes:The first volume, contains executive summary encapsulating the overall content of the EITI Indonesia Report 2015.
The second volume, contains contextual information from extractive industry sector in Indonesia. The contextual information provides a comprehensive illustration on the sector’s legal framework as well as governance mechanism, types of contract/ license, current licensing process, payments of companies to central and local government, and share mechanism between central and local government. This volume also explains the participation of State-Owned Enterprises (SOEs) in Indonesian extractive industry. The contextual information comply with the latest reporting standard issued by EITI International in order to provide better clarity to report readers when perusing the reconciliation content provided in the third volume of this report.
The third volume, contains the reconciliation report in which we reconcile total payment by companies in the upstream sector of oil and gas, mineral and coal (mining) and the total annual revenue received by GOI and SOEs. The revenue and payment include fiscal revenues and non-fiscal revenues. The
reconciliation report also covers the findings of discrepancy between total revenue of government and total payment from the extractive companies to government. The report also includes recommendations to prevent future discrepancies.
The fourth volume, contains the appendices from reconciliation process that verify and support the total and individual amount stated in reconciliation report. In the appendices, the reconciliation result is presented in detail by two main sectors, which are oil and gas sector and mineral and coal mining sector.
The Multi Stakeholder (MSG) or the EITI Indonesia Implementing Team and EITI Indonesia Secretariat has facilitated the production of this report by appointing Public Accountant’s Office Heliantono dan Rekanas Independent Administrator (IA) to conduct study and to compose contextual report and to compile reconciliation report. EITI Indonesia Report 2015 can be accessed on EITI Indonesia web page: Bahasa --> http://eiti.ekon.go.id/laporan-eiti-indonesia-2015English --> http://eiti.ekon.go.id/en/laporan-eiti-indonesia-2015
The EITI Indonesia Report 2015 is Indonesia EITI’s fifth report. It briefly explains EITI project background, benefits of implementating EITI for government, companies in extractive industries and organizations in the society. The report also elaborates the EITI reporting process in compliance with EITI International Standard.In short, the report comprises the following sections:
FIRST PART, EXECUTIVE SUMMARY ON CONTEXTUAL INFORMATION:The discussion topics in this Contextual Report are written based on the EITI standard 2016 and inputs from the Implementation Team. The discussion includes the governance, licenses and contracts, the
5Executive Summary 2015

extractive industry contribution, the role of state owned enterprises, corporate social responsibility and the management of state revenues derived from extractive industry.
In terms of compliance with the EITI standard 2016, this year there are at least two significant breakthroughs regarding the transparency of the extractive industry of the Government of Indonesia. First, the availability of cadastral information for oil and gas sector and mineral and coal accessible at http://geoportal.esdm.go.id. Second, the preparation of the Presidential Regulation plan on Beneficial Ownership which is led by the Financial Transaction Reports and Analysis Center (PPATK) together with other related ministries.
Contextual report 2015 is presented in 8 (eight) sections that can be an important reference for the public to understand the extractive industry in Indonesia.
First section of this report explain the definition of the extractive industry. Extractive industry is all activities that take natural resources directly from the earth in the form of mineral, coal, oil and gas. As a country with abundant natural resources, extractive industry becomes one of the main industries in Indonesia. Hence, the governance of extractive industry is worthy of attention. One of the efforts made by Indonesian government to manage extractive industry well is an EITI Standard implementation. EITI, which stands for the Extractive Industries Transparency Initiative is a global standard covering provision that enhances transparency and accountability of resources management by requiring oil, gas and mining companies to disclose theirs payment to the government, and the government to disclose its revenue from the companies. The implementation of the EITI standard in Indonesia is expected to benefit the government, companies and the society.
The legal basis of EITI implementation in Indonesia is Presidential Regulation Number 26 Year 2010. The regulation orders the establishment of Transparency Team that consist of Steering Team and Implementation Team. The team is tasked with the carrying out of transparency of national and local extractive industry revenues by collecting revenue data related to extractive industry from both government and companies, conducting the reconciliation and publishing the data to the public.
Second section of contextual report discusses about the governance of the extractive industry related to legal provision of the extractive industry, permit system through licenses and contracts and changes as well as improvements of the governance of the extractive industry that are underway at the time of writing of this report. This section assists the society to understand the regulation and management system of the extractive industry in Indonesia.
The governance of the extractive industry in Indonesia is guided by the 1945 Constitution of the Republic Indonesia Article 33 paragraph 3: “Land and water and the natural riches contained therein shall be controlled by the State
and shall be made use of for the people”, which in its development has been applied in the Law which has undergone several amendments. Currently, the applicable law in the extractive industry is Law No. 22/2001 regarding Oil and Gas and Law No. 4/2009 regarding Mineral and Coal Mining. This section exhibits list of regulations as well as the hierarchy of fiscal policy and law applicable in the extractive industry.
The discussion about the governance includes the discussion about related regulations, such as Forestry Law, national energy policy, contract transparency and Beneficial Ownership transparency.
This section also discusses the current government efforts in improving the governance of the extractive industry. The Government has applied an Indonesia National Single Window Program (PTSP) to simplify the licensing process, including the license related to the extractive industry. In mineral and coal mining sector, the Government has established policies to accelerate full implementation of the Law No 4/2009 and the Law No. 23/2014 in order to improve the governance of mineral and coal mining in Indonesia. Several actions taken by the Government among others are reconciliation of National IUP since 2011 and the establishment of coordination & supervision conducted by KPK in mineral and coal mining sector since 2014.
Current issues and challenges related to the governance of the extractive industry are also discussed in this section. They are the declining of exploration activities in oil and gas sector as well as mineral and coal sector, issues related to regulations of the gross split scheme, current status of the revision of Oil and Gas Law and Mineral and Coal Law, debates and the development of regulations related to the value added enhancing of minerals, the implementation of divestment regulation, the conversion of contracts to license regime and the accuracy of non-tax state revenue payment and reporting. These topics are prepared based on the guidance of the Implementation Team and Scope of EITI Report 2015 of Indonesia.
Third section of contextual report discusses about the process of licenses and contracts of oil and gas in Indonesia, including types of license/contract and tenders in 2015. In Indonesia’s oil and gas mining, there are three types of contracts: (1) Production Sharing Contract (PSC); (2) Joint Operation Body (JOB); and (3) Production Sharing Contract with Gross Split Scheme. The process of determination and auction procedures of the working area (Wilayah Kerja/WK) in oil and gas mining is described in this section along with the information of WK’s offering in 2015 and the discussion about compulsary offering of 10% Participating Interest (PI) to Local Owned Enterprises and local companies. The current issue that has also become a challenge for the Government of Indonesia (Ministry of Energy and Mineral Resources) related to licensing and contract in oil and gas mining is a transition period of oil and gas blocks concerning contract extensions/ cooperation agreements which will expire in 2024 and have not been extended and its relation to the achievement of national targets of oil and gas production.
6 Executive Summary

The next discussion covered by this section is about the license issues in mineral and coal mining sector. Based on the Law No. 4/2009 on Mineral and Coal Mining and the Law No. 23/2014 on Local Government, the concession mechanism is the granting of licenses through Mining Business License (IUP) with the permit granting authority owned by the Minister of EMR and the Governor (Head of Provincial Region). However, contracts / agreements (KK or PKP2B) which have been issued before the stipulation of the Law No. 4/2009 remains in effect until the contract / agreement expires.
One of the mandates of the Mineral and Coal Law of 2009 is that the Government is obliged to determine the allocation of Mining Areas (WP) that is the basis of the determination of Mining Business Area (WUP) / People’s Mining Area (WPR) / Country Reserves Area (WPN). The determination of WUP / WPR / WPN becomes the basis for granting licenses (Mining Business License Area (WIUP) / People’s Mining License (IPR) / Special Mining Business License Area (WIUPK)) through the auction mechanism. The process of determination up to the auction of WIUP is also described in this section. There is no IUP auction in 2015 because the government is still in the process of reforming the national IUP since the enactment of the Mineral and Coal Law of 2009. Directorate General of Mineral and Coal issues Circular Letter No. 08.E / 30 / DJB / 2012 concerning moratorium on issuance of IUP by Local Government and still valid until now. Fourth section of the contextual report discusses the overview of extractive industry and the contribution of extractive industry to the Indonesian economy. The discussions include the ranking of reserves and production of Indonesia’s extractive industry at the global level, production data and value, concentration areas of production, development projects in the upstream oil and gas sector, description of mineral and coal mining exploration activities, and extractive industry contribution to economic growth (GDP) in Indonesia, state revenue, total exports and employment.
The contribution of the extractive industry to total GDP by 2015 is 8% of the total national GDP. Although the contribution at the national level is below 10%, the mining sector has a relatively large contribution in some provinces, for example in East Kalimantan in which mining sector accounts for 45% of total GDP. In addition, mining sector in Papua Province and Riau Province accounts for 32% and 30% of total GDP of the respective province.
The extractive industry contribution is significant to state revenues and exports. Extractive industry accounted for 15% of total state revenues. In the period of 2012-2014 the contribution of state revenues from the extractive industry is quite high at around 30% of the total state revenues. However, due to the declining of oil price, from about US $ 100 / barrel to only US $ 50 / barrel, industry revenues declined by around 50% in 2015 (2012: 30%, 2015: 15%).
There is a decrease in the contribution of mining export value by about 4%, from 28% in 2014 to 24% of the value
of national exports in 2015. The decrease is due to the decline of natural gas exports since the government prioritizes the use of natural gas for national consumption. The decline in oil price does not significantly affect the value of national exports because oil production is largely consumed domestically. The contribution of manpower in the mining and quarrying sector accounts for about 1.3 million workers (or 1.15% of total workforce) by 2015. Fifth section of this report discusses 4 (four) State-Owned Enterprises (SOEs) engaged in the extractive industry, namely PT Pertamina, PT Aneka Tambang, PT Bukit Asam and PT Timah. All SOEs are in the form of Persero and three SOEs, namely PT Aneka Tambang, PT Bukit Asam and PT Timah have been listed on the Indonesia Stock Exchange (IDX). The Government of Republic of Indonesia holds 65% of common stock and Dwiwarna share with veto rights in three state-owned enterprises of mineral and coal as well as 100% of PT Pertamina shares. The role of the Government in the management of those SOEs is represented by the Ministry of SOEs, Ministry of Finance and Ministry of Energy and Mineral Resources, each of which has authority in terms of operational / managerial, capital and formulation, determination and implementation of policies in the field of energy and mineral resources.
In connection with the financial relationship between SOEs and the central government, in 2015 the Government increases the amount of paid-up capital to PT Aneka Tambang (Persero) Tbk by Rp 3.5 trillion. The additional capital from the Government is used to construct the Haltim Feronikel Plant. In 2015, three state-owned enterprises engaged in the extractive industry contributed to the Rp 6.86 trillion dividend received by the Government of the Republic of Indonesia. PT Aneka Tambang (Persero) Tbk does not pay dividends because of its financial condition.
As mandated in the Law No. 19/2003, the establishment of SOEs is not only intended to seek profit but also to organize the public benefit and also to provide guidance and assistance to small entrepreneurs, cooperative and community groups. Therefore, similar with other state-owned enterprises, the four SOEs in the extractive industries also have an obligation to implement the Partnership and Community Development Program (PKBL) and conduct public services. One form of public service is the fuel (BBM) subsidy by PT Pertamina (Persero). PT Pertamina receives a mandate from the Government to distribute subsidized fuel. Based on the EITI 2015 reporting form, Pertamina has disbursed a 3 kg LPG and BBM subsidy equivalent to 47,555 billion Rupiah.
The government plans to form a holding company of SOEs for efficiency and synergy and increase the assets of SOEs. In relation to the extractive industry, the Government will establish a holding of oil and gas and mining companies. Holding of oil and gas SOEs is a combination of PT Pertamina (Persero) and PT Perusahaan Gas Negara. Meanwhile, the holding of mining SOEs will consist of PT Inalum (Persero), PT Aneka Tambang (Persero) Tbk, PT Timah (Persero) Tbk and PT Bukit Asam (Persero) Tbk.
Executive Summary 2015 7
Sixth section of the contextual report discusses environmental responsibility and corporate social responsibility for extractive industry companies in Indonesia. Furthermore, this section also mentioned about the people’s mining and illegal mining / mining without permission (PETI). Companies engaged in the extractive industry have environmental responsibility and social responsibility as set out in various regulations. The Company is obliged to provide the amount of funds used as collateral for environmental restoration / reclamation costs called the Abandonment Fund and Site Restoration (ASR) for oil and gas companies, and Reclamation and Post-Mining Guarantee Reserves for mineral and coal companies.
Until 2015, the ASR funds collected in the accounts of a number of state banks amounted to US $ 775 million (with an average increase rate of 35% since 2011). Based on the Supreme Audit Board (BPK) audit in the first semester of 2017, it is known that SKK Migas has not recorded the receivable of ASR from 8 PSC Contractors totaling Rp72.3 billion. SKK Migas requested the 8 PSC Contractors to settle the ASR reserve bill and was paid Rp48.3 billion. SKK Migas has authority over the management of such ASR funds, such as billing authority and approval for the disbursement and use of such funds. Until now there is no information that can be accessed by the public about the total amount of national reclamation and post-mining funds paid by mineral and coal companies. To improve transparency, reclamation and post-mining guarantee reserves data filling is included in the reporting form of 2015, in which the amount of reclamation and post-mining guarantees of companies included in the reconciliation scope can be seen in the EITI Reconciliation Report 2015.
In relation to corporate social responsibility (CSR), any company incorporated as a limited liability company is required to hold a CSR program (based on Limited Liability Company Law). However, the amount of CSR is not regulated. As for SOEs, it is mandatory to organize Partnership and Community Development Program (PKBL) with a maximum amount of 4% of profit after previous yearly tax.
Furthermore, this section discusses the people’s mining license. The definition of Artisanal and Small-Scale Mining (ASM) is largely a mining activity carried out individually, in groups, by families or cooperatives in a traditional and minimal or non-technological manner. The Law No. 4/2009 on mineral and coal mining does not recognize ASM but regulates the People’s Mining to accommodate the legality of traditional mining undertaken by the people. This section also briefly discusses the unauthorized mining. Seventh section of the contextual report discusses state revenue management in the extractive industry beginning with the planning, budgeting and audit process. This section provides information on methods of allocating revenue from the extractive industry to local government.All non-tax state revenues from the extractive industry are received in cash, unless some revenues from the upstream oil and gas sector related to production sharing contracts.
Such revenues received by the Government of Indonesia in the form of in-kind. They are the government’s oil and gas lifting and DMO (minus DMO costs) related to production sharing contract. The management of in-kind revenues from the upstream oil and gas is under the authority of SKK Migas. Tax revenues from the extractive sector are entirely in cash. Since 2015, tax revenue from the oil and gas sector can be paid in in-kind. However, there has been no realization to date. The state revenues from the extractive industry are deposited in the state treasury and recorded in the Central Government Financial Statement (LKPP).
This section also discusses the planning and budgeting process along with the audit implementation process and the allocation mechanism of state revenue between the central government and the local government. The public may access financial notes, LKPP and LKPP audit results by the Supreme Audit Board (BPK) on the Ministry of Finance and BPK web pages. For an overview of the extractive industry in the future, the public can access the EMR Ministry Strategic Plan for 2015-2019 on the Ministry of Energy and Mineral Resources web page.
The allocation of state revenues from extractive industry between the central and the local government is regulated in revenue sharing funds (DBH) in accordance with the Law No. 33/2004 on Financial Proportionality. The local government share of petroleum and natural gas revenue is 15% and 30%, respectively. From the oil and gas sharing scheme, the Local Government receives an earmarked of 0.5% for primary education. In addition, there are also DBH sharing schemes for the special autonomous regions of Aceh Province, West Papua Province and Papua Province which get an additional 55% for petroleum revenues and an additional 40% for natural gas revenues. Papua and West Papua Provinces are required to allocate such revenues for education sector of at least 30% and for health and nutrition improvement of at least 15%, while the Aceh Province is required to allocate at least 30% for education. The Local Government obtains 20% of revenues from the general mining. Realization and budget allocation of DBH can be seen in appendix of LKPP or the Directorate General of Fiscal Balance web page. This section exhibits 10 major recipient areas of DBH from oil and gas as well as mineral and coal.
Payments from extractive industry companies to local governments are also discussed in this section, especially about the types and tariffs of payments. Several associations, including the Indonesia Mining Association (IMA) and the Indonesian Mining Services Association (Aspindo) have filed a judicial review to the Constitutional Court for the imposition of motor vehicle tax (PKB) and tax on change of motor vehicle ownership (BBNKB) for heavy equipment commonly used by mining companies. The Constitutional Court decided that heavy equipment used in mining activities is not an object of PKB and BBNKB because it is not a motor vehicle.
Eighth section is a recommendation section. The Implementation Team requires the EITI Report to
8 Executive Summary

include recommendations to improve transparency and governance levels in the extractive industry. In this report, there are two recommendations:
1. There is an agreement on adequate technical procedures that clearly illustrates how local governments can access data to be able to project the amount of revenue sharing funds for oil and gas.
2. EITI Secretariat to send a letter to the PPID ESDM to open PKP2B and KK contracts in the upstream mineral and coal sector.
SECOND PART, EXECUTIVE SUMMARY ON RECONCILIATION:The Extractive Industries Transparency Initiative (EITI) is a global standard for improving transparency in the extractive industry sector (oil, gas, mineral and coal sectors). This standard aims to create conditions that are transparent and accountable as a manifestation of good governance practices.
The two components of EITI implementation are transparency and accountability. Transparency is to disclose payments from oil and gas and mining companies to the government, and the government discloses its receipt. The number is reconciled by the Independent Administrator and published in the Transparency Report annually along with other contextual information about the extractive industry sector, while accountability is the formation of multi-stakeholder groups with representatives of government, corporations and civil society to oversee the process and communicate the findings of the EITI Report, and encourage EITI integration into broader transparency efforts in EITI implementing countries.The EITI standard serves as a tool to improve the management of the oil, gas and mining sectors in the countries that implement them.
Proportion of State RevenueThe state revenue that is focused in this report is revenue derived from the extractive industry, especially from the oil and gas sectors and the minerals and coal sectors.
State Revenue 2014 and 2015 from Oil and Gas Sector
Type of Revenue 2014 2015
(in Trillion Rupiah) (in Trillion Rupiah)
TAX REVENUE
Oil and Gas Income Tax 87 49
Oil and Gas Land & Building Tax 20 25
NON-TAX REVENUE
Oil Revenue 139 47
Gas Revenue 77 30
Revenue from Upstream Activities 16 8 TOTAL OIL AND GAS REVENUES 341 161
TOTAL STATE REVENUES 1,550 1,508
Revenue Ratio 22% 10%
Source:LKPP 2015
Executive Summary 2015 9

In Central Government Financial Report (LKPP) 2015, state revenues from oil and gas and mineral and coal sectors contributed Rp224.24 trillion or 15% of total state revenues, consisting of oil and gas revenues of Rp161.76 trillion (11%) and revenues from mineral and coal sector amounting
to Rp62.48 trillion (4%). The revenue decreased from the previous year, which contributed 27% of total state revenues, consisting of oil and gas revenues of Rp341.25 trillion (22%) and revenues from mineral and coal sector amounting to Rp69.97 trillion (5%).
State Revenue 2014 and 2015 from Mineral and Coal Sector
Type of Revenue 2014 2015
(in Trillion Rupiah) (n Trillion Rupiah)
TAX REVENUE
Mining Income Tax 34 32
Other Tax - -
NON-TAX REVENUE
Royalty 18 16
Land Rent - -
Sales Revenue Share 16 11
TOTAL MINING REVENUES 69 62TOTAL STATE REVENUES 1,550 1,508
Revenue Ratio 4% 4%
(*) Consist from Corporate Income Tax of coal and lignite mining, metal ore mining, mining and other excavation along with mining-services.
Source: LKPP 2015
In the oil and gas sector, the largest revenue in 2015 is derived from the oil lifting and natural gas lifting generated by Chevron Pacific Indonesia with 36% lifting share of oil and Total E & P Indonesie with 23% lifting share of gas.
Oil and Gas Companies Contributing the Largest Liftings in 2015
36%
9%5%
9%
13%
28%
Total Lifting Oil
Chevron Pacific Indonesia
PT Pertamina EP
ExxonMobil Cepu Ltd
PT PHE ONWJ
Total E&P Indonesie
Others
28%
3%
23%
12%
15%
19%
Total Lifting Gas
Total E&P Indonesie
ConocoPhillips
BP Berau Ltd.
PT Pertamina EP
VICO
Others
Source: EITI Data 2015
10 Executive Summary

In the mineral and coal sector, 5 companies became the largest royalties contributor with contributions of 42% of total royalty payments during 2015, as shown in the figure below.
Mineral and Coal Companies Contributing the Largest Royalties in 2015
6.8%7.0%
58.1%
7.3%
8.4%
12.4%
Mineral & Coal Royalty
KALTIM PRIMA COAL
FREEPORT INDONESIA
KIDECO JAYA AGUNG
BERAU COAL
NEWMONT NUSA TENGGARAOthers
Source: EITI Data 2015
Component of Reconciliated State Revenue The component of reconciliated state revenue according to TOR and Scoping study of the EITI Report 2015:• Corporate income tax (including income tax article
26 on dividend (oil and gas sector)• Government lifting and DMO received in kind (oil
and gas sector)• Signature Bonus andProduction Bonus(oil and gas
sector)• Royalty, Sales Revenue Share (PHT), Land Rent and
Dividend paid in cash (mineral and coal sector)• SOE transportation services received by SOE
(mineral and coal sector)
In accordance with the Indonesian EITI Scoping Study 2015, the materiality of reconciliated state revenue is above 1% of the total state revenue of each extractive industry sector approved by the Implementing Team, and for the search for reconciliation differences, the limit is 5%, so that if there is a difference of 5% then it will be analyzed and explained.
The results of reconciliation between the government and companies engaged in the extractive sector show the ending difference at a range of 0.00% to 55.06% after reconciliation.
In the oil and gas sector, the biggest difference is in the state revenue component of Oil and Gas Income in the form of Over / (Under) Oil Lifting of US $ 29,494 thousand or 55.06% of total Over / (Under) Oil Lifting reconciliated caused by dispute related to different interpretation of contract in calculating the production share. However, since the amount of Over / (Under) Oil Lifting covers only 0.87% of the total ReconciliatedOil Revenues (Government Lifting and Over/(Under) Lifting), the final difference does not have a significant impact on the outcome of the reconciliation of state revenues from oil and gas sector as a whole. Another difference is in the income tax of oil and gas of Cooperation Contract Contractor (KKKS) Operator amounting to US $ 58,794 thousand or 2.48% of the total reconciliated income taxof oil and gas of KKKS operator. The difference cannot be analyzed because until the specified deadline the reporting entity does not provide confirmation or explanation of the difference.
The overall reconciliation results of oil and gas sector can be seen in the following tables:
Reconciliation between KKKS and SKK Migas
Reconciliation between KKKS and SKK Migas in 2015In Thousand USD
State Revenues
Pre-Reconciliation Post-Reconciliation%
KKKS SKK Migas Initial Difference KKKS SKK Migas Unreconciled
Difference
(1) (2) (3) = (2)-(1) (4) (5) (6) = (5)-(4) (7)=(6):(5)
Total Lifting –Oil 13,839,986 13,743,781 (96,205) 13,743,782 13,743,781 - 0.00%
Total Lifting - Gas 17,014,741 17,014,742 1 17,014,741 17,014,742 1 0.00%
Domestic Market Obligation Fee 443,280 428,191 (15,089) 439,590 428,191 (11,399) -2.66%
Over/(Under) Lifting –Oil 20,248 (97,085) (117,333) (24,075) (53,569) (29,494) 55.06%
Over/(Under) Lifting - Gas (205,438) (171,407) 34,031 (168,335) (168,335) - 0.00%
Total 31,112,817 30,918,222 (194,595) 31,005,703 30,964,810 (40,892) -0.13%
Source: EITI Data 2015
Executive Summary 2015 11

Explanation Number of Companies Thousand USD
Differences due to MUDI condensate correction for the period 2004 - 2008 1 (2,043)
The difference arise because there was a dispute of contract interpretation in calcu-lating profit sharing between KKKS and SKK Migas (until the date of reporting, this dispute is still in the process of completion)
1 (38,851)
TOTAL 2 (40,892)
Reconciliation between KKKS and SKK Migas in 2015 (Volume)
State Revenues
Pre-Reconciliation Post-Reconciliation%
KKKS SKK Migas Perbedaan Awal KKKS SKK Migas Unreconciled
Difference
(1) (2) (3) = (2)-(1) (4) (5) (6) = (5)-(4) (7)=(6):(5)
Government Lifting - Minyak (Barel) 114,166,053 114,584,935 418,882 114,584,927 114,584,928 1 0.00%
Government Lifting - Gas (MSCF) 587,042,987 523,099,852 (63,943,136) 506,699,434 506,699,436 2 0.00%
Domestic Market Obligation (Barel) 21,099,864 20,009,110 (1,090,754) 20,280,963 20,896,667 615,704 2.95%
Source:EITI Data 2015
General causes of post-reconciliation differences shown in Table above:
Explanation Number of Companies Value
Differences due to MUDI condensate correction for the period 2004 - 2008 1 (28,642)
The difference arise because there was a dispute of contract interpretation in calculating profit sharing between KKKS and SKK Migas (until the date of reporting, this dispute is still in the process of completion)
1 644,345
Rounding 4
TOTAL 2 615,707
General causes of post-reconciliation differences shown in Table above:
12 Executive Summary
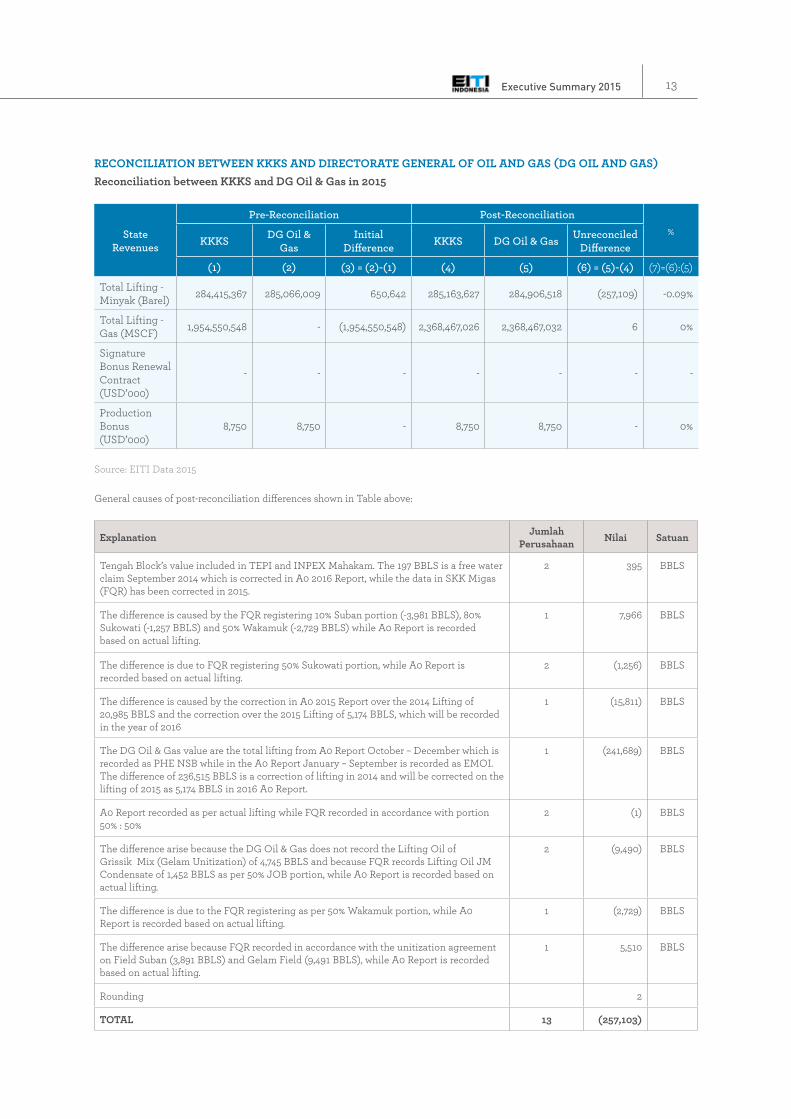
RECONCILIATION bETwEEN KKKS AND DIRECTORATE GENERAL OF OIL AND GAS (DG OIL AND GAS)Reconciliation between KKKS and DG Oil & Gas in 2015
State Revenues
Pre-Reconciliation Post-Reconciliation%
KKKS DG Oil & Gas
Initial Difference KKKS DG Oil & Gas Unreconciled
Difference
(1) (2) (3) = (2)-(1) (4) (5) (6) = (5)-(4) (7)=(6):(5)
Total Lifting - Minyak (Barel) 284,415,367 285,066,009 650,642 285,163,627 284,906,518 (257,109) -0.09%
Total Lifting - Gas (MSCF) 1,954,550,548 - (1,954,550,548) 2,368,467,026 2,368,467,032 6 0%
Signature Bonus Renewal Contract (USD’000)
- - - - - - -
Production Bonus (USD’000)
8,750 8,750 - 8,750 8,750 - 0%
Source: EITI Data 2015
General causes of post-reconciliation differences shown in Table above:
Explanation Jumlah Perusahaan Nilai Satuan
Tengah Block’s value included in TEPI and INPEX Mahakam. The 197 BBLS is a free water claim September 2014 which is corrected in A0 2016 Report, while the data in SKK Migas (FQR) has been corrected in 2015.
2 395 BBLS
The difference is caused by the FQR registering 10% Suban portion (-3,981 BBLS), 80% Sukowati (-1,257 BBLS) and 50% Wakamuk (-2,729 BBLS) while A0 Report is recorded based on actual lifting.
1 7,966 BBLS
The difference is due to FQR registering 50% Sukowati portion, while A0 Report is recorded based on actual lifting.
2 (1,256) BBLS
The difference is caused by the correction in A0 2015 Report over the 2014 Lifting of 20,985 BBLS and the correction over the 2015 Lifting of 5,174 BBLS, which will be recorded in the year of 2016
1 (15,811) BBLS
The DG Oil & Gas value are the total lifting from A0 Report October – December which is recorded as PHE NSB while in the A0 Report January – September is recorded as EMOI. The difference of 236,515 BBLS is a correction of lifting in 2014 and will be corrected on the lifting of 2015 as 5,174 BBLS in 2016 A0 Report.
1 (241,689) BBLS
A0 Report recorded as per actual lifting while FQR recorded in accordance with portion 50% : 50%
2 (1) BBLS
The difference arise because the DG Oil & Gas does not record the Lifting Oil of Grissik Mix (Gelam Unitization) of 4,745 BBLS and because FQR records Lifting Oil JM Condensate of 1,452 BBLS as per 50% JOB portion, while A0 Report is recorded based on actual lifting.
2 (9,490) BBLS
The difference is due to the FQR registering as per 50% Wakamuk portion, while A0 Report is recorded based on actual lifting.
1 (2,729) BBLS
The difference arise because FQR recorded in accordance with the unitization agreement on Field Suban (3,891 BBLS) and Gelam Field (9,491 BBLS), while A0 Report is recorded based on actual lifting.
1 5,510 BBLS
Rounding 2
TOTAL 13 (257,103)
Executive Summary 2015 13

RECONCILIATION bETwEEN KKKS AND DIRECTORATE GENERAL OF bUDGET (DG bUDGET) AND DIRECTORATE GENERAL OF TAX (DGTAX)
Reconciliation between KKKS and DG budget & DG Tax in 2015
in Thousand USD
State Revenues
Pre-Reconciliation Post-Reconciliation%
KKKS DG Budget& DG Tax
Initial Difference KKKS DG Budget
& DG TaxUnreconciled
Difference
(1) (2) (3) = (2)-(1) (4) (5) (6) = (5)-(4) (7)=(6):(5)
Corp. Income & DividendTax – Operator
2,433,608 2,368,328 (65,280) 2,433,277 2,374,484 (58,793) -2.48%
Corp, Income & DividendTax – Partner
1,157,288 1,148,211 (9,077) 1,157,681 1,148,211 (9,470) -0.82%
Jumlah 3,590,895 3,516,539 (74,357) 3,590,958 3,522,695 (68,263) -1.94%
Source: EITI Data 2015
General causes of post-reconciliation differences shown in Table above:
Explanation Number of Companies
Thousand USD
Until the specified deadline, the reporting entities do not provide confirmation or explanation of the difference
51 (139,637)
The reporting template fulfillment is using accrual basis 6 71,373
Rounding 1
TOTAL 57 (68,263)
The reconciliated oil and gas income tax in the table above exclude data from companies that do not complete the Authorization Sheet to disclose tax data (LO). They are 10 companies of KKKS Partners as listed in the table below. Based on data reported by the reporting companies, the
total income tax paid by companies that do not complete the LO (excluding non-reporting companies) amounted to US$69,557 thousand or 1.94% of the total Income Tax reported by the companies, so it has no significant impact.
14 Executive Summary

List of Companies that do not submit LO Tax
No. Companies that do not submit Authorization Letter of Tax (LO)
Corp. Income Tax (thousand USD)
1 Opicoil Houston Inc. 19,530
2 Virginia International Co. LLC. 16,309
3 Universe Gas & Oil Company Inc. 4,295
4 Opicoil Energy -
5 Japan CBM Ltd. -
6 Merangin B.V. -
7 Kufpec Indonesia (ONWJ) BV 4,991
8 Ampolex (Cepu) PTE. Ltd. 20,409
9 Talisman (Ogan Komering) Ltd. 1,680
10 Kufpec Indonesia (SES) B.V. 2,344
Total Oil and Gas Corp. Income Tax which do not submitted the LO 69,557
Total Corporate Income Tax 3,590,958
Percentage 1.94%
Source: EITI Data 2015
State Revenue Managed by SKK Migas and Received byDG budget
Reconciliation between SKK Migas and DG budget in 2015
In Thousand USD
State Revenues
Pre-Reconciliation Post-Reconciliation %
SKK Migas DG Budget Initial Difference SKK Migas DG Budget Unreconciled
Difference
(1) (2) (3) = (2)-(1) (4) (5) (6) = (5)-(4) (7)=(6):(5)
Government Lifting – Oil
· Export 247,101 5,193,857 (346,673)
247,101 5,527,753 - 0%
· Domestic 5,293,429 5,280,652
Government Lifting – Gas
· Export 1,403,817 3,114,031 (83,548)
1,403,817 3,196,090 - 0%
· Domestic 1,793,762 1,792,273
Total 8,738,109 8,307,888 (430,221) 8,723,843 8,723,843 - 0%
Source: EITI Data 2015
Executive Summary 2015 15

For the mineral and coal sector, the difference in the state revenue from Income Tax Article 25/29 (Corporate Income Tax) amounts to Rp225,711 million or 1.39% of total reconciliated Corporate Income Tax. The difference cannot be analyzed because the reporting entity does not provide confirmation of the difference up to the given deadline. The difference in non-tax state revenue (PNBP) amounted to Rp78,299 million or 0.3% of total reconciliated PNBP. The biggest contributor to the difference of non-tax
revenue is PHT with a difference of Rp57,771 million. The difference cannot be analyzed because the reporting entity does not provide confirmation of the difference up to the given deadline.
The overall reconciliation results of mineral and coal sector can be seen in the following tables:
Reconciliation between Mining Companies and Directorate General of Mineral and Coal (DG Mineral and Coal)
Reconciliation between Mining Companies and DG Mineral & Coal in 2015
In Million Rupiah and Thousand USD
State Revenues
Pre-Reconciliation Post-Reconciliation
%Mining Company
DG Mineral & Coal
Initial Difference
Mining Company
DG Mineral & Coal
Unreconciled Difference
(1) (2) (3)=(2)-(1) (4) (5) (6)=(5)-(4) (7)=(6):(5)1. Reported in USD
Royalty 835,743 829,288 (6,455) 866,990 866,582 (408) -0.05%
PHT 723,896 741,884 17,988 758,995 761,208 2,213 0.29%
Land Rent 6,790 14,847 8,057 7,651 7,668 17 0.22%
Total in USD 1,566,429 1,586,019 19,590 1,633,636 1,635,458 1,822 0.11%
2. Reported in IDR
Royalty 2,156,350 13,482,142 11,325,792 2,249,311 2,246,140 (3,171) -0.14%
PHT 1,614,814 11,850,821 10,236,007 1,707,873 1,765,644 57,771 3.27%
Land Rent 23,876 209,806 185,930 21,004 20,282 (722) -3.56%
Total in IDR 3,795,040 25,542,769 21,747,729 3,978,188 4,032,066 53,878 1.34%
IDR Equivalent 24,772,657 46,782,735 22,010,078 25,855,841 25,934,119 78,278 0.30%
Exchange rate: Rp 13,392 (rate used in LKPP 2015)
General causes of post-reconciliation differences shown in Table above:
ROYALTY
No Explanation Number of Companies
Thousand USD
Million IDR
a
b
c
Until the specified deadline, the reporting entities do not provide confirmation or explanation of the difference
Timing difference (The company deposits at the end of the year while DG Mineral & Coal records at the beginning of the following year
The allocation of Royalty, PHT and Land Rent in Mining Company is different fromthe Company Report
16
5
5
(405)
323
(326)
172
(472)
2.871
TOTAL (408) (3.171)
16 Executive Summary

SALES REVENUE SHARE (PHT)
No Explanation Number of Companies
Thousand USD
Million IDR
a
b
c
d
Until the specified deadline, the reporting entities do not provide confirmation or explanation of the difference
Timing difference(The company deposits at the end of the year while DG Mineral & Coal records at the beginning of the following year
The allocation of Royalty, PHT and Land Rent in Mining Company is different from the Company Report
Less recorded by The Company and/or DG Mineral & Coal’s bookkeeping
4
5
1
1
1,336
672
224
(18)
61,359
-
(3,588)
-
TOTAL 2,213 57,771
LAND RENT
No Explanation Number of Companies
Thousand USD
Million IDR
a
b
c
Until the specified deadline, the reporting entities do not provide confirmation or explanation of the difference
The allocation of Royalty, PHT and Land Rent in Mining Company is different from the Company Report
Less recorded by The Company and/or DG Mineral & Coal’s bookkeeping
1
1
2
-
17
-
(77)
-
(645)
TOTAL 17 (722)
Executive Summary 2015 17

Reconciliation between Mineral and Coal CompaniesandDirectorate General of Tax (DG Tax)
Reconciliation between Mining Companies and DG Tax in 2015
in Million Rupiah and Thousand USD
State Revenues
Pre-Reconciliation Post-Reconciliation
%Mining Company DG Tax Initial
DifferenceMining
Company DG Tax Unreconciled Difference
(1) (2) (3)=(2)-(1) (4) (5) (6)=(5)-(4) (7)=(6):(5)1. Reported in USD
Corp. Income Tax 974,337 712,478 (261,859) 1,022,303 1,024,138 1,835 0.18%
Total in USD 974,337 712,478 (261,859) 1,022,303 1,024,138 1,835 0.18%
2. Reported in IDR
Corp. Income Tax 2,506,635 2,475,923 (30,712) 2,271,625 2,472,763 201,138 8.13%
Total in Rupiah 2,506,635 2,475,923 (30,712) 2,271,625 2,472,763 201,138 8.13%
IDR Equivalent 15,554,956 12,017,428 (3,537,528) 15,962,307 16,188,019 225,712 1.39%
Exchange rate: Rp 13,392 (rate used in LKPP in 2015)
General causes of post-reconciliation differences shown in Table above:
CORPORATE INCOME TAX
No Explanation Number of Companies
Thousand USD
Million IDR
a
b
Until the specified deadline, the reporting entities do not provide confirmation or explanation of the difference
The Company has not yet input other legal products (STP, SKPKB, SKPKBT, Income Taxand/orIncome TaxArt. 29)
12
2
1,835
-
199,748
1,390
JUMLAH 1,835 201,138
Based on the information from the Directorate General of Tax, the amount of Income Tax Article 25/29 revenues for the 123 companies included in the reconciliation is Rp16.5 trillion.The amount is gross revenues received through the deposit of State Receipt Module (MPN). Mineral and coal companies that have submitted reports is amounting to 85 companies.Out of the 85 reporting companies, only
75 companies that submit the authorization sheet for the opening of tax data and information, while 10 companies do not submit the authorization sheet. The total amount of Income Tax Article 25/29 from 75 companies after the reconciliation process amounting to Rp16.18 trillion or 98.07% of total income tax Article 25/29 from 123 mineral and coal companies.
18 Executive Summary

Reconciliation between Mineral and Coal Companies and DG budget
Reconciliation between Mining Companies and DG budget in 2015
in Million Rupiah and Thousand USD
State Revenues
Pre-Reconciliation Post-Reconciliation
%Mining Company DG Budget Initial
DifferenceMining
CompanyDG
BudgetUnreconciled
Difference
(1) (2) (3)=(2)-(1) (4) (5) (6)=(5)-(4) (7)=(6):(5)
1. Reported in USD
Dividen - - - - - - 0%
Total in USD - - - - - - 0%
2. Reported in Rupiah
Dividend 506,044 610,638 104,594 610,638 610,638 - 0%
Total in IDR 506,044 610,638 104,594 610,638 610,638 - 0%
Reconciliation between PT bukit Asam (Persero), Tbk. and PT Kereta Api Indonesia (Persero)
Reconciliation between PT bukit Asam and PT Kereta Api Indonesia in 2015
in Million Rupiah and Thousand USD
State Revenues
Pre-Reconciliation Post-Reconciliation
%PT Bukit Asam PT KAI Initial
DifferencePT Bukit
Asam PT KAI Unreconciled Difference
(1) (2) (3)=(2)-(1) (4) (5) (6)=(5)-(4) (7)=(6):(5)
1. Reported in USD
Transportation Fee 73,002 72,368 (634) 72,368 72,368 - 0%
Jumlah USD 73,002 72,368 (634) 72,368 72,368 - 0%
2. Reported in IDR
Transportation Fee 1,709,842 1,709,842 - 1,709,842 1,709,842 - 0%
Total in IDR 1,709,842 1,709,842 - 1,709,842 1,709,842 - 0%
Ekuivalen Rupiah 2,687,484 2,678,994 (8,491) 2,678,994 2,678,994 - 0%
Exchange rate: Rp 13,392 (rate used in LKPP 2015)
Executive Summary 2015 19

20 Executive Summary

Component of Non-Reconciliated State Revenue and Information
The component of non-reconciliated state revenue according to TOR and Scoping study of the EITI Report 2015:
Oil and gas sector-Deduction Factor reported by the Directorate General of Budget:
• Land and Building Tax (PBB) of oil and gas• Value Added Tax (PPN) of oil and gas• Local Tax and Retribution (PDRD)
- Signature Bonus and Firm Commitment for the signing of new contracts reported by DG Oil and Gas
- CSR reported by KKKS
- Transportation fees paid by KKKS to Pertamina
Non-reconciliated Information of Oil and Gas Sector in 2015
Unreconciled Information
Total % against Oil and
Gas Revenue Rupiah(in million)
USD(in thousand)
Equivalent Rupiah(in million)
Deductible Factor: - Oil and gas Land and Building Tax 25,087,739 25,087,739 15.51%- Oil and gas VAT 8,064,839 8,064,839 4.99%- Local Tax and Retribution (PDRD) 52,078 52,078 0.03%Total Deductible Factor 33,204,656 33,204,656 20.53%
Other Unreconciled Information - Signature Bonus – new contract 9,000 120,528 0.07%
- Firm Commitment - - 0.00%
- CSR: 1. Community Relation 4,208 56,358 0.03%2. Community Empowerment 238 3,194 0.00%3. Community Services 6,380 85,442 0.05%4. Infrastructure 4,586 61,414 0.04%5. Environmental Management 1,335 17,878 0.01%Total CSR 16,748 224,286 0.14%Total Other Unreconciled Information 25,748 344,814 0.21%
Oil and gas revenue (LKPP 2015) 161,759,679 100.00%
Exchange rate: Rp 13,392 (rate used in LKPP 2015)Source: EITI Data 2015
Executive Summary 2015 21
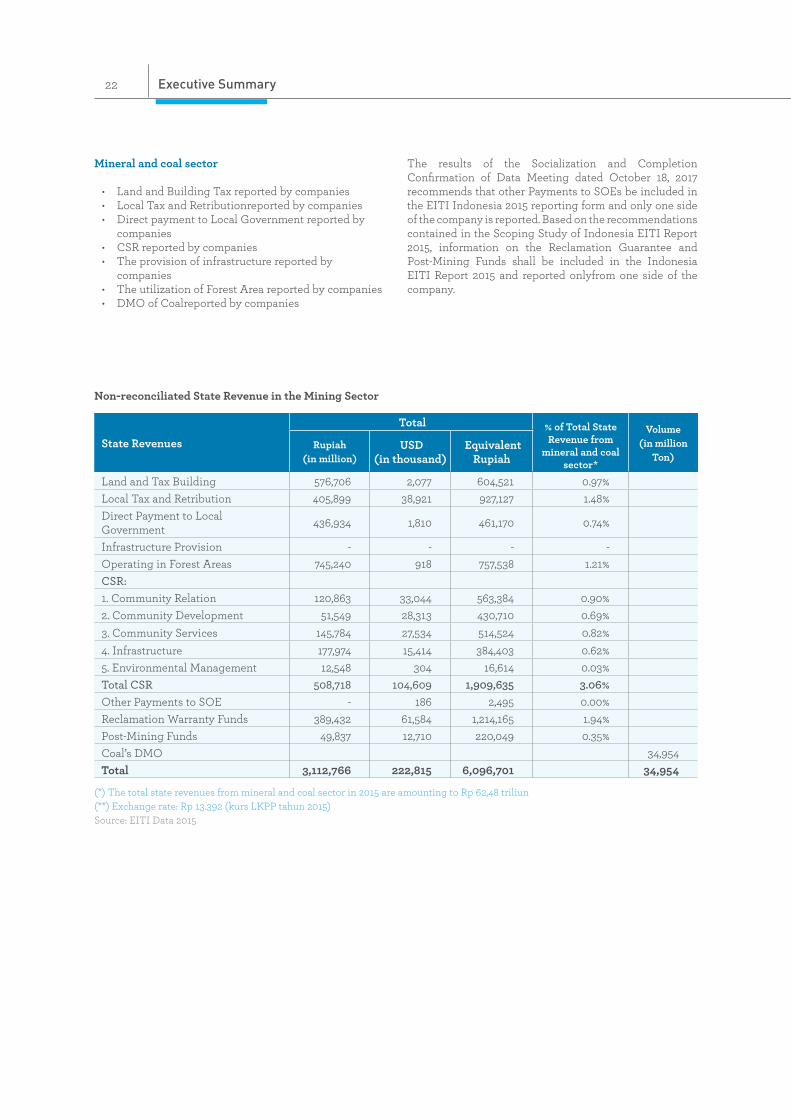
Mineral and coal sector
• Land and Building Tax reported by companies• Local Tax and Retributionreported by companies• Direct payment to Local Government reported by
companies• CSR reported by companies• The provision of infrastructure reported by
companies• The utilization of Forest Area reported by companies• DMO of Coalreported by companies
The results of the Socialization and Completion Confirmation of Data Meeting dated October 18, 2017 recommends that other Payments to SOEs be included in the EITI Indonesia 2015 reporting form and only one side of the company is reported. Based on the recommendations contained in the Scoping Study of Indonesia EITI Report 2015, information on the Reclamation Guarantee and Post-Mining Funds shall be included in the Indonesia EITI Report 2015 and reported onlyfrom one side of the company.
Non-reconciliated State Revenue in the Mining Sector
State Revenues
Total % of Total State Revenue from
mineral and coal sector*
Volume (in million
Ton)Rupiah
(in million) USD
(in thousand) Equivalent
Rupiah
Land and Tax Building 576,706 2,077 604,521 0.97%Local Tax and Retribution 405,899 38,921 927,127 1.48%Direct Payment to Local Government 436,934 1,810 461,170 0.74%
Infrastructure Provision - - - -Operating in Forest Areas 745,240 918 757,538 1.21%CSR: 1. Community Relation 120,863 33,044 563,384 0.90%2. Community Development 51,549 28,313 430,710 0.69%3. Community Services 145,784 27,534 514,524 0.82%4. Infrastructure 177,974 15,414 384,403 0.62%5. Environmental Management 12,548 304 16,614 0.03%Total CSR 508,718 104,609 1,909,635 3.06%Other Payments to SOE - 186 2,495 0.00%Reclamation Warranty Funds 389,432 61,584 1,214,165 1.94%Post-Mining Funds 49,837 12,710 220,049 0.35%Coal’s DMO 34,954Total 3,112,766 222,815 6,096,701 34,954
(*) The total state revenues from mineral and coal sector in 2015 are amounting to Rp 62,48 triliun(**) Exchange rate: Rp 13.392 (kurs LKPP tahun 2015) Source: EITI Data 2015
22 Executive Summary
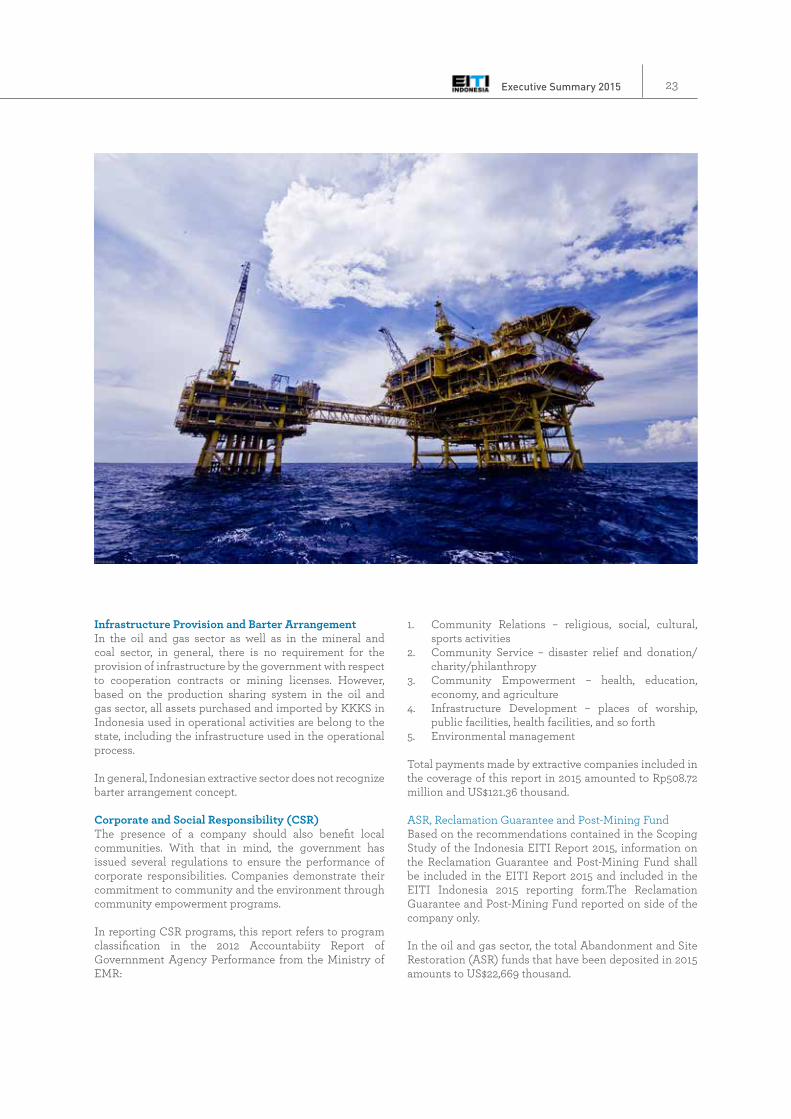
Infrastructure Provision and barter Arrangement In the oil and gas sector as well as in the mineral and coal sector, in general, there is no requirement for the provision of infrastructure by the government with respect to cooperation contracts or mining licenses. However, based on the production sharing system in the oil and gas sector, all assets purchased and imported by KKKS in Indonesia used in operational activities are belong to the state, including the infrastructure used in the operational process.
In general, Indonesian extractive sector does not recognize barter arrangement concept.
Corporate and Social Responsibility (CSR)The presence of a company should also benefit local communities. With that in mind, the government has issued several regulations to ensure the performance of corporate responsibilities. Companies demonstrate their commitment to community and the environment through community empowerment programs.
In reporting CSR programs, this report refers to program classification in the 2012 Accountabiity Report of Governnment Agency Performance from the Ministry of EMR:
1. Community Relations – religious, social, cultural, sports activities
2. Community Service – disaster relief and donation/charity/philanthropy
3. Community Empowerment – health, education, economy, and agriculture
4. Infrastructure Development – places of worship, public facilities, health facilities, and so forth
5. Environmental management
Total payments made by extractive companies included in the coverage of this report in 2015 amounted to Rp508.72 million and US$121.36 thousand.
ASR, Reclamation Guarantee and Post-Mining FundBased on the recommendations contained in the Scoping Study of the Indonesia EITI Report 2015, information on the Reclamation Guarantee and Post-Mining Fund shall be included in the EITI Report 2015 and included in the EITI Indonesia 2015 reporting form.The Reclamation Guarantee and Post-Mining Fund reported on side of the company only.
In the oil and gas sector, the total Abandonment and Site Restoration (ASR) funds that have been deposited in 2015 amounts to US$22,669 thousand.
Executive Summary 2015 23

Total reclamation guarantee and post-mining fund payments by mineral and coal companies included in the coverage of this report in 2015 is amounting to Rp389,432 million and US$61,584 thousand for reclamation guarantee and amounting to Rp49,837 million and US$12,710 thousand for post-mining fund.
TransportationPT Pertamina (Persero) received transportation fees (toll fee) from KKKS, PT Perusahaan Gas Negara (Persero) / PGN and other companies for the transmission of oil and gas through pipe network owned by PT Pertamina (Persero). In 2015, the total toll fee obtained is US$111,755 thousand, of which the amount does not reach 1% of the total state revenue from oil and gas sector, so that no reconciliation is required.
In the mineral and coal sector, based on data collected, the cost of coal transportation that PT Bukit Asam (Persero) Tbk paid to PT Kereta Api Indonesia (Persero) in total was over 1% of the total state revenues in the mining sector. As this constituted significant revenues, this report reconciled the amount. The total amount paid by PT Bukit Asam (Persero) Tbk to PT Kereta Api Indonesia (Persero) in 2015 is amounting to Rp1.70 trillion and US$72.37 million.
State-Owned Enterprise (SOE) in the Extractive Industry There are 4 extractive SOEs in Indonesia, namely PT Pertamina (Persero), PT Aneka Tambang (Persero) Tbk., PT Bukit Asam (Persero) Tbk. and PT Timah (Persero) Tbk.
PT Pertamina (Persero) is the only SOE in the oil and gas sector and is the second largest lifting of oil and
gas contributor in the country (see figure Oil and Gas Companies Contributing the Largest Liftings in 2015).
In addition to PT Pertamina (Persero), there is a subsidiary of PGN engaged in oil and gas sector, namely PT Saka Energi Indonesia, which its parent company (PGN) is engaged in different industries, these are transportation and trading of natural gas.
Direct Payment to the Local GovernmentDirect payments from companies to local governments are based on local regulations (Perda) and based on commitments between companies and local governments.
In the oil and gas sector, the PDRD is paid by the central government to the local government based on the concept of assume and discharge or paid by the oil and gas companies, but can be calculated as the cost recovery component and then will be a deduction factor of oil and gas natural resources (SDA) PNBP, whereas for the mineral and coal company, PDRD is paid directly by the company.
In the mineral and coal sector companies, direct payments to local governments based on formal agreements paid by the company during 2015 amounting to Rp436,934 million and US $ 1,810 thousand. A list of companies making direct payments to the local governments can be seen in EITI Reconciliation Report 2015
Entities within Scope of Reconciliations This report identified extractive companies based on the share of contribution of each company to total state revenues from extractive industry.
24 Executive Summary

In the oil and gas sector, the coverage rate of the reporting companies is 100%, whereby all KKKS operators and KKKS partners who have entered the exploitation and producing stage are the reporting companies. In accordance with the Scoping Study of EITI Indonesia Report 2015 the number of oil and gas companies reporting in 2015 is 167 companies from 61 oil and gas working areas, consisting of 69 KKKS Operator and 98 KKKS Partners.
In the mineral and coal sector, in accordance with the Scoping Study of EITI Indonesia Report 2015, mineral and coal companies participating in the Indonesia EITI Report 2015 are contributing to the PHT, royalties and land rentsmore than 14 billion rupiah. Using this limit of materiality, the total amount of EITI reporting companies in 2015 is 123 companies consisting of 35 coal companies with PKP2B contracts, 7 mineral companies with KK contracts and 81 mineral and coal companies under IUP contracts. These reporting companies contributed 93.61% of the total mining non-tax revenue, comprising royalty revenue amounts to 56.47%, PHT revenue amounts to 40.33% and land rent revenue amounts to 3.2%
Government entitites covered in the reconciliation report are DG Tax, DG Budget, DG Oil and Gas, DG Minerals and Coal and SKK Migas. State revenues component presented unilaterally (not included in the reconciliation process) are from DG Fiscal Balance, Riau Provincial Government, East Kalimantan Provincial Government and East Java Provincial Government.
Non-Complying CompaniesIn the oil and gas sector, out of 167 oil and gas companies expected to report, there are 14 companies do not report consisting of 5 KKKS operators and 9 KKKS partners. Of the 5 KKKS operators, 2 KKKS of which have been declared bankrupt by the court. Based on reports from SKK Migas and DG Budget, the total Government Lifting and Over / (Under) Lifting of Oil and Gas from non-reporting companies is 0.63% of total Government Lifting and Over / (Under) Lifting of Oil and Gas in 2015.
List of Oil and Gas Companies that Do Not Report(in thousand USD)
Name Working Area
SKK Migas
Government Lifting of Oil
Government Lifting of
Gas
Over/(Under) Lifting of Oil
Over/(Under)
Lifting of Gas
Total
KKKS Operator
1 PT SUMATERA PERSADA ENERGI
WEST KAMPAR 569 - - - 569
2 PT EMP TONGA TONGA FIELD - - 128 - 128
3 PETROSELAT, LTD. SELAT PANJANG 589 - - - 589
4 EMP MALACCA STRAIT S.A.
MALACCA STRAIT 11,031 4,029 5,537 672 21,270
5 EMP (BENTU) LTD. BENTU SEGAT - 32,218 - (1,225) 30,993
TOTAL 12,189 36,248 5,665 (553) 53,549
TOTAL OIL AND GAS PNbP 5,527,753 3,196,090 (47,904) (168,720) 8,507,219
PERCENTAGE 0,22% 1,13% -11,83% 0,33% 0,63% Source: EITI Data 2015
Executive Summary 2015 25

In the mineral and coal sector, out of 123 companies that are expected to report, there are 38 companies do not report. Hence, no information on how much royalty, PHT, land rent and Income Tax Article 25/29 (Corporate Income
Tax) paid to the State Treasury can be obtained. Of the 38 companies, 5 companies are no longer producing and 3 companies are in unknown locations.
26 Executive Summary
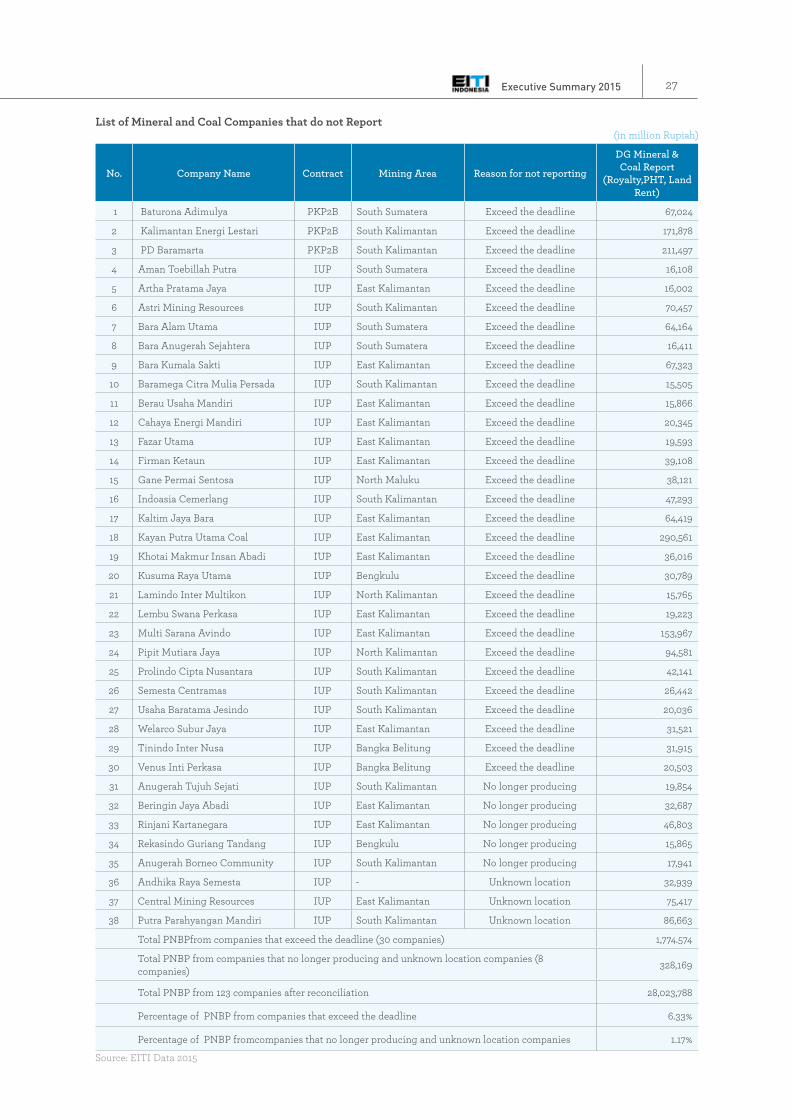
List of Mineral and Coal Companies that do not Report(in million Rupiah)
No. Company Name Contract Mining Area Reason for not reporting
DG Mineral & Coal Report
(Royalty,PHT, Land Rent)
1 Baturona Adimulya PKP2B South Sumatera Exceed the deadline 67,024
2 Kalimantan Energi Lestari PKP2B South Kalimantan Exceed the deadline 171,878
3 PD Baramarta PKP2B South Kalimantan Exceed the deadline 211,497
4 Aman Toebillah Putra IUP South Sumatera Exceed the deadline 16,108
5 Artha Pratama Jaya IUP East Kalimantan Exceed the deadline 16,002
6 Astri Mining Resources IUP South Kalimantan Exceed the deadline 70,457
7 Bara Alam Utama IUP South Sumatera Exceed the deadline 64,164
8 Bara Anugerah Sejahtera IUP South Sumatera Exceed the deadline 16,411
9 Bara Kumala Sakti IUP East Kalimantan Exceed the deadline 67,323
10 Baramega Citra Mulia Persada IUP South Kalimantan Exceed the deadline 15,505
11 Berau Usaha Mandiri IUP East Kalimantan Exceed the deadline 15,866
12 Cahaya Energi Mandiri IUP East Kalimantan Exceed the deadline 20,345
13 Fazar Utama IUP East Kalimantan Exceed the deadline 19,593
14 Firman Ketaun IUP East Kalimantan Exceed the deadline 39,108
15 Gane Permai Sentosa IUP North Maluku Exceed the deadline 38,121
16 Indoasia Cemerlang IUP South Kalimantan Exceed the deadline 47,293
17 Kaltim Jaya Bara IUP East Kalimantan Exceed the deadline 64,419
18 Kayan Putra Utama Coal IUP East Kalimantan Exceed the deadline 290,561
19 Khotai Makmur Insan Abadi IUP East Kalimantan Exceed the deadline 36,016
20 Kusuma Raya Utama IUP Bengkulu Exceed the deadline 30,789
21 Lamindo Inter Multikon IUP North Kalimantan Exceed the deadline 15,765
22 Lembu Swana Perkasa IUP East Kalimantan Exceed the deadline 19,223
23 Multi Sarana Avindo IUP East Kalimantan Exceed the deadline 153,967
24 Pipit Mutiara Jaya IUP North Kalimantan Exceed the deadline 94,581
25 Prolindo Cipta Nusantara IUP South Kalimantan Exceed the deadline 42,141
26 Semesta Centramas IUP South Kalimantan Exceed the deadline 26,442
27 Usaha Baratama Jesindo IUP South Kalimantan Exceed the deadline 20,036
28 Welarco Subur Jaya IUP East Kalimantan Exceed the deadline 31,521
29 Tinindo Inter Nusa IUP Bangka Belitung Exceed the deadline 31,915
30 Venus Inti Perkasa IUP Bangka Belitung Exceed the deadline 20,503
31 Anugerah Tujuh Sejati IUP South Kalimantan No longer producing 19,854
32 Beringin Jaya Abadi IUP East Kalimantan No longer producing 32,687
33 Rinjani Kartanegara IUP East Kalimantan No longer producing 46,803
34 Rekasindo Guriang Tandang IUP Bengkulu No longer producing 15,865
35 Anugerah Borneo Community IUP South Kalimantan No longer producing 17,941
36 Andhika Raya Semesta IUP - Unknown location 32,939
37 Central Mining Resources IUP East Kalimantan Unknown location 75,417
38 Putra Parahyangan Mandiri IUP South Kalimantan Unknown location 86,663
Total PNBPfrom companies that exceed the deadline (30 companies) 1,774.574
Total PNBP from companies that no longer producing and unknown location companies (8 companies) 328,169
Total PNBP from 123 companies after reconciliation 28,023,788
Percentage of PNBP from companies that exceed the deadline 6.33%
Percentage of PNBP fromcompanies that no longer producing and unknown location companies 1.17%
Source: EITI Data 2015
Executive Summary 2015 27

Based on the decision of the Implementation Team Meeting dated November 23, 2017, 38 non-reporting companies, including 5 non-producing companies and 3 unknown location companies are excluded from the scope of the reconciled company.
Using PNBP data obtained from DG Mineral and Coal, the amount of non-tax revenues of 30 companies that do not report amounted to Rp1,774,574 million or 6.33% of the total reconciliated non-tax revenues. While the amount of PNBP from 8 companies that do not produce and locations are not known is amounting to Rp328,169 million or 1.17% of the total amount of reconciliated PNBP.
Revenue Sharing Fund (DBH)The calculation of the allocation of DBH SDA follows the scheme set forth in the Government Regulation 55/2005. DBH SDA is calculated from PNBP SDA received by the central government and reported in the LKPP, then divided into local governments with a certain percentage rate based on the producing region to fund the needs of the region in the context of decentralization implementation.
Throughout 2015, the realization of the allocation of DBH SDA Oil and Gas and General Mining from the Central Government to Local Government amounted to Rp40.1 trillion.
28 Executive Summary

29Executive Summary 2015

This page is intentionally left blank

This page is intentionally left blank

EITI INDONESIA REPORT EXECUTIVE SUMMARY
Secretariat EITI Indonesia
Kementerian Koordinator Bidang Perekonomian, lt 4Jl. Medan Merdeka Barat No.7, Jakarta 10110 - Indonesia Telp: +62 21 3483 2642 Fax: +62 21 3483 2658 email: [email protected]