executive compensation structure, ownership, and firm ... 1995.pdfexecutive compensation structure,...
TRANSCRIPT

JOURNAI+OF
Fhancd ELSEVIER Journal of Financial Economics 38 (1995) 163-184 ECONOMICS
Executive compensation structure, ownership, and firm performance
Hamid Mehran Wallace E. Carroll School of Management, Boston College, Chestnut Hill, MA 02167-3808, USA
(Received October 1991; final version received February 1994)
Abstract
An examination of the executive compensation structure of 153 randomly-selected manufacturing firms in 1979-1980 provides evidence supporting advocates of incentive compensation, and also suggests that the form rather than the level of compensation is what motivates managers to increase firm value. Firm performance is positively related to the percentage of equity held by managers and to the percentage of their compensation that is equity-based. Moreover, equity-based compensation is used more extensively in firms with more outside directors. Finally, firms in which a higher percentage of the shares are held by insiders or outside blockholders use less equity-based compensation.
Key words: Compensation structure; Ownership; Directors; Blockholders JEL classijication: G32; 533; L22
1. Introduction
Despite widespread public attention and a surge in research interest, the relationships among executive compensation structure, ownership structure and control, and firm performance are still little understood. For example, Jensen and Murphy (1990a) suggest that equity-based rather than cash compensation
The author would like to acknowledge the helpful comments of Timothy Mech, Ram Ramanan, Betty Strock Bagnani, and Kenneth Wiles. Special thanks are due Clifford Holderness, Michael Jensen (the editor), Kevin Murphy (the referee), and Robert Taggart. I also benefited from the comments of participants in seminars at Boston College and the London School of EConomics. An earlier version of this paper entitled ‘The Determinants of the Structure of Executive Compensation’ was presented at the 1990 Financial Management Association meeting.
0304-405X/95/$09.50 0 1995 Elsevier Science S.A. All rights reserved SSDI 0304405X9400809 F

164 H. Mehran/Journal of Financial Economics 38 (1995) 163-184
gives managers the correct incentive to maximize firm value, but there is little empirical evidence on whether corporations whose executive compensation is more equity-based actually perform better. Little is known, either, about whether the ownership of the company’s stock by insiders versus outsiders or the composition of the board of directors affects executive compensation structure.
This study presents empirical evidence on the relationship between the struc- ture of executive compensation and firm performance. It is exploratory in that executive compensation, ownership structure, and board composition are ulti- mately part of a simultaneous system that determines the corporation’s value and the allocation of that value among various claimants. As a result, the associations reported here are not necessarily causal ones. Nevertheless, empiri- cal regularities in the structure of executive compensation should help guide future research.
This study differs from previous work on compensation in two ways. First, it focuses on the structure rather than the level of compensation. Second, it investigates executive compensation in the context of the firm’s ownership structure and the composition of its board of directors. I use 197991980 compensation data for 153 randomly-selected manufacturing firms. An impor- tant feature of the sample is that it focuses on small as well as large firms, thus providing the variation necessary to conduct statistical tests. In addition, the sample is constructed separately for CEOs, for top executives, as well as for all officers and directors as a group.
My primary findings on compensation structure are as follows: (1) firms with more outside directors have a higher percentage of their executive com- pensation in equity-based form; (2) the percentage of executive compensation that is equity-based is inversely related to their percentage of equity hold- ings; and (3) firms in which a higher percentage of the shares are held by out- side blockholders use less equity-based compensation. My findings on firm performance, as proxied by Tobin’s Q and by return on assets, are as follows: (1) firm performance is positively related to the percentage of executive compensation that is equity-based; and (2) firm performance is positively related to the percentage of equity held by managers. These findings support tying executive compensation more closely to firm performance (as measured by stock price or other indicators); they also suggest that the form, rather than the level, of compensation is what motivates managers to increase firm value.
Section 2 of the paper presents possible relationships among the composition of executive pay packages, ownership structure, board composition, and firm performance. Section 3 describes the sample selection procedure and method. The empirical results and their interpretation are presented in Section 4. Section 5 summarizes the key findings.

H. MehranjJoumal of Financial Economics 38 (1995) 163-184 165
2. Agency theory, executive compensation structure, and firm performance
Jensen and Meckling (1976) argue that ownership structure, executive com- pensation structure, and board composition are determined by each other and by the nature of a firm’s business (e.g., business risk, nature of real assets, cash flow pattern, and firm size). They suggest that these variables also influence a firm’s performance. Although aspects of this potentially complex simultaneous relationship have been examined by researchers, only limited research has been done on the structure of executive compensation1 Moreover, the empirical relationship between executive incentive plans and firm performance has not been established. What work has been done, however, provides some guidance for the empirical investigations that are the primary focus of this paper.
Top managers, like most individuals, are portrayed in the literature as being risk-averse. This implies, as Harris and Raviv (1979) explain, that managers will want their compensation structured so that they bear less personal risk. Given a certain level of compensation, managers should prefer fixed cash compensa- tion over equity-based compensation. The latter, of course, is tied to the firm’s stock return and is to some degree beyond managers’ control. This preference is reinforced because the value of a manager’s human capital will also vary with the firm’s stock performance. In order to reduce their compensation risk, managers may engage in activities which reduce the firm’s risk (Jensen and Meckling, 1976; Amihud and Lev, 1981). These activities in turn can adversely affect shareholders’ wealth.
Shareholders, on the other hand, are considered risk-neutral because they can diversify firm-specific risk simply by holding a diversified portfolio. Moreover, shareholders will anticipate that managers will attempt to avoid risks in ways that can reduce firm value. While there are several ways to reduce this conflict over risk, previous research suggests that tying managers’ compensation to firm
‘Brickley and Dark (1987), among others, have shown that ownership structure is related to business risk and firm size. Other studies provide empirical evidence on the relationship between insiders’ ownership and firm performance, although the evidence is mixed. While Demsetz and Lehn (1985) find no significant relationship between various measures of insider ownership and accounting profit, Merck, Shleifer, and Vishny (1988), McConnell and Servaes (1990), and Hermalin and Weisbach (1991) find a nonlinear relationship between the fraction of company stock held by insiders and Tobin’s Q. These studies also examine the relationship between the nature of the firm’s business and firm performance, again with mixed results. Several researchers have studied factors influencing board composition. Brickley and van Drunen (1987) document a positive relationship between the percentage of outside directors and firm size. They find a similar relationship between the percentage of outside directors and the firm’s stock return variance. Weisbach (1988) finds a negative relationship between the percentage of outside directors and insiders’ ownership. He argues that monitoring by outside directors and the direct incentive created by insiders’ ownership may be substitute methods of controlling agency costs. However, no significant relationship has been found between board composition and firm performance (Hermalin and Weisbach, 1991).

166 H. MehranJJournal of Financial Economics 38 (1995) 163-184
performance motivates them to make more value-maximizing decisions (e.g., Holmstrom, 1979; Harris and Raviv, 1979; Grossman and Hart, 1983). Other studies suggest that one specific way to tie pay to performance is by making a greater percentage of a manager’s compensation equity-based, such as through incentive stock options (e.g., Jensen and Murphy, 1990a). Other researchers have formally shown that incentive-compensation plans motivate managers to take on more risk (e.g., Hirshleifer and Suh, 1992). For these reasons, share- holders should prefer (holding the level of compensation constant) that man- agers’ pay packages contain more equity-based forms of compensation, although it may not be optimal to tie all of the components of these pay packages to the firm’s stock price (Paul, 1992; Sloan, 1993).
Shareholders, of course, do not set executive compensation. They elect direc- tors, who have the exclusive right under corporate law to manage the corpora- tion. Among the most important of directors’ tasks is to set the level and structure of the compensation of top executives (e.g., Fama and Jensen, 1983), which raises the issue of how the composition of the board affects the structure of executive compensation. There is a growing body of evidence that outside directors (those who do not work for the company) are more independent of top management and thus better represent the interests of shareholders than do inside directors. For example, Rosenstein and Wyatt (1990) find that the ap- pointment of outside directors produces a positive stock price response, on average. Weisbach (1988) documents that poor stock-price performance in- creases the probability that the CEO will be replaced; this probability increases further with the percentage of outside directors.
In light of these empirical findings, I hypothesize that outsider-dominated boards are likely to make greater use of equity-based compensation. In contrast, insider-dominated boards are likely to be more responsive to the interests of top management and will thus use proportionately more fixed cash compensation. I investigate these possibilities by examining the relationship between the composition of the board and the structure of executive compensation. I also investigate whether the presence of certain types of outside directors on the board, particularly investment bankers and top managers from other firms, is associated with greater use of equity-based compensation.’
In addition, I examine whether boards consider the managers’ total incentives (e.g., their stock options outstanding and their direct equity holdings) in setting compensation packages. I hypothesize that boards will use more equity-based compensation when the managers own a small fraction of the firm or when they
‘The role of investment bankers in LBOs and venture capitalists in startups and IPOs is more than that of outside directors who give advice. Since they supply capital, they are large blockholders, and thus can exercise substantial influence on compensation policy, as well as on other policies in these organizations.
H. MehranjJournal of Financial Economics 38 (1995) 163-184 161
do not have a significant amount of unexercised stock options or other equity- based compensation plans.
Many have argued, starting with Jensen and Meckling (1976), that agency problems typically will be controlled by several mechanisms, including the market for corporate control (e.g., Jensen and Ruback, 1983), the managerial labor market (e.g., Fama, 1980), and product market control (e.g., Hart, 1983). Thus, the structure of executive compensation is unlikely to be determined by the composition of the board alone. Several papers indicate that large outside blockholders play a role in management decisions (e.g., Shleifer and Vishny, 1986), raising the possibility that the use of equity-based compensation will increase with the presence of outside blockholders. Alternatively, if outside blockholders are substitutes in part for monitoring activities by the board, then the use of equity-based pay would decline as a result of their presence.
There is some anecdotal evidence that outside blockholders have influenced executive compensation3 For example, a number of major shareholders ques- tioned a proposal by General Motors to increase its executives’ pensions (White, 1990). The plan would have increased the annual retirement pay of the CEO, who was scheduled to retire in 75 days, to $1.2 million. Among the opposition was Michigan’s state treasurer, who indicated that he would vote the state’s 8.8 million GM shares against the plan. GM’s board could have proceeded with the plan even if a majority of shareholders voted against it, but instead assured the shareholders that it would abide by their wishes. In general, however, there is little empirical evidence on the relationship between the firm’s compensation structure and the presence of outside blockholders.
An issue related to, but separate from, the determinants of the structure of executive compensation is the relation between compensation structure and firm performance. Simply put, is the greater use of equity-based compensation associated with improved firm performance? Murphy (1985) finds a statistically significant relationship between the level of pay and performance. Jensen and Murphy (1990b) also find a statistically significant relationship between the level of pay (measured by changes in executive wealth) and performance (measured by changes in firm value), but they are surprised by the lack of a strong economic relationship between changes in executive wealth and changes in firm value. They suggest that there may be a stronger relationship between equity-based compensation and firm performance. They also suggest that most firms could increase value by using more equity-based compensation (Jensen and Murphy 1990a). In this paper I explore these possibilities.
30f course, small shareholders can propose equity-based compensation plans for managers (see for example, the shareholders’ proposal in relation to stock option plans, GAF Corporation’s 1979 proxy statement). In most cases, the board recommends a vote against adoption of the shareholder proposal.

168 H. MehranjJournal of Financial Economics 38 (1995) 163-184
3. Tbe methodology and sources of data
3.1. Method
The hypotheses established in Section 2 are tested cross-sectionally using ordinary least-squares (OLS) analysis. Eq. (1) describes the model used to test the relationships between compensation structure and variables for ownership structure and control:
Compensation structure
= f(percentage of equity held by managers, percentage of equity held by all outside blockholders, percentage of outside directors, and control variables) (1)
Eq. (2) describes the relationships between firm performance and variables for compensation structure, ownership structure, and control:
Firm performance
= f (compensation structure, percentage of equity held by managers, percentage of equity held by all outside blockholders, percentage of outside directors, and control variables) (2)
3.2. Data sowces and time
The sample consists of 153 randomly-selected manufacturing firms (of the initial random sample of 170 firms, five firms were dropped because of missing proxy statements, six were excluded because of their foreign origin, and six firms were deleted because their stocks traded infrequently). Each firm has a complete record for selected data items for 1973-1983 on the COMPUSTAT Annual Industrial File. I collected the following items for 1979 and 1980: (1) salary, (2) bonus, (3) performance shares and units, (4) restricted stocks, (5) phantom stocks, (6) dividend units, (7) number of options granted and their exercise prices, (8) number of options held and their weighted average exercise price, (9) saving plans, (10) properties and insurance, (11) number of shares held by executives and their immediate families, (12) number and identity of outside blockholders and their equity investment in the firm, (13) number and affiliations of board members, (14) age of the CEO, and (15) number of top managers employed by the firm. Items (l)-( 14) come from proxy statements and item (15) from Moody’s Manuals. The exercise price and maturity on the components of stock options outstanding for 1979 and 1980 were collected from 1975-1977 proxy statements. I collected compensation data [items (l)-(lo)] and insiders’ ownership data [item (ll)] separately for the highest-ranking executive and the group of top executives whose compensation is explicitly defined in the proxy statements, as

H. Mehran/Journal of Financial Economics 38 (1995) 163-184 169
well as for all officers and directors as a group. I measure most of the variables as the averages for the years 1979-1980, but different proxies of business risk require longer periods, the longest being 1973-1983.
3.3. Measurement qf variables
Compensation structure: I use three measures of compensation: (1) percent- age of total compensation in grants of new stock options, with the options valued by the Black-Scholes formula, (2) percentage of total compensation that is equity-based, and (3) percentage of total compensation in salary plus bonus. Total compensation is the sum of the dollar values of salary, bonus, dividend units, saving plans, properties, insurance, and the value of the awards from grants of new stock options, phantom stocks, restricted stocks, performance shares, and performance units. The percentage of total compensation that is equity-based is measured as the ratio of the sum of the value of awards from grants of new stock options, restricted stocks, phantom stocks, and performance shares to total compensation. Finally, the cash percentage of total compensation is the ratio of salary plus bonus to total compensation.
In analyzing the effect of compensation structure on firm performance, I only considered expected rather than realized compensation. Thus, the measurement of stock options exclude the change in the value of the accrued stock of outstanding options during the sample period. The reason is that there is a mechanical relation between firm performance and realized executives’ wealth. As an example, consider two firms that pay salaries of $X and that made a one-time-only stock option grant of 1,000 shares several years ago (with no subsequent grants). Suppose one of these firms turns out to be a high performer, while the other one is low performer. The low-performing firm will have a zero realized option value, while the high performer (with high appreciation) will have a large realized option value. Thus, a regression of firm performance on realized stock options will yield a positive mechanical correlation, and will not allow inferences about the effectiveness of stock options. Measurement of compensation is discussed further in the appendix.
Ownership structure: The percentage of equity held by managers is measured using the sum of their direct share ownership and their stock options outstand- ing plus share ownership by their immediate families. The percentage of equity held by all outside blockholders is measured using the sum of the percentages of equity held by individual investors, institutional investors, and corporations who own at least 5% of the common stock of the company. I choose 5% (as many researchers do) because this ownnership level triggers mandatory public filing under SEC regulation.
Percentage of outside directors: Outside directors are members of the board who are neither top executives, retired executives, or former executives of the company nor relatives of the CEO. Outside corporate lawyers who are
170 H. MehranlJournal of Financial Economics 38 (1995) 163-184
employed by the firm and also serve on the board are considered insiders since many have conflicts of interest (e.g., Vancil, 1987). I also measure the percentage of outside directors employed by manufacturing firms, savings and loans and banks, investment banking firms, venture capital firms, and insurance companies.
Firm performance: The proxies for firm performance in Eq. (2) are Tobin’s Q, measured by the ratio of the market value of the firm’s securities to the replacement cost of its tangible assets, and return on assets (ROA), measured by the ratio of net income to the book value of the firm’s total assets. The Qs are from the R&D Master File (Cummins, Hall, Laderman, and Mody, 1985), and net income and total assets are from the COMPUSTAT Annual Industrial File.
Whether Q and ROA are correct proxies for firm performance is a subject of continuing debate in the literature. In addition to well-known measurement problems associated with Q, many have argued that Q is a better proxy for the firm’s growth opportunity than its performance. Others argue that ROA (and other accounting rates of return) conveys little information about economic rates of return (e.g., Fisher and McGowan, 1983; Benston, 1985). An argument for using ROA is that accounting returns are highly important in determining executive compensation (e.g., Antle and Smith, 1986; Jensen and Murphy, 1990b; Ely, 1991). Paul (1992) argues that accounting returns provide informa- tion to the board about the value added to the firm by the CEO. Therefore, executives have incentives to make major corporate decisions and/or report income in such a way as to affect ROA and, thus, their compensation (e.g., Defeo, Lambert, and Larcker, 1989). Other measures, such as stock return, have also been suggested in the literature. Stock return as a proxy for firm performance is most appropriate, however, for all-equity firms. While the three proxies have their own shortcomings, they are highly correlated (Jacobson, 1987; Landsman and Shapiro, 1989), and the qualitative nature of the results should not be affected by the choice of the proxy. Therefore, to be consistent with the litera- ture, I have chosen Q and ROA.
Control variables: Control variables introduced in Eq. (1) are growth oppor- tunities, leverage ratio, business risk, and firm size (see Smith and Watts, 1992, or Lewellen, Loderer, and Martin, 1987, for a discussion of the relationship between these variables and executive compensation). Eq. (2) contains an addi- tional control variable to capture the portion of firm value in assets in place. The source of data for these variables is the COMPUSTAT Industrial Annual File. The proxy for growth opportunities is research and development as a percent- age of sales. The proxy for the portion of the firm’s value in assets in place is the ratio of inventory plus gross plant and equipment to total assets. The proxy for leverage is the ratio of long-term debt to total assets. Size is measured by the log of the book value of assets. The proxies for growth opportunities, assets in place, leverage, and size are measured over 197991980. Business risk is measured by the standard deviation of the percentage of change in operating income, where the latter is measured with annual data over 1973-1983.

H. MehranlJournal of Financial Economics 38 (1995) 163-184 171
4. Empirical results
4.1. Sample characteristics
Compensation structure and insider ownership: Summary statistics for the structure of various CEO compensation plans over 1979-1980 are presented in panel A of Table 1. Nearly 74% of the CEOs’ total compensation is in salary and bonus. New stock options granted account for only 6.9%, whereas equity-based compensation accounts for 12.7% of CEOs’ total compensation.4 Panel B of
Table 1 Summary statistics
Panel A: Distribution of percentages of CEOs’ total compensations in salary plus bonus, new stock options granted, and equity-based compensation for the average of 1979-1980 data for 153 randomly-selected manufacturing firms. Total compensation is the sum of the dollar values of salary, bonus, dividend units, saving plans, properties, insurance, and the value of the awards from grants of new stock options, phantom stocks, restricted stocks, performance shares, and performance units. Equity-based compensation is the sum of values of the awards from grants of new stock options, phantom stocks, restricted stocks, and performance shares.
Variables
% of compensation in salary & bonus % of compensation in grants of new stock options % of compensation in all equity-based plans
Mean
74.3% 6.9
12.7
Med.
79.0% 0.0 2.4
Min.
3.4% 0.0 0.0
Max.
100.0% 57.9 92.1
Panel B: Distribution of age of CEOs, percentage of shares and stock options outstanding held by CEOs plus shares held by their immediate families, and percentage of CEOs’ voting power for 153 manufacturing firms for the average of 1979-1980 data.
Variables Mean Min. 1st quart. Med.
3rd quart. Max.
Age of CEO 57 42 53 58 61 80 % of shares and stock options
outstanding held by CEOs plus shares held by their immediate families 5.9% 0.0% 0.1% 1.2% 6.6% 45.5%
CEOs’ voting power (in percent) 9.0% 0.0% 0.3% 1.8% 11.2% 62.2%
“CEOs’ voting power is measured by the sum of the percentage of shares that CEOs and their immediate families beneficially own and the percentage of shares over which CEOs have the sole or shared power to direct the voting (such as being a co-trustee of employees’ trust or a co-trustee of a charitable foundation trust) plus CEOs’ stock options outstanding.
4Ninety-two sample firms granted options to their CEOs, 124 firms granted options to their top executives, and 130 to their officers and directors. Bennett (1987) reports that 82% of manufacturing firms have option plans for their executives, exactly the percentage found in this study.

172 H. MehranjJournal of Financial Economics 38 (1995) 163-184
Table 1 shows CEO age, the percentage of the CEOs’ ownership of equity and stock options outstanding in the firm, and their voting power. CEOs’ voting power is the sum of the percentage of shares that CEOs and their immediate families beneficially own, CEOs’ stock options outstanding plus the percentage of shares over which CEOs having the sole or shared power to direct the voting (such as being a co-trustee of an employees’ trust or a co-trustee of a charitable foundation trust). The average age of a CEO in the sample is 57. CEOs hold on average 5.9% in the form of equity and stock options outstanding in their firms (median = 1.2%), and CEOs’ voting power exceeds their direct ownership on average by 3.1%.*
Outside blockholders: Outside blockholders’ investment in the firm varies with their identity. The number of firms in the sample reporting the presence of individual investors, institutional investors, and corporations holding at least 5% of their firms is 20, 46, and 20, respectively.
Size of the board and its composition: Table 2 shows the size and composi- tion of the board of directors. Each board, on average, has 10.4 members. Nearly 56% of the directors are outsiders. These directors are either retired from or currently employed in the following industries: 32.7% are from manufacturing firms, 3.6% are from savings and loans or banks, 3.4% are investment bankers, 1.6% are venture capitalists, and 1.1% are from insurance companies. The remainder of outside directors are academics, former govern- ment and military employees, consultants, clergy, and employees of nonprofit organizations.
4.2. Regression results
Regression estimates for the structure of compensation appear in Table 3. The results are reported separately for CEOs, top executives, and all officers and directors as a group. The estimates for performance are presented in Table 4. Following Eaton and Rosen (1983), the reported results in all the tables are based on the averages of variables over 1979 and 1980, except for the proxy for business risk, which is measured over 1973-1983. I use this approach to account for unusual changes that may have occurred in the variables.
4.2.1. Compensation structure Table 3 shows the regression results for the equity-based percentage of total
compensation. The coefficients of percentage shares and stock options outstand- ing held by CEOs, top executives, and all officers and directors have the
‘Percentages of equity and stock options outstanding held by top executives and all officers and directors are 9.3 and 15.1, respectively.

H. MehranjJournal of Financial Economics 38 (1995) 163-184 173
Table 2 Distributions of the size of the board of directors, percentage of outside directors, percentage of outside directors employed by or retired from manufacturing firms, bank-like institutions, invest- ment banking firms, venture capita1 institutions, and insurance companies for the average of 1979-1980 data for 153 randomly-selected manufacturing firms. The remaining outside directors are academics, former government and military employees, consultants, clergy, and employees of nonprofit organizations.
Variables Mean Med. Min. Max.
Size of the board % of outside directors % of outside directors employed by
manufacturing firms % of outside directors employed by
bank-like institutions % of outside directors employed by
investment banking firms % of outside directors employed by
venture capita1 institutions % of outside directors employed by
insurance companies
10.6 10.0 3.0 19.0 55.0 57.1 4.2 91.3
32.7 29.2 11.0 87.5
3.6 0.0 0.0 40.0
3.4 0.0 0.0 37.5
1.6 0.0 0.0 21.4
1.1 0.0 0.0 16.0
predicted signs and are statistically significant, which suggests that firms with higher managerial ownership have less equity-based compensation in their executive compensation packages. I also find significant negative relationships between percentage of shares held by the above groups (relationships not reported here) and their respective equity-based compensations. The coefficient of the percentage shares held by all outside blockholders is negative and significant in the regression equation in which the dependent variable is the percentage of equity-based compensation for CEOs, suggesting that CEOs of firms in which a larger percentage of shares held by outside blockholders have less equity-based compensation in their compensation packages. The coefficient of the percentage of outside directors is significant, suggesting that firms with more outside directors have more equity-based compensation in their executive pay packages. The coefficient of the ratio of research and development to sales is positive and statistically significant, supporting Smith and Watts (1992), who argue that firms with larger investments in growth opportunities use incentive plans more extensively. Other studies also find this positive rela- tionship (e.g., Eaton and Rosen, 1983; Lewellen, Loderer, and Martin, 1987; Clinch, 199 1).
The results for cash compensation (not reported here) are the opposite of those for equity-based compensation. I find a positive relationship between the percentage of total compensation in cash (salary and bonus) and the percentage of shares held by managers. I also find a positive relationship between the

174 H. Mehran/Journal of Financial Economics 38 (1995) 163-184
Table 3 Ordinary least-squares estimates of percentage of CEOs’, top executives’, and all officers’ and directors’ total compensation in equity-based forms on percentages of their respectives shares and outstanding stock options holdings, percentage of shares held by all outside blockholders, percent- age of outside directors, and proxies for growth opportunities, debt ratio, business risk, and size. Sample is 153 randomly-selected manufacturing firms in 197991980. Standard deviation of the percentage change in operating income is measured over 1973-1983. Other variables are averages for the years 1979 and 1980 (t-statistics in parentheses).
Dependent variable: % equity-based compensation for
Independent variables CEOs Top executives
Intercept
% shares and stock options outstanding held by CEOs
% shares and stock options outstanding held by top executives
% shares and stock options outstanding held by all officers and directors
% shares held by all outside blockholders
% of outside directors
R&D/sales
Long-term debt/total assets
Standard deviation of the percentage change in operating income
Log of total assets
Adjusted R’(%)
F-statistics
0.106 (1.097)
- 0.225 ( - 2.224)**
- 0.156 ( - 1.681)*
0.899 (2.321)** 1.127
(1.975)**
- 0.099 ( - 0.658)
- 0.011 ( - 0.733)
0.014 (1.396)
14.0
4.558
0.099 (0.991)
- 0.268 ( - 2.229)**
- 0.171 ( - 1.612)
0.887 (2.294)** 1.188
(2.098)**
- 0.093 ( - 0.626)
- 0.011 ( - 0.754)
0.014 (1.408)
14.1
4.564
All officers and directors
0.096 (0.964)
- 0.256 ( - 2.222)**
- 0.165 ( - 1.553)
0.897 (2.284)** 1.236
(2.195)**
- 0.040 ( - 0.325)
- 0.011 ( - 0.770)
0.013 (1.349)
13.9
4.515
Asterisks indicate significance at 0.05 (**) and 0.10 (*) levels, two-sided test.
percentage of total compensation in cash and the percentage of shares held by all outside blockholders in the regression equation for CEOs. On the other hand, I find a negative relationship between the percentage of total compensa- tion in cash and both the percentage of outside directors and the ratio of R&D to sales. Although the relationship between managers’ equity-based

H. MehranJJoumal of Financial Economics 38 (1995) 163-184 115
compensation and the firm size is not statistically significant, I find that the percentage of compensation in salary and bonus is inversely related to firm size, consistent with Eaton and Rosen’s finding.
The age of the CEO was also regressed against types of compensation, The argument for including this variable is that older CEOs may prefer cash compensation because of their shorter employment horizon. The con- flict of interest between managers and shareholders due to employment horizon may be reduced, however, if managers own a large percentage of their company’s shares. I find the coefficient of age to be significant at the 10% level in the regression equation for cash. Regressions were also run on the percentage of outstanding shares held by individual investors, institu- tional investors, and corporations and the percentage of outside directors employed by manufacturing firms, bank-like institutions, investment banks venture capital institutions, and insurance companies, but the results were not significant.
4.2.2. Firm performance Panels A and B of Table 4 show the results of regressing firm performance on
equity-based CEO compensation. Panel A uses Tobin’s Q to proxy for firm performance, and panel B uses return on assets (ROA). Column (1) in both panels contains the basic model, in which Q and ROA are regressed against equity-based CEO compensation. The coefficients of the variable in both panels are positive and significant. The results indicate that companies in which CEO compensation is relatively sensitive to firm performance tend to produce higher returns for shareholders than companies in which the relationship between CEO pay and performance is weak.
Column (2) shows the regression results for the percentage of shares and stock options outstanding held by CEOs. The coefficient of the percentage of shares and stock options outstanding held by the CEO is positive and statistically significant. I also find a significant positive relationship (which is not reported here) between the percentage of shares held by the CEO and firm performance.6 These findings support Jensen and Meckling (1976), who suggest that managers’ incentive to work harder and smarter increases as their stake in the firm rises.
The regressions of proxies for performance on equity-based CEO compensa- tion together with ownership are presented in column (3). Both are significant
6As in McConnell and Servaes (1990), I regressed Q and ROA on the square of CEOs’ ownership together with CEOs’ ownership to test for nonlinearity. The coefficient of the square term, however, was not significant.

176 H. MehranJJoumal of Financial Economics 38 (1995) 163-184
and together they explain much larger cross-sectional variations in Q and ROA. Finally, additional explanatory variables are introduced to test the sensitivity of previous findings to their inclusion. The results are reported in column (4). The coefficients of equity-based compensation and equity ownership remain positive and significant in both panels.
Table 4 Regression of firm performance on CEO compensation
Panel A: Ordinary least-squares estimates of Tobin’s Q on percentage of CEOs’ equity-based compensation, percentage of shares and stock options outstanding held by CEOs, percentage of shares held by all outside blockholders, percentage of outside directors, and proxies for growth opportunities, assets in place, debt ratio, business risk, and size. Sample is 153 randomly-selected manufacturing firms in 1979-1980. Standard deviation of the percentage change in operating income is measured over 1973-1983. Other variables are averages for the year 1979 and 1980 (r-statistics in parentheses).
Dependent variable: Tobin’s Q
Independent variables (1) t-9 (3) (4)
Intercept
% of CEOs’ equity-based compensation
% of shares and stock options outstanding held by CEOs
% of shares held by all outside blockholders
% of outside directors
0.752 0.866 (11.228)*** (11.634)***
2.486 (4.85)***
2.035 (2.160)**
0.698 (8.809)*** 0.521 (4.391)*** 2.263
(2.571)**
R&D/sales
(Inventory + gross plant and equipment)/total assets
Long-term debt/total assets
Standard deviation of the percentage change in operating income
Log of total assets
Adjusted R*(%) 13.0 2.9
F-statistics 23.568 4.664
15.5.
12.320
1.393 (2.684)*** 0.361
(3.500)***
1.876 (2.323)**
0.261 (0.469) 0.075
(0.513) 14.279 (5.938)***
- 0.351 ( - 1.472)
- 0.054 ( - 0.995)
- 0.113 ( - 1.965)
- 0.107 ( - 2.144)**
43.2
11.381
H. MehranjJournal of Financial Economics 38 (1995) 163-184 117
Table 4 (continued)
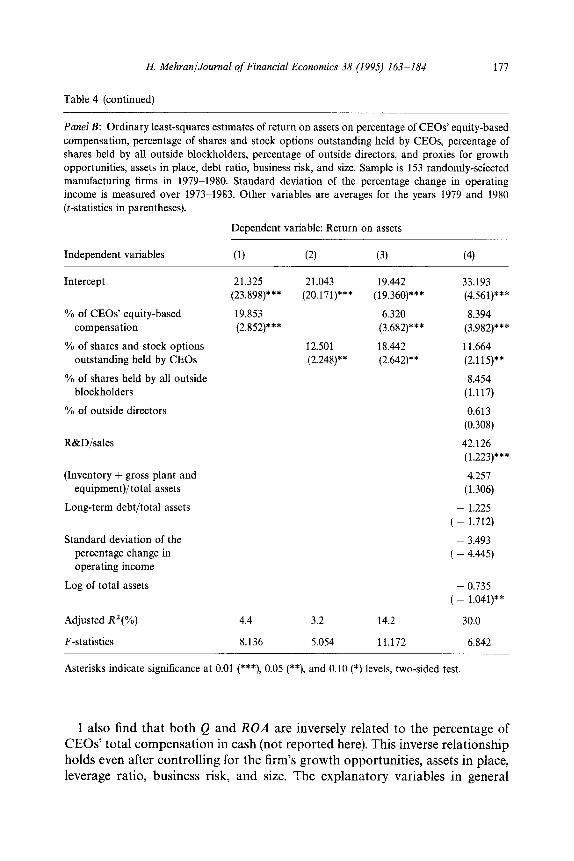
Panel B: Ordinary least-squares estimates of return on assets on percentage of CEOs’ equity-based compensation, percentage of shares and stock options outstanding held by CEOs, percentage of shares held by all outside blockholders, percentage of outside directors, and proxies for growth opportunities, assets in place, debt ratio, business risk, and size. Sample is 1.53 randomly-selected manufacturing firms in 197991980. Standard deviation of the percentage change in operating income is measured over 1973-1983. Other variables are averages for the years 1979 and 1980 (t-statistics in parentheses).
Dependent variable: Return on assets
Independent variables (1) (2) (3) (4)
Intercept 21.325 21.043 19.442 33.193 (23.898)*** (20.171)*** (19.360)*** (4.561)***
% of CEOs’ equity-based 19.853 6.320 8.394 compensation (2.852)*** (3.682)*** (3.982)***
% of shares and stock options 12.501 18.442 11.664 outstanding held by CEOs (2.248)** (2.642)** (2.115)**
% of shares held by all outside 8.454 blockholders (1.117)
% of outside directors 0.613 (0.308)
R&D/sales 42.126 (1.223)***
(Inventory + gross plant and 4.257 equipment)/total assets (1.306)
Long-term debt/total assets - 1.225 ( - 1.712)
Standard deviation of the - 3.493 percentage change in ( - 4.445) operating income
Log of total assets - 0.735 ( - 1.041)**
Adjusted RI(%) 4.4 3.2 14.2 30.0
F-statistics 8.136 5.054 11.172 6.842
Asterisks indicate significance at 0.01 (***), 0.05 (**), and 0.10 (*) levels, two-sided test.
I also find that both Q and ROA are inversely related to the percentage of CEO? total compensation in cash (not reported here). This inverse relationship holds even after controlling for the firm’s growth opportunities, assets in place, leverage ratio, business risk, and size. The explanatory variables in general
178 H. Mehran/Journal of Financial Economics 38 (1995) 163-184
explain more of the variation in the firm’s performance when the latter is measured by Q. The F-statistics of the regression equations are all significant at 1% critical values or better.
4.2.3. Other results Regressions similar to those in Table 4 were run separately for top executives
and all officers and directors. Firm performance is positively related to both groups’ percentage of equity-based compensation and negatively related to their total compensation in cash. In addition, performance is positively related to the percentage of equity held by top executives. The relationship between the equity holdings of all officers and directors and the firm’s performance, however, is not statistically significant.
Regressions were run on managers’ voting power, but this did not alter the results. Regressions were also run on other measures for outside blockholders. These measures are the percentage of shares held by the largest individual investor, the largest institutional investor, and the largest corporation, and the percentage of shares held by the three largest individual, institutional, and corporate investors. The identity of major shareholders may be relevant if motivations of outside blockholders differ (Holderness and Sheehan, 1988, p. 323). I constructed two proxies for each investor group, since the largest investor may not be the one that monitors the firm. The previous results did not change with these measures of outside blockholders.
In addition, I tried variables other than the percentage of outside directors in Eq. (2). One variable I used is the percentage of equity held by outside directors. The justification for using this variable is that the directors who have an incentive to monitor management and take strong positions on the board may be those with large ownership positions (Baum and Byrne, 1986). Merck, Shleifer, and Vishny (1988) bolster this argument by documenting a nonlinear relationship between Tobin’s Q and the percentage of equity held by outside directors. Similar to Merck, Shleifer, and Vishny (1988), I introduce a number of zero-one dummy variables for different levels of outside directors’ ownership to test for the presence of nonlinearity. Overall, I find a positive relationship between Tobin’s Q and the percentage of equity held by outside directors and I do not find evidence of nonlinearity.
Other measures tried instead of the percentage of outside directors are the percentage of inside board members, board size, and the number of top man- agers employed by the firm. The justification for these variables is that subordi- nate managers may have an incentive to monitor their superiors, particularly when there is competition for promotion (e.g., Fama, 1980). It has also been argued that a larger internal managerial labor market gives rise to more intense monitoring (e.g., Comment, 1985). By constraining top managers’ freedom to act, this monitoring increases organizational efficiency. None of these variables show any significant influence.

H. MehranjJoumal of Financial Economics 38 (i995) 163-184 179
I also tried other proxies for growth opportunities, assets in place, business risk, and size. For example, I used capital expenditures as a percentage of total assets for growth opportunities. In place of inventory plus gross plant and equipment to total assets, I used the ratio of intangible assets to total assets. Rather than using the log of the book value of assets, I used the log of sales. In place of the standard deviation of the percentage change in operating income, I used the standard deviation of the return on investment over 1973-1983, and the 60-month return variance (using the Center for Research in Security Prices monthly returns tape) over 1973-1978. These proxies did not change the general character of my results. Finally, I estimated coefficients of the regression equa- tions by calculating heteroskedastically consistent standard errors (White, 1980). The test was not significant, indicating that the model is not subject to heteroskedasticity.
5. Summary and conclusions
One way to mitigate the conflict of interest between managers and share- holders in the corporate form of organization might be through compensation contracts. For many years organization theorists have recognized the import- ance of compensation in motivating top managers (e.g., Finkelstein and Hambrick, 1988). There has been little research, however, on how managers should be rewarded and on the relationship between the structure of executive compensation and firm performance. Likewise, little empirical evidence exists on the influence of various corporate claimants in designing executive compen- sation.
This paper provides empirical evidence on the determinants of executive compensation structure and the relationship between executive compensation structure and firm performance. I find a negative relationship between the percentage of executives’ equity-based compensation and their percentage equity holdings, indicating that the board considers executives’ total incentives in designing pay packages. In addition, I find that firms with more outsiders on the board make greater use of equity-based compensation. Equity-based com- pensation, however, is unrelated to outside directors’ industry representation. A possible interpretation is that compensation structure is determined collec- tively, with no single industry group of outside directors exerting a dominant influence. Moreover, I find that firms with a larger percentage of their shares held by outside blockholders use less equity-based compensation, suggesting that monitoring by outside blockholders may be a substitute for incentive pay for executives.
The results on firm performance indicate that both Tobin’s Q and return on assets are positively related to both the percentage of executives’ total compen- sation that is equity-based and the percentage of shares held by top managers.

180 H. Mehran/Journal of Financial Economics 38 (1995) 163-184
Thus compensation does affect CEO incentives in ways that have a measurable impact on corporate efficiency. The evidence presented in this paper supports advocates of incentive compensation.
In a finding consistent with Hermalin and Weisbach (1991), I observe no relationship between firm performance and board composition. This lack of correlation has been interpreted by previous researchers as implying that boards are forsaking their obligations to shareholders (e.g., Wade, O’Reilly, and Chandratat, 1990). Directors, however, can design more efficient compensation packages that include equity-based compensation. Contracts that link execu- tives’ compensation to the outcome of their actions reduce the effort and expertise required of directors for effective oversight.
I also find no significant relationship between firm performance and outside directors’ equity holdings. This result contrasts with the finding of Merck, Shleifer, and Vishny (1988). Their sample is limited to large firms, which could explain the difference in results, since it has been documented that the percent- age of outside directors increases with firm size. In addition, outside directors’ equity ownership in general is not significant enough to give them an incentive to monitor the firm. Those directors who do have a large stake in the firm are most often blockholders who gained a seat (or seats) on the board through proxy contests. Also, a vast majority of outside directors are paid a fixed fee for their services. A study of 532 manufacturing firms shows that less than 9% have stock option plans for their outside directors (WaEI Street Jotmud, March 17, 1987, p. l), and the percentage of the outside directors’ compensation for those firms that report the presence of such plans is not significant (Crystal, 1991). Thus outside directors rarely become owners of a significant percentage of the firm’s equity by exercising their options. Unless a substantial component of outside directors’ compensation is tied to the firm’s performance (e.g., through stock options), their capital risk may not be large enough to motivate them to monitor the management team.
In addition, I find no support for a relationship between firm performance and blockholders’ stockholdings (consistent with McConnell and Servaes, 1990). Similarly, I find no support for a relationship between firm performance and the percentage of shares held by different groups of outside blockholders, i.e., individual investors, institutional investors, and corporations. One explanation for the lack of correlation between performance and the percentage of shares held by institutional investors could be that this study does not distinguish between institutions which buy and sell securities for short-term profit and those which hold shares for a long period - e.g., the College Retirement Equities Fund (CREF). It has been suggested that institutions with a longer holding period have more incentive to monitor managers (Nussbaum and Dobrzynski, 1987). Another possibility is that some of the institutional investors may not monitor the management team because they transact business with the firm (e.g., Brickley, Lease, and Smith, 1988). In addition, financial institutions face

H. MehranjJoumal of Financial Economics 38 (1995) 163-184 181
substantial legal barriers in their efforts to hold large blocks of stock in public corporations, thus limiting their ability to control managers (e.g., Roe, 1990). Finally, Barclay and Holderness (1991) have shown that the effect of large blockholders on firm value also depends on the specific skills the blockholders bring to the firm.
An important area for future research is which forms of equity-based compen- sation matter. We also need to understand why board composition is unrelated to firm performance, and what relationship there is, if any, between performance and the form in which outside directors are compensated.
Appendix: Measurement of executive compensation
As in Larcker and Balkcom (1984), Antle and Smith (1986), and Ely (1991), this paper attempts to measure total compensation. The estimates of executives’ annual compensation in this study exclude pension plans because of difficulties in estimating their value. The valuation procedures for each element of compen- sation are discussed in turn.
Salary and bonus consist of dollar amounts for regular salary and bonuses earned annually during the 1979-1980 period. The annual bonus is adjusted if the bonus for one year was paid in the subsequent fiscal year. For example, in a number of cases bonuses for 1980 were reported in 1981 proxy statements. These bonuses are added to those in 1980.
Dividend units are valued as the number of units held by an executive multiplied by the present value (at the risk-free rate) of the dividend stream over the life of the dividend unit, assuming that the dividends per share declared and paid in the 1979-1980 period will continue over the life of the dividend unit.
Stock options are measured by the value of options granted during the sample period. The new grants can be calculated by applying a variation of Black-Scholes suggested by Noreen and Wolfson (1981), allowing for continu- ous dividend payments (see below). Stock appreciation rights (SARs) are typi- cally granted along with stock options (i.e., either the option or the SAR could be exercised). Since the option and the SAR should have similar values, SARs granted in tandem with options are assumed to provide zero additional remun- eration to the executive.
Restricted stocks are valued as the number of restricted shares granted times the stock price at the grant date. Phantom stocks are valued the same way as restricted stock plans. Performance shares are valued as the number of shares times the stock price at the grant date. Performance units are valued as the number of units times the dollar value assigned to each unit in the year granted.

182 H. Mehran/Journal of Financial Economics 38 (1995) 163-184
Valuation of stock options
The value of each executive stock option granted is calculated using the following formula:
C = S e-“‘4(Z) -XemrTc)(Z - afi),
where
C = price of option, S = common stock price on the date of the grant (data source: proxy state-
ment), X = exercise price (data source: proxy statement), 4(,) = cumulative standard normal distribution function, 7’ = time to expiration (data source: proxy statement), Y = continuous risk-free interest rate, measured as ln(1 + R)/12, where R is
the annual five-year and ten-year average market yield on U.S. Govern- ment securities (data source: Federal Reserve Bulletin).
d = continuous dividend yield defined as ln[ 1 + (dividend per share /closing stock price)]/12 (data sources: COMPUSTAT and the Center for Research in Security Prices),
(T = estimated monthly stock return variance for the sixty-month period preceding the first day of the current fiscal year (data source: Center for Research in Security Prices monthly returns tape),
z = [ln(S/X) + (r - d + 02/2)] (T/crfi ).
References
Amihud, Yakov and Baruch Lev, 1981, Risk reduction as a managerial motive for conglomerate mergers, Bell Journal of Economics 12, 605-617.
Antle, Rick and Abbie Smith, 1986, Measuring executive compensation: Methods and an applica- tion, Journal of Accounting Research 23, 2699325.
Barclay, Michael J. and Clifford G. Holderness, 1991, Negotiated-block traders and corporate control, Journal of Finance 46, 861-878.
Baum, Laurie and John A. Byrne, 1986, The job nobody wants, Business Week, September 8,5661. Bennett, Amanda, 1987, Executives see stock options drop in value, Wall Street Journal, October 21,
39. Benston, George J., 1985, The validity of profits-structure studies with particular reference to the
FTCs Line of Business Data, American Economic Review 75, 37-67. Brickley, James A. and Frederick H. Dark, 1987, The choice of organizational form: The case of
franchising, Journal of Financial Economics 18, 401420. Brickley, James A. and Christopher James, 1987, The takeover market, corporate board composi-
tion, and ownership structure: The case of banking, Journal of Law and Economics 30,161-180. Brickley, James A. and Leonard D. van Drunen, 1987, Residual claims, decision rights and board
structure, Working paper (William E. Simon Graduate School of Business Administration, University of Rochester, Rochester, NY).
H. MehranjJournal of Financial Economics 38 (1995) 163-184 183
Brickley, James A., Ronald C. Lease, and Clifford W. Smith, 1988, Ownership structure and voting on antitakeover amendments, Journal of Financial Economics 20, 267-292.
Clinch, Greg, 1991, Employee compensation and firms’ research and development activity, Journal of Accounting Research 29, 59-78.
Comment, Robert, 1985, The effects of firm-specific human capital on management equity invest- ment and turnover, Unpublished doctoral dissertation (University of Michigan, Ann Arbor, MI).
Crystal, Graef, 1991, Do directors earn their keep?, Fortune, May 6, 78-80. Cummins, Clint, Bronwyn H. Hall, Elizabeth S. Laderman, and Joy Mody, 1985, The R&D master
file: Documentation, NBER paper. Defeo, Victor J., Richard A. Lambert, and David F. Larcker, 1989, The executive compensation
effects of equity-for-debt swaps, Accounting Review 64,201-227. Demsetz, Harlod and Kenneth Lehn, 1985, The structure of corporate ownership: Causes and
consequences, Journal of Political Economy 93, 1155-l 177. Eaton, Jonathan and Harvey Rosen, 1983, Agency delayed compensation, and the structure of
executive remuneration, Journal of Finance 5, 1489-1505. Ely, Kirsten M., 1991, Interindustry differences in the relation between compensation and firm
performance variables, Journal of Accounting Research 29, 37-58. Fama, Eugene F., 1980, Agency problems and the theory of the firm, Journal of Political Economy
88, 288-325. Fama, Eugene F. and Michael C. Jensen, 1983, Separation of ownership and control, Journal of Law
and Economics 26, 301-325. Finkelstein, Sydney and Donald C. Hambrick, 1988, Chief executive compensation: A synthesis and
reconsideration, Strategic Management Journal 9, 543-558. Fisher, Franklin M. and John J. McGowan, 1983, On the misuse of accounting rates of return to
infer monopoly profits, American Economic Review 73, 82-97. Grossman, Sanford J. and Oliver D. Hart, 1983, An analysis of the principal agent problem,
Econometrica 51, 7745. Harris, Milton and Arthur Raviv, 1979, Optimal incentive contracts with imperfect information,
Journal of Economic Theory 20, 231-259. Hart, Oliver D., 1983, The market mechanism as an incentive scheme, Bell Journal of Economics 14,
366-382. Hermalin, Benjamin E. and Michael S. Weisbach, 1991, The effects of board composition and direct
incentives on firm performance, Financial Management 20, lOlI112. Hirshleifer, David and Yoon Suh, 1992, Risk, managerial effort and project choice, Journal of
Financial Intermediation, forthcoming. Holderness, Clifford G. and Dennis P. Sheehan, 1988, The role of majority shareholders in publicly
held corporations: An exploratory analysis, Journal of Financial Economics 20, 317-346. Holmstrom, Bengt, 1979, Moral hazard and observability, Bell Journal of Economics 10, Spring, 7491. Jacobson, Robert, 1987, The validity of ROI as a measure of business performance, American
Economic Review 77,470-478. Jensen, Michael C. and William H. Meckling, 1976, Theory of the firm: Managerial behavior, agency
costs and ownership structure, Journal of Financial Economics 3, 3055360. Jensen, Michael C. and Kevin J. Murphy, 1990a, CEO incentives - It’s not how much you pay, but
how, Journal of Applied Corporate Finance, 3649. Jensen, Michael C. and Kevin J. Murphy, 1990b, Performance pay and top-management incentives,
Journal of Political Economy 98, 225-264. Jensen, Michael C. and Richard S. Ruback, 1983, The market for corporate control, Journal of
Financial Economics 11, 5-50. Landsman, Wayne R. and Alan C. Shapiro, 1989, Tobin’s 4 and the relationship between accounting
ROI and economic return, Accounting working paper no. 89-3 (Anderson Graduate School of Management, University of California at Los Angeles, Los Angeles, CA).
184 H. Mehran/Journal of Financial Economics 38 (1995) 163-184
Larcker, David F. and John E. Balkcom, 1984, Executive compensation contracts and investment behavior: An analysis of mergers, Working paper (Northwestern University, Evanston, IL).
Lewellen, Wilbur, Claudio Loderer, and Kenneth Martin, 1987, Executive compensation and executive incentive problem, Journal of Accounting and Economics 9, 287-310.
McConnell, John J. and Henri Servaes, 1990, Additional evidence on equity ownership and corporate value, Journal of Financial Economics 27, 595-612.
Merck, Randall, Andrei Shleifer, and Robert W. Vishny, 1988, Management ownership and corporate performance: An empirical analysis, Journal of Financial Economics 20, 293-316.
Murphy, Kevin J., 1985, Corporate performance and managerial remuneration: An empirical analysis, Journal of Accounting and Economics 7, 1142.
Noreen, Eric and Mark Wolfson, 1981, Equilibrium warrant pricing models and accounting for executive stock options, Journal of Accounting Research 19, 384-398.
Nussbaum, Bruce and Judith H. Dobrzynski, 1987, The battle for corporate control, Business Week, May 18, 102-109.
Paul, Jonathan M., 1992, On the efficiency of stock-based compensation, Review of Financial Studies 5, 471-502.
Roe, Mark J., 1990, Political and legal restraints on ownership and control of public companies, Journal of Financial Economics 27, 7742.
Rosenstein, Stuart and Jeffrey G. Wyatt, 1990, Outside directors, board independence, and share- holder wealth, Journal of Financial Economics 26, 175-191.
Shleifer, Andrei and Robert W. Vishny, 1986, Large shareholders and corporate control, Journal of Political Economy 95, 461-488.
Sloan, Richard G., 1993, Accounting earnings and top executive compensation, Journal of Ac- counting and Economics 16, 55-100.
Smith, Clifford W. and Ross L. Watts, 1992, The investment opportunity set and corporate financing, dividend, and compensation policies, Journal of Financial Economics 32, 263-292.
Vancil, Richard F., 1987, Passing the baton: Managing the process of CEO succession (Harvard Business School Press, Boston, MA).
Wade, James, Charles A. O’Reilly, and Ike Chandratat, 1990, Golden parachutes: CEOs and the exercise of social influence, Administrative Science Quarterly 35, 587-603.
Weisbach, Michael S., 1988, Outside directors and CEO turnover, Journal of Financial Economics 20,43 1460.
White, Halbert, 1980, A heteroskedasticity-consistent covariance matrix estimator and a direct test for heteroskedasticity, Econometrica 48, 817-838.
White, Joseph B., 1990, GM’s plan to boost executives’ pensions draw fire; one big holder is to say ‘no’, Wall Street Journal, May 14, A3.