executive commissioner resource planning and development …tapvision.info/sites/default/files/495...
TRANSCRIPT
Executive Commissioner Resource Planning and Development Commission GPO Box 1691 Hobart, Tas, 7000 September 25, 2006 Re: Submission to the RPDC on the draft IIS by Gunns Ltd. to develop and operate a
bleached kraft pulp mill in the Tamar Valley
Dear Commissioner On behalf of the Launceston Environment Centre (LEC) I present our formal submission to the RPDC on the proposal by Gunns Ltd. to develop and operate a bleached kraft pulp mill in the Tamar Valley. The LEC is a not-for-profit community organisation that has been serving northern Tasmania since 1974. Our submission has been collated from the contributions of a team of volunteer consultants, including Doug Brown, Anna Povey, James Ingles, Paul Sandery and Melissa Nursey-Bray. We are extremely grateful for their assistance. The LEC submission is divided into 7 sections commenting on the following areas of the draft IIS:
1. Project methodology and the proposed environmental management systems (RPDC Guidelines 7.1.4);
2. Marine impacts (RPDC Guidelines 7.8.1 and 1.2.4); 3. Flora impacts (RPDC Guidelines 6.2 (18), 6.2 (22), 7.8.7 (6), 7.9.5 (5), 7.10.8 (1)); 4. Air pollution issues (RPDC Guidelines 7.8.2, 7.13 and 1.2.4); 5. Economic issues (RPDC Guidelines 2.1, 2.2, 8 to 8.7) 6. Impacts from log trucks on road infrastructure (RPDC Guidelines 7.9.6) and 7. Pulpwood supply - hardwood and softwood (RPDC Guidelines 4.2 – 4.2.1 (1)-(14))
The LEC recommendations to the RPDC are made during each section of the submission. The LEC would also like to request consultation during the public hearing stage of the process. We have posted a hard copy of the LEC submission to the RPDC. If you have any queries regarding our submission do not hesitate to contact me on (03) 6331 8406. Yours faithfully Rob Palmer (LEC Coordinator)
Launceston Environment Centre 34 Cameron Street Launceston Tasmania 7250
T: (03) 6331 8406 F: (03) 6331 8418 E:[email protected] www.lec.org.au

2
Submission to the RPDC on the Draft
IIS by Gunns Ltd. to Develop and
Operate a Bleached Kraft Pulp Mill in
the Tamar Valley
By
The Launceston Environment Centre
September 25, 2006
3
Section 1
EIA Methodology Issues and Environmental Management Systems
1.1 Introduction
The LEC has chosen to approach this review of the RPDC guideline 7.1.4 by examining the process used by the proponents, and in consideration of their statements that they will be conducting the building of, and subsequent operation of the pulp mill in accordance with world’s best standards. The following quotes are from the Executive Summary of the draft IIS:
“Gunns Limited (Gunns) proposes to develop a bleached Kraft pulp mill and associated infrastructure at accost of $1.4 billion. The mill will be an elemental chlorine free, and will incorporate the best available technology, and set new world standards for mill design.”
“The Gunns mill will establish new benchmarks”
“The pulp mill has been designed to meet environmental and technological best practices as outlined in the Tasmanian government’s “Environmental Emission Guidelines for any new Bleached Eucalypt Kraft Pulp Mill in Tasmania”
“Gunns intends to spend $20 million a year over thirty years so evolving technology can be incorporated”.
1.2. General Comments
Discussion in Section 1 is divided into three areas: (a) the impact methodology used within the IIS to determine impact; (b) the weighting or ranking systems used to determine impact; (c) consideration of the ways that ISO standards are used; (d) consideration of how the interactions between the biophysical, socio-economic and cultural effects of the project have been discussed; and (e) consideration of the commitments made to implement the EMS proposed by the proponents in the draft IIS.
1.3. Methodology for Predicting Impact in EIA.
This section considers the methodology for assessing the impact of the development that the IIS is based on, and then offers some detail on existing methodologies that could be applied to enable better insight into the impacts of the development than is currently derived. For example, there are a number of explicit methodologies available for use. These are the (i) check list approach, (ii) matrix approach, (iii) systematic sequential method, (iv) networks, (v) impact hypotheses method, (vi) workshop simulations, (vii) GIS, (viii) overlay approach, and (ix) rapid assessment amongst others. All of these approaches differentiate and delineate impact.
In relation to this subject, the RPDC guidelines 7.1.4. expressly outline that where relevant that the choice of particular risk assessments over other methodologies should be explained. It is hard to find within the IIS document the justification for the method chosen. It is important to use a credible and justifiable methodology in order to be able to effectively gauge all estimated direct, indirect, immediate, and cumulative effects. A rigorous methodology would also enable a
4
company to avoid claims of subjectivity and bias. Within the IIS, the EIA methodology is neither specifically defined nor justified with literature. There are a number of drawbacks to this approach. Firstly, the relationship between impacts is not clear. This includes the relationship between different environmental impacts, but also the relationship between environmental, social and economic impacts, which cumulatively could have a greater impact than separately.
As shown below, the criteria used to evaluate the impacts are not always compatible, as they are not ranked or defined and are imprecise in their calculation of impact. As a result, the number of categories to be reviewed is immense thus distracting from the most significant impacts, and preventing an adequate distilling and appreciation of (a) the real impact and (b) the most appropriate mitigation strategy. Finally, this means that rather than being an example of world’s best practice, the identification of effects becomes qualitative and subjective (Westman 1985).
In summary, the current approach taken within the IIS would not stand up to scrutiny according to established methodologies for EIA worldwide. There are two areas that need further analysis in relation to the methodology chosen (i) the EIA method chosen for the entire IIS, and (ii) the impact and ranking methodology.
1.4. EIA Methodologies
1.4.1. Overall Methodology in the IIS
When evaluating the efficacy of other EIA methodologies, it is clear that there are many factors which could be incorporated into the current IIS that would have added depth. These other approaches all adopt a specific methodology to help inform their process, and adopt specific and justified methods for ascertaining impact (IIED 1995, Canter 1996). This section outlines some of these. These approaches could have been used, either independently or in combination to develop depth and authentic appreciation of the cost/benefit ratio and assessment of environmental effects and impacts of such a development.
1.4.2. Checklist Approach
There are four general types of checklists: 1. Simple Checklist: a list of environmental parameters with no guidelines on how they are to be measured and interpreted. 2. Descriptive Checklist: includes an identification of environmental parameters and guidelines on how to measure data on particular parameters. 3. Scaling Checklist: similar to a descriptive checklist, but with additional information on subjective scaling of the parameters. 4. Scaling Weighting Checklist: similar to a scaling checklist, with additional information for the subjective evaluation of each parameter with respect to all the other parameters. There are several major reasons for using checklists (i) they are useful in summarizing information to make it accessible to specialists from other fields, or to decision makers who may have a limited amount of technical knowledge;(ii) scaling checklists provide a preliminary level of analysis; and (iii) weighting is a mechanism for incorporating information about ecosystem functions.
5
However, as Lohani and Kan (1983) point out in relation to the ad hoc approach there are a number of disadvantages to this approach including (i) it may not encompass all the relevant impacts; (ii) the criteria used to evaluate impacts are not comparable, the relative weights of various impacts cannot be compared; (iii) it is inherently inefficient as it requires sizeable effort to identify and assemble an appropriate panel of experts for each assessment; and (iv) it provides minimal guidance for impact analysis while suggesting broad areas of possible impacts. A checklist approach, where lists of impacts, and management processes are literally listed can be useful in (i) summarizing information to make it accessible to specialists from other fields, or to decision makers who may have a limited amount of technical knowledge; (ii) scaling checklists provide a preliminary level of analysis; and (iii) weighting is a mechanism for incorporating information about ecosystem functions. However, Westman (1985) also lists many problems with using checklists when used as an impact assessment method all of which apply to the proponents draft IIS on the construction of a pulp mill in the Tamar Valley: 1. they are too general or incomplete; 2. they do not illustrate interactions between effects; 3. the number of categories to be reviewed can be immense, thus distracting from the most significant impacts; and 4. the identification of effects is qualitative and subjective.
1.4.3. Matrices
Matrix methods identify interactions between various project actions and environmental parameters and components. They incorporate a list of project activities with a checklist of environmental components that might be affected by these activities. A matrix of potential interactions is produced by combining these two lists (placing one on the vertical axis and the other on the horizontal axis). One of the earliest matrix methods was developed by Leopold et al. (1971). In a Leopold matrix and its variants, the columns of the matrix correspond to project actions (for example, flow alteration) while the rows represent environmental conditions (for example, water The impact associated with the action columns and the environmental condition row is described in terms of its magnitude and significance. Most matrices were built for specific applications, although the Leopold Matrix itself is quite general. Matrices can be tailor-made to suit the needs of any project that is to be evaluated. They should preferably cover both the construction and the operation phases of the project, because sometimes, the former causes greater impacts than the latter. Simple matrices are useful because: 1) they are done early in the EIA processes allowing for a scoping of the assessment; 2) identify areas that require further research; and 3) for identifying interactions between project activities and specific environmental components. However, matrices also have their disadvantages: they tend to overly simplify impact pathways, they do not explicitly represent spatial or temporal considerations, and they do not adequately address synergistic impacts. Matrices require information about both the environmental components and project activities. The cells of the matrix are filled in using subjective (expert) judgement, or by using extensive data bases. There are two general types of matrices: (i) simple interaction matrices; and (ii) significance or importance-rated matrices. Simple matrix methods simply identify the potential

6
for interaction. Significance or importance-rated methods require either more extensive data bases or more experience to prepare. Values assigned to each cell in the matrix are based on scores or assigned ratings, not on measurement and experimentation. For example, the significance or importance of impact may be categorized (no impact, insignificant impact, significant impact, or uncertain). Alternatively, it may be assigned a numerical score (for example, 0 is no impact, 10 is maximum impact).
Table 1: Simple Environmental Impact Matrix for the Phoenix Pulp Mill, source Lohani
and Halim 1983)
1.4.4. Leopold Matrix
Leopold et al. (1971) designed a matrix with a hundred specified actions and 88 environmental components Each action and its potential for impacting each environmental item is considered. The magnitude of the interaction (extensiveness or scale) is described by assigning a value ranging from 1 (for small magnitudes) to 10 (for large magnitudes). The assignment of numerical values is based on an evaluation of available facts and data. Similarly, the scale of importance also ranges from 1 (very low interaction) to 10 (very important interaction). Assignment of numerical values for importance is based on the subjective judgement of the interdisciplinary team working on the EIA study. The matrix approach is reasonably flexible. The total number of specified actions and environmental items may increase or decrease depending on the nature and scope of the study and the specific TOR for which the environmental impact study is undertaken. This is one of the attractive features of the Leopold Matrix. Technically, the Leopold Matrix approach is a gross screening technique to identify impacts. It is a valuable tool for explaining impacts by presenting a visual display of the impacted items and their causes. Summing the rows and columns that are designated as having interactions can provide deeper insight and aid further interpretation of the impacts. The matrix can also be employed to identify impacts during the various parts of the entire project cycle — construction, operation, and even dismantling phases. Matrices force EIA practitioners to think systematically about the interactions between project activities and environmental components.

7
1.4.5. The Systematic Sequential Approach
Prepared formats such as checklists, matrices and sector guidelines are most useful during the initial stages of EIA. Along with other information, checklists and matrices can help with the identification of issues and impacts, as well as helping to develop the TOR for further studies. Care must be taken with prepared formats as they may contain information that is out of date or inappropriate for the jurisdiction or the environmental setting. In these cases, use of the checklist or matrix may result in EIA documents that may be misleading, incomplete or place the emphasis on the wrong causal relationships. Once the initial assessment is completed, more systematic and scientific approaches should be used to conduct the detailed EIA. The systematic sequential approach (SSA) of assessment is a “scientific thinking through” of the potential impacts on the environment with and without the project. SSA aims to understand how environmental, social, and economic systems are interrelated, and how they will react to human disturbances. SSA views EIA as a continuing source of information throughout the project cycle. During the planning stages, broad economic goals and objectives are seen to give rise to planned projects (Figure 3-2). In the SSA approach, project activities are linked to changes in the environment. During the EIA, predictions of these environmental changes must be made using various methods and techniques. Not all predicted environmental changes are considered to be potential impacts. Levels of significance of environmental change must be decided upon, then assigned to impacts. The assessment of significance is usually based on the values ascribed to environmental components, as well as the degree of change. Once the assessment of potential impacts has been completed, mitigative measures are prescribed to prevent, reduce, or otherwise ameliorate the potential impacts. These measures will often alter the project design. They may lead to project relocation, changes in industrial processes, introduction of pollution abatement technology, and other measures. As the project moves toward implementation, an environmental management plan must be put in place to ensure that planned mitigative measures will be implemented. This plan also specifies monitoring that must take place to determine actual impacts and to evaluate the effectiveness of mitigation measures. Once the project begins operation, the project activities lead to actual changes in the environment and actual impacts. Monitoring systems designed during the EIA provide the basic information that allows for detection of changes in the environment. Based on monitoring information and on the evaluation of the actual impacts and the effectiveness of mitigation measures, the project implementation activities may be altered. In the long term, monitoring result may lead to revised economic development goals and objectives.
1.4.6. Networks Development of the conceptual models that represent potential impact pathways as causal chains is at the essence of the application of the SSA. As illustrated by the examples presented in the previous section, network diagrams are one of the best ways of representing these causal chains. Network diagrams provide a means for displaying first, secondary, tertiary, and higher order impacts. To develop a network, a series of questions related to each project activity (such as what are the primary impact areas, the primary impacts within these areas, the secondary impact areas, the secondary impacts within these areas, and so on) must be answered. In developing a network diagram, the first step is to identify the first order changes in environmental components. The secondary changes in other environmental components that will result from the first order changes are then identified. In turn, third order charges resulting from secondary changes are identified. This process is continued until the network diagram is completed to the practitioner’s satisfaction.

8
The network helps in exploring and understanding the underlying relationships between environmental components that produce higher order changes that are often overlooked by simpler approaches. Networks or systems diagrams overcome the limitations of matrices by accommodating higher order impacts. They are also far better at explicitly identifying the causal basis for impacts. In addition, they are well suited to identifying the interaction between a number of activities, components, and a single target resource. As an assessment tool, they are capable of making qualitative predictions of the cumulative impact of a number of activities on a single target resource. However, they neither formally integrate over the spatial and temporal dimensions, nor do they integrate across target resources. While networks and systems diagrams can be communicated well and are easy to develop using expert judgement, scientific documentation of complex systems diagrams require a considerable amount of human and financial resources.
Table 2: Network of pulp mill impacts: Lohani and Halim 1983)
Impact Hypotheses
Network diagrams have been used by ecological modellers as a means of representing the conceptual structure of models. In the context of EIA, one group of modellers used a sophisticated network or system diagram to represent impact hypotheses (Everitt et al., 1986). Impact hypotheses are explicit statements that causally relate project activities to environmental components. This approach was combined with a descriptive matrix for an IEE of the environmental and socioeconomic impact of a proposed pulp and paper mill and eucalyptus plantation development in Thailand (H.A. Simon Ltd. Consulting Engineers, 1992). The purpose of the IEE was to identify all of the potential environmental and socio-economic effects of the proposed project, prescribe mitigation measures not included in the project description, and determine the level of further assessment required. The IEE of the proposed project proceeded with the following major steps: 1. Review of the project description, which consists of the activities that will occur inside and outside the mill in the manufacture of pulp and paper, and review of the development and operation of the eucalyptus plantations that will supply the mill with wood.
9
2. Review of information on the environmental and socioeconomic setting of the project area, which included review of the current issues surrounding the project. 3. A visit to the proposed mill and plantation sites to gather information on the project and proposed site from local residents and the proponent. 4. Information synthesis and screening of the potential environmental and socioeconomic effects of the project. 5. Development of the TOR for an EIA of the project. The IEE focused on the project description and the environmental and socioeconomic setting of the affected area. The following major parts of the proposed project were assessed for potential effects: 1) the construction phase of the mill site; 2) the proposed facilities and methodology for the disposal of mill effluent, including air emissions; and 3) the development and operation of the eucalyptus plantations. The environmental and social components which were assessed are those prescribed by the Office of the National Environmental Board (ONEB) of Thailand for environmental assessment. The parameters of the ONEB are aggregated into the following major categories: Physical Resources; Ecological Resources; Human Uses; and Quality of Life. The constituent activities of the three major components of the project were systematically assessed using expert judgement for their potential impact on each parameter of the ONEB. Each potential impact was rated as either “no impact,” “insignificant impact,” “significant impact,” “mitigated impact,” or “unknown impact.” The rating assigned to the categories was determined by the relationship between the activity and the parameter, the existence of mitigation measures in the project description, and by the completeness of available information on the activity and parameter. A cross-impact matrix was used to summarize the information. All IEEs conducted using this method reveal some potential project impacts that would not be significant, and other impacts that would be very significant. The latter impacts require closer scrutiny. To facilitate this, impact hypotheses are constructed for each major potential impact. Impact hypotheses were constructed for those potential major impacts of the project categorized as “significant,” “mitigated,” or “unknown”. For each impact hypothesis, the following information is presented: 1. a detailed description providing a statement for each linkage in the impact hypothesis; 2. Documentation of evidence for and against the statements in the hypothesis; 3. Listing of potential or proposed mitigation measures; and 4. Listing of further studies and monitoring requirements.
10
1.4.7. Rapid Assessment procedures
Rapid assessment studies can provide the following contributions to environmental management agencies (WHO 1983):
� define high priority control actions; � organize effective detailed source survey programs; � organize appropriate environmental monitoring programs; � assess and evaluate the impacts of proposed pollution control strategies; � assess impacts of new industrial development projects; and � help site selection and determination of proper control measures. (Economopoulos, 1993).
1.4.8. Geographic Information Systems
Traditionally, the overlays have been produced by hand. As a result of recent developments, Geographical Information Systems (GIS) are becoming popular in situations where the computer technology and trained personnel are available. Computers also are used routinely to do cluster analyses of complex overlays. A significant application of GIS is the construction of real world models based on digital data. Modelling can analyze trends, identify factors that are causing them, reveal alternative paths to solving the given problem, and indicate the implications or consequences of decisions. For example, GIS can show how a natural resource will be affected by a decision.
1.4.9. Overlays
Shopley and Fuggle (1984) credited McHarg (1969) with the development of map overlays. An overlay is based on a set of transparent maps, each of which represents the spatial distribution of an environmental characteristic (for example, susceptibility to erosion). Information for an array of variables is collected for standard geographical units within the study area, and recorded on a series of maps, typically one for each variable. These maps are overlaid to produce a composite (see Figure 3-13). The resulting composite maps characterize the area’s physical, social, ecological, land use and other relevant characteristics, relative to the location of the proposed development. These methods are used in at least two ways in impact assessment. One way is to use before and after maps to assess visually the changes to the landscape. The other way is to combine mapping with an analysis of sensitive areas or ecological carrying capacity. When used in this latter way, constraints on the level of development are set on the basis of limits determined by the location of sensitive areas and by assessments of carrying capacity. These methods are spatially oriented and are capable of clearly communicating the spatial aspects of cumulative impacts. Their limitations relate to: 1) lack of causal explanation of impact pathways; and 2) lack of predictive capability with respect to population effects. However, some sophisticated versions can make predictions about potential habitat loss.
1.4.10. Simulation Modeling Workshops
System ecologists have developed an approach to EIA and management commonly referred to as Adaptive Environmental Assessment and Management (AEAM). AEAM uses interdisciplinary workshops composed of scientists and environmental managers to construct simulation models to predict impacts (Holling, 1978). Simulation models are usually expensive, time consuming to construct, and used only when there is sufficient funding and expertise available. Several simple models have been developed which can be used to predict changes in specific environmental
11
resources. This approach broadens the potential of simulation models to evaluate the impacts of alternatives and is considered beneficial for project planning. The AEAM approach uses short-term interdisciplinary teams interacting through modeling workshops to predict impacts and evaluate alternatives including management measures. The assessment is built around a small core group of people who interact with a wider set of relevant experts during a series of short-term, intensive workshops. These workshops provide a common meeting ground and aid in the integration of the information provided by people from different fields of expertise and management. The development of simulation models forces specialists to view their area of interest in the context of the whole system. It leads to clear-cut problem definition and existing data evaluation, and allows formulation of some initial predictive assessment schemes and sequences in analysis. For such simulation models to be developed through the series of workshops, unambiguous information must be available. In the workshop environment, the interdisciplinary team is required to be explicit about its assumptions. The consequent objectivity exposes critical conceptual uncertainties about the behavior of the system under study, and more importantly, identifies the research needed for the proper prediction of impacts in the context of the interdisciplinary effort.
12
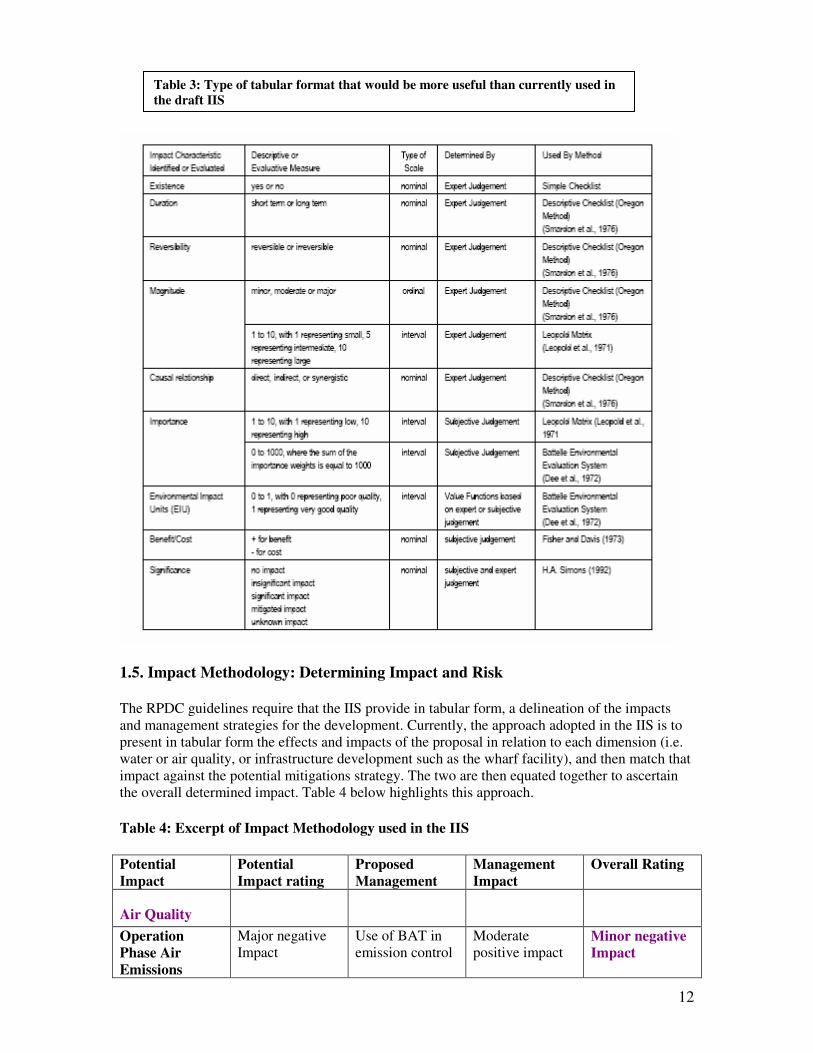
1.5. Impact Methodology: Determining Impact and Risk
The RPDC guidelines require that the IIS provide in tabular form, a delineation of the impacts and management strategies for the development. Currently, the approach adopted in the IIS is to present in tabular form the effects and impacts of the proposal in relation to each dimension (i.e. water or air quality, or infrastructure development such as the wharf facility), and then match that impact against the potential mitigations strategy. The two are then equated together to ascertain the overall determined impact. Table 4 below highlights this approach.
Table 4: Excerpt of Impact Methodology used in the IIS
Potential
Impact
Potential
Impact rating
Proposed
Management
Management
Impact
Overall Rating
Air Quality
Operation
Phase Air
Emissions
Major negative Impact
Use of BAT in emission control
Moderate positive impact
Minor negative
Impact
Table 3: Type of tabular format that would be more useful than currently used in
the draft IIS
13
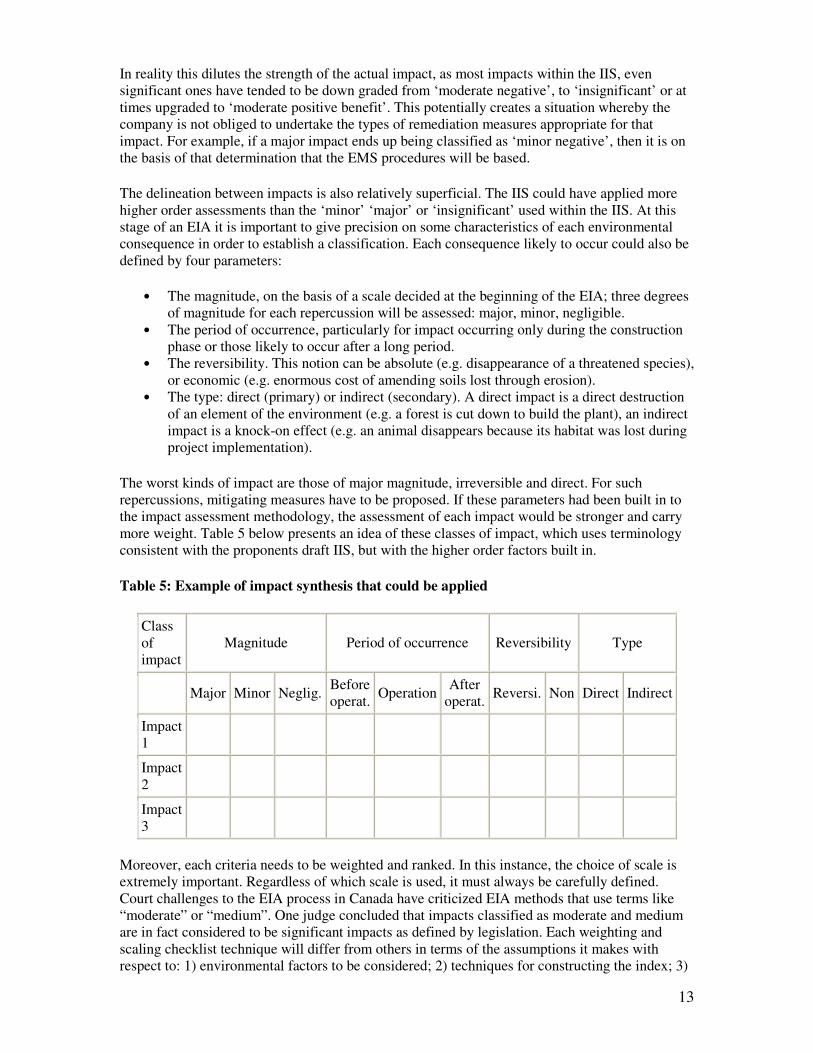
In reality this dilutes the strength of the actual impact, as most impacts within the IIS, even significant ones have tended to be down graded from ‘moderate negative’, to ‘insignificant’ or at times upgraded to ‘moderate positive benefit’. This potentially creates a situation whereby the company is not obliged to undertake the types of remediation measures appropriate for that impact. For example, if a major impact ends up being classified as ‘minor negative’, then it is on the basis of that determination that the EMS procedures will be based.
The delineation between impacts is also relatively superficial. The IIS could have applied more higher order assessments than the ‘minor’ ‘major’ or ‘insignificant’ used within the IIS. At this stage of an EIA it is important to give precision on some characteristics of each environmental consequence in order to establish a classification. Each consequence likely to occur could also be defined by four parameters:
• The magnitude, on the basis of a scale decided at the beginning of the EIA; three degrees of magnitude for each repercussion will be assessed: major, minor, negligible.
• The period of occurrence, particularly for impact occurring only during the construction phase or those likely to occur after a long period.
• The reversibility. This notion can be absolute (e.g. disappearance of a threatened species), or economic (e.g. enormous cost of amending soils lost through erosion).
• The type: direct (primary) or indirect (secondary). A direct impact is a direct destruction of an element of the environment (e.g. a forest is cut down to build the plant), an indirect impact is a knock-on effect (e.g. an animal disappears because its habitat was lost during project implementation).
The worst kinds of impact are those of major magnitude, irreversible and direct. For such repercussions, mitigating measures have to be proposed. If these parameters had been built in to the impact assessment methodology, the assessment of each impact would be stronger and carry more weight. Table 5 below presents an idea of these classes of impact, which uses terminology consistent with the proponents draft IIS, but with the higher order factors built in.
Table 5: Example of impact synthesis that could be applied
Class of impact
Magnitude Period of occurrence Reversibility Type
Major Minor Neglig. Before operat.
Operation After
operat. Reversi. Non Direct Indirect
Impact 1
Impact 2
Impact 3
Moreover, each criteria needs to be weighted and ranked. In this instance, the choice of scale is extremely important. Regardless of which scale is used, it must always be carefully defined. Court challenges to the EIA process in Canada have criticized EIA methods that use terms like “moderate” or “medium”. One judge concluded that impacts classified as moderate and medium are in fact considered to be significant impacts as defined by legislation. Each weighting and scaling checklist technique will differ from others in terms of the assumptions it makes with respect to: 1) environmental factors to be considered; 2) techniques for constructing the index; 3)
14
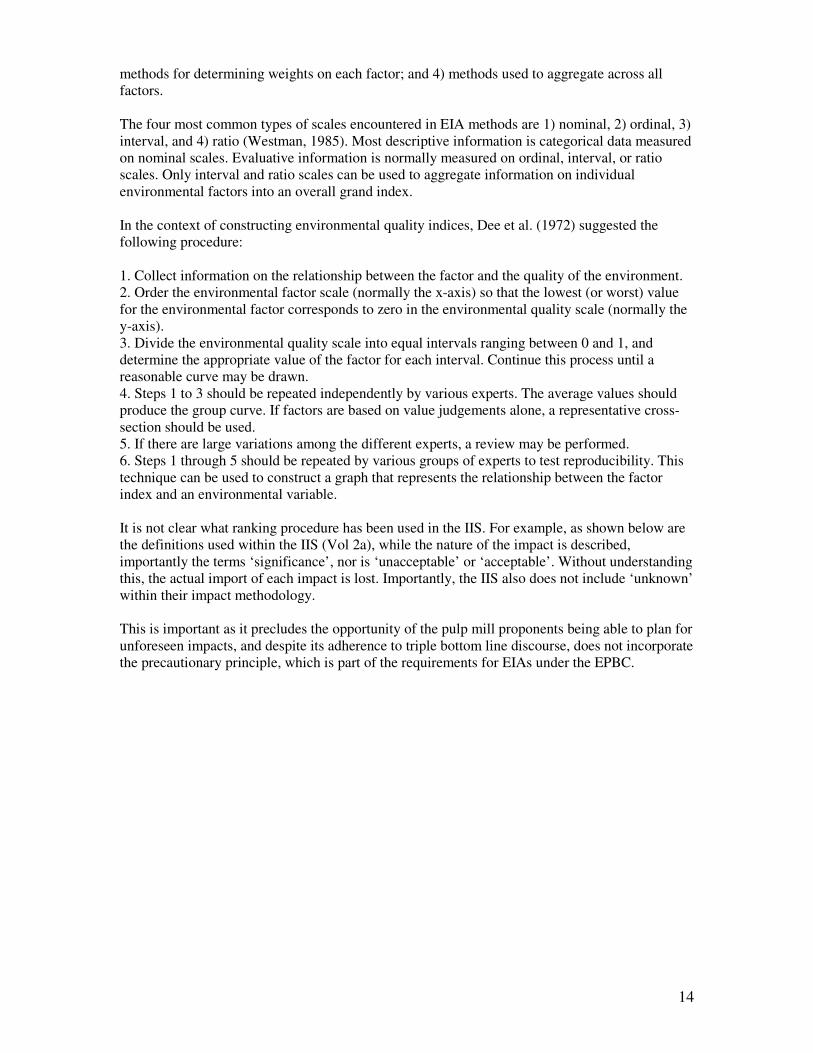
methods for determining weights on each factor; and 4) methods used to aggregate across all factors. The four most common types of scales encountered in EIA methods are 1) nominal, 2) ordinal, 3) interval, and 4) ratio (Westman, 1985). Most descriptive information is categorical data measured on nominal scales. Evaluative information is normally measured on ordinal, interval, or ratio scales. Only interval and ratio scales can be used to aggregate information on individual environmental factors into an overall grand index. In the context of constructing environmental quality indices, Dee et al. (1972) suggested the following procedure: 1. Collect information on the relationship between the factor and the quality of the environment. 2. Order the environmental factor scale (normally the x-axis) so that the lowest (or worst) value for the environmental factor corresponds to zero in the environmental quality scale (normally the y-axis). 3. Divide the environmental quality scale into equal intervals ranging between 0 and 1, and determine the appropriate value of the factor for each interval. Continue this process until a reasonable curve may be drawn. 4. Steps 1 to 3 should be repeated independently by various experts. The average values should produce the group curve. If factors are based on value judgements alone, a representative cross-section should be used. 5. If there are large variations among the different experts, a review may be performed. 6. Steps 1 through 5 should be repeated by various groups of experts to test reproducibility. This technique can be used to construct a graph that represents the relationship between the factor index and an environmental variable. It is not clear what ranking procedure has been used in the IIS. For example, as shown below are the definitions used within the IIS (Vol 2a), while the nature of the impact is described, importantly the terms ‘significance’, nor is ‘unacceptable’ or ‘acceptable’. Without understanding this, the actual import of each impact is lost. Importantly, the IIS also does not include ‘unknown’ within their impact methodology. This is important as it precludes the opportunity of the pulp mill proponents being able to plan for unforeseen impacts, and despite its adherence to triple bottom line discourse, does not incorporate the precautionary principle, which is part of the requirements for EIAs under the EPBC.

15
Table 6: Impact Methodology (Guns IIS Vol 2a)
Major Positive Impact Classed as impacts that are beneficial to the physical, biological or human environment. The impact is likely to have a significant positive effect on the environment
Moderate Positive Impact
Classed as the impacts that are beneficial to the physical, biological or human environment. The net impact will not have any short or long term negative impact on the physical, biological or human environment
Minor Positive Impact
Classes as impacts that are beneficial to the physical, biological or human environment. And the impact may be managed through normal and appropriate environmental management practices to enhance the impact. The net impact will not have any long term negative impact on the physical, biological, or human environment
Insignificant Impact
No negative or positive impact on the physical, biological or human environment.
Minor negative Impact
Classes as impacts, which are acceptable, even without normal and appropriate environment management practices. The net impact will not have any unacceptable long-term impacts on physical, biological or human environment.
Moderate negative Impact
Classed as the impacts that are management through normal and appropriate environmental management practices. Te The net impact will not have any unacceptable long term impacts on physical, biological or human environment.
Major negative Impact
Classed as impacts that are likely to have a significant negative effect on the environment. Long term impacts on the physical, biological or human environment even with environmental management practices
Substantial negative Impact
Classed as impacts that are likely to have a substantial negative effect on the environment. This could include regional or national extinction of flora and fauna species, short and long term human health impacts or significant changes to the physical environment on a regional scale.
16
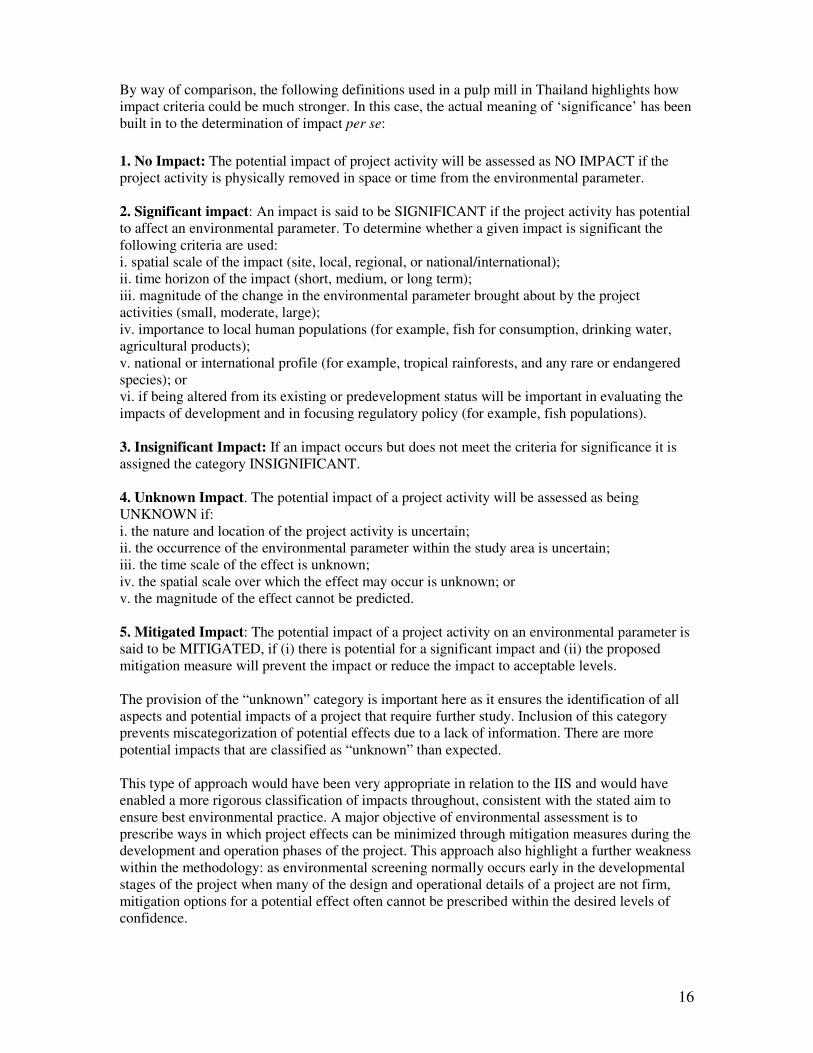
By way of comparison, the following definitions used in a pulp mill in Thailand highlights how impact criteria could be much stronger. In this case, the actual meaning of ‘significance’ has been built in to the determination of impact per se:
1. No Impact: The potential impact of project activity will be assessed as NO IMPACT if the project activity is physically removed in space or time from the environmental parameter. 2. Significant impact: An impact is said to be SIGNIFICANT if the project activity has potential to affect an environmental parameter. To determine whether a given impact is significant the following criteria are used: i. spatial scale of the impact (site, local, regional, or national/international); ii. time horizon of the impact (short, medium, or long term); iii. magnitude of the change in the environmental parameter brought about by the project activities (small, moderate, large); iv. importance to local human populations (for example, fish for consumption, drinking water, agricultural products); v. national or international profile (for example, tropical rainforests, and any rare or endangered species); or vi. if being altered from its existing or predevelopment status will be important in evaluating the impacts of development and in focusing regulatory policy (for example, fish populations).
3. Insignificant Impact: If an impact occurs but does not meet the criteria for significance it is assigned the category INSIGNIFICANT.
4. Unknown Impact. The potential impact of a project activity will be assessed as being UNKNOWN if: i. the nature and location of the project activity is uncertain; ii. the occurrence of the environmental parameter within the study area is uncertain; iii. the time scale of the effect is unknown; iv. the spatial scale over which the effect may occur is unknown; or v. the magnitude of the effect cannot be predicted. 5. Mitigated Impact: The potential impact of a project activity on an environmental parameter is said to be MITIGATED, if (i) there is potential for a significant impact and (ii) the proposed mitigation measure will prevent the impact or reduce the impact to acceptable levels. The provision of the “unknown” category is important here as it ensures the identification of all aspects and potential impacts of a project that require further study. Inclusion of this category prevents miscategorization of potential effects due to a lack of information. There are more potential impacts that are classified as “unknown” than expected. This type of approach would have been very appropriate in relation to the IIS and would have enabled a more rigorous classification of impacts throughout, consistent with the stated aim to ensure best environmental practice. A major objective of environmental assessment is to prescribe ways in which project effects can be minimized through mitigation measures during the development and operation phases of the project. This approach also highlight a further weakness within the methodology: as environmental screening normally occurs early in the developmental stages of the project when many of the design and operational details of a project are not firm, mitigation options for a potential effect often cannot be prescribed within the desired levels of confidence.

17
1.6. The Process: Environment Management System Planning
1.6.1. ISO Standards
The IIS specifically states that Gunns will extend their ISO 14001 certification to include this development. It is important to understand what being ISO 14001 certified entails and critically appraise its usefulness in meeting Gunn’s stated aim of ensuring environmental best practice. ISO 14001 is the standard established by the International Standards Organisation to ensure industries develop environmental management systems. These are often used in conjunction with the ISO 900 series which are those for quality management and monitoring. ISO 14000 series are underpinned by commitments to corrective action and continual improvement. ISO 14001 defines continual improvement as the process of enhancing the environmental management system in
order to achieve improvements in environmental performance in line with the organization’s
environmental policy. A company can choose to be ISO compliant, voluntarily self certified, or certified, which means it will be audited and endorsed by a registered and independent third party. In order to certify or even be ISO compliant a company must undertake the following steps as shown in Table 7:
Table 7: The EMS System
However, while the ISO provides a good starting basis for reviewing business practice, it does not require the firm to: (i) produce an environmental statement or that the firm’s EMS and statement be independently verified. In reality, this means that a company can be ISO certified and NOT be delivering best practice. As with the different EIA methodologies, the weaknesses of one model can be obviated by adopting parts of others. In this case, a number other standards exist to monitor environmental use and impact for companies, most notably the Environmental Management Audit Scheme (EMAS), primarily a European standard.

18
The advantages of the EMAS system is that it obliges the company to undertake annual public disclosure of the following:
� a description of the company’s activities at the relevant site � an assessment of all the significant environmental issues of relevance to the � activities concerned � a summary of the figures on pollutant emissions, waste generation, consumption � of raw materials, energy and water, noise and other significant environmental � aspects as appropriate � other factors regarding environmental performance � a presentation of the company’s environmental policy, programme and � management system implemented at the site � the deadline set for the submission of the next statement � the name of the accredited environmental verifier
There are also now ISO 14064 standards for climate change, released February 2006. This standard provides specifications for the quantification, monitoring and reporting of entity emissions and the removal of project emissions. It also requires validation, verification and certification consistent with the standard. The RPDC should insist upon the proponents adopting ISO 14064 given the concerns about air quality and pollution engendered by this potential development Both EMAS and ISO 14001 require firms to set objectives and targets in order to bring about continuous improvement in their environmental performance. This requires the developments of indicators. Indicators include operational, eco-financial, management and environmental. What indicators will a company use? Examples of indicators include:
� Tonnes of SO2 released per year � Tonnes of CO2 released per unit of production � Litres of water used per year � Kilogrammes of hazardous waste produced per year � Number of legislative breaches per year � savings achieved through energy efficiency measures � number of environmental improvement suggestions from employees and � number taken up by management � number of complaints received about environmentally related matters � number of employees trained versus number needing training
1.6.2. Indicators
It is very unclear what the indicators are with the current IIS, but establishing these as part of the EMS process is crucial, in order not only to maintain certification but in the spirit of continuous improvement and corrective action principles underpinning it, to properly address and minimise any impacts. Clarification on the exact indicators being used within the following categories needs to be more clearly defined within the environmental management plans, and extensively addressed within the monitoring program that will be implemented (in themselves not clearly outlined within the IIS). The IIS seems to rely on conventional notions of operational and management indicators but does not provide a baseline for the application of eco-financial indicators nor environmental condition indicators. Again, this would strengthen the basis on which the company could both seriously address and manage its impacts, but be able to confirm its claim to be the world’s best. An idea of how each of these indicator sets could be usefully applied within the environmental management plans for each aspect of the development is presented below:
19
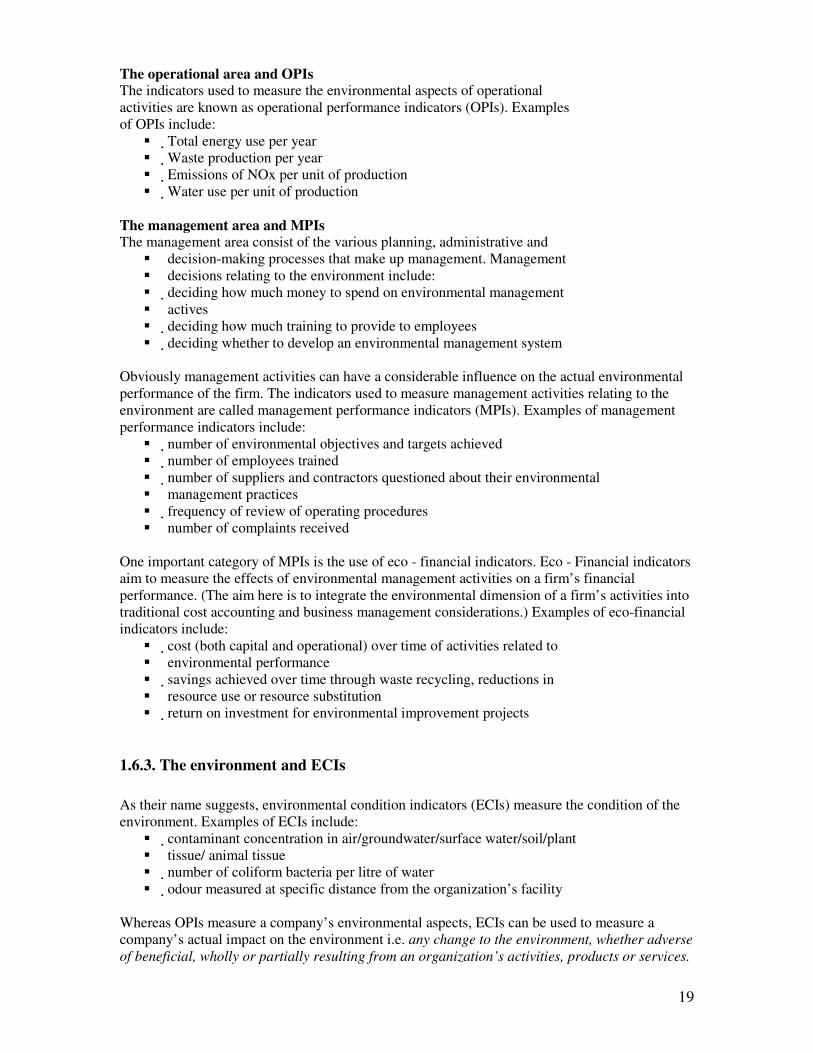
The operational area and OPIs The indicators used to measure the environmental aspects of operational activities are known as operational performance indicators (OPIs). Examples of OPIs include:
� Total energy use per year � Waste production per year � Emissions of NOx per unit of production � Water use per unit of production
The management area and MPIs The management area consist of the various planning, administrative and
� decision-making processes that make up management. Management � decisions relating to the environment include: � deciding how much money to spend on environmental management � actives � deciding how much training to provide to employees � deciding whether to develop an environmental management system
Obviously management activities can have a considerable influence on the actual environmental performance of the firm. The indicators used to measure management activities relating to the environment are called management performance indicators (MPIs). Examples of management performance indicators include:
� number of environmental objectives and targets achieved � number of employees trained � number of suppliers and contractors questioned about their environmental � management practices � frequency of review of operating procedures � number of complaints received
One important category of MPIs is the use of eco - financial indicators. Eco - Financial indicators aim to measure the effects of environmental management activities on a firm’s financial performance. (The aim here is to integrate the environmental dimension of a firm’s activities into traditional cost accounting and business management considerations.) Examples of eco-financial indicators include:
� cost (both capital and operational) over time of activities related to � environmental performance � savings achieved over time through waste recycling, reductions in � resource use or resource substitution � return on investment for environmental improvement projects
1.6.3. The environment and ECIs
As their name suggests, environmental condition indicators (ECIs) measure the condition of the environment. Examples of ECIs include:
� contaminant concentration in air/groundwater/surface water/soil/plant � tissue/ animal tissue � number of coliform bacteria per litre of water � odour measured at specific distance from the organization’s facility
Whereas OPIs measure a company’s environmental aspects, ECIs can be used to measure a company’s actual impact on the environment i.e. any change to the environment, whether adverse
of beneficial, wholly or partially resulting from an organization’s activities, products or services.

20
The use of different indicators also points to another drawback relating to the reliance within the IIS on the ISO standard. Importantly, EMAS also uses the term “effects” while ISO 14001 uses the terms “aspects” and “impacts”. The link between environmental aspects and environmental impacts in one of cause and effect i.e. environmental aspects are the cause of environmental impacts. It is possible to use indicators to measure both an environmental aspect and its related impact. For instance, the environmental aspect of phosphate emission can be measured using the OPI quantity of phosphates emitted per unit of time the associated impact can be measured using the ECI the biological oxygen demand (BOD) caused by these phosphate emissions in the
receiving aquatic environment.
Measuring environmental impacts can be very costly and in many cases it is just not possible to tell how much of a particular environmental impact is caused by one firm as opposed to one or more other firms within the same area. Most companies confine themselves to using OPIs in the knowledge that managing their environmental aspects will reduce the firm’s environmental impact.
1.6.4. Eco-balances
The adoption of eco-balancing is another useful tool for determining overall assessment of company inputs and outputs and overall mass balance in relation to impact. Specifically, eco-balancing is a tool that demonstrates the relationship between all the different dimensions. When talking about impacts the IIS focuses on the amount of input and then determines that will not have much impact, but it does not identify impact categories per se. Typical categories in use by companies within the USA by business include: global warming, use of non-renewable resources, loss of biodiversity, human toxicity, eco-toxicology, radiation, working conditions, odour, ozone depletion, water pollution, acidification, eutrophication, noise, waste heat, and damage to landscape
1.6.5. Best Practice Guidelines
Overall, the IIS states that it will measure its environmental performance in relation to best practice and the best practice guidelines available. However, while it selects a great many of these guidelines, it does not at any point identify or justify why the guidelines chosen are best practice. Overall, this approach, exposes the company to much critique and enables the public to assess the development in relation to a number of other, scientifically credible measures and guidelines for establishing the appropriate level of impact in relation to the effects of the pulp mill on humans and ecosystems. Given there does not appear to be scientific consensus that the guidelines chosen with the IIS are the best, and given the significant divergence of scientific opinion, over the assessed effects and impacts of the development, ensuring a suite of best practice guidelines that all agree on, would give both the scientific and general community comfort while building Gunn’s environmental credibility. The application of guidelines for air, water, habitat, pollution and many others, within international standards would go a long way to ameliorate public scepticism, demonstrate the company’s commitment to be the works best, and minimise environmental and health impacts. The company could also become a member of different international environmental charters, convened and developed by big business specifically to guide and enable best practice. For example, there is the International Chamber of Commerce (ICC) Business Charter for
Sustainable Development, and The Coalition for Environmentally Responsible Economies

21
(CERES) Principles, both of which are neither country nor industry specific i.e. any company from any country can sign up to them. The ICC Charter only requires a company to support its 16 principles. In contrast the CERES Principles require your company to submit an annual environmental report which will be monitored to ensure its compliance.
1.7. Summary
This submission has specifically focussed on four key areas in relation to the draft IIS for a pulp mill in the Tamar Valley, that is: (i) the use of its EIA methodology overall, (ii) its ranking for and assessment of impacts, (iii) its environmental management system, and (iv) its proposed use of ‘best practice’ guidelines. In summary it found that:
(i) the methodology used was not justified in light of the vast array of alternatives used world wide;
(ii) that the use of the ISO standard could be value added to and built on in significant ways, including the adoption of practices used with the EMAS standards and the adoption of the new ISO standard for Climate Change:
(iii) that the community and informed public could be involved in ensuring certification and audits occurred with internationally accepted guidelines for water, air and waste rather than local and national guidelines, and;
(iv) that assessment of impacts need to be reviewed and reconfigured to include ratings, that will authentically measure impacts over time. A full and detailed outline of best practice technologies needs to be included in the environmental management plans for each part of and stage of the proposed development.
(v) that Gunns provide a full financial accounting of the financial commitment it is prepared to make in order to ensure worlds best practice for this type of development.
This submission took as its starting point the statement in the IIS that:
“Gunns Limited (Gunns) proposes to develop a bleached Kraft pulp mill and associated infrastructure at accost of $1.4 billion. The mill will be an elemental chlorine free, and will incorporate the best available technology, and set new world standards for mill design.” (Gunns IIS 2006, exec summary p4)
Despite this declaration, to date, the societal sectors most concerned about this dimension, have not had their concerns met by this statement. This submission highlights that until flaws and inadequacies in the EIA methodology and EMS process per se are addressed, then this scepticism and opposition is likely to continue to dog and severely constrain the proposed development. In the final analysis, unless substantial modification in approach is made, the proponents will have lost an opportunity: it is not possible for the proponents to show case and ‘set world standards for mill design’, because world standards will not have been met by Gunns Ltd.

22
Section 2
Impacts from discharged material into Bass Strait and the Tamar
Estuary
2.1. Introduction
The following reports in the draft IIS, relevant to the potential impact of discharged material into Bass Strait have been considered:
• Hydrodynamic modeling associated with the development site in Bell Bay by GHD
• Marine Biological Study at proposed ocean outfall site in Bass Strait by AQUENAL PTY LTD
• Toxicity Assessment of a Pulp Mill Effluent for the Proposed Tasmanian Pulp Mill by ECOTOX Services Australasia.
In general, the studies are probably enough to estimate short-term impacts from the proposed development, however, they are no where near comprehensive or thorough enough to understand the full impact of the long-term development.
2.2. General Comments about the Studies:
2.2.1. Hydrodynamic modelling associated with development site in Bell Bay by
GBH
Model results show that the Tamar estuary has relatively strong tidal currents and is well mixed. The main finding of this study is that the wharf development will significantly slow flow rates down in the river at its proposed location in the Tamar estuary. According to these findings, over time the site would be a sink for material entering it. In the longer term, the site would become a source of material for areas downstream.
The physical model and its assumptions are legitimate for the study. Verification is limited and based only on tides, which happens to be the signal of the model open-sea boundary forcing. No verification is carried out with in-situ data at or in the vicinity of the proposed development site. The authors suggest long term changes in circulation are unimportant, which is true for the main finding of the study, but in the case of the proposed development, longer-term impacts should be considered. The study alone is not enough to understand the long-term impact of the development. Since the development will be a source of contaminants and pollutants for river, groundwater and marine environments, then long-term simulations of their pathways in the environment are needed.
An unresolved question of importance in the study is what happens in significant flood events. No consideration of the flushing of this estuary with respect to Bass Strait is made. Furthermore, no modelling studies of the proposed ocean outflow discharge and its long-term impact in Bass Strait have been carried out in relation to the IIS, given the Strait has low flushing in the area where effluent is to be released. The issue of particular pollutants and contaminants building up in Bass Strait over the life of the development is a serious concern.

23
It is of utmost importance for the RPDC to be categorically sure that no discarded materials from the proposed pulp mill will enter into the Tamar Estuary. Strict government guidelines on pollution from pulp mills entering into the Tamar River/Estuary exist, and on the basis of this report, no guarantee can be made that this will not occur. On this issue alone, the RPDC must recommend extensive re-planning on the size and location of the proposed pulp mill.
2.2.2. Marine Biological Study at proposed ocean outfall site in Bass Strait by
AQUENAL PTY LTD
The work carried out in this study shows that the level of species diversity near the proposed outfall site is relatively high compared to other parts of Tasmania. The area currently has a high level of environmental health, despite some evidence of contamination. The study raises a number of issues related to construction of the system and its potential long-term impacts.
A range of threatened cetaceans, pinnipeds, turtles and sharks may occur periodically and their exists a high conservation value Australian Fur Seal breeding colony at Tenth Island, 12 km to north east. The only threatened species known to inhabit the area is called the Gunns screw shell (Gazameda gunnii) and the outfall location is the only known place where it is currently not threatened.
Several occurrences of heavy metal concentrations exceeding environmental guidelines for protection of 90-99% of aquatic species were observed. Certain values of aluminum, iron and zinc exceeded guidelines for seafood safety. Elevated cadmium and arsenic levels were detected in certain sediment samples and elevated zinc levels in several fish.
This suggests that the Tamar is already a source of pollutants and contaminants for Bass Strait and Bass Strait is a place where material ends up after time. The study raises the issue of the risk of system failure and the release of concentrated contaminated effluent. The impacts in the area are still unclear.
Therefore, a number of significant long-term studies must be conducted including:
• impacts of this development on the Gunns screw shell
• long-term impacts of effluent discharge on marine ecosystems on and surrounding the discharge point
• long-term impacts on effluent impacts upon the Tamar Estuary
The report also fails to demonstrate how the discharge of pollutants into Bass Strait will not contravene the Stockholm Convention as required in RPDC Guideline 1.2.4.
2.2.3. Toxicity Assessment of a Pulp Mill Effluent for the Proposed Tasmanian Pulp
Mill by ECOTOX Services Australasia
Toxicity tests using effluent from a Thai Pulp Mill show that if it is 99% diluted, the level of toxicity is negligible to certain marine organisms. It is not clear however what the long-term effects might be. This study also shows that significant concentrations (around 50%) of effluent can create fatal levels of toxicity to scallops.

24
This is of particularly high significance to this project because the Tasmanian Fishing Industry Council has recently announced the discovery of a commercial scallop bed within 2 kilometers of the proposed effluent discharge pipe. An assessment of the impact discharged effluent will have upon this scallop bed is required.
Therefore, the report offers no credible hazards analysis and risk assessment on the potential tainting of commercial stocks of organisms as required by RPDC Guidelines 7.8.7.(6).
One problem of concern and area of uncertainty is the issue of dioxins and furans being released into the environment. These are extremely toxic pollutants that pulp mills produce. These accumulate over time in biota and are passed up the food chain and only a very small amount of these pollutants is harmful to most organisms. The problem is that they are beyond detection limits in the effluent samples, and no baseline information on their distribution in the region is available for comparisons. Being beyond detection limits creates further uncertainty because minute concentrations could build up to harmful levels over time. Studies dealing with this do not seem to have been carried out.
The report also suggests that dioxins and furans do not bio-accumulate in marine mammals. This is surely a typographical error as the literature quoted does not suggest that for one moment. The literature quoted says that dioxins and furans do not bio-accumulate in sea birds, this is not accurate and needs clarification by the RPDC.
2.3. Further Remarks
The study by AQUENAL found high levels of species biodiversity and environmental health at the proposed outfall site and that it may be the last refuge of the threatened Gunns screw shell.
Since the intended scale of the development is large, further investigation should be carried out to understand long-term impacts. The draft IIS is insufficient in terms of assessing environmental impacts stemming from the development in the following areas:
• Accumulation of pollutants and contaminants, particularly dioxins and furans, in sediments and biota over time in the Tamar Estuary and Bass Strait.
• Potential long-term impact on Tamar Estuary and SE fishery
Therefore, on the basis that the proposed pulp mill will discharge over 1,270,000,000 tonnes of effluent into Bass Strait over the life of the project, the RPDC must employ the precautionary principle and insist on further analysis of the long-term effects that dioxins and furans released in minute quantities will have upon marine wildlife, including the Australian Fur seal breeding colony on Tenth Island, before approval is given.

25
Section 3 Comments on the Flora Assessment Report by GHD, May 2006 3.1. According to the flora survey conducted by GHD, the construction of the pulp mill and associated infrastructure will result in the loss of:
• Threatened vegetation communities, up to a potential total (over all components of the project) of:
Table 8: Threatened vegetation communities to be destroyed by infrastructure associated
with the proposed mill.
Vegetation community TASVEG
code
Conservation
status
Area to be
destroyed
(ha)
Area proposed
to be reserved
as offset (ha)
Eucalyptus ovata forest and woodland
DOV Endangered 12.5 (+ 6.0 in future)
27.3 - 37.5
Eucalyptus amygdalina forest and woodland on sandstone
DAS Vulnerable 7.2 Up to 21.6
Allocasuarina littoralis forest
NAL Rare 3.6 9.6
Melaleuca ericifolia swamp forest
NME endangered 6.7 20.1
Notelaea-Pomaderris-
Beyeria forest NNP endangered <0.1?
Eucalyptus viminalis wet forest
WVI endangered 0.4
Riparian scrub SRI vulnerable <0.1?
Rockplate grassland GRP endangered <0.1?
Freshwater aquatic sedgeland and rushland
ASF vulnerable 1.4
Lacustrine herbland AHL vulnerable 0.3
TOTAL 32.2
• Up to 23 species of threatened flora will or may be impacted. The Pulp mill site itself appears to be a threatened species “hotspot”, which GHD considers has State conservation significance. There are at least 10 threatened flora species at the pulp mill site, of which 6 will be impacted and another 5 may be. The Water Supply Pipeline also has at least 10 threatened flora species, and GHD considers it to be of local to State conservation significance. The Effluent Pipeline also passes through a threatened species hotspot which may have national conservation significance, with at least 2 threatened flora species of National and State significance (which measures are trying to avoid), as well as at least eleven threatened flora species of state significance.
• Other native vegetation, not listed as threatened communities, will be impacted, up to a possible total of 197.9 hectares. This makes a total of up to 230.1 ha of threatened and non-threatened vegetation that will be destroyed.

26
• Much of this vegetation is likely to be habitat for threatened fauna such as Masked Owl, Spotted-tailed Quoll, Tasmanian Devil, Eastern Barred Bandicoot etc.
The RPDC should refuse the granting of any permits to clear habitat of those species listed above and ensure full compliance of the EPBC Act 1999 is maintained. 3.2. Regarding the threatened vegetation communities, there is a moratorium on clearing rare, vulnerable and endangered forest and non-forest communities. There are controls on clearance and conversion of these, under the Forest Practices Act and Regulations. Forest types that are classified as rare, vulnerable or endangered will not be approved for clearing, unless exceptional circumstances exist (Clearing of Vegetation information sheet, Forest Practices Board, April 2005), and unless “conversion will not substantially detract from the conservation of that forest community or conservation values within the immediate area” (2.2.1 in Permanent Native Forest Estate Policy 2005). 3.3. Currently there is controversy over the proposed inundation of about 30 hectares of endangered black gum forest by the Meander Dam, with no guarantee that the Forest Practices Authority will approve a Forest Practices Plan to destroy this forest. Here, the total area of this forest type that may be destroyed in construction of the pulp mill and its infrastructure is 12.5 to 18.5 ha in time, which is clearly of an important magnitude, being almost half the area involved at Meander Dam. The RPDC should therefore reject the draft IIS for proposing to clear this vulnerable vegetation type, maintain the moratorium on clearing rare, vulnerable and endangered forest and non-forest communities and ensure full compliance under the terms of the EPBC Act
1999. 3.4. The proponents propose to “offset” these losses of threatened vegetation communities by covenanting areas of these communities elsewhere in the northeast, on Gunns-owned land. The proposal is to protect by covenant total areas equivalent to three times the areas to be lost. 3.5. “Offsets” such as this are in no way a gain for nature conservation. The total area of each vegetation community is still reduced by the project. The supposed gain in conservation security for the offset areas is minimal, as the threatened vegetation types are already supposed to be protected by the moratorium. The proponents would not be allowed to clear or convert these areas anyway, and neither would anybody else. At present these vegetation types would be of little or no commercial use anyway, apart from some minor possible logging in the eucalypt communities where regeneration will be as the same vegetation type. There is thus little sacrifice to the proponents for putting covenants on offset areas and is simply an empty gesture providing no net-gain for biodiversity. 3.6. Why should the figure of 3 times the area to be lost be chosen for the offset? Is there an agreed standard for compensating for threatened vegetation communities that will be permanently lost? Interstate there is an expectation that there will always be a net gain in vegetation quantity and/or quality, for instance under “Victoria’s Native Vegetation Management – a Framework for Action” (2002). Simply putting a covenant on an area elsewhere, that was not under threat, does not create a net gain to make up for permanent loss of threatened vegetation, habitat and species in the pulp mill project. 3.7. Not all the threatened vegetation communities to be destroyed are proposed to be offset in this way. There seems to be no mention of offsetting the loss of communities (TASVEG codes): NNP, WVI, ASF and AHL, which in total cover at least 2.1 ha. In addition, SRI and GRP may be impacted, although they are outside the footprint, so these should be addressed if impacts could occur.
27
3.8. There are no clear outlines of how the loss of threatened flora species is intended to be mitigated (apart from avoiding them where possible), or even “offset”. There is just mention that the “reserve” will try to incorporate some of them. That is not adequate and the RPDC must use its powers to seek legally binding guarantees from the proponents of the proposed pulp mill or refuse clearing of these species. 3.9. The intention to set up a 150 ha “reserve” within the mill site itself and in adjoining areas as a means of protecting threatened flora and fauna, offsetting those individuals of threatened species that are destroyed, and offsetting the loss of the non-threatened vegetation types. This is wholly inadequate, considering that the far greater area of up to 230.1 ha will be destroyed (including both threatened, 32.2 ha, and non-threatened vegetation types, 197.9 ha), as well as many hundreds of individuals of up to 23 species of threatened flora. 3.10. The moratorium on clearing threatened vegetation communities should be upheld. None of these areas should be cleared for this project. 3.11. Should the project be approved, with destruction of threatened vegetation communities, threatened flora species and habitat for threatened fauna then it should be with the condition that a considerable area of native vegetation be permanently protected as a public reserve. This reserve, or several reserves as necessary, should contain at least three times the area of all threatened vegetation communities to be lost, three times the number of threatened species to be lost, as well as at least three times the area of non-threatened vegetation to be lost. The reserves should contain suitable habitat for threatened fauna. In other words, reserves totalling at least 690 ha would be necessary. These reserves should be from Gunns’ freehold land, in northeast Tasmania, ideally within the same bioregion. 3.12. The management actions proposed to be addressed in Vegetation and Fauna Management Plans (volume 3, Environmental Management Plans) for each site are sensible and should be enforced. However, the last point “Consider the development of habitat offsets elsewhere, to compensate for the loss of vegetation on site” is insufficiently prescriptive. Development of habitat offsets, as described in point 3.11, should be a condition of approval.
28
Section 4 Air Quality Issues
4. 1. Introduction The Tamar Valley already has a significant air pollution problem because of discharge from heavy industry near George Town, wood-heaters, transport, and industry pollution in the Launceston area (Norwood 2004). Although substantial effort is claimed by the proponent to mitigate air pollution from the proposed pulp mill (Gunns 2006), substantial emissions will still be discharged into the Tamar Valley Air-Shed (TVAS). The proposal could have been a Totally Chlorine Free (TCF) mill which would have eliminated emissions of dioxins and furans, and would have been fully compliant with the treaty obligations of the Stockholm Convention to eliminate Persistent Organic Pollutants (POPs) (National Toxics Network 2006). Therefore, the proposed mill will not be consistent with the Stockholm Convention as required by RPDC Guidelines 1.2.4. and the draft IIS should be rejected. The proposed pulp mill is claimed to be the world’s largest single process line Elemental Chlorine Free (ECF) Kraft Pulp Mill (NTN 2006). ECF pulp mills emit a wide range of air pollutants including; particulates, carbon dioxide, hydrogen sulphide, sulphur dioxide, chlorine dioxide and a range of hormone disrupting and carcinogenic compounds such as chlorinated phenols, Polycyclic Aromated Hydrocarbons (PAHs), and Volatile Organic Compounds (VOCs) (Broten and Ritchlin 1999). Consequently, although some controls are proposed to reduce pollution, the shear size of the proposed mill will inevitably exacerbate the TVAS. Therefore, the location of the proposed pulp mill, from an air quality perspective, is probably the worst possible in Tasmania and should be rejected by the RPDC.
4.2. Air pollution in the Tamar Valley Air quality in the Tamar Valley is particularly bad in autumn and winter when wood heaters are in greatest use. When high pressure cells move over the state bringing cold, icy conditions at night with little wind to disperse particulates, national air quality standards are frequently exceeded (Norwood 2004). Another problem, primarily in autumn, is the burning of clear-fell logging coupe residue. This can produce severe localised health problems. Without wind dispersal, the enclosed geography of the Tamar Valley traps air pollution. Consequently, air pollution can accumulate over a number of days, with increasing severity, particularly for those most at risk. The State of the Air Report produced by the National Heritage and Protection Council (NHPC) (DEH 2004, cited in Norwood 2004) found that Launceston is the only city in Australia to exceed the national standard for ambient (outdoor) air quality, and also has the highest levels of particulate pollution in Australia.
4.3. Health Effects of Air Pollution Health effects of air pollution generally include; premature births, premature death, increased asthma and emphysema. Long-term impacts of exposure to air pollution include increased rates of cancer (Todd 2000, cited in Norwood 2004). More particulate pollution will increase the percentage of deaths in a population. Persons with restricted lung capacity are particularly affected. A New Zealand study by Hales (1999, cited in Norwood 2004) found that for every increase in PM10 of 10 micrograms per cubic metre (10ug/m3) there was a 1% increase in daily
29
deaths and a 4% increase in lung related deaths. Similar results were found in a US study by Dockray (1993, cited in Norwood 2004). Toxic chemicals including dioxins and furans are produced with the burning of substances including wood. Other substances of concern include; carbon monoxide (CO)(emitted by traffic and wood-burning), particles (PM 10 and PM 2.5), sulphur dioxide (SO2) and oxides of nitrogen (NOx) (Norwood 2004). Modelling by Gunns shows that levels of NO2 and SO2 exceed limits at times in George Town already (Gunns 2006, cited in NTN 2006). Of most concern in the Tamar Valley is particle pollution. A study by the CSIRO (2004, cited in Norwood 2004) considers that these will be a significant health risk in the Launceston area for many years to come. Additionally, particle pollution is still a problem from heavy industry in the Bell Bay area (NPI 2003, cited in Norwood 2004). For example, TEMCO has been recorded recently emitting 330,000 kg of particles per year (DPIWE 2004, cited in Norwood 2004). Any new particulate emitting industry in the Tamar Valley can only increase this risk (Norwood 2004).
4.4. Air Pollution Predicted from the Proposed Pulp Mill (also see Appendix 1) The shift to ECF pulp mills has generally reduced organochlorine discharges significantly by 80%. However, emissions are still massive (Dahlmann and Monk 1993, cited in Thornton 2000). Chlorine dioxide (ClO2) reacts with water in the bleaching process to produce elemental chlorine (Cl2) and hypochlorous acid (HOCl) which then reacts with organic matter to produce organochlorins such as dioxins and furans (Solomon et al. 1993, cited in Thornton 2000). Thus, elemental chlorine gas is still produced, and so the elemental chlorine free label is misleading. Identified compounds produced include: chlorophenols, chloroform, chlorinated acids, together with highly bioaccumulative compounds such as chlorinated cymenenes, cymenenes, fluorenes, phenanthrenes, napthalenes, and sulfones (Koistinen et al. 1994a, 1994b; Rantio 1995, cited in Thornton 2000). Dioxins and furans are discharged into the air (Rosenberg et al. 1994, cited in Thornton 2000). Dioxins and furans are produced in the bleaching process by a combination of chlorine (Cl2) interacting with phenolic compounds such as lignin. Combustion processes can also produce dioxins and furans where an organochlorine compounds are involved. Combustion sources include; solid waste incinerators, any burning of organochlorins, and even burning of vegetation treated with phenoxy-acetic acid herbicides. Dioxins when released by incineration can reside in the atmosphere for a considerable time which may explain their widespread occurrence. In the terrestrial environment, dioxins bind to the organic fraction of soils. The most toxic dioxin congener 2,3,7,8 – TCDD is lethal to mammals. Chronic exposure to humans results in liver and nerve damage. The effects of mixtures of dioxin congeners are difficult to assess (Connell 1997). It is nonsense for the proponents (2006 Executive Summary IIS) to claim that dioxins do not bioaccumulate. According to Connell (1997) dioxins are hydrophobic compounds and therefore accumulate in the adipose or fatty tissue of humans, as well as, the breast milk of nursing mothers. Respected authorities such as the United States Environment Protection Authority (US EPA) accept that dioxins bioaccummulate within organisms, and therefore biomagnify through the food chain, becoming more of a problem for higher mammals such as seals and humans (NTN 2006). These are serious pollutants that can cause considerable human health impacts and the draft IIS has not dealt with these issues appropriately. Therefore, the RPDC should. The proposed pulp mill will also contribute significant amounts of nitrogen oxides (NOx) above emission guidelines (Gunns 2006). These will be in addition to significant levels of this pollutant already discharged into the TVAS. Sulphur dioxide (SO2) will also be emitted as well as the
30
highly toxic dioxins (PCDD) and furans (PCDF) (Gunns 2006). Totally Chlorine Free (TCF) mills do not produce dioxins and furans at all. TCF mills have been built at comparable costs to ECF mills. Emission limits for dioxins and furans are totally inadequate being three times those for a municipal waste or medical waste incinerator (NTN 2006). Other pollutants likely to be formed using chlorine dioxide as the bleaching agent includes: chloroform, chlorinated phenolics and other chlorinated organics, as well as phenol and methanol. Chloroform, dichloroacetic acid methyl ester and other volatile organochlorine compounds have been found in the vent gases of mills using 100% chlorine dioxide substitution and can volatize into the atmosphere from treatment ponds. However, these gases were almost non-existent when investigated in a TCF mill (Juuti et al. 1996, cited in NTN 2006). Moreover, the presence of organochlorines in both filtrates of ECF bleach liquors and in sludge from treatment plants means that they cannot be incinerated without the emission of products of incomplete combustion including the dioxins and furans (PCDDs and PCDFs) (Johnston et al. 1996, cited in NTN 2006). Wood-smoke is a notable problem in the Tamar Valley in terms of particulates, and this will be exacerbated, especially by emissions from the proposed power boiler, lime kiln boiler, and recovery boiler associated with the proposed pulp mill. Modelling by Gunns (2006, Vol. 9 Appendix 16, cited in NTN 2006) shows that particulate levels in George Town already exceed limits by 100% on occasions for both PM10 and PM 2.5 . This will be increased significantly if the pulp mill comes into production, particularly considering an estimated 100,000 kg. of particulates will be emitted every year (NTN 2006). Modelling by GHD (2006, cited in Gunns 2006, Vol. 9, App. 16) predict that Total Reduced Sulphides (TRS) will be a problem to populations near the mill. These estimations have been made on the basis of emission rates calculated by the mill designers Jaakko Poyry. Such calculations need to be treated with some scepticism. GHD (2006) admit a detailed verification of the data has not been performed. The actual problem could be much worse than predicted by the modelling depending on reliability of the source information. There is also an element of error in the modelling. The RPDC must insist on further independent analysis of this information. Other pollutants of concern in the Tamar Valley are air toxics such as benzene and polycyclic hydrocarbons (PAHs). Some air toxics are associated with particulates including benzene which is a known carcinogen (Environment Australia 2001; CSIRO 2004a, cited in Norwood 2004). Launceston has exceeded the highest levels of any city in Australia with regard to particulates (PM10), and PAHs which is also a known carcinogen (DEH 1999, 2004, cited in Norwood 2004) and are known to be emitted from ECF pulp mills (Broten and Ritchlin 1999). The risk assessment by Drew and Frangos (2006, cited in Gunns 2006, Vol. 9, App. 21), paints a far too rosy picture of the proposed mill. For example, Drew and Frangos (2006:8) state “it is very unlikely odour events will be experienced by people living close to the proposed mill…”. This is contradicted by GHD (2006) who explain that odour events by TRS will occur, at least every 4 years. In the case of health effects, Drew and Frangos (2006:8) state “mill emissions are very unlikely to cause direct health effects, either alone or as a mixture”. Applying the same principle as in the odour case, this can simply be restated that direct health effects will occur from dioxins, PAHs and other pollutants. Drew and Frangos (2006) admit that PAHs from the proposed mill are a cancer risk. With every polluting industry added to the Tamar Valley, the risk and tangible effects of adverse health effects are increased. The precautionary principle necessitates that the pulp mill proposed by Gunns Ltd. be rejected as the Tamar Valley is already heavily polluted and for George Town, the risks to human health are already unacceptable. Further development, especially on such a gigantic scale is inappropriate for the location chosen by the proponents.
31
4.6. Transport Pollution One of the major contributors to air pollution in the Tamar Valley, particularly in the Launceston area is transport. This will be increased by expanded log truck traffic, particularly through Launceston if the proposed pulp mill is approved. The National Pollution Inventory (NPI) in a major study found that transport was the second largest source of PM 10 in Launceston with also significant contribution of carbon monoxide (CO) and a range of volatile organic compounds (VOCs). Particle emissions from diesel engines contribute significantly to PM 2.5 emissions, possibly up to 98% of particle mass (NEPC 2002, cited in Norwood 2004). The CSIRO (2004, cited in Norwood 2004) have found PM 2.5 particle pollution at close to the NEPC limit in Launceston in summer. Fine pollution particles (PM 2.5) are small enough to enter deep within the lungs and then into the bloodstream (Norwood 2004). Adsorbed toxins can be carried into the body and there is increased likelihood of respiratory disease (NTN 2006). The CSIRO (2004, cited in Norwood 2004) found the main sources of these in the Launceston area are wood burning (homes and industry) and transport. The NEPM air reporting standard for PM 2.5 has already been reached in Launceston, therefore not leaving room for any other source increases. Increased levels of diesel log trucks through Launceston together with particulate pollution from the proposed pulp mill will push PM
2.5 levels over the national limits. On this basis, the RPDC should reject the proposed development.
4.7. Greenhouse Gases The proposed pulp mill will be the single largest emitter of greenhouse gases in Tasmania. A possible 500,000 tonnes p.a. of wood will be burned in the power boiler. This will release large amounts of both CO2 and nitrogen oxides (NOx), two of the three major contributors to global warming (Laidler 1991). For the proponent to claim that biofuels used to generate power will replace fossil fuels (Gunns 2006, Executive Summary) is totally misleading, and ignores the efforts around Australia to produce more power from clean sources of power such as wind. Almost all power in Tasmania is produced by hydro and wind, and the power generated by the power boiler will be the dirtiest, most toxic, and greenhouse escalating power generating facility in Tasmania. The burning of pulp mill wastes for power, including black liquor, will also lead to higher levels of dioxin contamination. Unfortunately, there have been no calculations of the tonnes of Greenhouse gases to be emitted by the proposed pulp mill, including the power station. Transport of materials to the proposed mill in the operating phase using the most conservative estimate by GHD (2006 cited in Gunns 2006, Vol. 9, App. 20) will generate 279,913 tonnes in the early start-up phases increasing to 339,540 tonnes by 2019. The proponents describe this as a ‘minimal’ additional impact on Greenhouse gases (Gunns 2006, Executive Summary). Emissions from the proposed pulp mill itself could theoretically be far higher. Why have greenhouse gas emission levels from the pulp mill not been calculated in the draft IIS? The RPDC must insist on these calculations being made as it is impossible to determine real greenhouse gas emission levels from the draft IIS and as the draft currently stands, it fails to address RPDC guideline 7.13. This is totally at odds with world’s best standards employed by the Europeans at minimising and reducing climate changing gases produced by industry.

32
4.8. Meteorology/Geography of the Tamar Valley An inversion layer can form in the Tamar Valley at any time of the year, but particularly in autumn and winter when wind speeds are low, and emission from wood-burning is high. Although the Bell Bay area is considered better for the siting of industry that emits particulates and other substances, the geography of the Tamar Valley and associated inversion layer tends to move smog towards Launceston from other areas. Light daytime winds can push cold, pollution carrying air towards Launceston where it can be trapped by the inversion layer and surrounding hills (Norwood 2004). This interpretation is supported by GHD (2006, cited in Gunns 2006, Vol.9, App. 16) who comment that pollution moves along the NW/SE alignment of the Tamar Valley in response to prevailing winds. The pollution plume extends along the whole valley, with highest levels nearer Launceston.
4.9. Conclusion According to Norwood (2004), a strategic approach is now required to address air quality problems in the Tamar Valley. Air dispersion mapping is needed to find out where to best site industry in the Tamar Valley. Because of the particulate problem, any new industry with emissions is best sited outside of the valley. Between 2001 -2004 over $ 2 million was spent in the Tamar Valley to improve air quality including replacing wood-heaters and education programs (Norwood 2004). The siting of the pulp mill proposed by Gunns Ltd. will almost double the amount of particulates emitted in the Bell Bay industrial precinct, and significantly, increase particulate emissions in the TVAS. Risk of cancer will also be increased through emissions of dioxins, furans, PAHs and VOCs. The Tasmanian Air Quality Strategy is also ignored (see below for further information on the Tasmanian Air Quality Strategy). The proponents claim that the proposed pulp mill will have no impact on air quality in the Tamar Valley but at the other end of the spectrum, Aron Gingis, a Melbourne-based environmental consultant said the pollution from the pulp mill would drift towards Launceston, making the city ‘almost uninhabitable’ on cold and wet days due to the tunnel-like typography of the Tamar Valley (from http://www.abc.net.au/news/newsitems/200609/s1733897.htm accessed on September 6, 2006). This extreme divergence in research outcomes indicates that the RPDC must insist on significant further investigation to find out where the truth lies. Further, the draft IIS does not adequately address RPDC guidelines 7.13 regarding greenhouse gas emissions. Therefore, the RPDC must employ the precautionary principle and refuse granting approval for the proposed pulp mill as no definitive case has been mounted by the proponents to claim that there will be no negative air quality impacts in the Tamar Valley. It was on air quality grounds in 1989 that the Tamar Valley was ruled out for a pulp mill and the LEC believes is still a reason why a pulp mill should not be approved in the Tamar Valley in 2006.
33
4.10. Further Information on air quality the RPDC should consider
4.10.1. Pulp Mill Pollution and Health Effects (source: Reach for Unbleached Foundation www.rfu.org.au/cacw/pollutionAir2.htm. (Accessed 01 September 2006).
The Substances
Ammonia
Where: digesters, secondary treatment plant
Health: Precursor to fine particulate formation. Irritant.
Carbon Monoxide
Where: Lime kiln, power boilers.
Health: human visual impact at 50 ppm for one hour, death at more than 750 ppm, vegetation impact at higher levels.
Carbon Dioxide
Where: Effluent treatment system, power boilers.
Health: Greenhouse gas.
Carbonyl Sulphide
Where: Recovery boiler.
Health: Potential neurotoxin, acute (short-term) inhalation of high concentrations of carbonyl sulfide may cause narcotic effects in humans. Carbonyl sulfide may also irritate the eyes and skin in humans.
Chlorine and Chlorine dioxide
Where: Generation systems, extraction stage scrubbers, bleach plant "upsets" such as explosions. A BC study funded by Health Canada and the Workers' Compensation Board showed that chlorine was present in almost all areas of the mill, including the wood yard, although the mill was 100% chlorine dioxide bleaching. (In other words, the chlorine dioxide breaks down to release chlorine into the air and from the pulp.) Chlorine and chlorine dioxide exposures showed significant short term peaks (both over 20 ppm) which exceeded regulatory limits, and posed a health risk, although these peaks could not have been detected using shift-long measurements as is the norm. Wood dust also posed a health problem.
Health: Chlorine is a severe short and long term respiratory irritant at levels above 1 ppm (odour threshold 60-200 ppb); chlorine dioxide is a severe short and long term respiratory irritant at levels above 0.1 ppm (odour threshold 100 ppb - NIOSH, 1987). Both compounds kill at high levels. The BC Workman's Compensation Board has lowered the 8 hour exposure level for chlorine to .5 ppm. The characteristic response to short term chlorine and chlorine dioxide exposure is Reactive Airway Dysfunction Syndrome (RADS), airway inflammation and bronchial hyper-responsiveness, which may last for three years or more, and can result from one acute exposure. "Adverse effects on immune system, blood, heart, and respiratory system in laboratory studies."-Taking Stock.. In pulp mills, chlorine can react with other gases - Total Reduced Sulphur, turpentine, and ammonia, in the last case producing CEPA-Toxic chloramines.
Chloroform
Where: Effluent treatment system, possibly bleach plant
Health: Recognized carcinogen, suspected respiratory, cardiovascular or blood, liver and kidney toxicant, endocrine and neurological disruptor.

34
Dioxins and Furans
Where: Recovery boiler, power boiler if burning "salty" hog fuel
Health: Health effects associated with dioxin and the chemically-similar PCBs, probably through action on the chemical messengers of the body, and passed on through the generations, include reproductive effects, from low sperm count to endometriosis; hyperactivity; allergies and immune and endocrine system malfunctions; diabetes; low birth weight, poor motor co-ordination and lower IQ for children. Dioxin is classified as a human carcinogen by the International Agency for Research on Cancer and it is recognized as a tumour promoter, along with its other roles in modifying and disrupting growth functions.
Adverse Health Effects
Adults: Skin disease, Immunosuppression,Respiratory effects, Cardiovascular effects, Liver effects, Reproductive toxicity, Carcinogenicity 2B
Fetus: Learning behaviour, Development of reproductive system, Immune system. (USEPA 1999)
Hydrogen chloride (part of PM?):
Where: Recovery boiler
Health: Suspected gastrointestinal or liver toxicant, respiratory and skin or sense organ toxicant
Methanol
Where: Recovery boiler, oxygen delignification systems, effluent treatment system. Methanol has been accepted by the US EPA as a surrogate monitoring measurement for a wide range of the Hazardous Air Pollutants (chlorinated compounds) which the US requires polluters to report, and the US Cluster Rules now require mills to collect these gases and burn them in the fire zone of the Recovery boiler:
Health: Suspected developmental toxicant, neurotoxin, gastrointestinal or liver toxicant
Nitrogen Oxides (NOx)
Where: Lime kiln, recovery boiler, power boiler, gas turbines, brown stock washers.
Health: NO2 is acute respiratory irritant at 1 ppm for 15 minutes. Harmful Air contaminant, Precursor to smog, ground level ozone, fine particulate and acid rain. Harmful to humans, vegetation growth and health.
Particulate Matter
Where: Recovery boiler, lime kiln, smelt dissolving tank, power boilers, wood chip yard, dust from landfill. Particulate can be material, such as wood, lime, or road dust, or chemical compounds created with carbon, metallic oxides and salts, acids, oils, etc.
Health: The lungs and respiratory tract can expel large Particulate. Greatest health impact is felt from particles with smallest size - designated PM 10 (microns) or less, and especially PM 2.5 - which penetrate the lungs and stay there, frequently delivering a toxic load to the body and guaranteeing the unwelcome visitor will stay. Fine Particulate is linked to serious health impacts including chronic bronchitis, asthma, and premature deaths. PM 2.5 has been recognized to have the potential for the greatest health impact on a larger segment of the general public.
Secondary particles are formed through chemical reactions involving the precursors NOx, VOCs, sulphur oxides (SOx), and ammonia (NH3).
35
US Federal standard 150 ug/m3; health impacts such as children's absenteeism due to asthma at 50ug/m3. BC has set a new air quality objective of 25 ug/m3 for PM 2.5; the Canadian Council of Ministers of Environment have determined a Canada Wide Standard for PM, focused on the fine fraction of PM, smaller than 2.5 microns, known as PM 2.5 of 30 gm/m3 averaged over 24 hours, to be achieved by 2010.
Phenols
Where: Power boilers, brown stock washers, chip bins, effluent treatment system
Health: Smog precursor, kills fish, toxic to kidneys of humans, also wide range of sensitive effects including to blood, immune and nervous systems.
Sulphur oxides (SO2, SO3 and solid sulphates)
Where: Recovery boiler, lime kiln, power boilers, brown stock washers, chip bins. Anywhere sulphur containing compounds, including oil and gas, are burned.
Health: Irritating to eyes and respiratory system at 5 ppm for 10 minutes. SOx is a precursor to fine Particulate Matter formation. Sulphuric acid is implicated in bronchitis, emphysema, eye, nose, and stomach irritations, and possible lung cancer in exposed workers.
Total Reduced Sulphur compounds , including hydrogen sulphide, methyl mercaptain, di-
methyl sulphide, and di-methyl disulfide.
Where: Recovery boiler, Non-Condensible Gas collection systems durin, effluent treatment system g upsets at 75-300 lb/hour, lime kiln, smelt dissolving tank, digesters, power boilers
Health: - extraordinarily foul-smelling, toxic, heavier than air. H2S Irritates eyes at 50 ppm, causes death at 100 ppm. Human nose detects at about 1 ppb. See also Dr. Hirsch's testimony.
Miscellaneous: alcohols, terpenes, acetaldehyde, nitrates, fungi (aspergillus fumigatus and a. versicolor) bioaerosols (endotoxin), benzene and assorted substituted benzenes, chlorinated benzenes and phenolics, guaiacols, and other Volatile Organic Compounds, many of them unquantified and unidentified, but including dichloroacetic acid methyl ester, 2,5,-dichlorothiophane, styrene, toluene and xylenes, all varying from day to day, depending on feed stock and "upsets" anywhere in the mill.
Simons discusses the US Clean Air Act's 189 Hazardous Air Pollutants and says the emissions from pulp and paper derive from chemicals used or by-products, and include: alcohols, aldehydes, benzene, ketones, polyaromatic hydrocarbons (PAH) and phenolics. Simons cites a US list which pinpoints acetone, ammonia, chlorine, chlorine dioxide, chloroform, formaldehyde, hydrochloric acid, methanol, sodium hydroxide, and sulphuric acid as trace air contaminants of concern.
http://www.olympus.net/community/oec/dthrt.htm- heart disease and other impacts from air pollution, particularly the plume of the former pup mill in Port Angeles, WA. 4.10.2. State Air Quality Strategy Excerpt (source:
http://www.dpiw.tas.gov.au/inter.nsf/Attachments/CDAT-6FA759/$FILE/Draft%20TAQS.pdf [Accessed 01 September 2006].
Industrial Sector
2.4.1 Effective Regulation of Industrial Emissions Objective 11 Ensure effective regulatory control of industrial emissions by:

36
a) Integrating airshed capacity as part of the assessment of development applications for proposed new industrial activities and major upgrades of existing activities; b) Training Local Government and industry on the use of the Tasmanian Air Pollution Potential Atlas and to evaluate proposals for new or upgraded point sources; c) Regulating industry emissions consistently; and d) Taking appropriate enforcement action against industries that consistently fail to meet regulatory requirements in regard to emissions to air. Current industry regulation system
Large point source emitters of particulate air pollutants have historically been subject to greater degrees of regulation than diffuse sources such as domestic wood burning. State and Local Government controls the air emissions of industrial activities through permits and environment protection notices. Currently, emissions from industries, otherwise known as point-source emissions, are regulated under the general provisions of the Environmental
Management and Pollution Control Act 1994 (EMPCA) and the Land Use Planning and
Approvals Act 1993. Responsibility for the regulation of industry is divided between Local and State Government according to the level of environmental risk and scale of the activity. There are three levels of activity as defined by EMPCA: • Level 1:
Regulated by Local Government and are generally smaller sized, or low environmental risk activities. • Level 2:
Defined in Schedule 2 of EMPCA and are regulated by State Government. • Level 3:
Defined as activities of State significance and are assessed by the Resource Planning and Development Commission and then regulated as for Level 2 activities. Both the Environmental Management and Pollution Control Act 1994 (EMPCA) and the Environment Protection Policy (Air Quality), referred to as the Air Quality Policy, include powers and guidelines for Environmental Impact Assessment (EIA) of proposed new activities with the goal of achieving sustainable development. Similarly, the Act and the Policy provide mechanisms to allow State and Local Governments to require existing industries to make improvements in accordance with the concept of Best Practice Environmental Management (BPEM), where such improvements are practical and economically reasonable requirements given the degree of environmental risks involved. Difficulties can arise in making such value-laden judgments, particularly when assessing proposed and existing activities in isolation from one another. The Air Quality Policy also provides for the use of the concept of “reserve capacity for airsheds” in making regulatory and assessment decisions. (Airshed reserve capacity means how much room a particular airshed has to accept further loadings of air pollutants without compromising accepted air quality criteria). As part of this Strategy, a project commenced in August 2004 to develop a comprehensive Tasmanian Air Pollution Potential Atlas (TAPPA). This project aims to combine sophisticated modelling using TAPM software (developed by CSIRO Atmospheric Research) with results of air quality monitoring and inventory estimates across Tasmania (see Section 2.2.1: Air Quality Monitoring and Forecasting). Furthermore, the Air Quality Policy establishes a waste avoidance philosophy towards wastes emitted to the atmosphere. This requires that all practical measures be taken to avoid the
37
emission in the first instance. Where an emission is unavoidable, Accepted Modern Technology (AMT) should be applied to reduce emissions. For example, those industries regulated by State Government that employ combustion processes are generally required to conform to an in-stack particulate emission guideline of 100 mg/m3. The in-stack guideline is arguably set at an appropriate level given achievable performance from modern technology. The testing required to measure compliance against this standard is costly and not trivial to conduct. Whilst stack testing provides only a very short snapshot of the operation examined, it provides a useful indication of emissions to atmosphere.
Airshed management The Air Quality Policy defines a clear principle for retaining reserve capacity within airshed by limiting point source emissions that would prejudice compliance with the National Environment Protection Measure (Ambient Air Quality) [Clause 11(1)(b)], with some exceptions [Clause 11(1)(c)]. This provides authorities with the ability to address the quality of the air in the whole airshed, rather than dealing with each industry proposal on an individual basis. For example, a new proposal for a wood-fired boiler or other combustion process that could emit significant quantities of PM10 into an already compromised airshed such as the Tamar Valley, would require authorities to place stringent conditions on any permit issued to the proponent. In an area such as Launceston, where the air quality is seriously compromised by particulate pollution, several options are possible: • a blanket ban on new particulate sources within the Valley; • careful assessment of proposals within the context of existing air quality, which may result in: • very tight emissions specifications, beyond those set out in Schedules 1 and 2; • insistence on alternative energy sources, such as gas or electricity; • refusal to allow a new source into the area; • economic disincentives for solid fuel combustion and incentives for adoption of gas or electricity; and • adopting a cleaner production approach, investigating ways to minimise energy consumption or other production of particles through process changes and efficiencies (see the following Section 2.4.2 Cleaner Production Programmes). Under the airshed approach, proponents would have to demonstrate that a point source would not add an unacceptable increment to the pollution loading of the airshed. As noted above, the Policy defines a clear test for acceptability as the likelihood of air pollution levels exceeding the relevant National Environment Protection Standards and Goals. The Tasmanian Air Pollution Potential Atlas is seen as providing useful background information to regulators and consultants when assessing whether compliance with the National Environment Protection Standards is likely to be prejudiced by a new point source within an airshed. One approach to this problem is to use such an atlas to define zones where airshed capacity is already seriously compromised, so that further reductions in air quality can be avoided. However, careful consideration needs to be given to the potential for equity or economic issues that may arise from such a system, where zones acquire “labels” that may affect house prices, tourism and other socio-economic aspects. It must be recognised that it is not normally sufficient for proponents to demonstrate that they meet in-stack emissions concentrations cited in Schedule 1. The Air Quality Policy [Clause11(1)(a)] makes it clear that the stack concentrations are guidelines, expected to be achievable with Accepted Modern Technology. As such, they are to be used as default values where no other information is available. Furthermore, as they define in-stack concentrations, they can only be used in conjunction with other data, such as volume flow

38
rates, to estimate mass emission rates. However, these mass emission rates are important when considering incremental impacts on air quality within an airshed. In terms of direct impact, more emphasis is placed on Schedule 2 Design Criteria, so-called because they are usually invoked in the design stages for new plant. Under the Air Quality Policy, proponents are required to demonstrate that they can meet these criteria before a permit can be issued. Our submission is clear, the RPDC must reject the draft IIS as it fails to adequately address guideline areas associated with air quality impacts.
39
Section 5. Economic Issues: An analysis of the Allen Consultancy Report for the
draft IIS prepared by Gunns Ltd for the proposed pulp mill in the
Tamar Valley
5.1. Introduction
The report prepared by the Allen Consulting Group conducts an analysis of the likely direct and indirect economic impacts of the proposed pulp mill in the Tamar Valley. The pervasive economic impacts have been estimated using the MMRF-Green model, operated by the Centre of Policy Studies at Monash University. This model is claimed to be the most comprehensive economic model available in Australia. As with all models, it is only as comprehensive as the data put into it. In this case, the data input into the model is of minimal value as it only looks at the positives of the mill, it does not include the negatives. The model makes many assumptions including: economic results presented relative to a base case when no new pulp mill investment is made; no economic modelling predicted past 2030 due to concerns for increasing uncertainty; and calculations between 2007-2030 period are discounted at a real social discount rate of 5%. From the modelling, underpinned by assumptions such as those discussed above, the Allen Consulting Group suggests that the pulp mill would yield substantial positive benefits to Tasmania and Australia in the form of greater economic activity and employment. The veracity of the Monash model through a gap analysis must be made by the RPDC to check the conclusions reached by the by the Allen Consulting Group report. The LEC has not been able to conduct a thorough enough analysis due to time and financial constraints. Therefore, the following section of the LEC submission is split into two sections. The first provides an overview of the many economic inconsistencies found within the Allen report. The second covers in more detail the reasoning behind our summary points. This is an extremely specialised area, but from the economic advice received by the LEC, the report written by the Allen Consulting Group is full of gaps, and the data input into the Monash model is wholly inadequate as it fails to include any analysis of possible negative impacts from the proposed pulp mill. It is fairy-land economics to assume no negative impacts will be made to the Tasmanian economy by this proposed project. Therefore, the RPDC must employ an economic specialist to check the veracity of the report with the following summary points used as a minimal checklist as the foundation of the analysis.

40
5.2. Overview of areas needing more work in the economic modelling
� Are the large economic gains predicted to occur to Tasmania real or fantasy economics?
The Allen Consulting Group’s report specifies extreme ‘uncertainty’ over economic predictions past 2030, which account for approximately 1/3 of the lifespan of the proposed project.
� The report as it stands does not examine negative consumptive economic effects as a
consequence of constructing the proposed mill. Such negative consumptive impacts could include significant demographic changes as a result of the sea changers who have moved to the valley from the big cities for lifestyle reasons leaving the region. Wealthy retirees who have moved to the Tamar from the mainland cities will leave the region if the mill is built.
� The Allen Consulting Group’s dismissal of the growing tourism industry in the Tamar
region is bizarre. Tourism surveys indicate one of the primary reasons for people visiting Launceston is to tour the Tamar Valley wine route. It has been estimated that only a 10% drop in the number of tourists visiting the Tamar region will cost the local economy $753 million over the first 20 years of the projects life (Naomi Edwards 2006).
� The above comment is indicative of the gaps to be found throughout the Allen report. The
real growth areas in the Tasmanian economy have been ignored and no contemporary data was input into the model, such as the Australian Bureau of Statistics information which shows that employment in the number of people employed in property and business services grew by 73% where as those employed in the agricultural, fishing and forestry sectors declined by 20% in the last 10 years.
� Negative impacts upon other developments in Tasmania have not been factored into the
economic output derived from the pulp mill. There is approximately $3 billion of other potential investments to be made in Tasmania aside from the pulp mill. The Allen Consulting Group's report has not taken into account, beyond a brief summary, how the development of the pulp mill may ‘crowd out’ this other development potential.
� High skill shortages both in Tasmania and on the mainland needs further consideration
and what impacts this may have upon other investment in Tasmania and the mainland. An economic analysis of the proposed mill should therefore examine “output gaps”, the “true potential” for the economy of Tasmania and what affects the shortages of skilled labour and price rises for raw materials will have upon other investments in Tasmania.
� The Monash model discusses the significant tax revenues that will flow through to the
Tasmanian government as a consequence of the mills operations. However, the Allen Consulting Group did not offset this against tax payer subsidies. Subsidies that need to be considered are the upgrade of the East Tamar Hwy plus an assessment of the wood supply contract (stumping charges/subsidies). Ongoing subsidies will cost the Tasmanian community $700 million over the first 20 years of the projects life. Therefore, the cost of the subsidies must be set against government tax revenues for a real ‘net’ value to be identified.
� Plantation tax schemes (MIS) need to be considered to see just how important investor
tax deductions will be for the project to succeed. An assessment needs to be made in real terms as any changes to such schemes would impact upon the availability of timber resources to feed the proposed pulp mill. Changes to the tax scheme are currently under review by the Federal Government.
41
� Living standards in Tasmania are not lower than those of mainland states, the standard of
living in Tasmania is not decreasing in relative terms and per capita domestic product on its own is an inappropriate indicator of standard of living.
� Nor is the economy of Tasmania at risk or in decline. There is no urgent need for a
solution. If the pulp mill proposal is for any reason unacceptable then the State economy will not move into decline. The doom and gloom picture painted by the Allen report is unrealistic as the assumptions above have not been factored into their modelling.
� The current state of Tasmania socially and economically is not sick or in desperate need
of rescue and Tasmania is in a position to assess the proposal and with or without negotiated amendment accept or equally reject the intended development without prejudice to its continued economic and social health.
� The $58 million annual ongoing contribution the mill will provide for northern
Tasmania needs to be verified as overseas experience demonstrates that economic impacts in community surrounding pulp mills is minimal.
5.3. Detailed discussion on economic issues Impact on Gross State Product and Gross Domestic Product. 1. At Section 8.1 in the Allen Report, the Allen Group speak of “converting exports of
woodchips into exports of pulp.” That element of substitution does not appear to be reflected in Section 8.6, Figure 8.6, page 23, in Section 8.1, Table 8.1 page 2 nor in any other Domestic Product numbers quoted throughout the Report.
2. To the extent there is substitution and the effect of the decrease in export wood chips has not
been adjusted against the impact of the proposed new pulp mill, the statistics quoted must be wrong and the impact overstated.
The basic premise of the IIS includes:
3. Tasmania’s economy will otherwise be in decline. Refer section 8.1 paragraph 1, section 8.3
and figure 8.1 4. It is implied that the only solution is a major development such as the proposed pulp mill.
This same sentiment was proposed by Access Economics in its Business Outlook Report of June 2005 (publicly refuted by the Tasmanian Government) which said: “The best investment scenario for the State is that the void be filled by the $1.3 billion Gunns pulp mill.”
5. Lower Gross State Product per capita in Tasmania compared to national Gross Domestic
Product per capita means a lower standard of living is enjoyed by Tasmanians. Reference again the first paragraph of the Summary of Key Results and section 8.3 page 6.
Question of a lower standard of living in Tasmania:
6. Anecdotally no one in Australia and certainly no one in Tasmania would acknowledge that
Tasmanian’s endure a lower standard of living than Mainland Australia; to the contrary.

42
7. Refer Living Standards Management Study of the World Bank, Information and Research Services of the Department of the Parliamentary Library Brief No 4 of 2000-01. There are many factors to be considered when measuring standard of living. One of those is gross domestic product, but there are many others including the per capita income, population, infrastructural development, stability (political and social) etc.
8. The issue is addressed annually and more comprehensively in the Tasmanian State
Government Budget Papers and the State Government publicly refuted the Business Outlook Report of June 2005 quoted above. It is not satisfactory for a report as significant and allegedly comprehensive as the Economic Impact Assessment report of The Allen Consulting Group to reach a conclusion of lower living standards on the basis of such a superficial analysis.
9. The numbers presented in the report reflect simply that Tasmanian growth in Gross Product
terms lagged the national average in the 5 years ended 2001 and exceeded that average in the 5 years ended 2006. In Tasmania there is neither a pervasive feeling of pending economic doom nor concern that some urgent solution to a perceived problem is needed; nor should there be. During parliamentary debate of the last State Budget there was neither expression of concern by the opposition parties nor indication of a need for caution from Treasury. Again any Tasmanian resident or business asked to reflect on the past 10 years or 50 years would not speak of low economic performance or the experience of general hardship relative to other countries or Australian States.
10. The Allen Group’s numbers disclose that over the 10 year period the National GDP grew by
an average rate of 3.7 per cent per annum whilst the average for Tasmania in the last 5 years has been 3.9 but over the total 10 year period. The Allen Group’s figures are therefore misleading when they state that: “Australia’s national average rate of growth of GDP over the same period was nearly twice as great.” There is an implied but unwarranted expression of a need for alarm or urgency.
11. The following is the comment provided by the State Budget for 2003 on Tasmania’s
economic performance of the previous 5 years. That period 1999 to 2003 is selected as representing the time of greatest concern to The Allen Consulting Group who infer that the State economy will revert to those levels if the pulp mill proposal isn’t implemented.
12. Having defended their economic management of the State against the criticism felt by the
State Government in response to the Access Economics Business Outlook Report of June 2005 and given the interpretation of Tasmania’s economic performance enshrined in successive annual budgets it would be inappropriate and contrary to the best interests of Tasmania if the sense of urgency of the State’s economy and anticipated impact of the pulp mill was now accepted by Tasmania as valid.
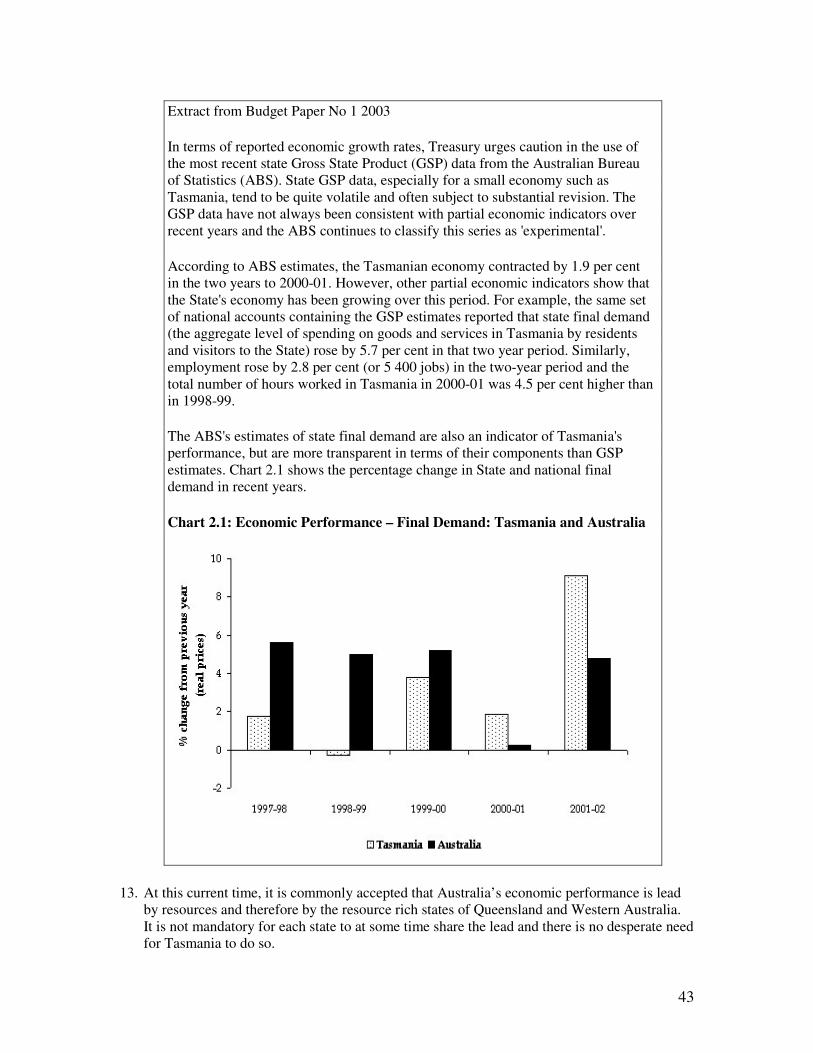
43
Extract from Budget Paper No 1 2003
In terms of reported economic growth rates, Treasury urges caution in the use of the most recent state Gross State Product (GSP) data from the Australian Bureau of Statistics (ABS). State GSP data, especially for a small economy such as Tasmania, tend to be quite volatile and often subject to substantial revision. The GSP data have not always been consistent with partial economic indicators over recent years and the ABS continues to classify this series as 'experimental'.
According to ABS estimates, the Tasmanian economy contracted by 1.9 per cent in the two years to 2000-01. However, other partial economic indicators show that the State's economy has been growing over this period. For example, the same set of national accounts containing the GSP estimates reported that state final demand (the aggregate level of spending on goods and services in Tasmania by residents and visitors to the State) rose by 5.7 per cent in that two year period. Similarly, employment rose by 2.8 per cent (or 5 400 jobs) in the two-year period and the total number of hours worked in Tasmania in 2000-01 was 4.5 per cent higher than in 1998-99.
The ABS's estimates of state final demand are also an indicator of Tasmania's performance, but are more transparent in terms of their components than GSP estimates. Chart 2.1 shows the percentage change in State and national final demand in recent years.
Chart 2.1: Economic Performance – Final Demand: Tasmania and Australia
13. At this current time, it is commonly accepted that Australia’s economic performance is lead by resources and therefore by the resource rich states of Queensland and Western Australia. It is not mandatory for each state to at some time share the lead and there is no desperate need for Tasmania to do so.
44
14. Having devoted so much attention to the issue of rate of increase in gross product and the impact on standard of living, the Allen Group then concedes at page 23 section 8.6 that the proposed pulp mill is not in any case a solution to the perceived problem they so fastidiously describe:
“Only small growth is expected to be observed in the ratio of Tasmania’s GSP to Australia’s GDP. The model projects a small 0.1 per cent change in this ratio relative to current levels.”
15. Given that the Tasmanian economy and Tasmanian living standards are not in a state of
decline or desperately needing redemption, any impression that the pulp mill or a similar large project is urgently needed can be disregarded and the pulp mill proposal is then dependant on its own merits not Tasmania’s need.
16. Nor is there any commercial benefit in a large project compared to an equivalent number of
small enterprises (refuting point 4 above). A better argument is that smaller developments provide spread of risk.
Tasmania’s Economy demograph: 17. Any economy must logically be keen to entertain a new industry of the size of the proposed
pulp mill. The Allen Report makes that assessment difficult as it labours non-issues and arguably omits others. The following points under this heading seek to address some of the remaining issues associated with the Allen Reports commentary on the Tasmanian economy.
18. Figure 8.2 on page 7 of the Allen Group report makes reference to Tasmania’s low
population growth and ratio of population to GSP which is the same statistic as quoted earlier in the Report as per capita average GSP and then conclude that the “Tasmanian economy ‘punches below its weight’ in economic terms relative to it size. As already described in this submission that conclusion is contrary to the view of Tasmanians and of the Tasmanian Government and Treasury. To briefly explore that statistic, if hypothetically the population of Tasmania included a proportionately higher number of self funded retirees the statistic quoted would be negatively impacted but whether self funded retirees are resident in Queensland or Tasmania surely has no real consequence for the economy of Australia. Therefore on what basis does the Allen Group conclude that the “Tasmanian economy punches below its weight’”?
19. There is no unemployment issue specific to Tasmania. Issues specific to health and education
workers and essentially the need to attract those and other professional people to Tasmania are ongoing and have for some time been under discussion at a government level (refer for example “The Competition Index a State by State Comparison prepared by the State Government in May 2000 which at page 10 analyses the skills shortage). The flow of young people away from Tasmania is subject to continuous debate and has been for some generations now. The proposed pulp mill in the Tamar Valley does not purport to address these issues. The Allen Report acknowledges simply that currently Tasmania’s unemployment and jobs growth statistics are nationally competitive.
20. Again, any impression that Tasmania needs the jobs created by the proposed pulp mill is
unsupported by the Allen Report. What may be true is that Gunns Ltd. needs Tasmania and in the pursuit of its own corporate goals is dependent on the exploitation of Tasmania’s natural social and human resource.
45
21. The definition and treatment on page 10 of the Allen Report of STMs (simply transformed
manufacturers) is a use of technical jargon to dismiss critical aspects of the Tasmanian economy and specifically characteristics of the Tamar Valley. The demographic of Tasmania and specifically the Tamar Valley is inadequate. As a tourist destination Tasmania’s reputation far out ways actual performance. For example, The Examiner Newspaper on 13 July 06 reported US Travel Magazine’s World Best Travel Award to Tasmania as the number one destination “ahead of well known Fiji, Tahiti,…”. Currently the revenue per visitor night from tourism earned by Tasmania is a small fraction of that enjoyed by Tahiti and given that level of reputation the future potential of that industry is significant and importantly in accordance with the Tasmania Together philosophy tourism enjoys a competitive advantage. It is also an industry in which we have not exploited our potential or even recognised the competitive advantage of reputation as for example published by US Travel Magazine.
22. In the last calendar year Tasmanian grapes were in under supply whilst areas of mainland
Australia experienced the opposite. We have a clear competitive advantage from our cold climate vineyards and again future growth potential. In both-areas, wine and tourism, we have not yet achieved levels of success comparable with New Zealand and the potential for that growth is not questioned. These industries, micro agriculture, aquaculture and others are specifically referenced in the State Government budget and economic reports including the Competition Index a State by State Comparison prepared by the State Government in May 2000.
23. As stated by the Allen Report, Tasmania, like Australia nationally, enjoys the majority of its
export income from commodities including woodchips and the argument in favour of down stream processing isn’t in dispute. The question is whether the proposed pulp mill is an appropriate investment in down stream processing for Tasmania.
Impact of the Project Not Proceeding (refers section 8.8 page 49 of the Allen report) 24. If all of the claims made by the Allen Group are accepted at face value it does not follow that:
“If the project were not to occur, none of these social and economic benefits would be realised.” The same resource that attracts Gunns including labour, water and of course a unique timber resource remain.
25. The Allen Group state that in this instance: “Tasmania’s employment profile would roughly
be similar to current rates and trends, as Gunns would continue to produce forest and wood products as it currently does”. Do they imply that future employment is dependant only on Gunns and there is zero potential for any other enterprise; tourism, wine, fishing or aquaculture for example, to grow? In reality there is no reason for the Tasmanian Government and the people of Tasmania to be less optimistic than was the case previously.
26. The disdain for the value of the Tasmanian resource which the proposal seeks to exploit is
exemplified by the statement that: “After a negative experience with this project and the previous decision on Wesley Vale, it would seem very unlikely that any other investor would develop a major investment proposal in this industry again.” It is a simple historic reality that the former Wesley vale development was proposed on the basis of technology which was environmentally unacceptable to Tasmania and for the proponents of Wesley Vale higher technical standards were either not available or were not commercially feasible. This may well be the case with the present proposal and Tasmania should not be scared into submission by the unsupported statements that comprise the Allen Report.

46
27. Gunns would see their cause advantaged by any concern on Tasmania’s behalf that there may be no other possible applicant or perhaps they consider the expression of that unfounded concern in the wider community might assist their efforts to attract public support. However, at any point in time notwithstanding the history of prior proposals the commercial reality of a free market economy is that if or when it is technically possible and commercially attractive to utilise a resource in an environmentally acceptable manner others will seek to do so. An excellent example of the perseverance of commercial enterprise to meet the demands of supplier and or market is provided by the case studies of companies who over many years planned commercial enterprises in Vietnam and China and eventually succeeded. In those case studies the now successful companies often faced insurmountable odds but the potential gain from the investment justified their continued effort. The only reason the proponents wishes to exploit the resource offered by Tasmania and establish a pulp mill is the prospect of commercial advantage.
28. That for example tourism does “not offer such a potential for wealth” as stated by the Allen
Report is not supported by any of the analysis provided. It is equally arguable that in reality the potential of tourism, aquaculture and other primary and secondary industry might be greater. It certainly appears to be the case that these less publicised future options for Tasmanian development have real competitive advantage, not threatened by third world economies of Chile and others.
29. There is no worse consequence of the failure of the proposed pulp mill to proceed than was
experienced as a consequence of the rejection of the Wesley Vale proposal to which the Allen Group refer. The Allen Group offer no support at all for their contention that the Tasmanian economy or living standards have suffered as a consequence of that rejection nor have subsequent economic reports or Government budgets indicated let alone lamented the consequences of that decision. To the contrary the annual Treasurers report to Tasmania has expressed satisfaction and success and in the main that contention has not been found vulnerable to challenge by opposition scrutiny in parliament.
30. The important conclusion is that there is no negative economic or social consequence from
the failure of the proposal to proceed. No matter how attractive the proposal, prudent investment principle dictates that no single investor can enjoy 100% of the available sound investments (in this instance the Gunns Pulp Mill investment may be enjoyed by a Mainland state of Australia or another country such as Chile) and the process and principle of prudent analysis and selection must take priority. There is no reason for the Tasmanian community to be scared of missing out.
What are the most significant socio economic concerns for Tasmania associated with the
project and how are they addressed by the Allen Report? 31. Those who seek to independently assess the Allen Report have no independent access to the
chosen or alternative financial modelling systems which is not of major concern because if the project proceeded and the additional employment in trade and accommodation achieved only 120 in year 2008 rather than the 1,200 projected by the Allen Group’s modelling (refer page 45 immediately below figure 8.22) no one would worry. From the viewpoint of Tasmania, the profitability enjoyed by Gunns Ltd. and the flow on benefits to other businesses cannot be too high. What might have been hoped for from the IIS is greater analysis of the downside risks for Gunns Ltd. and for direct suppliers including logging contractors and consideration of possible negative impacts on unrelated Tasmanian businesses, the economy and lifestyle currently enjoyed. Without intending disrespect, the Allen Group is paid directly by Gunns Ltd. and arguably a more impartial report might have been possible had their funding been provided through the RPDC and had the reporting been directly to the RPDC. There has to be a perceived lack of impartiality.
47
32. The likelihood of a negative impact on Tasmania’s emerging tourist industry and others is not
contemplated by the IIS. Where the published reason for discharging fluid waste into Bass Strait rather than the Tamar estuary is to avoid any perceived environmental impact on the tourism industry, what other characteristics of the proposal might have a perceived environmental impact that might negatively affect the Tourism industry and how does the modelling system assess that impact? As another simple example, when the Trevallyn Dam was constructed the published environmental impact on the river was at that time assessed as zero because the flow of water into the estuary remained constant. That is, all that changed was that some proportion of the water which previously flowed from the South Esk River into the Tamar estuary would now flow through the power station outlet into the same river. It is now proposed that same water will be piped to the Pulp Mill and into Bass Strait which clearly has a perceived impact on the estuary. As much as the perceived economic impact on tourist operators of the method of liquid effluent was considered, it is appropriate for the Allen Group report to reflect on and quantify the possible economic impact of the choice of water source on those same tourist operations. In general the fact that at this stage the pulp mill proposed is perceived as technically less than the best possible has the same negative impact on the image of excellence and the developing tourism reputation of best location. It is certainly not consistent with the strategies of Tasmania Together to draw an analogy between the Tasmanian Tourism industry and Gladstone. The statement that “it can be assumed that drive-by visits to the mill will be a key element of visitation to the Tamar Valley” (Page 44) like many similar assumptions, is unsupported. A proposal by an intending tourism operator to provide a facility based on that level of evidence (a mere assumption) would be immediately rejected. If it is competent for the IIS to assume a positive outcome for the tourism industry it is equally incumbent on them to contemplate the abundance of evidence similar to that recognised when Gunns Ltd. made their decision that in the interests of tourist operators liquid effluent should be piped into Bass Strait, and on that basis predicate possible negative impacts on Tasmania’s potential tourist revenue. In the IIS there is no downside assessment or risk management disclosure.
33. The RPDC is asked to assess the economics of a single proposal by a single operator in the
absence of any tender process and knowing that the operation for all practical purposes will be a monopoly. Presumably, there is more information about incomes and costs made available to the RPDC than to the general public but notwithstanding that, in the absence of local competition, the RPDC is of necessity, dependent on the proponent for explanation of technical and financial data as will the State Government is dependent in any future negotiation. Is that an issue of finance and governance that is albeit inadvertently hidden?
34. A foreman for a Tasmanian owned building company expressed his concern that Tasmania’s
direct and indirect investment and unqualified parliamentary support for the proposal was a massive weakness. He said: “In my industry for example, quoting on the construction of a hospital my company knows that it is competing against Gunns Ltd. and others and therefore that nothing can be hidden and that major discrepancies will more than likely be self evident in the comparison of quotes. Likewise, the quality of construction is open to investigation by opposition firms who have the same technical expertise. In respect to the Pulp Mill the Government appears totally dependent now and in future on Gunns Ltd. to disclose any information. Wouldn’t it be better if as a consequence of Tasmania’s investment and approval of the development, there was an element of State ownership giving the government the same access to information as is and will be enjoyed by Gunns Ltd. under its present or any future ownership?” The possible social and economic impact on Tasmania of governance issues in the approval, construction and continued operation of the proposed pulp mill is not addressed in the Allen Group Report.

48
35. Whilst much of the sentiment described by the Allen Group Report reflects Gunns Ltd’s Tasmanian heritage and presumed loyalty, it is a publicly listed company and therefore ownership and directorship may change at any time and without any input from the Tasmanian government. Accordingly, the reference to supporting Tasmanian employees and suppliers must be disregarded because there is no such responsibility imposed by reason of the acceptance of the proposal and in practice the directors will pursue the best interests of the shareholders and the company as is their fiduciary duty. In the absence of a specific contract they have no obligation to Tasmania. By way of example, the Tasmanian directorship has already publicly expressed its preparedness to take the proposal elsewhere if their terms are unacceptable to Tasmania. Any loyalty to Tasmania should not be expressed or implied by the Allen Group Report.
36. Specifically, Gunns Ltd. have publicly stated that if the current proposal is not acceptable to
Tasmania they will relocate the project to mainland Australia or Chile. What are the anticipated future consequences on price of product or raw material as a consequence of competition from economies such as Chilli ,particularly given that countries having similar resources to Tasmania can in some if not all respects be described as ‘third world’ and are therefore capable of imposing extreme price pressure? Not addressed by the Allen report.
37. What would be the cost and consequence to Tasmania if the project fails? We are aware of
closure of industry recently at Georgetown and historically that incidence has not been uncommon. This proposal is described as massive and presumably the impact of its demise would be proportionately destructive to the economy and society of Tasmania. Not addressed by the Allen report.
38. There has already been publicly published opinion expressed by financial analysts advising
investors in Gunns Ltd. that the proposal will have a negative effect on their investment. It is known that the woodchip industry already suffers from competition with suppliers such as Chile and that as a consequence logging contractors for Gunns Ltd. must cope with fluctuations in demand of the order of plus or minus 20% to 40%, which anecdotally has had a significant negative impact on those business enterprises and the dependant Tasmanian families and suppliers. The draft IIS includes no analysis of variations in units of production or unit price. It isn’t possible that Gunns Ltd. has proceeded to this stage of their investment without that advice and it must surely be appropriate for the RPDC to be advised of the best and worse case scenarios including the possible impact of escalating costs and similar commercial contingencies. The draft IIS includes no analysis of variations in units of production or unit price and the impact of those variations on contractors and service providers whose business enterprise may be totally dependent on the proposed pulp mill. The Allen Group Report does not address any such possible impact on committed external contractors and suppliers.
39. Alternative investments for Tasmania need not be subject to the same high level of
competitive constraint and might enjoy real strategic competitive advantage commensurate with the philosophy of striving for excellence advocated by the Tasmania Together strategic document. Obviously it is not a requirement for the Allen Group to comment on alternative current and future investment available to Tasmania but in assessing the economic and social impact of the proposal hopefully that assessment will be deemed mandatory by the RPDC.
40. In that context (point 39) it is hoped the RPDC will dismiss the myth that one large project is
automatically superior to many small. As a theoretical example and it is stressed that the Allen Group modelling is equally theoretical, 7,000 acres of vineyard or 200 small wineries costing very conservatively at $200 per acre is an equivalent investment to the proposed Pulp Mill. To anticipate that level of expansion of that single industry is no doubt unrealistic but it need not be generated by a single industry and the point that is made for consideration by the

49
RPDC that the downside economic and social impact of 200 small businesses is insignificant compared to the horrendous consequence of the failure of the proposed pulp mill. In the interests of Tasmania it is an issue to be addressed by the RPDC. Equally and without prejudice, the RPDC might consider the vulnerability of Tasmania to the closure of the proposed pulp mill compared to the impact that event would have on perhaps a larger economy such as Western Australia.
41. What happens at the end of the mills economic life of 30 years and what concern is there
associated with the “increasing uncertainty of outcomes over long time frames” (the year 2030) described by The Allen Group? Not addressed by the Allen report.
42. The Allen Report makes no reference to the issues currently confronting the timber and forest
industry in Tasmania in which anecdotal evidence is that contractors are oppressed and evidence from the public press is that the issues associated with the industry are divisive. It is hoped that the RPDC will consider that aspect of the forest based industries when forming its opinion and in that context call evidence, if it is not already provided from independent sawmill, speciality and fine timber enterprises.
43. It is regrettable from an economic viewpoint that the costing and comparative attributes of
alternative technologies was not presented to the RPDC and that consequently the Allen Group Report denies Tasmania the opportunity to consider those alternatives including the possibility of funding or compensating financially. It is hoped that the RPDC will accordingly seek that evidence from the proponents as they must have made the assessment of alternatives itself and in the context of seeking Tasmania’s support of its monopoly should be prepared to be transparent with the RPDC in this regard.
It is clear from this section of our submission that the draft IIS has completely failed to address the RPDC guidelines 8 to 8.7. Therefore, the RPDC has no choice but to reject the proponent’s case in these guideline areas and insist on significant economic consideration being made to possible negative economic impacts that will be made upon the Tasmanian economy should the proposed pulp mill in the Tamar Valley be approved.

50
Section 6
Impacts from an increase in truck movements on road infrastructure The LEC’s analysis of the RPDC guidelines relating to 7.9.6 is based on a review of the GHD Pty Ltd. Transport Assessment report contained in the draft IIS.
6.1. Inconsistencies in the GHD Report The RPDC should recommend a more thorough analysis of likely increases in truck movements in the Tamar region due to a number of apparent inconsistencies in the GHD report. These are:
• In a statement in the Examiner newspaper on August 9, 2006, Gunns Ltd. chairman John Gay said that caustic soda used in the Mills operation will arrive at the Bell Bay berth but in the GHD report it says the caustic soda would arrive by road. The report indicates there will be an extra 12 trucks a day needed for this transportation. Clarification is required.
• The report indicates that to fuel the boiler, 78 trucks a day would be needed to service the mill, but in other parts of the report it says only 67 would be required. Clarification is required.
• No truck calculations are made on the number moving between the mill and the proposed landfill facility.
• There is no information in the report outlining current log truck movements making a real comparison or estimated impact extremely difficult. The RPDC should insist on these figures being made publicly available.
• The report says the preferred strategy of transporting logs is via a mixture of rail and roads. However, Gunns Ltd. has no agreement with Pacific National and there is no indication that one will be made in the near future so the preferred option to transport logs to the proposed mill is impossible to implement. Further, there is no rail infrastructure from many of the areas to be logged so the suggestion that the logs could be transported via a mixture of rail and roads is a red herring and should be dismissed as one by the RPDC.
• No estimation of cost to infrastructure is made. The shortfalls and inconsistencies in the report are extreme, present a lack of transparency on behalf of the proponents and hides a significant cost that will be incurred upon the Tasmanian economy should the mill be approved.
6.2. Estimated cost to infrastructure A Deutsche Bank study estimated that a fully loaded log truck causes the same amount of impact to a road as 160,000 thousand cars. The draft IIS states that there will be up to 720 truck movements a day servicing the pulp mill. By 2021, 418 of these truck movements will be fully loaded log trucks. A fully loaded log truck causes the same amount of impact to a road as 160,000 cars (Deutsche Bank). Although no firm figures are available, Tasmania can have approximately 200,000 cars on the road at any one time. Therefore, the log truck movement to the pulp mill will be the equivalent of 66,880,000 cars travelling on Tasmania's roads at any one time.

51
The GHD Report has not commented on any of these impacts, and the overall IIS fails to acknowledge the added financial burden this will cause to the Tasmanian economy. Therefore, the RPDC must insist on further analysis on this matter to identify the true impact from all the log truck movements on Tasmania's roads. The analysis must include what this will cost the State and local councils. Further, an investigation into the likely impact upon increased fatalities as a consequence of the added trucks on Tasmania's roads must be conducted. Based on this section of the LEC submission, the RPDC should insist on a new assessment of road traffic impacts that will be caused by the proposed pulp mill.

52
Section 7
Pulpwood supply-hardwood and softwood
7.1. Unacceptable vagueness surrounding native forest harvesting The draft IIS guidelines prepared by the RPDC state that the proponents have to be clear on how much native forest will be used as a resource for the pulp mill. The proponents state in the draft IIS that total ‘intake of pulpwood and residues to the mill… [is] anticipated to be in a range of 3.2 to 4 million green metric tonnes per annum… [and] 3.75 million tonnes will be logs’ (Gunns 2006, Pulpwood Supply). The RPDC guidelines also require the proponents to detail where feedstock for the mill will be sourced from outside of the Tasmanian Regional Forest Agreement (as amended). The proponents state that they will not be sourcing feedstock outside of the Tasmanian Regional Forest Agreement (as amended) (Ibid). The RPDC guidelines also require the proponents to detail how the mill will source its feedstock after the Tasmanian Regional Forest Agreement (as amended) expires in 2017. The proponents argue that this is unlikely to occur (RFA to not be renewed), forests in national parks will continue to be protected and that they will comply with the applicable laws and continue with best practice sustainable forest management (Ibid). The areas discussed above represent a level of vagueness in relation to the harvesting of Tasmanian native forests that is wholly unacceptable and the RPDC should seek as a matter of urgency a greater explanation from the proponents on how they can better address these guideline areas. The LEC urges the RPDC to seek clarification on how the proponents can access so much feedstock within the framework of the Tasmanian Regional Forest Agreement as the resource is not available at that level under the terms of that agreement, especially because the pulpwood supply from plantations will only ever represent a maximum of 80% of the pulp mill resource base. The RPDC must also obtain from the proponents a greater level of detail on how they expect to obtain resources for the pulp mill should the Tasmanian Regional Forest Agreement (as amended) not be renewed in 2017. The RPDC would be negligent if that detail is not obtained as the proponents are relying solely on feedstock supplies within the terms of that agreement framework. On a number of occasions throughout the pulpwood supply document the proponents contest that the foundation of all their modelling and resource consumption, access and use has been conducted under the terms of the status quo. Failure to renew the Tasmanian Regional Forest Agreement (as amended) in 2017 will have implications on feedstock availability to the pulp mill so brushing the issue aside as the proponents have done so should not be acceptable to the RPDC. 7.2. Clarification on resource use
Significant differences in the literature exist pertaining to the level of feedstock required to produce 1,000,000 tonnes of paper pulp. The proponents’ claim that between 3.2 to 4 million tonnes of feedstock is needed to produce 1,000,000 tonnes of paper pulp. However, Clean Up Tasmania have stated that a Centre for International Forestry Research report indicates that
53
12,000,000 tonnes of feedstock is required to produce 1,000,000 tonnes of paper pulp (Barton 2006). Therefore, the LEC urges the RPDC to seek an urgent clarification on the major discrepancy between what the proponents argue and the Centre for International Forestry Research claim as the required levels of feedstock to produce 1,000,000 tonnes of paper pulp. Even if the truth lies somewhere in-between, the implications for forestry cover in Tasmania is immense. For example, taking a conservative approach and meeting the two research findings halfway at 8,000,000 tonnes of feedstock required to produce 1,000,000 tonnes of paper pulp then the proponents would have under estimated the level of resource requirement by 100%. As the recent error in the predicted level of dioxin discharged into Bass Strait from the effluent discharge pipe demonstrates the draft IIS contains major errors. Therefore, the RPDC would be negligent if it failed to seek clarification on this matter as the proponents have based their modelling of resource requirements at a maximum of 4,000,000 tonnes per annum which they describe as the sustainable level of harvest for Tasmania (Gunns 2006). Any increase above this figure makes the proposed pulp mill unsustainable and therefore fails to meet the guidelines specified by the RPDC and approval should be refused.

54
References
ASL Analytical Service Laboratories Ltd., Investigation of Chemicals and Bioaerosol Emissions From Pulp Mill Effluent Treatment Systems, Pulp and Paper Advisory Committee, Nov 1997
Amartya K. Sen, The Standard of Living (1987)
Astrakianakis, George, et al. Industrial Hygiene Aspects of a Sampling Survey at a Bleached Kraft Pulp Mill in British Columbia, AIHA Journal, Oct 1998, 694-705, Vol: 59
Barton, R (2006), Gunns mill threatens forest devastation, quoted in Green Left Weekly from http://www.greenleft.org.au/back/2006/683/683p24.htm accessed on September 20, 2006.
Broten, D. and Ritchlin, J. (1999). Pulp pollution primer. Reach for Unbleached Foundation: Vancouver (online). http://www.rfu.org/navigation/Librarydocs/PulpPrimer.pdf, accessed 01 September 2006. Canter, L. 1996. Environmental Impact Assessment. 2nd edition. McGraw-Hill Book Company, New York, NY. Commission for Environmental Co-operation, Taking Stock, Appendix C: Human Health Effects and Uses of Chemicals on the top 25 lists. Connell, D.W. (1997). Basic concepts in environmental chemistry. Lewis: New York. Dee, N., J. Baker, N. Drobny, K. Duke, T. Whitman, and P. Fahringer. 1972. An Environmental Evaluation System for Water Resource Planning. Water Resource Research, Vol. 9, pp. 523-535. Drew, R, and Frangos, J. (Toxikos) (2006). Human health risk and toxicological assessment of Bell Bay pulp mill air emissions. In Draft Integrated impact statement, Volume 10, Appendix 21 Gunns Ltd.. Gunns Ltd., Launceston. Economopoulos, Alexander P. 1993a. Assessment of Sources of Air, Water, and Land Pollution: A Guide to Rapid Source Inventory Techniques and Their Use in Formulating Environmental Control Strategies. Part One: Rapid Inventory Techniques in Environmental Pollution. World Health Organization, Geneva. Everitt, R.R., D.A. Birdsall, and D.P. Stone. 1986. Beaufort Environmental Monitoring Program in Lang, R. (ed.). Integrated Approaches to Resource Planning and Management. University of Calgary Press, Calgary AB. GHD (2006). Air quality assessment pulp mill emissions. In Draft Integrated Impact Statement,
Volume 9, Appendix 16, Gunns Ltd. Gunns Ltd. Launceston. GHD (2006). Greenhouse gas emissions. In Draft Integrated impact statement, Volume 9,
Appendix 20, Gunns Ltd. Gunns Ltd.: Launceston. Geoffrey Hawthorn, ed., The Standard of Living (1987). Gunns Ltd. (2006). DraftIntegrated impact statement. Gunns Ltd.: Launceston. Gunns Ltd. (2006), Pulpwood Supply, Launceston.
55
H.A.Simons Ltd., A Technical Background Information Document on Pulp and Paper Mill Air Emissions, BC Ministry of Environment, Oct. 1994. H.A. Simons Ltd. Consulting Engineers. 1992. Pulp and Paper Mill Feasibility Study: Phase I: Wood Supply, Environmental Screening, Site Assessment. Prepared for Advance Agro Group, Thailand. December 1997 Holling. C.S. (ed.). 1978. Adaptive Environmental Assessment and Management. John Wiley and Sons, Chichester. International Institute for Environment and Development. 1995. Directory of Impact Assessment Guidelines. IIED, London, UK. Jacques Whitford, Technical Review of the ARET release from the Pulp and Paper Industry, Environment Canada, Project No. 80011, April 19, 1999 Jamieson, Lynne, Occupational Health and Safety in Pulp Mills Using Chlorine, Chlorine Dioxide, Hydrogen Peroxide and Ozone, The Natural Resource Council of Maine Jan. 1997 Laidler, G. (1991). Environmental chemistry: An Australian perspective. Longman Cheshire: Melbourne. Lawrence B. Glickman; A Living Wage: American Workers and the Making of Consumer Society Cornell University Press. (1997). Leopold, L.B., F.E. Clarke, B.B. Manshaw, and J.R. Balsley. 1971. A Procedure for Evaluating Environmental Impacts, U.S. Geological Survey Circular No. 645, Government Printing Office, Washington, D.C. Lohani, B.N. and N. Halim. 1983. Recommended Methodologies for Rapid Environmental Impact Assessment in Developing Countries: Experiences Derived from Case Studies in Thailand, Workshop on Environmental Impact Assessment, Guangzhou, People’s Republic of China. Lohani, B.N. and S.A. Kan. 1983. Environmental evaluation for water resources in Thailand. Wat. Resource. Develop.1(3): 185-195. McHarg, I. 1968. A Comprehensive Highway Route Selection Method, Highway Research, Research No. 246, pp. 1-15. National Toxics Network (2006). Gunning down the spin: The dirty reality of pulp mill pollution. National Toxics Network. Norwood, R. (2004). Air quality strategy Tamar valley airshed consultation draft. Launceston City Council: Launceston (online). http://www.launceston.tas.gov.au/upload/2400/air-quality-strategy-3.pdf [Accessed 01 September 2006]. Occupational and Environmental Risk Management Group (COFI), Chlorine/Chlorine Dioxide: Review of Health Effects, Forest Industry Health Research Program, Feb. 1997 Peter R. Shergold. Working-Class Life: The "American Standard" in Comparative Perspective,
1899-1913 1982

56
Richard H. Steckel, "Stature and the Standard of Living," Journal of Economic Literature vol. 33(4), pp 1903-1940. 1995 Ritchlin, Jay and Johnston, Paul, Zero Discharge: Technological Progress Towards Eliminating Kraft Pulp Mill Liquid Effluent, Minimising Remaining Waste Streams and Advancing Worker Safety, Reach for Unbleached!, 1998
Sara Horrell; "Living Standards in Britain 1900-2000: Women's Century" in National Institute
Economic Review 2000. pp 62+
Sager, E. W. and Peter Baskerville, "Unemployment, Living Standards, and the Working-Class Family in Urban Canada in 1901" in History of the Family 1997, vol 2; # 3, pages 229-254 Shopley, J.B. and R.F. Fuggle. 1984. A Comprehensive review of current environmental impact assessment methods and techniques. J. Environ. Manage. 18:25-47. Thornton, J. (2000). Pandora’s poison: Chlorine, health, and a new environmental strategy. MIT Press: Cambridge, Massachusetts.
Westman, W.E. 1985. Ecology, Impact Assessment and Environmental Planning. John Wiley & Sons, Toronto, Ont.