exclusion zone as intermediate between ice and water · exclusion zone as intermediate between ice...
TRANSCRIPT

Exclusion zone as intermediate between ice and water
E. So, R. Stahlberg & G. H. Pollack Department of Bioengineering, University of Washington, USA
Abstract
The conversion of ice to water is a process riddled with enigmas. We tested the possibility that ice does not transition directly to water, but first to an intermediate phase that has been recently identified. That intermediate is the interfacial “exclusion zone” phase. The phase is characterized by strong absorption of light at 270 nm. We found indeed that as ice melts, a transient 270-nm absorption phase occurs, which eventually gives way to bulk water containing no such absorption peak. Hence, the results support the hypothesis. Keywords: exclusion zone, EZ, ice, UV-Vis spectroscopy, melting.
1 Introduction
Recent findings have shown the presence of an interfacial phase of water adjacent to hydrophilic surfaces (Zheng and Pollack [1], Zheng et al. [2]). This zone is surprisingly extensive, often hundreds of micrometers thick, and it has liquid crystalline features (http://www.youtube.com/watch?v=V7jKL2-B0QA&feature=related). The zone has become known as the “exclusion zone,” or EZ, because of its tendency to exclude solutes. The fact that ice is crystalline (Petrenko and Whitworth [3]) and the aqueous exclusion zone is liquid-crystalline (Henniker [4], Ho [5]) raises question about the possible relation between the two states of water. More specifically, a question is whether the EZ might be an intermediate between ice and water. In that case, ice would pass from its original crystalline state into the liquid-crystalline state before fully melting into bulk water. We found earlier that the liquid crystalline zone was easily detectable using UV-Vis spectrometry (Zheng et al. [2]). The EZ has a characteristic absorption peak situated at 270 nm. Bubble-free ice, on the other hand, has no 270-nm peak
Water and Society 3
www.witpress.com, ISSN 1743-3541 (on-line) WIT Transactions on Ecology and The Environment, Vol 153,© 2011 WIT Press
doi:10.2495/WS110011
(Perovich and Govoni [6]). The plan was to test whether a 270-nm peak was detectable as the ice melted into water.
2 Methods
All measurements were made at room temperature (22–23°C), and all experiments, unless specified, used de-ionized water from a NANOpure Diamond ultrapure water system, which has a resistivity value of 18.2mΩ·cm. De-ionized water from the dispenser was first collected in a 125 ml flask. The water was then boiled using a hot plate to expel most of the gas in the water. Once the water started to boil, the hot plate was turned off. When the water stopped bubbling, Saran Wrap was placed on top of the flask to prevent outside air from dissolving into the water. Once the flask was cool enough to handle, it was taken off the hot plate and allowed to cool to room temperature. This procedure was repeated again using a new flask and new water to obtain about 250 ml of boiled water.
2.1 Degassing
A degasser was set up to further remove dissolved air from the water. The water was transferred to the degasser after it had cooled to room temperature. The degasser consisted of a round glass flask put under a vacuum that had a stirrer to create a small vortex (see Figure 1). The vacuum was kept at a vacuum pressure of 15 Inches of mercury. The stirrer was connected to a motor, which rotated at a rate of 82 revolutions per minute. The spherical chamber was a standard taper 24/40 (24 mm outer diameter at the widest part of the joint, and 40 mm in joint length with a standard taper of 1:10) 500 ml container (Kontes). The degasser was allowed to run for 48 hours. After degassing, some of the water was transferred with a pipette into each of five plastic cuvettes (Brand Tech Scientific, No. 759070D, 4.5 ml) for freezing. More of the water was stored in a small 50 ml airtight container. The five plastic cuvettes were immediately sealed with Saran Wrap and rubber bands and placed in the freezer (Frigidaire, p/n 241543903).
2.2 Spectrophotometer and air-blower setup
To measure the absorbance of the water/ice, a UV/Vis spectrophotometer (Hewlett Packard 8452A Diode Array Spectrophotometer) was used. The spectrophotometer could measure wavelengths from 190 nm to 820 nm. A diagrammatic representation of the system is shown in Figure 2. For the setup, an air blower removed any condensation that would otherwise gather on the sides of the cuvette (see Figure 3). A tube was attached to a standard laboratory air valve. The tube later split into two pieces which had pipette tips at their ends to create a fast airstream. The two tubes were fixed into position above the spectrophotometer so that their tips would blow onto the sides of the cuvette where light entered and left.
4 Water and Society
www witpress com ISSN 1743-3541 (on-line) WIT Transactions on Ecology and he Environment, Vol 153,© 2011 WIT PressT

Figure 1: Degassing system. The water inside the airtight flask was slowly stirred while air was constantly sucked out of the chamber to create a vacuum.
Figure 2: Spectrometer setup. Light passed through the cuvette and to the spectrophotometer, which measured the amount of light absorbed.
Water and Society 5
www witpress com ISSN 1743-3541 (on-line) WIT Transactions on Ecology and he Environment, Vol 153,© 2011 WIT PressT
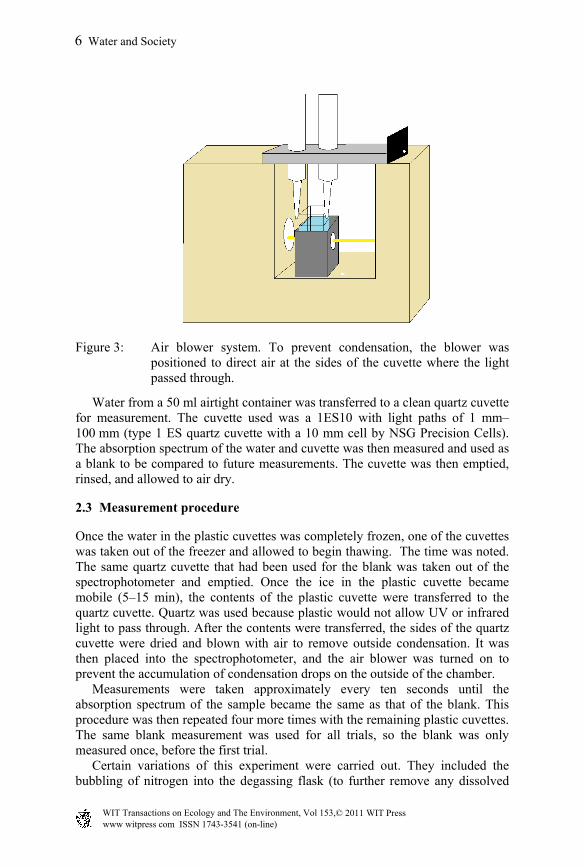
Figure 3: Air blower system. To prevent condensation, the blower was positioned to direct air at the sides of the cuvette where the light passed through.
Water from a 50 ml airtight container was transferred to a clean quartz cuvette for measurement. The cuvette used was a 1ES10 with light paths of 1 mm–100 mm (type 1 ES quartz cuvette with a 10 mm cell by NSG Precision Cells). The absorption spectrum of the water and cuvette was then measured and used as a blank to be compared to future measurements. The cuvette was then emptied, rinsed, and allowed to air dry.
2.3 Measurement procedure
Once the water in the plastic cuvettes was completely frozen, one of the cuvettes was taken out of the freezer and allowed to begin thawing. The time was noted. The same quartz cuvette that had been used for the blank was taken out of the spectrophotometer and emptied. Once the ice in the plastic cuvette became mobile (5–15 min), the contents of the plastic cuvette were transferred to the quartz cuvette. Quartz was used because plastic would not allow UV or infrared light to pass through. After the contents were transferred, the sides of the quartz cuvette were dried and blown with air to remove outside condensation. It was then placed into the spectrophotometer, and the air blower was turned on to prevent the accumulation of condensation drops on the outside of the chamber. Measurements were taken approximately every ten seconds until the absorption spectrum of the sample became the same as that of the blank. This procedure was then repeated four more times with the remaining plastic cuvettes. The same blank measurement was used for all trials, so the blank was only measured once, before the first trial. Certain variations of this experiment were carried out. They included the bubbling of nitrogen into the degassing flask (to further remove any dissolved
6 Water and Society
www witpress com ISSN 1743-3541 (on-line) WIT Transactions on Ecology and he Environment, Vol 153,© 2011 WIT PressT
gases) for 10 minutes after 24 hours of degassing, after which another 24 hours of degassing was carried out. Other variants included the omission of the boiling phase, omission of the degassing phase, use of boiled tap water instead of de-ionized water, and the use of standard de-ionized water that had not been treated to remove gases.
3 Results
3.1 Absorption peak
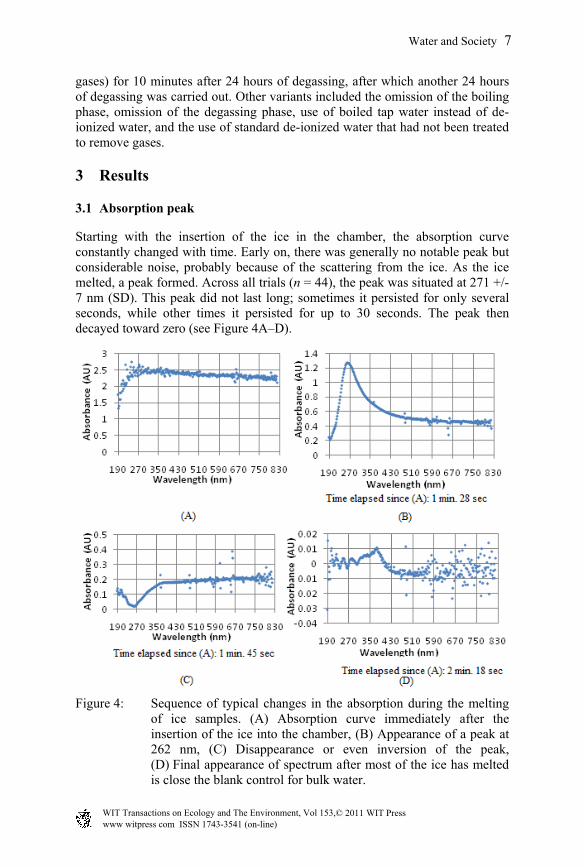
Starting with the insertion of the ice in the chamber, the absorption curve constantly changed with time. Early on, there was generally no notable peak but considerable noise, probably because of the scattering from the ice. As the ice melted, a peak formed. Across all trials (n = 44), the peak was situated at 271 +/- 7 nm (SD). This peak did not last long; sometimes it persisted for only several seconds, while other times it persisted for up to 30 seconds. The peak then decayed toward zero (see Figure 4A–D).
Figure 4: Sequence of typical changes in the absorption during the melting of ice samples. (A) Absorption curve immediately after the insertion of the ice into the chamber, (B) Appearance of a peak at 262 nm, (C) Disappearance or even inversion of the peak, (D) Final appearance of spectrum after most of the ice has melted is close the blank control for bulk water.
Water and Society 7
www witpress com ISSN 1743-3541 (on-line) WIT Transactions on Ecology and he Environment, Vol 153,© 2011 WIT PressT
The decay was often non-monotonic: sometimes two peaks often formed, usually at about 256 nm and 284 nm (n = 17). Other times, the peak decayed more uniformly with no noticeable peaks forming (n = 20). Once all of this had happened, most or all of the ice was melted. If any remained, it would be found floating some distance from where the spectrophotometer beam entered the cuvette. Small bubbles usually also floated to the top of the cuvette. The curve containing the peak near 270 nm usually occurred about a minute after the measurements started. However, they could also appear earlier or later. Occasionally a clear peak could not be found. In those cases, comparing two absorption curves that were taken chronologically would sometimes yield a curve with a 270 nm peak or valley, implying the construction or destruction of a possible exclusion zone.
3.2 Repeatability
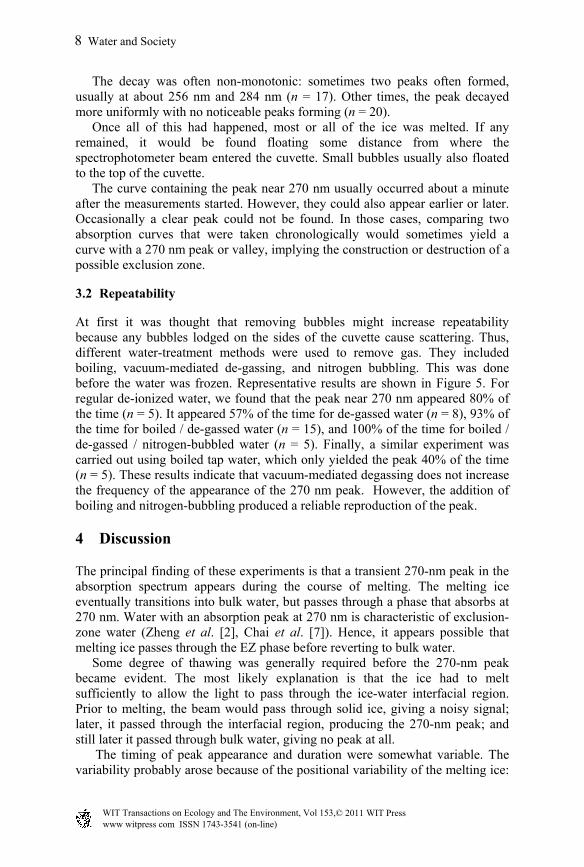
At first it was thought that removing bubbles might increase repeatability because any bubbles lodged on the sides of the cuvette cause scattering. Thus, different water-treatment methods were used to remove gas. They included boiling, vacuum-mediated de-gassing, and nitrogen bubbling. This was done before the water was frozen. Representative results are shown in Figure 5. For regular de-ionized water, we found that the peak near 270 nm appeared 80% of the time (n = 5). It appeared 57% of the time for de-gassed water (n = 8), 93% of the time for boiled / de-gassed water (n = 15), and 100% of the time for boiled / de-gassed / nitrogen-bubbled water (n = 5). Finally, a similar experiment was carried out using boiled tap water, which only yielded the peak 40% of the time (n = 5). These results indicate that vacuum-mediated degassing does not increase the frequency of the appearance of the 270 nm peak. However, the addition of boiling and nitrogen-bubbling produced a reliable reproduction of the peak.
4 Discussion
The principal finding of these experiments is that a transient 270-nm peak in the absorption spectrum appears during the course of melting. The melting ice eventually transitions into bulk water, but passes through a phase that absorbs at 270 nm. Water with an absorption peak at 270 nm is characteristic of exclusion-zone water (Zheng et al. [2], Chai et al. [7]). Hence, it appears possible that melting ice passes through the EZ phase before reverting to bulk water. Some degree of thawing was generally required before the 270-nm peak became evident. The most likely explanation is that the ice had to melt sufficiently to allow the light to pass through the ice-water interfacial region. Prior to melting, the beam would pass through solid ice, giving a noisy signal; later, it passed through the interfacial region, producing the 270-nm peak; and still later it passed through bulk water, giving no peak at all. The timing of peak appearance and duration were somewhat variable. The variability probably arose because of the positional variability of the melting ice:
8 Water and Society
www witpress com ISSN 1743-3541 (on-line) WIT Transactions on Ecology and he Environment, Vol 153,© 2011 WIT PressT

Figure 5: Representative results. (A) de-ionized water; (B) boiled de-ionized water; (C) de-gassed, de-ionized water; (D) boiled, de-gassed, de-ionized water; (E) boiled, de-gassed, nitrogen-bubbled, de-ionized water; (F) boiled tap water.
it might move favorably or unfavorably relative to the incident beam, allowing a variable fraction of the beam to capture the interfacial region (see Figure 6). Another possibility is that some, or perhaps all, of the interfacial melt region diffuses into the bulk, and then disappears over time. Either way as the ice continues to melt, the exclusion zone water apparently degrades into bulk water because the peak degrades quickly. Thus, the EZ water could be a spatial or temporal intermediate, or both.
Water and Society 9
www witpress com ISSN 1743-3541 (on-line) WIT Transactions on Ecology and he Environment, Vol 153,© 2011 WIT PressT
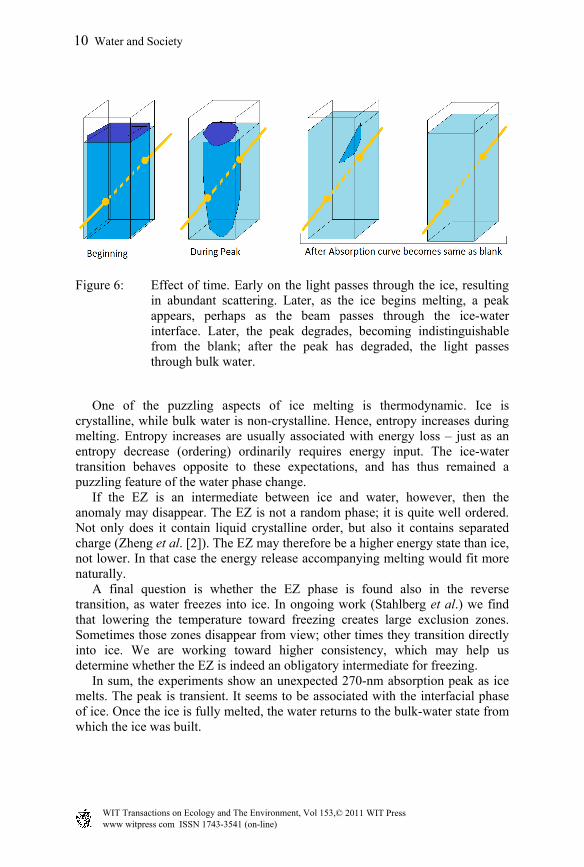
Figure 6: Effect of time. Early on the light passes through the ice, resulting in abundant scattering. Later, as the ice begins melting, a peak appears, perhaps as the beam passes through the ice-water interface. Later, the peak degrades, becoming indistinguishable from the blank; after the peak has degraded, the light passes through bulk water.
One of the puzzling aspects of ice melting is thermodynamic. Ice is crystalline, while bulk water is non-crystalline. Hence, entropy increases during melting. Entropy increases are usually associated with energy loss – just as an entropy decrease (ordering) ordinarily requires energy input. The ice-water transition behaves opposite to these expectations, and has thus remained a puzzling feature of the water phase change. If the EZ is an intermediate between ice and water, however, then the anomaly may disappear. The EZ is not a random phase; it is quite well ordered. Not only does it contain liquid crystalline order, but also it contains separated charge (Zheng et al. [2]). The EZ may therefore be a higher energy state than ice, not lower. In that case the energy release accompanying melting would fit more naturally. A final question is whether the EZ phase is found also in the reverse transition, as water freezes into ice. In ongoing work (Stahlberg et al.) we find that lowering the temperature toward freezing creates large exclusion zones. Sometimes those zones disappear from view; other times they transition directly into ice. We are working toward higher consistency, which may help us determine whether the EZ is indeed an obligatory intermediate for freezing. In sum, the experiments show an unexpected 270-nm absorption peak as ice melts. The peak is transient. It seems to be associated with the interfacial phase of ice. Once the ice is fully melted, the water returns to the bulk-water state from which the ice was built.
10 Water and Society
www witpress com ISSN 1743-3541 (on-line) WIT Transactions on Ecology and he Environment, Vol 153,© 2011 WIT PressT
References
[1] Zheng, J.M. and Pollack, G. H. Long range forces extending from polymer surfaces. Phys Rev E.: 68: 031408, 2003
[2] Zheng, J.-M., Chin, W.-C, Khijniak, E., Khijniak, E., Jr., Pollack, G. H. Surfaces and Interfacial Water: Evidence that hydrophilic surfaces have long-range impact. Adv. Colloid Interface Sci. 127: 19-27, 2006.
[3] Petrenko V.F., Whitworth R.W. (1999) Physics of Ice. Oxford University Press, New York
[4] Henniker J. C. The depth of the surface zone of a liquid. Rev Mod Phys 21(2): 322-341, 1949
[5] Ho, Mae-Wan (1998) The rainbow and the worm (2nd edition), World Scientific Publishing Co., New Jersey
[6] Perovich, D. K., Govoni, J. W. Absorption Coefficients of Ice from 250 to 400 nm. Geophysical Research Letters, 18(7), pp. 1233-1235, 1991
[7] Chai, B, Zheng, JM, Zhao, Q, and Pollack, GH: Spectroscopic studies of solutes in aqueous solution. J. Phys. Chem., A 112 2242-2247, 2008
Water and Society 11
www witpress com ISSN 1743-3541 (on-line) WIT Transactions on Ecology and he Environment, Vol 153,© 2011 WIT PressT