excitation and temperature of extended gas in active galaxies
TRANSCRIPT

1996A&A...312..365B
Astron. Astrophys. 312, 365-379 (1996) ASTRONOMY AND
ASTROPHYSICS
Excitation and temperature of extended gas in active galaxies
II. Photoionization models with matter-bounded clouds
Luc Binette1 *, AndrewS. Wilson2•3 and Thaisa Storchi-Bergmann4
1 Observatoire de Lyon, UMR CNRS 5574, 9 av. Charles Andre, F-69561 Saint-Genis-Laval Cedex, France 2 Space Telescope Science Institute, 3700 San Martin Drive, Baltimore, Maryland 21218, USA 3 Astronomy Department, University of Maryland, College Park, MD 20742, USA 4 Instituto de Fisica, UFRGS, Campus do Vale, 91500 Porto Alegre, RS, Brasil
Received 6 November 1995 I Accepted 19 January 1996
Abstract. Recent reliable measurements of the weak lines of [0 m].\4363, He II .\4686 and [Ne v].A3426 seen in emission in extended and nuclear regions of AGN (Storchi-Bergmann et al. 1996) are used to discriminate between different types of photoionization models. The sample comprises Seyferts and Narrow Line Radio Galaxies. A well known problem, the scatter and the extreme values of He II/H,B encountered in the nuclei and extended regions, is solved in a similar fashion to Viegas & Prieto (1992) by considering two populations of ionized clouds: a matter-bounded (MB) component responsible for most of the He II emission, and an ionization-bounded (IB) component emitting low-to-intermediate excitation lines. A new sequence of photoionization calculations is thereby obtained by varying AM/I• which is defined as the solid angle ratio occupied by the MB component relative to the IB component. In various line ratio diagrams, the AM;r-sequence is compared to the traditional single component U-sequence in which one arbitrarily varies the relative intensity of the ionizing source. An original aspect of the new calculations is that the IB clouds are photoionized exclusively by the radiation which has filtered ('leaked') through the MB component. This situation could arise if, for example, the MB component is the low density 'halo' of a cloud, and the IB component the high density core. Such a filtered ionizing spectrum enlarges the range in He IIIH,8 accessible to models without requiring changes in the spectral index of the ionizing source, which we fix at o:=-1.3. The main success of the model is that it provides a natural explanation for the newly found correlations between both the [0 II]/[Ne v] and [0 n]/[0 III] ratio and the He II/H,B ratio. On the other hand, the standard U-sequence cannot account for such correlations between the gaseous excitation and the He n/H,B ratio. Furthermore, the so-called 'temperature problem' is solved with the AM;r-sequence provided the thickness and the ionization pa-
Send offprint requests to: Andrew Wilson * The Observatoire de Lyon is a component of the Centre de Recherche Astrophysique de Lyon: CRAL
rameter (UMB;(;0.03) of the MB component are appropriately selected. Finally, the AM;r-sequence produces much stronger high excitation lines of [Ne V] and C IV AA 1549 than the Usequence, in accordance with observations. The AM;r-sequence predicts a temperature difference of 5 000 K between the Tom and T NII temperatures while for the U-sequence this difference is less than 1 000 K. To the extent that 'cooling flows' and LINERs share the same excitation mechanism as our IB component (i.e. photoionization by an absorbed ionizing continuum), we predict a value of He rr!H,8<0.01 while the U-sequence is charaterized by a value >0.1.
Key words: galaxies: active- galaxies: Seyfert- line: formation- galaxies: ISM
1. Introduction
Modelling and interpretation of the so called Narrow Line Region (NLR) of active galactic nuclei is widely covered in the literature. Photoionization (defined broadly and including photoionizing shocks) is believed to be the dominant excitation mechanism although other mechanisms may also play a role (as reviewed in Viegas & de Gouveia DelPino 1992: VGDP). The emission line region is, however, not confined to the unresolved inner nucleus but extends up to several kpc in Seyfert galaxies (hereafter Extended Narrow Line Region or ENLR; Unger et al. 1987; Haniff et al. 1991; Durret 1990) and up to 50 kpc and beyond in radio-galaxies (hereafter Extended Emission Line Region or EELR; Fosbury 1989; McCarthy 1993). Any understanding of the excitation and physical conditions in extended gas may also be helpful in modelling the low-tointermediate density (n < 107 cm-3) region of the spatially unresolved NLR. Studies of extended gas, however, are markedly facilitated by the fact that important geometrical parameters become available through imaging. Equally important is the lower density (n < 103 cm-3 ; Morganti et al. 1991; Tadhunter et al.
© European Southern Observatory • Provided by the NASA Astrophysics Data System

1996A&A...312..365B 366 L. Binette et al.: Temperature and excitation of the ENLR. II
1994), which simplifies multicomponent modeling since collisional deexcitation of the forbidden lines can be disregarded except for a few lines which become density indicators. Single component models (i.e. models with a single density n and a single ionization parameter U [defined as the ratio of the density of ionizing photons to the gas density, Eq. 1]) of the NLR, although broadly successful in fitting strong optical lines, are unsatisfactory in important aspects, as reviewed below (see also VGDP). Interestingly enough, the same inadequacies of models (as for the NLR) are found for the extended gas of the ENLR and EELR. In this paper, we argue that the next and simplest modification of the single component model is to consider two distinct populations of line emitting clouds. In particular, we propose a variable ratio of a matter-bounded component and an ionization-bounded component and show that such a model can resolve the remaining crucial problems pertaining to photoionization models. Let us review first the standard problems encountered in current photoionization models.
1.1. The nuclear region: the NLR
There are three serious problems encountered in photoionization models of the NLR. In comparison with the observations, the models predict:
A. Too weak high excitation lines. The earlier work of Stasinska (1984: ST84), who studied a large sample of optical line ratios of Seyfert 2's and LINERs, reveals that single component models fail to reproduce [Ne v]/[Ne III] (see Fig. 5 in ST84). Furthermore, even in the case of the multi-density model developed by Ferland & Osterbrock (1986: F086), high excitation lines such as [Nev].X3426, CIV .X.X15491, Cm].X.X1909, [Fe vn].X6087 and [Fe x].X6375 are underpredicted by a factor of5-15.
B. Too low electronic temperatures. The temperature (Tom) inferred from the line ratio Rom (= [0 m]A4363/[0 III].X5007) often exceeds the equilibrium temperature of models calculated with densities n < 104 cm-3 and solar metallicity. Typically one observes Rom 2 0.015 (see ST84) while models predict significantly smaller values ( < .01). In ST84, it is shown that the addition of a separate and much higher density component of n ;:(; 106 em - 3 can reproduce the observed value of Rom- A smooth distribution of densities (as invoked by F0862), however, barely reaches the low end value of Rom = 0.015.
C. Too small a range in He u!H(J. ST84 found a large scatter in the ratio He II A4686/H(J of Seyfert 2's, which could not be explained by a universal power-law of unique index a. In
The usage of.>..>. (followed by a mean wavelength in A) means that we refer to the sum of the multiplet. 2 The 'mean' observed Seyfert spectrum adopted for comparison by F086 has Rom = 0.019 (i.e. Tom "' l5000K in the low density regime).
conventional ionization-bounded models, this ratio is not sensitive to changes in n or U (ST84; Binette, Robinson & Courvoisier 1988) but depends on the hardness of the ionizing continuum. One possibility is that a (or the temperature if a thermal source of ionizing photons is invoked) varies from object to object. Another possibility raised in ST84 was that the ionized clouds might in some cases be matter-bounded (i.e., geometrically smaller than the depth needed to absorb all ionizing photons). Viegas-Aidrovandi (1988) argued in favor of this possibility based on a weak trend for the low excitation lines to become weaker as He 11/H(J gets larger. The opposite trend would be expected if variations of the index a were invoked to explain the wide scatter of He 11/H(J.
The correlations of either critical density and/or ionization potential with the full width at half-maximum of the various lines found by Wilson (1979), Pelat eta!. (1981), Filippenko & Halpern (1984), DeRobertis & Osterbrock (1984, 1986) prove that realistic models should consider a range in either or both the density nand the excitation U. This in itself does not constitute a proof, however, that all three problems raised above would be satisfactorily solved with a smooth distribution of densities and/or excitation.
It is our opinion that the solution to the above problems is unrelated to density stratification. Therefore, before embarking on multicomponent modelling of the unresolved NLR, it would be valuable to find a solution for the extended gas which we know is not strongly affected by collisional de-excitation.
1.2. The extended ionized regions: the ENLR or EELR
It is generally accepted that the dominant excitation mechanism of the extended gas is photoionization (see Robinson eta!. 1987 and VGDP}. The notion that the continuum is generated in situ (e.g. photoionizing shocks: Sutherland eta!. 1993) cannot be ruled out. The cone-like structure of some ENLR suggests, however, that the nucleus is the source of the continuum (see Wilson 1995, and references therein) in at least these cases. In this situation, we can derive constraints on the geometrical dilution of the nuclear radiation reaching a given resolved patch of emission gas. If there is a distribution of cloud densities at a given location, the higher density regions would correspond to lower values of U. As the [S II] zone is in the low density limit, regions emitting more highly ionized species must have a similar or even lower densities. Let us review the evidence that models of extended gas show the same problems as they do for the NLR.
A. Too weak high excitation lines. In the ENLR ofNGC1068, the [Ne v]/H(J ratio is comparable to that found in the NLR (Evans & Dopita 1986; Bergeron eta!. 1989). We find a similar situation in our own ENLR/EELR sample (Storchi-Bergmann et a!. 1996: Paper I). In fact, we find a tendency for the excitation to be higher in the extended gas than in the nucleus. For the EELR of the high excitation detached cloud in PKS 2152-69, Tadhunter eta!. (1988) found that that the lines of [Ne v], [Fe VII] and [Fe x] were stronger relative to H(J than in the parent nucleus. Very high redshift radio-galaxies reveal a high excita-
© European Southern Observatory • Provided by the NASA Astrophysics Data System

1996A&A...312..365B
L. Binette et a!.: Temperature and excitation of the ENLR. II 367
tion UV spectrum with strong lines of C IV and C III] (VillarMartfn eta!. 1996; McCarthy 1993 and references therein).
B. Too low electronic temperatures. Tadhunter et a!. (1989: TRM89) pointed out the temperature problem encountered in EELR. The range observed was 0.03 2: Rom 2: 0.01. More detailed observations now include Cen A (Morganti eta!. 1991) and 3C227 (Prieto eta!. 1993). Our observations reported in Paper I were designed to extend this kind of study of Rom to the ENLR of Seyferts. Our sample, including the two radiogalaxies, indicates values in the range 0.023 2: Rom 2: 0.011 (i.e., 16 000 K 2: Tom 2: 12 000 K).
C. Too low values of He niH /3. Tadhunter ( 1986) found that the He rr/H/3 ratio of EELR often exceeds the value predicted by ionization-bounded3 models with a canonical power-law (while for nuclei it was only the large width of the scatter which posed difficulty). In our sample, we find similarly high values. Such large ratios cannot be reproduced with any power-law index if all the clouds are ionization-bounded( e.g., Binette, Courvoisier & Robinson 1988).
1.3. Solutions which have been proposed
The presence of shock waves, providing either collisional ionization in addition to photoionization by the central source or photoionization by the shock itself would certainly impact the line ratios and might solve some or all the above problems. We refer the reader to the ongoing and extensive work carried out by Contini & Viegas-Aldrovandi (1989), Dopita & Sutherland (1995, 1996), VGDP and Sutherland eta!. (1993) on this subject. Our work concerns new results with pure photoionization models, which have the merit of not requiring additional excitation mechanisms.
Outside the arena of shocks, the specific solutions which have been proposed so far usually solve only one of the above problems. For instance, the very strong high excitation lines might be the result of an absorbed and therefore very hard continuum (NLR: Ferland & Mushotzky 1982; ENLR: Evans & Dopita 1986; Bergeron eta!. 1989; Nazarova 1995). The apparently high values of Tom might instead be the result of a high density component but this possibility exists only for the unresolved NLR and therefore has too narrow a range of applicability. Reducing metallicity by a factor ~ 3 is one possibility (NLR: Ferland & Mushotzky 1982; Ferland & Netzer 1983; ENLR: TRM89) but such is unlikely to be applicable to the NLR (and ENLR?) gas, which we might reasonably expect to have solar or higher metallicity. Another possibility which increases Tom is the presence of an intense flux of relativistic electrons (see Viegas-Aldrovandi & Gruenwald 1988). However, there is no evidence that the temperature is correlated with the presence of strong radio emission. Dust grain photoionization can also raise the temperature significantly provided U is sufficiently
Ionization-bounded clouds are sufficiently thick to absorb essentially all the ionizing radiation.
high (cf., Appendix C in Baldwin eta!. 1991). The scatter in the nuclear He rr/Hj3 ratio and its extreme values outside the nucleus are best explained by invoking differing degrees of thinness in the emitting clouds (for the NLR: Viegas-Aldrovandi 1988; the EELR: Tadhunter 1986; Morganti eta!. 1991; Viegas & Prieto 1992; VGDP; and the ENLR: Haniff eta!. 1991).
In this work we favour a solution resembling that developed by Viegas & Prieto (1992) which we will show has the potential of resolving simultaneously all three problems. It also shares some similarities with the work of Pequignot & Dennefeld ( 1983) who modelled a bright filament in the Crab Nebula which presents interesting similarities to NLR spectra.
2. The particularities of matter-bounded clouds
2.1. Dichotomy of matter-bounded versus ionization-bounded clouds
Let us first review in more detail the conclusions reached from comparisons between pure photoionization models with matterbounded (MB) clouds and observations of extended gas. On the one hand, Morganti eta!. (1991) use a smooth distribution of clouds of different thicknesses, while on the other Viegas & Prieto (1992: VP92) simply combine in varying proportions very thin matter-bounded clouds with ionization-bounded clouds. Both succeed in accounting for the scatter as well as the high values of the He n/H/3 ratio in EELR. However, both papers conclude that the temperature problems cannot be solved in this manner. Our contention is that, although a 'smooth' distribution of matter-bounded clouds would not indeed produce sufficiently high T0 m, a simple combination of matter-bounded and ionization-bounded clouds can simultaneously solve all three problems. VP92 did not obtain this solution because they used too thin4 a cloud for the matter-bounded component and too low an ionization parameter (U=0.01). Such a very thin, matterbounded component does not emit any significant [0 III] (nor is it quite hot enough when U=0.01), and so combining it with ionization-bounded clouds does not raise the global Rom.
2.2. Building blocks: proportionate matter-bounded clouds
From the perspective of matter-bounded clouds, high temperatures are easy to reproduce if we select a sufficiently high ionization parameter (cf. Pequignot & Dennefeld 1983). To illustrate this, we plot in Fig. 1 the quantities Tom (panel a) and Rom (panel b) as a function of the ionization parameter U. In these calculations with the code MAPPINGS (Sect. 3.2), the slab's thickness is such that the fraction of absorbed ionizing photons is 30% at all U. This fraction of ionizing photons absorbed (hereafter FMB) is a useful parameter for defining the thickness of the slab, as it also gives a measure of the fraction of the H/3 flux generated within the MB component relative to the optically thick case. The most interesting result is that a power-law with a ~ -1.3 can indeed produce temperatures » 10 000 K if U is sufficiently high. The main reason for the dependence of
4 VP92 report having used a Lyman limit opacity T,% < 1 for their matter-bounded component; in our calculations T,% >I .
© European Southern Observatory • Provided by the NASA Astrophysics Data System

1996A&A...312..365B 368 L. Binette et al.: Temperature and excitation of the ENLR. II
----- MB, cx=-1.3 -----· IB, cx=-1.3
2x1D" -·-·-·-·-·-- MB, a=-1.3 No Helium ---------- MB, UV: MFB7 .......................... MB, UV:
to• 9000
8000 -----
7000
§'o.o4 ~ <_o.os
"" co
"" .... ,:$.0.02
r:r.§ 0.01
0.009 0.006 0.007
0.006
0.005
0.004
0.003
0.001
,,' ___ ...
0.01
u
a
b
0.1
Fig.la and b. Sequence of matter-bounded (MB) photoionization calculations [except for the long-dash curve which is ionization-bounded (IB)] of increasing ionization parameter U. Panel a is a plot of the equilibrium electronic temperature inferred from the Rom ratio [plotted in panel b]. The ionizing continuum is a power-law except for the short dash curve (multi-segmented power-law, see Mathews & Ferland 1987) and the dotted curve (black-body of 120 000 K). All MB models are set to absorb 30% of the ionizing photons (FMB=0.3). Abundances are solar (Z=l). The long dash-dotted curve represents a plasma without any He but still with Z=l. The curves have the same meaning on the two panels.
temperature on U is that most of the heating in the MB cloud is caused by photoionization of He+. This is shown by the He free models (dash-dotted curve) which have a much lower Tom except for U ;::: 0.04, which marks the onset of heating by photoionization of metals.
Fig. 1 also illustrates how blackbodies are relatively ineffective in generating high Tom as compared to power-laws. Such thermal energy distributions were considered by ST84 and Binette, Robinson & Courvoisier (1988) for the NLR and by Pequignot (1984) for LINERs (Tbb = 80000K). Similarly low Tom values characterize the multi-segmented distribution of Mathews & Ferland (1987), which is intended to model the big UV bump and the soft to hard X-ray spectra of AGN.
We emphasize that values of Rom in the range 0.015-0.025 are only obtained for MB clouds which truncate the o+2 zone. A much thicker MB slab is more luminous in [0 m]>.5007 but
:>::: go.5 0 0 C\1 ;:
""············.......... //////
...... -;.·;/..<............................. 0.5
/ :s / ;t,
//-N'o+a/ lO'e em-a a OI-1-HHF=-'1=-J~--1-t-+-t-+-+-1--+-1--+-Ho
0 ~~~~~~~~~~~~~~~-L-L-U 0 0.1 0.2 0.3 0.4 0.5 0.6 0.7 0.8
FMB
I
0.5
z :X:
"' ;t,
Fig. 2a and b. Variation of the temperature (Te) and of the effective heating rate (r /n2) as a function of depth into a slab photoionized by a power-law of index a = -1.3. The depth is expressed in terms of the fraction, FMs, of ionizing photons absorbed up to that point in the slab. The dashed curves represent the integrated column densities of o+2 (long dash, panel a) and He+2 (short dash, panel bas a function of FMs. The abundances of the gas are solar and the ionization parameter is U = 0.04 (Eq. 1).
significantly colder which depresses the integrated Rom value. The ionization-bounded (IB) models of increasing U plotted in Fig. 1 (long-dash curve) illustrate well the difficulty that any optically thick model has in reaching high values of Rom (see also TRM89), even when U is high. The reason for this is that the internal temperature within the o+2 zone decreases with increasing depth, hence the importance of considering a sufficiently thin slab.
To illustrate this point further, let us consider the structure of a photoionized slab with U= 0.04 as shown in Fig. 2 and compare the internal temperature behaviour (panel a) with the behaviour of the o+2 column density, as a function of depth. It is apparent that the temperature decreases rapidly from 16 000 K to 10 000 K within the region where the o+2 column density reaches rv 20% of the asymptotic value. This sudden temperature decrease coincides with a decrease in the effective heating rate (solid line: r /n2) at FMB ~ 0.35 and is due to the disappearance of ionizing photons in the region 54-200eV responsible for photoionization of He+ (the dominant heating process as discussed above [Fig. 1]). This is confirmed in Fig. 2 by the behaviour of the He+2 column density (panel b) which reaches its asymptotic value not far beyond the position of the peak in the heating rate (at FMB ~ 0.35).
We have seen that to obtain sufficiently high temperatures the MB clouds must be sufficiently thin that their temperature is governed by photoionization of He+. On the other hand, the MB clouds must also be thick enough to contribute significantly to the [0 III] lines. Finally, as will become clear later, the other
© European Southern Observatory • Provided by the NASA Astrophysics Data System

1996A&A...312..365B
L. Binette et al.: Temperature and excitation of the ENLR. II 369
Table 1. Data sample and dereddened line ratios relative to [0 m].A5007A (=100)
Galaxy Symbol Type r Av Hen [0 III] [0 II] [Or] [Su] [NII] [Nev] Ha H,B name (kpc) (mag) 4686 4363
ESO 362-GS open 0 Sy2 Nuc. 3.0NE 0.4 3.6 1.1
Mrk 573 openO Sy2 Nuc. 0.6 3.4 1.3 1.9NW 0.8 3.4 1.5 1.9SE 2.2 3.4 2.0
NGC526A open£:,. Sy 1.5 Nuc. 1.8 2.7 2.1 2.5NW 0.04 2.4 2.3
Pks 0349-27 filled 0 NLRG Nuc. 2.3 <1.6 13NE 3.5 1.8 13SW 3.2 1.6
Pks 0634-20 filled/:;. NLRG Nuc. 2.5 3.5 <0.8 5.8SE 0.4 4.4 1.9 9.7NW 0.6 6.9 1.9
important problem of the strength of the high excitation lines is also solved with MB clouds of sufficiently high ionization parameters (U :<; 0.04).
3. Data sample and the modelling procedure
3.1. The sample
The models will be compared with our own observations (Paper I) which were specifically designed to measure the key weak lines of [0 m].M363, He II ..\4686 and [Ne v]..\3426, a difficult proposition for the lower surface brightness ENLR gas. The many internal correlations present between the different line ratios (Sect. 4) confirm that the effort was worthwhile.
The sample is presented in Table 1 and comprises Seyfert 2's and NLRG's except for NGC 526A which is a Seyfert 1.9. For each object, spectra were obtained at the location of the nucleus and - depending on the SIN - at two or one off-nuclear positions along the slit. The projected distances on the sky from the nucleus to the off-nuclear positions are listed in Column 4 assuming H0 = 75kms- 1Mpc- 1 and qo = 0.5. The data reduction techniques are described in detail in Paper I. The observed Balmer decrement was used to determine the reddening corrected ratios listed in Table 1 assuming an intrinsic ratio of Ha/H,B = 3.1.
Table 1 also includes the symbol used in the figures (Column 2), the activity type (Column 3), the obscuration Av (Column 5) and the (dereddened) line ratios [with respect to [0 III]..\5007 (=100)] which are used in this paper. Note that upper limits are not shown in any diagram. The errors in the measurement of the weakest lines is estimated at ~ 30%.
3.2. The computer code and the parameters Z, J.L
The data will be compared with photoionization models which were computed using the multipurpose photoionization-shock code MAPPINGS. The latest version is described in Binette
3727 6300 6725 6583 =3426 6563 4861
11.6 17.9 58.9 11.9 33.2 30.4 1.6 11.2 21.9 4.4 28.9 9.3 18.7 2.6 13.6 21.3 9.2 25.4 8.1 39.3 2.0 15.7 21.6 8.3 28.9 9.3 51.0 1.3 12.9 16.9 24.8 26.0 8.4 38.8 2.3 9.8 14.1 13.8 20.7 6.7 74.0 6.7 39.0 45.7 2.1 45.4 14.6 110 18 58.6 45.1 4.4 57.7 20.1 45.6 1.3 11.4 13.1 3.9 27.4 9.2 37.3 1.7 9.5 8.5 5.0 25.4 9.5 36.8 2.4 10.0 13.8 15.9 27.0 8.7 6.8 2.6 5.2 18.0 26.6 8.6 3.7 3.2 3.8 33.5 30.5 9.8
et al. (1993a,b). We adopt the collisional excitation rates of hydrogen calculated by Aggarwal et al. (1991).
As for gas metallicity, we scale with a factor Z the solar abundance set of trace elements compiled by Anders & Grevesse (1989). He/His kept constant at 0.1. Unless specified otherwise, we consider the solar case with Z=l.
Dust is considered to be mixed with the ionized gas, and the code includes heating by dust photoionization. The dust content of the photoionized plasma is described by the quantity J.L which is the dust-to-gas ratio of the plasma expressed in units of the solar neighborhood dust-to-gas ratio. We adopt the extinction curve produced by a distribution of very small grains of silicate and graphite with sizes in the range 0.005 ~ a ~ 0.03J.Lm. The population density of grains is assumed to vary as a - 3·5 where a is the grain size. The extinction curve was computed by Martin (cf., Magris et al. 1993) and extends from infra-red to X-rays.
The calculations in this work use a constant dust-to-gas ratio of J.L = 0.015 which has a negligible effect on line transfer and on the gas heating. After exploring models with higher J.L, we found that the effects of dust were of secondary importance in our study of matter-bounded models and would unduly complicate the exploratory nature of the present work. We will, therefore, comment only briefly on the results of using higher values of J.L. Depletion of the gas phase metals (very minor at J.L = 0.015) was taken into account following the prescription given in Appendix A of Binette et al. (1993b). At metallicities other than solar, J.L=0.015 Z.
3.3. The physical distinction between matter- and ionizationbounded clouds
We hereafter propose a new approach to the interpretation of the observed variations in the degree of excitation of the line spectra of AGN. These variations are traditionally interpreted as resulting from variations of the ionization parameter. We investigate in this paper the possibility that the apparent varia-
© European Southern Observatory • Provided by the NASA Astrophysics Data System

1996A&A...312..365B 370 L. Binette et al.: Temperature and excitation of the ENLR. II
10 100 E (eV) 1000
0.1
'1 . .]
;"''V-\ ,.-~-/ I;
I I I I I
1016 1017 V (Hz)
Fig. 3. The flux density ofthe power law incident on the matter-bounded slab is plotted as vFv (solid line). The long dashed curve represents the ionizing energy distribution escaping the back of a matter-bounded slab which is sufficiently thick to absorb 40% of the ionizing photons. The abundances of the slab are solar and the ionization parameter is UMs = 0.04. This modified energy distribution is used as the ionizing spectrum for the ionization-bounded clouds.
tions in excitation represent instead different proportions of two different populations of line emitting clouds. The first population is 'matter-bounded' (MB) clouds, the spectrum of which is found given by photoionization calculations truncated after a fraction FMB of impinging ionizing photons has been absorbed. The excitation degree of this MB component is very high. The second population is 'ionization-bounded' (IB) clouds, which are much more opaque to the ionizing radiation (absorbing a fraction Fm ~ 1 of impinging photons) and of much lower excitation. We adopt FMB = 0.40 and Fm = 0.97 in the calculations presented here, the justification of which is given below.
An original aspect of the current approach is that we assume the IB clouds are photoionized only by the UV photons which have leaked through the MB clouds. Thus the input ionizing spectrum reaching the IB clouds has been partially absorbed (filtered) by the MB clouds. Fig. 3 illustrates the energy distribution available to the IB component (dashed line).
The approach taken adopts the view that an unaltered powerlaw would always generate a population of very high excitation matter-bounded clouds, as we now discuss. The force which couples the MB cloud structure to the radiation field would presumably be radiation pressure. One might imagine, for instance, that the MB gas corresponds to a thin halo surrounding a dense cloud core. The intense radiation impinging on the outer layers of the cloud would accelerate these outer layers away, leading to a gradual photoevaporation of the cloud (cf. Bertoldi 1989; Bertoldi & McKee 1990). The existence of a matter-bounded characteristic thickness in the range FMB ~ 0.35- 0.40 might result from the peak in the heating rate (solid line, Fig. 2b) which we tentatively interpret as a stalling point in the accelerative outflow of thin MB gas layers. As the gas accelerates away from the
-~
..
' [[\" .
.... ®!
(a)
~-·
Cl
D Molter-Bounded Ill Ionization-Bounded
(b)
r-~=,~~-M~~--e-~B~o-u-nd-ed~H-al-o-,
• Ionization-Bounded Core
Fig. 4a and b. Cartoons of two possible geometrical distributions of matter-bounded (MB) and ionization bounded (IB) components. The luminosity of any component is essentially governed by the solid angle it covers at the central UV source. The inner clouds (NLR) are denser and smaller than those at larger radii, where the cloud sizes become sufficiently large that individual components become resolvable (ENLR or EELR). In our models, the IB clouds are of lower excitation mostly because they see an ionizing continuum filtered by the MB component. a The MB clouds are closer to the ionizing source and shadow the more distant IB clouds which see a more dilute radiation field and hence have lower U. Supposing a planar or cylindrical distribution of obscuring material, the relative numbers of visible IB and MB clouds can. vary considerably according to the perspective of the observer. b The IB component is associated with the dense core (higher pressure) of a gas cloud surrounded by a tenuous matter-bounded evaporating halo.
core due to radiative pressure and gets less dense and thinner, it also gets hotter, which drives the expansion process further. In this picture, the IB component corresponds to the dense core of the cloud.
The ionizing radiation available to the IB component has leaked through the MB clouds and is quite different from the original power-law. It consists mostly of hard photons (dashed line in Fig. 2) which interact much less effectively with the gas since their energy is well above either the He+ or the H0 ionization thresholds. This suggests there is little coupling between the gas density of the IB component and the hard radiation, with the IB gas condensations simply passively absorbing the latter. Unlike the matter-bounded clouds, which all share the same excitation as a result of their coupling to the radiation field, the IB clouds might, therefore, not be characterized by a unique excitation or value of Um. In this paper we have explored a single value ofUm in order to keep the modelling procedure as simple as possible.
© European Southern Observatory • Provided by the NASA Astrophysics Data System

1996A&A...312..365B
L. Binette et al.: Temperature and excitation of the ENLR. II 371
3.4. A geometrical representation of the clouds'space distribution
Depending on the ratio of the spatial resolution to the dimensions of the gaseous condensations, we can distinguish two situations. In the unresolved case, which applies to the NLR of Seyferts, we obtain a statistical and undifferentiated combination of the two populations of clouds leading to the 'mean' NLR Seyfert spectrum. In the case of radio-galaxies, where we have much larger scale gaseous components, we expect a dichotomy between high excitation and low excitation condensations, as is generally observed for EELR (Fosbury 1989), and which we here associate with partially resolved MB and IB clouds, respectively.
We present in Fig. 4 schematic diagrams illustrating two possible distributions of MB and IB clouds. In our scheme, the H,Bluminosity of any cloud is essentially governed by the solid angle it occupies within the opening angle of the ionizing cone. The inner clouds (NLR) are envisaged to be both dense and small and below our resolution. As is apparent in the diagram 4a, the observer's perspective is bound to play an important role in the observed excitation of the ionized gas. For example, if we suppose that obscuring material hides part of the NLR, as proposed for some Seyfert 2 galaxies (e.g., NGC 1068; Cameron et al. 1993), then the relative prominence of the two emission-line components would depend on the angle from which we look at the nuclear region. The IB component would dominate the high excitation MB component if, for instance, most MB clouds in Fig. 4a were hidden by obscuration. The converse would be true if our view of the NLR is dominated by the unresolved denser, inner MB clouds, with the more diffuse IB clouds further out in the disk of the galaxy (i.e. outside the NLR).
A complementary interpretation of the IB/MB dichotomy is that the IB component corresponds to the denser core of a diffuse matter-bounded halo as depicted in Fig. 4b and discussed in the last subsection. Alternatively, the IB clouds are not necessarily back to back with the MB clouds but at some distance behind them, as depicted in Fig. 4a. Our treatment of the radiative transfer is more consistent with the second possibility (although the two possibilities are not mutually exclusive), since we opted to neglect the contribution of the diffuse field from the MB clouds to the ionization of the 'detached' ionization-bounded clouds. The rationale behind this assumption is that the diffuse field emitted by the MB clouds is isotropic while the ionizing continuum is radial. In any event, this neglect of the diffuse field 'external' to the IB clouds does not alter significantly their emission line spectra.
3.5. On defining the ionization parameter and/or pressure of the two components
The input ionization parameter is defined as the quotient of the density of impinging ionizing photons and the outer density of the gas cloud:
(1)
where ¢v is the monochromatic ionizing energy flux impinging on the cloud, v0 the ionization potential of H, n the total gas density in the front layer of the slab and c the speed of the light.
In choosing the input spectrum of ionizing radiation, we opted to find the closest index to the canonical values proposed in the literature (i.e., a = -1.4 or -1.5; e.g., F086) and yet still produce high enough Rom. We therefore adopt a = -1.3 since steeper power-laws produce too low a temperature5 . Flatter power-laws can, in principle, be used although in this case the ionization-bounded clouds must become more matter-bounded (Fm ~ 0.90) to avoid excessive fluxes in the low excitation lines.
The only ionization parameter which we determine a priori is that of the MB clouds which see the unaltered ionizing distribution,¢~.~. We adopt UMB = 0.04 which allows us to reach the high electronic temperatures of Tom=15 000 K (Rom = 0.02) representative of the extranuclear regions. We emphasize that UMB is not as critical to the line ratios as in the standard single zone ionization-bounded model. Higher UMB values (at constant He n/H,B) will result mostly in higher intensities of highly ionized species (e.g. [Fex].A6375, C IV, [Fe VII].A6087, [Ne v]).
As is customary in interpretation of extended emission regions, we adopt the low density regime and for concreteness fix the density at nMB = 50 em - 3 . This gives us a total gas pressure for the front layer of PMB = 2.1 106 K em - 3. We adopt the isobaric prescription, that is the calculations demand the gas pressure be constant within any MB (of pressure PMB) or IB (of pressure Pm) clouds, with the behaviour of the total density as a function of distance into the cloud (n(x)) modulated by the behaviour of the temperature and by the ionization fraction of the gas.
Rather than specifying directly the ionization parameter of the IB clouds (which, we emphasize, see a different continuum), we independently fix their pressures. In order to avoid having the total (MB+IB) [0 m].A5007/H,8 ratio much too large, it is easily shown that the IB clouds must contribute less [0 III].A5007 flux than the MB component. This is realized using either a greater density6 for the IB clouds (supposing they are close to or represent the cores of the MB clouds) or some additional geometrical dilution of the modified continuum they see. By trial and error, we find that Pm ,...., 20PMB (which results in Um = 5.210-4)
gives a very acceptable fit of the summed spectrum (IB+MB) to the observed range of line ratios in our sample. In the low density regime in which the line spectrum does not depend on ¢ H or n separately, but on their ratio (U), we can consider the following two interpretations of this pressure jump as totally equivalent. Either the IB clouds have a greater density (nm ~ 20n~~, where n~~ is the density at the back ofthe MB slab7) or the fil-
s If we increase the dust content ofthe MB component to P,Ms=0.15, a power law with a=-1.4 gives similar results to those presented here with p,=0.015 and a =-1.3. 6 The decrease in [0 rn].>.5007 luminosity achieved with higher Pm is not caused by collisional deexcitation but is simply the result of a reduction in U when a higher density (i.e., pressure) is used (see Eq. 1). 7 Given the isobaric prescription, the density at the back is higher than at the front because of the temperature gradient.
© European Southern Observatory • Provided by the NASA Astrophysics Data System

1996A&A...312..365B 372 L. Binette et a!.: Temperature and excitation of the ENLR. II
tered continuum is diluted by a factor 1/20 as a result of the IB clouds being a factor of J2o more distant than the MB clouds from the ionizing source. Since in the calculations presented in Sect. 4, we have explicitly used the pressure jump prescription (i.e. nm = Prn/(2.1 kT) = 2 300cm-3) rather than diluting the radiation, it should be kept in mind that collisional deexcitation has somewhat reduced our [0 II] and [S II] line intensities.
The above procedure defining the MB and IB components can be summarized as follows. Once the continuum distribu-tion is adopted, and assuming for definiteness solar metallicity, we select a single ionization parameter for the MB component which produces high enough Tom- The MB clouds should be sufficiently thick to include a fraction of the o+2 zone in order that the MB component dominates in the line of [0 m]>.4363. It should be sufficiently thin, however, to ensure a high enough Tom. We have seen that this occurs at a depth near the maximum in the heating rate (r jn2: Fig. 2b). In the case of a power-law of a = -1.3 and with UM8 =0.04, these considerations guide us to a value of FM8 =0.40, which results in He II/H,B = 0.87 from the MB component alone. From these calculations, we deter-mine the spectral energy distribution exiting the matter-bounded clouds (dashed line in Fig. 3) and use it as the input continuum to the IB clouds. The calculations of the IB clouds proceed by taking into account their own internal pressure, which we set to 20PMB· To avoid excessive fluxes in the low excitation lines, the ionization-bounded clouds are truncated at FMB=0.97. The MB and IB emission line spectra (cf. Table 2) can be combined together with varying relative weights. The H,B luminosities per unit area per unit density are 6.7410-5 nMB ergcms-1 and 1.1810-4 nMB ergcms-1 for the MB and IB components, re-spectively, assuming the same geometrical dilution of the inci-dent radiation for both components.
3.6. AM/I: a new excitation sequence of models
The originality of the above procedure lies in the fact that we no longer account for variations in excitation between AGN, or between different positions in the EELR, by a change ofthe ionization parameter, but rather by differing ratios of two distinct populations of photoionized clouds. By fixing the thickness of each gaseous component (FMB• Frn), we predetermine their reprocessing efficiency. Their luminosity in H,B is then solely governed by the solid angle each component subtends at the ionizing source. Let us define AM/I as the parameter representing the ratio of the solid angle subtended by the MB clouds to the solid angle subtended by the IB clouds, where, of course, only those clouds visible to the observer are included (cf. Fig. 4a). Any line ratio R~eq of line i relative to H,B for a given model of the AM;r-sequence is found by combining the MB and IB ratios of Table 2 in the following manner:
. RfB + 0.568AM;IR~m R:eq(AMjl) = 1 + 0.568AM/1 (2)
where 0.568 represents the ratio of the luminosity of H,B from the MB component to that of the IB component. A larger value of AM/I implies a larger weight given to the MB component and,
Table 2. MB and IB line ratios relative to H,B (=1.0)•
i ..\(A) R~B Rfa
CIV 1549b 12.6 3.910-3
Hen 1640 7.05 4.310-2
Om] 1663b 0.78 1.310-2
N III] 1749b 0.25 6.610-3
Cm] 1909b 4.26 0.37 C II] 2326 1.910-2 0.48 [NeiV] 2423b 1.59 1.210-3
Mgn 2800 5.510-2 3.60 [Nev] 3426 2.96 4.710-4
[On] 3727b 0.10 7.77 [Ne III] 3869 0.88 0.70 [S II] 4072b 5.210-5 0.19 [0 III] 4363 0.33 1.610-2
Hen 4686 0.87 7.710-3
[0 III] 5007 16.9 3.67 [NI] 5200b 2.710-5 0.15 [NII] 5755 3.410-4 5.o to-2
He I 5876 2.910-2 0.16 [OI] 6300 1.410-4 0.76 Ha 6563 2.78 2.89 [N II] 6583 1.010-2 3.82 [S II] 6724b 5.510-4 1.76 [Arm] 7135 6.410-3 0.33 [Can] 729lc 9.310-3 0.62 [On] 7330b 1.510-3 0.14 [S III] 9531 2.410-2 2.58
• Ionizing continuum of index a = -1.3 h Sum of doublet terms c Ca/H is depleted by 0.46 dex, see Sect. 3.2
therefore, a higher excitation spectrum. The column densities of ionized hydrogen for the two components are
NH+ 1023 U F -2 MB ~ MB MBCm (3)
H+ 23 PMB 2 Nrn ~ 10 UMBC1- FMB)Frn- cm-Prn
(4)
Strictly speaking, AM/I cannot be lower than unity since by definition the MB clouds are intervening clouds between the nuclear ionizing source and the IB clouds (see Fig. 4). However, in the current popular schemes of AGN unification, perspective can play an important role due to obscuration of the inner regions (by large molecular clouds or by a dusty disk). It is then reasonable to postulate that in Seyfert 2's and NLRG's only a small fraction of all the MB clouds (expected to lie somewhere inbetween the continuum source and the IB clouds) are directly visible to the observer, thereby giving physical meaning to an 'apparent' AM/I < 1 for a distant observer. The schematic diagram of Fig. 4a illustrates how the observer's angle of view could affect the relative number of IB versus MB clouds and therefore introduce changes in the line ratios corresponding to the change in AM/I.
© European Southern Observatory • Provided by the NASA Astrophysics Data System

1996A&A...312..365B
L. Binette et a!.: Temperature and excitation of the ENLR. II 373
Amongst the different possibilities for defining the IB clouds, one might consider a different case in which the IB clouds see the ionizing source directly instead of an absorbed continuum. However, we consider our approach more promising for the following reasons:
1. The IB clouds are characterized by a low He n/H,B ratio and so objects with weak He II can now be accounted for in a natural way by supposing AM/I is lower than unity. On the other hand, conventional models are inconsistent with both extremes of He rr/H,B for a canonical power-law of a '::' -1.4 or flatter.
2. Since we obtain our sequence as a function of AM/I by combining two distinct populations of clouds with very different emission spectra, something physical must distinguish them. In the adopted procedure, the two components are physically different because the ionizing continuum is different. We have proposed that the truncation of the MB clouds coincides with the exhaustion of the He+ ionizing photons and that the IB clouds are of lower excitation due to the much lower radiation pressure exerted by the filtered continuum.
4. Comparison of the AM/I"sequence with observations
In the following figures, we compare the observed line ratios of our sample of extended EELR and ENLR regions, including their respective nuclear spectra, with the new AM/I photoionization sequence as well as with the conventional U sequence. In Figs. 5-10 and 12-13, filled symbols correspond to radio galaxies and the open symbols to Seyferts (see legend in Table 1). A dotted line connects measurements at different locations in the same object (e.g., Fig. 5).
In order to visually distinguish the extended gas from the NLR of the same galaxy, we use a larger symbol for the unresolved nuclear ratios. The NLR presumably consists of clouds with a wide range in densities (possibly ranging as high as 106 cm-3 ; DeRobertis & Osterbrock 1984, 1986) and, therefore, the low density regime assumed for the extranuclear gas is not consistent with the physical conditions of the unresolved inner NLR. Curiously, this problem does not seem to affect the observed correlations, however.
4.1. The traditional excitation diagrams
A strong case in favour of photoionization as the excitation mechanism for the extended ionized gas as well as for the NLR and LINERs (Ferland & Netzer 1983) and/or cooling flows is that the emission line spectra follow well-defined trends in excitation. This was shown by Robinson et al. (1987: RBFT) who used [0 r]/[0 III] (6300A!5007 A) as the excitation indicator. Such trends can be reproduced in photoionization calculations by simply varying the ionization parameter. We plot in Fig. 5 our own data adopting the diagram corresponding to Fig. 1a in RBFT. In calculating the ionization parameter sequence (long-dash line), we employed the same low density regime (n=50cm-3), metallicity (Z=1), energy distribution (a=-1.3)
~ ..... ~ 10
~ 9
?: 8
8 7 ID 6 6
3
"¥----._0 .... ~QO S
···-~::------- · ..
__ Aw;I seq.
___ U seq.
~:~ v
· .... :-,., .,
0.01 0.1
~
[OI]/[Om] (ft.6300/ft.5007)
" "' " " L
Fig. 5. Diagram of the line ratios [0 m]/H,B against [0 r]/[0 III]. Larger symbols denote the nuclear values. A dotted line joins measurements at different locations in the same galaxy. Filled symbols denote radio galaxies. The letters 'S' and 'L' indicate the positions of the "mean" Seyfert (as defined by F086) and a typical LINER, NGC 1167 (Ho eta!. 1993), respectively. The solid line represents the AM/I sequence (0.04 ::; AM/I ::; 16) with AM/I decreasing from left to right along the solid line. The asterisks are separated by 0.2 dex in AM/I and the larger asterisk denotes the position of the model with AM;I= 1. The long dashed line represents the traditional U-sequence with a separation in U of 0.2 dex between models (shown as asterisks). The range covers 4 10-4 ::; u ::; w- I (it extends beyond this figure's limits). The larger asterisk denotes the model with U = 0.004.
and opacity (Fuseq=0.97=Frn) as in the AM;I-sequence (solid line) defined in Sect. 3.
The main result of this comparison is that the AM;r- and U-sequences are very similar and therefore equally successful in reproducing the observed trends. The interpretations implied by these two sequences are completely different, however. The U-sequence is a genuine sequence in excitation with the [0 III] emitting zone becoming progressively more important relative to the [0 I] emitting region as U increases, while the AM;Isequence produces a similar, but only apparent, excitation trend as a result of the high excitation matter-bounded clouds becoming more and more dominant (in number or solid angle) over the IB clouds as AM/I increases. The two sequences are close to each other in other excitation diagrams, such as that of Baldwin et al. (1991: BPT) shown in Fig. 6. The two sequences also occupy quite similar loci in the classification diagrams of Veilleux & Osterbrock (1987). In traditional diagrams, in which trends are acceptably fitted by varying U, the data appear to be equally well fitted by the AM;I-sequence. We will now present new diagrams in which the two sequences present a markedly different behaviour.
© European Southern Observatory • Provided by the NASA Astrophysics Data System

1996A&A...312..365B
374 L. Binette et a!.: Temperature and excitation of the ENLR. II
~
...... ~ 10
~ 9 -;:::- 8
g 7 lO 6 6
3
----
. ... ··
-- A•/1 seq. ___ U seq.
\ \
L
2L-~~~~----~~~~~~J_--~---0.1 1
[On]/[ Om] (;\;\3727 /;\5007)
Fig. 6. Diagram of the line ratios [0 III]/H,6 against [0 n]/[0 III] as in Baldwin eta!. (1981). The symbols and lines have the same meaning as in Fig. 5.
4.2. A new excitation axis: He u!H{3
Since our starting point in adopting a MB component was to address the problem of the dispersion of He n/H{3 in AGN, we can expect the U and AM/1-sequences to behave very differently in diagrams involving He n/H{3. In Fig. 7, we plot [0 n]/[0 III] (3727 A/5007 A), the excitation axis of the first BPT diagram, against He IIIH{3. One striking result of the observations is that there exist strong correlations between He n/H{3 and the excitation of the spectrum. Such correlations have not been noticed previously in spectra of low to intermediate density regions in AGN.
The correlation of the He n/H{3 ratio with excitation is even more striking when we use the line reddening insensitive ratio [0 II]/[Ne v], which extends over 2.5 dex, as shown in Fig. 8.
Another reddening insensitive line ratio, [S n]/Ho:, is also found to be correlated8 with He n/H{3 (Fig. 9). We recall that either sequence is marginally optically thick (Fm=Fuseq=0.97). The intensities of the very low excitation lines, such as [0 I], [S II], [N I].A.A5200, depend sensitively on how thick we make the partially ionized zone which absorbs the penetrating soft Xrays. The fully thick case with Fm=l.O predicts too high a value of the [S n]/Ho: ratio, as shown by the Fm=l.O sequence represented by a short dash-dotted line in Fig. 9. This discrepancy might be explained by a molecular phase (not considered by MAPPINGS) which would reduce the temperature of this zone and therefore reduce the strengths of the above forbidden lines. Alternatively, the IB cloud may consist of a very thick and dense cold core of smaller cross section than its warm thiner outer halo which would still be sufficiently thick to reprocess over 90% of
Hints of a similar correlation appear present in the Fig. 6 of Morganti et al. (1991).
~ 0 0
~ o.O ......__ 0.8 1:'- 0.7 C\1 0.6 ~ 0.5
~ 0.4
~ 0.3 ..--. = £0.2
;::::, c'5 '--'0~0
0.08 0.07 0.06 0.05
0.04
0.03
\
' \ \
·· .. .-.~_.-_._._.. ,. ·. Sf tl\
t ·d... 1 I + I 4 .. l ·· .. I
t U seq. 0.02 I.Ull':":-~---"L.-..J'---'--::L...J......JL-J__,_uu.___,_w.J_-'-'--'_._j_,_,_,__.J.LLU-lu.u.L.
0.1 0.2 0.4 0.5 0.6 0.7 0.8
Heii/H,B {A4686/A4861)
Fig. 7. Diagram of the line ratios [0 n]/[0 III] against He n/H,6. The ~ymbols have the same meaning as in Fig. 5. The parameter AM/I zncreases from left to right along the solid line.
the radiation. It has often been argued before (e.g. Ferland & Mushotzky 1982; Ferland & Netzer 1983; VP92) that the the cloud's geometrical size must be truncated in order to reproduce the intensities of the [S II] and [0 I] lines. It is interesting to note that the total H column density of the IB clouds implied by the fully thick case (5.71020 cm-2) is 9 times higher than in the marginally thick case (solid line) in which 3% of the photons leak out. This indicates at least that the cloud sizes do not need to be fine tuned in our model.
The AM/I and U-sequences clearly present a very different behaviour in Figs. 7-9. We see that the U-sequences follow nearly vertical lines in these figures and are clearly totally inconsistent with our data. The AM/1-sequence, on the other hand, accounts in a natural way for all the trends observed in these figures in which He n/H{3 is used as an axis. Not only does the new sequence solve the He II problem, but it also maintains an acceptable fit to the optical forbidden lines. We therefore continue to use the He n/H{3 ratio in our plots, since it is a very effective discriminant between the AMW and U-sequences.
4.3. The high excitation lines
The weakness of the very high excitation lines is another major problem of standard models, as discussed in Sect. 1. Since our adopted UMB is relatively high, we expect stronger, very high excitation lines. This is confirmed in Fig. 10 which is a plot of [Ne V]/H{3 versus He n/H{3. The AM/1-sequence predicts ratios which fall within a factor of three of the observed values. Furthermore, the AM/I values inferred from the data points in this diagram are generally consistent with the values inferred in Figs. 5-9. This is notthe case for the U-sequence. If, for instance, we select an ionization parameter which fits most of the optical
© European Southern Observatory • Provided by the NASA Astrophysics Data System

1996A&A...312..365B
L. Binette et a!.: Temperature and excitation of the ENLR. II 375
0.09 0.3 0.6
60
40 I
'V.. f I 20
(!)
...... · ... ·.•····•··· ... i··· ....• C\l ..;< C'J -< 8 I• ---
0 ['- 6 I C\l 5 q ['- 4 C'J -< -< ~ 2
> ·. ·.
(J) ·.
~ 0.8
--- 0.6 ·.
:;' 0.5
~ s 0.4
0.2 ·.
• u seq. .. 0.08
0.1 0.2 0.4 0.5 0.6 0.7 0.8
Hell/H,B (A4686/A4861)
Fig. 8. Diagram of the line ratios [0 n]/[Ne v] against He n/H,6. The symbols have the same meaning as in Fig. 5. The parameter AM/I increases from left to right along the solid line. The U=0.004 model of the traditional U sequence has [0 rr]/[Ne v]=l53, which is offscale.
lines reasonably well (i.e. U=0.004 which gives [0 III]/H,B ~ 12), we obtain [Ne V]IH,8=0.02 and [0 II]/[Ne V]=153, which are offscale in Figs. 10 and 8, respectively. Only very high U values(;(; 0.015) can provide an acceptable value of [Ne v]/H,8 but at the expense of the low-to-intermediate excitation lines becoming inconsistent with the data.
C IV >.>.1549 is another high excitation line whose intensity is poorly predicted by the standard photoionization models. As our data do not include C IV, we compare in Fig. 11 the predictions of the AM;1-sequence with the 'mean' NLR Seyfert spectrum of F086. Considering that in previous diagrams the spectrum 'S' falls close to models with AM;1=I, we find that the corresponding model in Fig. II falls short by only a factor 2, while the traditional U-sequence underpredicts C IV/H,8 by a factor > IOO (for U = 0.004). It should be noted that the calculated C IV/C III] ratio at AM;1=I matches very well the value of"' 2.5 observed in many very high redshift radio galaxies (Villar-Martfn et al. 1996). We therefore conclude that the observed intensities of the high excitation lines are generally reproduced by the AM;1-sequence of models. Our code does not include Fe and we cannot, therefore, test quantitatively the agreement with the NLR [Fe X] and [Fe VII] lines. Since Fe+5
and Fe+6 , however, have similar ionization potentials to Ne+3
and Ne+4 , respectively, we can reasonably expect an improvement of the predicted strength of [Fe VII].A6087 similar to that obtained for [Ne v].A3426 in the AM;1-sequence in comparison with the U-sequence.
0.09 0.3 0.6
-."* AM/I seq.; FIB= 1.0 -.._
I • \ \ -0.9 "' ···· .. "\/ ' 0.8 .. \ '
C'J 0.7 ·<····\ '* (!) '.
ID 0.6 \
(!) \
< 0.5 ' \ ..;< C\l 0.4 ['-(!) I -< 0.3 i 6 I
* cs 0.2 :r::
;::::; ~
0.1 0.09 0.08 t u 0.07 seq.
0.1 0.2 0.4 0.5 0.6 0.7 0.8
Heii/H,B {X4686/M861)
Fig. 9. Diagram of the line ratios [S rr]/Ha against He n/H,6. The symbols have the same meaning as in Fig. 5. The short dash-dotted line corresponds to an AM;1-sequence with Fm= 1.0.
4.4. The temperature diagram Rom
Although photoionization models were recognized by RBFT as being generally successful in explaining the observed trends in the line ratios of EELR, TRM89 discovered how inadequate such models were in reproducing the high temperatures observed. One solution discussed by these authors was to assume very low metallicities (Z < 0.5) for the extended gas. They indicated that a hardened spectrum would also be required to maintain an acceptable fit to the other optical lines. The solution of simply truncating the ionized clouds was discussed but not retained since it would make the [N II], [0 II], [0 I] lines much too weak. Morganti et al. (I99I) attempted to account for the large observed values of He II/H,8 in terms of a smooth distribution of clouds of different thicknesses, but their model did not increase Rom sufficiently. As mentioned before, VP92 considered a dual distribution of MB and IB clouds but with the MB component being much too thin. We modified this scheme by using a thicker and much hotter MB component, as discussed in Sect. 2. In Fig. I2, we plot Rom against our excitation axis He n/H,B. We see that the AM;1-sequence (of solar metallicity gas) successfully crosses the zone occupied by the observations. Unfortunately, only upper limits could be determined for the nuclear Rom values of the radio galaxies. The moderate slope of the solid line is the result of the non-negligible [0 m].A5007 line contribution from the IB component. This slope decreases (increases) if a higher (lower) Pm/PMB ratio is adopted. This is shown by the dotted line in Fig. 12 which is an AMW sequence calculated with a larger pressure jump (Pm/PMs = 40) and a harder continuum (a= -I. I).
It should be noted that there does not appear to be any correlation between He n/H,B and temperature. The dispersion in
© European Southern Observatory • Provided by the NASA Astrophysics Data System

1996A&A...312..365B 376 L. Binette et a!.: Temperature and excitation of the ENLR. II
~ ..... co co "<!'
3
<1 co 0.9 ~ 0.8 C'J 0.7 6 0.6
0.5 <l:l. ~ 0.4
~ 0.3
~ 0.2
0.09
•... ··
.... · .. ·····
j.-··
0.3
t J:·::il . I
I I
• I I U seq.
0.6
.··· ...
0.1 lU.UJ.lll_--i...----'.----'.----'----'--'--'--'-.L...L~w....I..-'-'-1..Ll.J...LU..l.u..u.J.U.U.W
0.1 0.2 0.4 0.5 0.6 0.7 0.8
Heii/H,B (A4686/A4861)
Fig. 10. Diagram of the line ratios [Ne v]/H,B against He n/H,B. The symbols have the same meaning as in Fig. 5. The U=0.004 model of the traditional U sequence has [Ne v]IH,B=0.02, which is offscale.
Tom exceeds our errors (S 30%) and possibly points to real differences in metallicity between objects or between slit positions. Alternatively, there could be an intrinsic spread in the hardness of AGN ionizing continua. To show the effect of variation of the metallicity, we plot in Fig. 12 two sequences in Z (from 0.2 to 2 times solar) for values of AM/I of0.4 and 4.0. We emphasize that the position of the AM;r-sequence depends sensitively on the hardness of the ionizing continuum. Harder continua would raise the solar metallicity sequence in Fig. 12 (see dotted line in Fig. 12 which represents models with an ionizing continuum of index a = -1.1) and higher metallicities would then be needed to agree with the data. The zero point, therefore, of a possible Rom versus Z relation is not unique and cannot be determined at this stage.
It is interesting to note that Prieto et al. (1993) report much larger Rom measurements than us at various extranuclear positions in 3C227, many ranging between 0.04 and 0.1. The error quoted of s 50% for the weaker lines is higher than ours. Also the spectral resolution used (?: 11.2A) was worse than ours (SA) which casts some doubts on the reliability ofthe deblending of [0 III]M363 from H1' M340 in regions of low surface brightness. Morganti et al. (1991) measured line intensities at many positions in the outer filaments of Cen A. The range they find for Rom is fully consistent with ours, to within the errors quoted (S 40% ). In any event, if such high values as reported by Prieto et al. (1993) were confirmed, we would need to adopt a much harder ionizing source in our models. Furthermore, we do not expect pure photoionization models to provide values of Rom in excess of 0.06. Hybrid shock-photoionization models would appear necessary if higher values are confirmed. The problem, however, with this suggestion is that it is hard to obtain [0 III]/H,B ?: 10 with shocks except unless photoionization by
10
9
~ 8 ..... co 7 co ~ 6
' * 5 l{J ..... -< 4 6
___ U seq. __ A,1, seq .
/ /
/
/ /
/
/ /
/
/
s
// /
0.6 0.7 0.80.9 1 2 3
[Ctv]/Cm] (AA1549/A1909) 4 5
Fig. 11. Diagram of the line ratios C rv/H,B against C rv/C III]. The symbols have the same meaning as in Fig. 5. AM/I is increasing from left to right.
the shock dominates over collisional ionization. Considering the conditions under which the photoionizing shock models of Sutherland et al. (1993) result in [0 III]IH,B ratios in excess of 10, we find the same problems as in the standard photoionization model, since the shock simply generates the ionizing photons. One would presumably have to consider photoionization ofMB clouds by shocks to resolve this problem.
Another interesting aspect to consider is the expected temperature for the IB component as measured by the ratio RNrr=[N II]A5755/[N II]A6583. Since the MB component emits negligible [N II] as can be inferred from Table 2, the ratio RNrr=0.013 characterizing the IB component applies essentially to the whole AM;r-sequence. This corresponds to TNrr=9 200 K, which is consistent with the measured temperature of 10 000 ± 600 K in the NW knot of Cyg A (Tadhunter et al. 1994 ). We emphasize that a general characteristic of the Usequence (adopting U s0.01) is that the Tom temperature is only slightly higher (by less than 1 000 K) than the T NII temperature, while our AM;r-sequence predicts a much higher temperature difference of 5 000 K, in agreement with the observations of Tadhunter et al. (1994).
4.5. Miscellaneous aspects
4.5.1. LINERs revisited
AGN with low ionization spectra and classified as LINERs (Heckman 1980) are still difficult to comprehend. Many different and opposing models have been proposed over the years. One difficulty of models involving photoionization by a nuclear source is that such sources are often not seen (Maoz et al. 1995; Eracleous et al. 1995). The difficulty of the models is not in reproducing the emission line spectra but in pinning down the
© European Southern Observatory • Provided by the NASA Astrophysics Data System

1996A&A...312..365B
L. Binette et a!.: Temperature and excitation of the ENLR. II 377
O. 05 0,;; .m09;,.---,----,---,----.---r-""T"'""r-r..-0T.3T"T"r"T"TTT"TTTTTT0TT. 6TTn.,.,.,
0.04
~0.03 ,._ 0 0
"' ~ ~0.02 t")
""' 6
0.01 0.009 0.008
0.007
0.006
0.005
Z=0.2t
• I t
~ ... !'.s.~~·.lc<.:::-:.~:.1·r..:;::::::::::•····"' I
• I
_\.~)I sec>.·~"" I !»,.,, ;
I I I
+ I I I I
Z=2~
'Z=0.2
' \ ' • I
• I
*""" 41-------~----·•·-·*"' __ .............
f s I I I t I ,. I
0 I
I • I
t I
i I I
r I *Z=2
t i J U seq.
0. 004 lul.u.ul__..L.--l--1-..L_L-'--'--'-.L.L.L..WL..J....l.J...W..J..LLLU.l..u.u.Jlli.u.W
0.1 0.2 0.4 0.5 0.6 0.7 0.8
Heii/H,B (M686/A4861)
Fig. 12. Diagram of the line ratios Rom ( 4363AI5007 A) against HenJH,B. The symbols have the same meaning as in Fig. 5. AM/I is increasing from left to right. The two short-dash lines correspond to metallicity sequences (0.2 :<:::; Z :<:::;2.0) at AM/I = 0.4 (left) and 4.0 (right), respectively (a= -1.3). The asterisks indicate steps ofO.l dex in Z. The dotted line represents a solar metallicity AM;rseqi}ence calculated with a larger pressure jump (PmiPMa = 40) and a harder continuum (a= -1.1).
excitation mechanism. The ideas proposed so far range from stellar or nuclear photoionization to shocks. In the category of models consisting of (steady-state) photoionization by a nuclear power law UV source, two models have been proposed and are broadly successful in explaining the low ionization level observed. On the one hand, Ferland & Netzer (1983) proposed a slab photoionized by a power law but with a very low ionization parameter, while on the other, Halpern & Steiner (1983) proposed a scheme in which the ionizing energy is partially absorbed by broad line clouds which subtend a covering factor f at the nuclear source. Halpern & Steiner (1983) indicated that the modification of the ionizing spectrum by the absorber resulted in a line spectrum little different from that obtained by simply reducing U by a factor f. We argue that the He IIIH,6 ratio would be strongly affected in such a scenario. The ionizing spectrum illuminating the IB component in our model shares many similarities with the absorbed continuum proposed by Halpern & Steiner ( 1983) for LINERs, although in our case we propose that MB clouds (hidden from view by obscuring material: Fig. 4) instead of BLR clouds are the absorber. Whatever the nature of the absorber, we expect very similar effects on the continuum for a given value of FMB• namely a deeper absorption trough above the threshold of He+ than that of H0 (e.g. Ferland et al. 1996).
The motivation for applying the AM;r-sequence to LINERs stems from the fact that the sequence tends towards the position occupied by LINERs ("L'') in Figs. 5 and 6. One prediction
3
2
~
l'-C\1 l'-C'l -< -< ....... C'l 1 co 0.9 ll) tO 0.6 -< .._.. 0.7
"=' 0.6 6 ~0.5
3 0.4
0.3
0.2
•• ·-.. ·- ... _ ...
AY/1 seq.-
Q\
······<'? Z=0.2t t~ ...
··--- ... _ f ·· ... ·., , ·-._
•Z=0.2 I
'fil' ~
0.1 1
[On]/[ Om] (>-.>-.3727 />-.5007)
Fig. 13. Diagram of the line ratios [N rr]/[0 u] against [0 u]/[0 m]. The symbols have the same meaning as in Fig. 5. AM/I is decreasing from left to right. The two short-dash lines correspond to metallicity sequences (0.2 :<:::; Z :<:::;2.0) at AM/I = 4.0 (left) and 0.4 (right), respectively. The asterisks indicate steps of 0.1 dex in Z.
of our absorber model of LINERs is a ratio HeiiiH,6<0.01 (IB spectrum in Table 2) while the value calculated for a pure power law exceeds 0.15, as shown by Ferland & Netzer (1983). The fact that no reliable detection of the He II line in bona fide LINERs has been reported suggests that there could be a serious problem with the popular picture of simply reducing U in a standard power-law photoionization model. In cooling flow galaxies, the emission line filaments produce a low excitation spectrum which we suggest could also be the result of nuclear photoionization by an absorbed power law rather than by the surrounding hot X-ray gas. In the cD galaxy in the cluster Abell 2597, a measurement by Donahue (private communication) indicates He IIIH,6:s;0.05 which is lower than expected for a pure power law or a hot, X-ray emitting gas.
4.5.2. The [N II]/[0 II] problem discussed by VGDP
VGDP have studied the loci of hybrid (shock-photoionization) models in various line ratio diagrams. Such models are successful in accounting for temperatures up to Rom=0.06, but result in a much higher [N II]/[0 II] ratio than the mean value observed in EELR. VGDP argued in favour of a reduction of the N/0 metallicity ratio by a factor 4. Although such N/0 underabundance can be justified under certain scenarios of stellar activity, it is interesting to note that pure photoionization with solar metallicity is equally successful for the objects in our sample. This is shown in Fig. 13 in which we use the same axes as in VGDP. Our mean calculated value is also very similar to that of [N n]/[0 II] ~ 0.43 calculated by VP92 (see solid line in the Fig. 7 of VP92) who used solar N/0 and pure photoionization.
© European Southern Observatory • Provided by the NASA Astrophysics Data System
1996A&A...312..365B 378 L. Binette et a!.: Temperature and excitation of the ENLR. II
c;)
0.9
0.8
0.7
0.6
~ 0.5 <0 -< "- 0.4 ...-<
"' <[) 0> 6 0.3
ts :r:: "-= 0.2 Ul
0.1
__ AM/I seq.
U seq. n=50cm-'
...... U seq. n=2000cm-3
[Sn]/Ha (1.1.6724/1.6563)
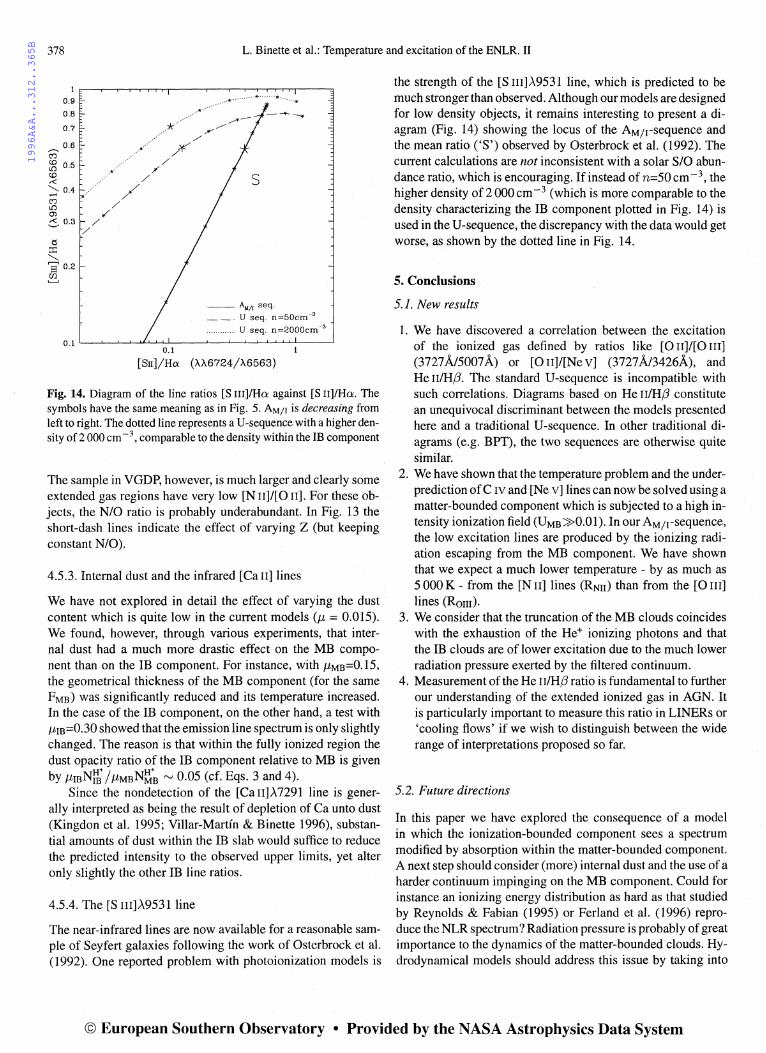
Fig. 14. Diagram of the line ratios [S m]/Ha against [S n]/Ha. The symbols have the same meaning as in Fig. 5. AM/I is decreasing from left to right. The dotted line represents aU-sequence with a higher density of 2 000 em - 3 , comparable to the density within the IB component
The sample in VGDP, however, is much larger and clearly some extended gas regions have very low [N II]/[0 II]. For these objects, the N/0 ratio is probably underabundant. In Fig. 13 the short-dash lines indicate the effect of varying Z (but keeping constant N/0).
4.5.3. Internal dust and the infrared [Ca II] lines
We have not explored in detail the effect of varying the dust content which is quite low in the current models (f..L = 0.015). We found, however, through various experiments, that internal dust had a much more drastic effect on the MB component than on the IB component. For instance, with f..LMs=0.15, the geometrical thickness of the MB component (for the same FMs) was significantly reduced and its temperature increased. In the case of the IB component, on the other hand, a test with f..Lm=0.30 showed that the emission line spectrum is only slightly changed. The reason is that within the fully ionized region the dust opacity ratio of the IB component relative to MB is given
H+j H+ by f..LmNm f..LMBNMB rv 0.05 (cf. Eqs. 3 and 4). Since the non detection of the [Ca II].A 7291 line is gener
ally interpreted as being the result of depletion of Ca unto dust (Kingdon et al. 1995; Villar-Martfn & Binette 1996), substantial amounts of dust within the IB slab would suffice to reduce the predicted intensity to the observed upper limits, yet alter only slightly the other IB line ratios.
4.5.4. The [S III].A9531 line
The near-infrared lines are now available for a reasonable sample of Seyfert galaxies following the work of Osterbrock et a!. (1992). One reported problem with photoionization models is
the strength of the [S m].A9531 line, which is predicted to be much stronger than observed. Although our models are designed for low density objects, it remains interesting to present a diagram (Fig. 14) showing the locus of the AM;1-sequence and the mean ratio ('S') observed by Osterbrock eta!. (1992). The current calculations are not inconsistent with a solar S/0 abundance ratio, which is encouraging. If instead of n=50 em - 3, the higher density of2000cm-3 (which is more comparable to the density characterizing the IB component plotted in Fig. 14) is used in the U-sequence, the discrepancy with the data would get worse, as shown by the dotted line in Fig. 14.
5. Conclusions
5.1. New results
1. We have discovered a correlation between the excitation of the ionized gas defined by ratios like [0 II]/[0 III] (3727 A/5007 A) or [0 n]/[Ne v] (3727 A/3426A), and He n/H,B. The standard U-sequence is incompatible with such correlations. Diagrams based on He n/H,B constitute an unequivocal discriminant between the models presented here and a traditional U-sequence. In other traditional diagrams (e.g. BPT), the two sequences are otherwise quite similar.
2. We have shown that the temperature problem and the underprediction ofC IV and [Ne v] lines can now be solved using a matter-bounded component which is subjected to a high intensity ionization field (UMs»O.Ol). In our AM;1-sequence, the low excitation lines are produced by the ionizing radiation escaping from the MB component. We have shown that we expect a much lower temperature - by as much as 5 000 K- from the [N II] lines (RNn) than from the [0 III] lines (Rom).
3. We consider that the truncation of the MB clouds coincides with the exhaustion of the He+ ionizing photons and that the IB clouds are of lower excitation due to the much lower radiation pressure exerted by the filtered continuum.
4. Measurement of the He n/H,B ratio is fundamental to further our understanding of the extended ionized gas in AGN. It is particularly important to measure this ratio in LINERs or 'cooling flows' if we wish to distinguish between the wide range of interpretations proposed so far.
5.2. Future directions
In this paper we have explored the consequence of a model in which the ionization-bounded component sees a spectrum modified by absorption within the matter-bounded component. A next step should consider (more) internal dust and the use of a harder continuum impinging on the MB component. Could for instance an ionizing energy distribution as hard as that studied by Reynolds & Fabian (1995) or Ferland eta!. (1996) reproduce the NLR spectrum? Radiation pressure is probably of great importance to the dynamics of the matter-bounded clouds. Hydrodynamical models should address this issue by taking into
© European Southern Observatory • Provided by the NASA Astrophysics Data System

1996A&A...312..365B
L. Binette et a!.: Temperature and excitation of the ENLR. II 379
account the differing heating function and opacity at high values of U from those at low values.
Since the successfull resolution of the three problems discussed in Sect. 1.2 requires matter -bounded clouds of the appropriate thickness (cf. Sect. 2.2), further studies by hydrodynamicists are needed to investigate whether an explanation exists for such preferred cloud's structure.
Observations with large aperture telescopes will be necessary if we hope to detect or set stringent limits on the value of the He n/H;J ratio in LINERs (& cooling flows) given the very low contrast of such weak emission lines against the underlying stellar continuum. Similarly, measurement of the weak [N n].\5755 line from extended ionized regions of moderate to high excitation will be crucial for confirming the validity of the MB/IB dual-component approach developed in this paper.
Acknowledgements. All calculations with MAPPINGS were carried
on the Convex (SPP1000XA) ofthe P61e Scientifique de Modelisation
Numerique (PSMN) based at the Ecole Normale Superieure de Lyon.
We are indebted to Arlette Rousset (groupe TIGRE) for the use of the
local workstation Fantasia and for the installation of the software. We
owe the drawing of Fig. 4 to Pierre Ferruit. LB would like to thank the
Observatoire de Lyon and STScl for its hospitality, and acknowledges
support from NASA grants NAGW-3268 and G0-3724.
References
Aggarwal, K. M., Herrington, K. A., Burke, P. G., Kingston, A. E., 1991, J. Phys. B. 24, 1385
Anders, E., Grevesse, N., 1989, Geochim. Cosmochim. Acta 53, 197 Baldwin, J. A., Phillips M. M., Terlevich, R., 1981, PASP 93, 5 (BPT) Baldwin et al., 1991, ApJ 374,580 Bergeron, J., Petitjean, P., Durret, F., 1989, A&A 213,61 Bertoldi, F. 1989, ApJ, 346,735 Bertoldi, F., McKee, C. F. 1990, ApJ, 354,529 Binette, L., Robinson, A., Courvoisier, T. J. L., 1988, A&A 194,65 Binette, L., Courvoisier, T. J. L., Robinson, A., 1988, A&A 190,29 Binette, L., Wang, J. C. L., Zuo, L., Magris, C., M., 1993a, AJ 105,
797 Binette L., Wang, J., Villar-Martfn, M., Martin, P. G., Magris C., M.,
1993b, ApJ 414, 535 Cameron, M., eta!., 1993, ApJ 419 136 Contini, M., Viegas-Aidrovandi, S.M., 1989, ApJ 343, 78 DeRobertis, M. M., Osterbrock, D. E., 1984, ApJ 286, 171 DeRobertis, M. M., Osterbrock, D. E., 1986, ApJ 301, 727 Dopita, M. A., Sutherland, R. S., 1995, ApJ 455, 468 Dopita, M.A., Sutherland, R. S., 1996, ApJS 102, 161 Durret, F., 1990, A&A 229,351 Eracleous, M., Livio, M., Binette, L., 1995, ApJL 445, L1 Evans, I. N., Dopita, M.A., 1986, ApJL 310, LIS Ferland, G. J., et al., 1996, ApJ in press Ferland, G. J., Mushotzky, R. F., 1982, ApJ 262, 564 Ferland, G., Netzer, H., 1983, ApJ 264, 105 Ferland, G. J., Osterbrock D. E., 1985, ApJ 300, 658 (F086) Filippenko, A. V., Halpern, J.P., 1984, ApJ 285,458 Fosbury, R. A. E., 1989, in: ESO Workshop on Extranuclear Activity
in Galaxies, eds Meurs, E. J. A., Fosbury, R. A. E., ESO Conf. and Workshop Proc. No. 32, Garching, p. 169
Halpern, J.P., Steiner, 1983, ApJL 269, L37
Haniff, C. A., Ward, M. J., Wilson, A. S., 1991, ApJ 368, 167 Heckman, T. M., 1980, A&A 87, 152 Ho, L. C., Filippenko, A. V., Sargent, W. L. W., 1993, ApJ 417, 63 Kingdon, J., Ferland, G. J., Feibelman, W.A., 1995, ApJ 439, 793 Magris C., G., Binette, L., Martin. P. G., 1993, in: The Nearest Active
Galaxies, ed. J. Beckman, Astrophysics and Space Science 205, p. 141
Maoz, D., eta!., 1995, ApJ 440, 91 Mathews, W. G., Ferland, G. J., 1987, ApJ 323,456 McCarthy, P., 1993, ARA&A 31, 639 Morganti, R., Robinson, A., Fosbury, R. A. E., di Serego Alighieri, S.,
Tadhunter, C. N., Malin D. F., 1991, MNRAS 249,91 Nazarova, L. S., 1995, A&A 299,359 Osterbrock, D. E., Tran, H. D., Veilleux, S., 1992, ApJ 389, 196 Pelat, D., Fosbury, R. A. E., Allain, D., 1981, MNRAS 195,787 Pequignot, D., 1984, A&A 131, 159 Pequignot, D., Dennefeld, M., 1983, A&A 120,249 Prieto, A., Walsh, J. R., Fosbury, R. A. E., di SeregoAiighieri, S., 1993,
MNRAS 263, 10 Reynolds, C. S., Fabian, A. C., MNRAS 273, 1167 Robinson, A., Binette, L., Fosbury, R. A. E., Tadhunter, C. N., 1987,
MNRAS 227, 97 (RBFT) Stasinska, G., 1984, A&A 135, 341 (ST84) Storchi-Bergmann, T., Wilson, A. S., Mulchaey, J. S., Binette, L., 1996,
A&A in press (Paper I) Sutherland, R. S., Bicknell, G. V., Dopita, M.A., 1993, ApJ 414,510 Tadhunter, C.N., 1986, D.Phil. Thesis, University of Sussex Tadhunter, C. N., Fosbury, R. A. E., di Serego Alighieri, S., Bland,
J., Danziger, J., Goss, W. M., McAdam, W. B., Snijders, M. A. J., 1988, MNRAS 235,403
Tadhunter, C. N., Robinson, A., Morganti, R., 1989, in: ESO Workshop on Extranuclear Activity in Galaxies, eds Meurs, E. J. A., Fosbury, R. A. E., ESO Conf. and Workshop Proc. No. 32, Garching, p. 293 (TRM89)
Tadhunter, C. N., Metz, S., Robinson, A., 1994, MNRAS 268,989 Unger, S. W., Pedlar, A., Axon D. J., Whittle, M., Meurs, E. J. A.,
Ward, M. J., 1987, MNRAS 228, 671 Veilleux, S., Osterbrock, D. E., 1987, ApJS 63, 295 Viegas, S.M., 1988, ApJL 330, L9 Viegas, S.M., de Gouveia Dal Pi no, E. M., 1992, ApJ 384,467 (VGDP) Viegas, S.M., Gruenwald, R. B., 1988, ApJ 324, 683 Viegas, S. M., Prieto, A., 1992, MNRAS 258, 483 (VP92) Villar-Martfn, M., Binette, L., Fosbury, R. A. E., 1996, A&A submitted Villar-Martfn, M., Binette, L., 1996, A&A in press Wilson, A. S., 1979, Proc. Roy. Soc. (London) (A) 366, 461 Wilson, A. S., 1995, in: Evidence for the torus, Proc. of the Oxford
astrophysics workshop, Aug. 30- Sept. 2, 1994, Ed. M. J. Ward, p. 55 in press
This article was processed by the author using Springer-Verlag IbTpc A&A style file version 3.
© European Southern Observatory • Provided by the NASA Astrophysics Data System