exchange traded funds (etfs) -...
TRANSCRIPT

Exchange Traded Funds (ETFs) 2011 J.P.Morgan Global ETF Handbook
This is intended for informational use only and is not intended as an offer to sell or a solicitation of an offer to buy shares of any ETF listed herein. This document is not intended for distribution to private customers as defined by the UK Financial Services Authority. Copyright 2011 JPMorgan Chase & Co. All rights reserved.

2
March 2011
ETFs allow an investor to quickly and easily obtain a desired market or benchmark exposure, by trading just a single security. ETF shares may offer intraday liquidity, and continuous, real-time trading and pricing.
ETFs are designed to allow an investor to quickly and easily obtain a desired market or benchmark exposure, by trading just a single security. ETF shares may offer intraday liquidity, and continuous, real-time trading and pricing.
April 2011

3
Exchange Traded Funds – ETFs ...................................... 4
ETF Market Overview ....................................................... 5
Special Topic Sections ..................................................... 7
US Listed ETFs .............................................................. 13
Canada & Latin America Listed ETFs ............................ 21
EMEA Listed ETFs ......................................................... 25
Asia-Pacific Listed ETFs ................................................. 43
Disclaimer & Disclosures ................................................ 47
Contacts ......................................................................... 48
Table of Contents

4
What Are ETFs? Each share of an ETF represents a fractional ownership interest in a portfolio of securities, commodities or other instruments. This investment medium has captured significant market interest. Total ETF assets under management have grown to over $1,523 billion globally (as of March 2011). In addition, the number of ETFs has grown to more than 3,700 (with almost 3,200 listed in the US and Europe). Furthermore, over the past year the US ETF daily turnover was on average ~32% of the total US equity daily turnover. Characteristics of ETFs ETFs have characteristics similar to those of both stocks and open-end mutual funds. Like stocks, ETFs are listed on the one or more stock exchanges. They also trade in the third market (i.e. over-the-counter) and through Electronic Communication Networks (ECNs). Like open-end funds, ETFs are available on a wide range of both broad and narrowly focused indices. An ETF investor can go long or sell short an entire portfolio of securities quickly and efficiently, by trading a single listed ETF. Advantages of Using ETFs ETFs allow an investor to quickly and easily obtain a desired market or benchmark exposure, by trading just a single security. ETF shares are designed to offer intraday liquidity, and continuous, real-time trading and pricing. Generally ETFs can be sold short, even on downticks, and can be purchased on margin by an investor seeking leverage. They are also intended to be tax efficient. Mutual funds are often forced to liquidate portions of their holdings, in order to meet investor redemptions; this can generate capital gain distributions for shareholders. Many ETFs, on the other hand, are created and redeemed “in-kind” by Authorized Participants. As a result, capital gain distributions and the internal costs associated with buying and selling securities in response to shareholder activity are minimized. Many ETFs such as commodities or certain fixed-income ETFs, will also use in-cash creation and redeptions. Do ETFs Pay Dividends? If the securities held in trust pay a dividend, the ETF will typically distribute a portion of such dividends, less any fees and expenses of the trust, to shareholders. This is typically done on a quarterly basis. Liquidity and Trading Liquidity is one of the key benefits that ETFs can offer. Investors sometimes mistakenly assume that there is insufficient liquidity in ETFs; however, this is often not the case. Broker-dealers acting as “Authorized Participants” can create new ETF shares on a real-time basis. The result is that each ETF can be as liquid as its underlying securities, commodities or other instruments. In the primary market, ETFs are issued by trusts, limited partnerships or other vehicles in large-sized blocks (typically 50,000 shares) called “Creation Units.” Each “Authorized Participant” can deposit a specified portfolio with the trustee or its administrator, sponsor, or distributor in exchange for a Creation Unit. The Creation Unit is then broken up, and the ETF shares are offered on exchanges in the secondary market where investors can buy or sell ETF shares in smaller quantities. Similarly, authorized participants can redeem ETFs by exchanging a block-sized unit of ETFs for the underlying portfolio
Snapshot of the Global ETF Market The pie chart below depicts total global assets under management (AUM) in billions of dollars, broken down by region. US ETFs, followed by European ETFs, account for the largest portion of total ETF assets. Global AUM ($Bn)
$1,058
$322
$93$50
US
Europe / Mid. East / Africa
Asia / Pacific
Canada & Latin America
Source: J.P. Morgan Derivatives and Delta One Strategy. Data as of March 2011. Risks and Considerations of Using ETFs ETF shareholders are subject to risks similar to those of holders of other portfolios. A primary consideration is that the general level of prices within the portfolio may decline, affecting the value of each ETF share. In addition, the overall depth and liquidity of the secondary market may fluctuate. A Sector-focused ETF may be adversely affected by the specific performance of its targeted benchmark. International investments may involve the risk of capital loss as a result of unfavorable fluctuations in currency values, differences in generally accepted accounting principles, or economic and political instability in other nations. Although ETFs are designed to provide investment results that generally correspond to the price and yield performance of their respective underlying indices, ETF managers may not be able to exactly replicate the performance of the indices because of expenses and other factors. ETF shareholders are typically subject to expense fees charged by the issuer, and transactions are subject to standard brokerage equity-trading commissions. For a more comprehensive list of other risk factors, see the “Possible Risks of Investing in ETFs” section at the end of this document.
Exchange Traded Funds – ETFs

5
Snapshot of the US ETF Market The US listed ETF industry has grown dramatically in the last few years, not only in size (measured in assets under management) but in number (measured by the number of ETFs in existence). There are now 1,139 ETFs listed in the US, which hold $1,058 billion of assets (as of March 2011). As recently as 2001, trading was dominated by broad-based ETFs such as SPY and QQQQ, which held 90% of total assets under management (AUM). However, as new offerings came to market, the asset base began to diversify. Broad-based ETFs now account for just 27% of total ETF assets, while international ETFs have grown to control 24% – up from just 3% in 2001. Style-based funds have also grown to represent a proportionally larger piece of the ETF universe, increasing from 3% to 12% of ETF assets during the same period. Sector funds have grown from 5% to 13% of the total. Finally, Fixed Income, Commodity, and Currency ETFs now represent 24% of total ETF assets. The pace of the growth in number of new ETFs launched has increased over the past year, as compared to 2008 and 2009. By creating 198 ETFs in 2008 and 132 in 2009, providers have attempted to cover more of the investable universe. About 217 new ETFs were launched in 2010, which translates into a ~60% year-over-year increase in new ETF listings. Year to date, approximately 40 new ETFs have been launched. Amid the turmoil in the global markets and as a sign that the ETF market has grown rapidly and may have started to mature, 50 ETFs were liquidated since March 2010. Out of the 255 total new launches since January 2010, 29% were international, 20% were sector, and another 20% were fixed income focused ETFs. Based on Assets Under Management (AUM), the largest new launches were in the Sector (~28%), International (~19%), Commodity (~18%) and Fixed Income (~16%) categories. Out of the new launches that attracted the largest assets, ETFs with commodity underlyings like Palladium and Platinum attracted a significant portion.
US AUM ($Bn)
$281
$125
$137$260
$143
$113
$50
Broad
Style & Asset Allocation Funds
Sectors
International
Fixed Income
Commodity & Currency Funds
Canada & Latin America
Source: J.P. Morgan Derivatives and Delta One Strategy. Data as of March 2011.
ETF Market Overview

6
Snapshot of the European ETF Market The European listed ETF market differs from that in the US. There are 2,053 European ETFs and ETCs (Exchange Traded Commodities), which hold $322 billion of assets (as of March 2011). Approximately 600 of these ETFs and ETCs are cross listed on multiple exchanges in Europe. More than 30% of AUM is held in broad-based ETFs; style-based ETFs account for ~ 3% of assets. While the asset base is less diversified than in the US, there is more choice among ETFs that cover alternative assets; for instance, there are 533 commodity-related ETFs and ETCs, and 337 fixed income ETFs. European AUM (€Bn)
€ 77
€ 7
€ 13
€ 56
€ 43
€ 37
Broad
Style
Sectors
International
Fixed Income
Commodity / Currency
Source: J.P. Morgan Derivatives and Delta One Strategy. Data as of March 2011.
Snapshot of the Asia-Pacific ETF Market ETF issuance in the Asia-Pacific region has occurred at a slower pace than in the US and Europe. There are currently 451 listed Asia-Pacific ETFs, the first of which was issued in April 1995. Since January 2010, AUM has grown by around 13%, to ~$93 billion USD (as of March 2011). More than a third of these assets (~$38 billion) are held in China focused, and a third (~$30 billion) are held in Japan-focussed ETFs. Asia-Pacific AUM ($Bn)
$30
$38
$2
$4
$9
$3$6
Japan
Hong Kong/China
Taiwan
South Korea
Other Countries
Sector / International Funds
Fixed Inc / Commodity / Crncy
Source: J.P. Morgan Derivatives and Delta One Strategy. Data as of March 2011.
ETF Market Overview

7
The first ETF was created in Canada in 1990 (TSE 35 participation units), and the first and most popular US ETF (the S&P 500 SPY fund) was launched in 1993. However, it was not until the late 1990s, that ETFs became an important segment of equity markets. By 2000, US ETFs traded on the S&P 500 and Dow Jones sectors, international MSCI indices, major US capitalization and style benchmarks. The first ETF in Asia was launched in 1999 and in Europe in 2000. By the end of 2001, there were more than 100 US ETFs. Over the following decade, ETFs grew to be so important that in early 2009 ~40% of all US equity volumes was traded in ETFs. In 1998, the first options were listed on the SPDR S&P 500 sector and S&P Mid cap ETFs, marking the beginning of the ETF options market. By the end of 2005, options traded on about 100 different ETFs, and ETF options volume grew to represent about 30% of all stock option volumes. The growth of the ETF option market over the past 5 years has been even more dramatic than the growth of ETF volumes. In the second half of 2010, US ETF options volumes exceeded the volume of all US stock options combined (Figure 1). In the US, currently both ETF daily option volumes (~$50bn) and outstanding open interest (~$500bn) are at an all-time high. Currently, 372 US ETFs have listed options (about one third of all US ETFs). Outside of the US, the ETF option market is still in its infancy. ETF daily option volumes in Europe and Asia are orders of magnitude lower than in the US, and less than 1% of all ETFs in these regions have listed options trading. Figure 1: The volume of US ETF options has grown to match total US stock option volumes.
0
10
20
30
40
50
60
May, 97 Feb, 00 Nov, 02 Jul, 05 Apr, 08 Jan, 11
Avg
. Dai
ly O
ptio
n V
olum
e ($
Bn)
Stock Option Volume
ETF Option Volume
Source: J.P. Morgan Equity Derivatives Strategy.
Options on ETFs have an American-style exercise feature. They are physically settled (the same as stock options and distinct from index options which are cash settled). ETF options follow the expiration schedule of stock options. This generally means options are listed with two near month maturities and two maturities from the March quarterly cycle (March, June, September, and December). Many ETFs also have long-term options (LEAPS) available. ETF options expire on the Saturday following the third Friday of the expiration month. More recently, quarterly options (expiring the last business day of each calendar quarter) and even weekly options started listing for selected
ETFs. Out of the money ETF call and put options are listed with a typical strike increment of $1. As ETF options provide exposure to broad equities, equity sectors, styles, capitalization segments, or country benchmarks, they are most commonly used for portfolio hedging. In addition to equity hedging, ETF options are also used to obtain leverage or implement relative value macro trades in a risk controlled manner. Similarly, non-equity ETFs are used for asset allocation, and cross-asset hedging. The widespread use of ETF options as a portfolio hedging tool can be inferred from the proportion of outstanding put and call options (P/C open interest ratio). Figure 2 below shows the P/C open interest ratio for ETF options, stock options and index options over the past 10 years. For both index options and ETF options there is ~1.6 put options for every call option outstanding. This suggests that ETF options are used in protection strategies such as long puts, put spreads and put-spread collars. This is different from the stock options market, where investors typically trade a greater proportion of call options for upside leverage or as a part of call overwriting strategies (~0.8 put options for every call option outstanding). While almost 400 US ETFs are optionable, most of the ETF option activity is driven by a relatively small number of ETFs. The table on the following page shows the average daily option volumes for the 15 most liquid ETFs in the US. The option volumes on these ETFs have recently contributed around ~70% of the total ETF option volumes for all US ETFs. Out of these 15 most actively traded ETF options, 4 are based on broad equity indices (the S&P 500, Russell 2000, Dow Jones Industrial Average, S&P 400), 4 on equity sector based indices (NASDAQ 100, S&P 500 Energy, Financials, and Mining sectors), 3 on international benchmarks (MSCI Emerging Markets, MSCI Brazil, MSCI EAFE), and 4 on commodities, fixed income and currency ETFs (Gold, Silver, Euro, 20y Treasury). Figure 2: The ratio of ETF put to call open interest is similar to that of index options, but distinct from the ratio for stock options.
0.0
0.3
0.5
0.8
1.0
1.3
1.5
1.8
2.0
Mar 01 Mar 03 Feb 05 Feb 07 Jan 09 Jan 11
Index P/C
ETF P/C
Stock P/C
Source: J.P. Morgan Equity Derivatives Strategy.
Special Topic 1: ETF Options

8
Table 1: Average daily notional option volumes for the 15 most liquid US ETFs ($Bn)
ETF ETF Type '07 '08 '09 '10 YTD SPY Broad/Large 8.2 14.8 12.7 19.9 25.5 IWM Broad/Small 4.8 4.0 1.5 3.1 4.3 GLD Commodity -- 0.3 1.3 2.5 3.3 QQQQ Sector 3.5 3.6 2.1 2.2 2.8 EEM International 0.7 1.0 0.6 1.0 1.3 DIA Broad/Large 1.1 1.6 0.7 0.8 0.7 SLV Commodity -- 0.0 0.0 0.2 0.6 EWZ International 0.1 0.3 0.5 0.7 0.6 XLE Sector 0.5 1.0 0.4 0.3 0.5 XLF Sector 0.5 1.0 0.4 0.4 0.4 GDX Sector 0.0 0.1 0.1 0.3 0.4 TBT Fixed Inc. -- 0.0 0.1 0.2 0.4 FXI Currency 0.3 0.2 0.3 0.4 0.3 EFA International 0.0 0.1 0.2 0.2 0.2 MDY Broad/Mid 0.3 0.2 0.0 0.1 0.1
Source: J.P. Morgan Equity Derivatives Strategy. More than 50% of all ETF option volumes are linked to the SPDR S&P 500 ETF Trust (SPY). SPY options were launched in January 2005, and quickly became the most liquid option on an individual security. SPY options were initially meant to cater to retail investors and smaller institutions, given the small size of the contract relative to S&P 500 index options (the SPY option contract is 1/10th the size of the S&P 500 index option contract). Initially, the bid-offer spread (adjusted for the contract size) of both contracts were similar, and large investors steered towards S&P 500 options due to the lower commission rate (the commission for an SPY option trade is 10 times higher). However, since early 2008, bid-offer spreads for SPY options significantly decreased relative to S&P 500 index options. Currently, the average bid offer of an SPY option is ~10c, while the bid offer for an S&P 500 option (adjusted for the contract size) is ~25c. Even including a larger commission for SPY options of ~5c, SPY options transaction costs appear lower than those for S&P 500 options. While many investors do not pay a full bid-offer spread when trading S&P 500 index options, the cost advantage of SPY options caused a steady growth in their volume, eating into the market share of S&P 500 options. Over the past 3 years, SPY option volume has grown from ~5% to ~35% of S&P 500 option volume. Figure 3 shows bid-offer spreads for S&P 500 and SPY options, as well as SPY option volume as a percentage of S&P 500 option volume.
Figure 3: Exchange Closing Average Bid-Offer Spread for S&P 500 Index and SPY ETF Options (Left Axis). SPY Option Volumes as a Percentage of S&P 500 Index Option Volumes (Right Axis).
0
0.1
0.2
0.3
0.4
0.5
0.6
0.7
0.8
Jan, 05 Jul, 06 Jan, 08 Jul, 09 Jan, 11
SPY
and
SPX
Opt
ion
Spre
ads
0%
5%
10%
15%
20%
25%
30%
35%
SPY
Opt
ion
Vol
ume
(% o
f SPX
)SPY Option Vol. as % of SPX Option Vol.
SPY Spread
SPX Spread
Source: J.P.Morgan Equity Derivatives Strategy, Bloomberg. In addition to simple portfolio hedging, ETF options are used in more complex volatility trading strategies. This activity has greatly improved the liquidity and price efficiency of the Equity ETF options market. A typical ETF volatility trading strategy is arbitrage between an ETF option and options on stocks comprising the ETFs. This ‘correlation’ trade typically consists of selling (and delta hedging) an ETF option and buying (and delta hedging) options on individual ETF constituents. A typical ETF correlation trade consists of selling an S&P 500 Sector SPDR option (e.g. XLE) and buying options on its constituents (e.g. XOM, CVX, SLB, COP, etc.) in proportion to their weights in the index. This trade is called an ‘intrasector’ correlation trade. Another correlation trade consists of selling SPY options and buying options on the sector constituents (XLK, XLE, XLF, XLI, XLV, etc.) in proportion to the sector weights in the index. This trade is called an ‘intersector’ correlation trade. Intrasector and Intersector correlation trades will tend to align the pricing of index options, sector ETF options and individual stock options, and reduce the amount of supply/demand friction between these different option markets. Another innovation that came as a result of a more liquid ETF option market is ETF variance swaps. An ETF Variance swap is an over-the-counter derivative that provides exposure to the realized volatility of an ETF. For instance, a long XLE variance swap position would profit if the realized volatility of the SPDR Energy Sector ETF is higher than the implied variance level (or strike) traded, and will incur a loss if the realized volatility of XLE is lower than the strike. Broker dealers are currently offering variance swaps based on the most liquid S&P 500 Sector SPDRs and some broad benchmarks (e.g. SPY or IWM). Dealers hedge a variance swap position by trading ETF options of all available strikes. Variance swaps can be used to express a directional view on the volatility of a particular sector or index and are frequently used as a tool to set up the correlation trades described above.
Special Topic 1: ETF Options

9
Introduction to Commodities-based ETFs and ETCs The ETF industry can be credited with providing cost effective access to alternative asset classes that had previously been impractical or prohibitively expensive for many investors. In particular, Commodity ETFs and Exchange Traded Commodities (ETCs), which can offer diversification for traditional stock and bond portfolios, have been the fastest growing segment of the ETF market over the last year. Global assets under management have grown 50% year on year, and now exceed US$160 billion. While the first ETC, Gold Bullion Securities, began trading in 2003, ETFs now cover every major commodity group and are available in short, leveraged and bundled formats. There are 100 commodity-based ETFs in the US with $107 billion AUM (up 43% since January 2010) and 533 ETCs in Europe with $51 billion AUM (up 60% since January 2010). The Asian commodity ETF market is smaller with only 29 ETFs managing US$ 2 billion. A further 28 Commodity ETFs are listed in Canada and Latin America, with ~ US$ 4 billion of assets. As of March 2011, around 75% of US commodity ETF assets (~US $ 80 billion) were in metals based ETFs. The SPDR Gold Trust (GLD) alone accounts for ~$55 billion (up from ~$40 billion in January 2010), making it the second largest US ETF, after the SPDR S&P 500 (SPY). Figure 5 shows the breakdown of Assets under management among the top Commodity ETFs.
Figure 4: Commodity ETFs Assets Under Management (US & EMEA) - $Bn
$0
$20
$40
$60
$80
$100
$120
2005 2006 2007 2008 2009 2010 2011
AU
M ($
B)
US Commodity ETFs
EMEA Commodity ETFs
Source: J.P. Morgan Equity Derivatives Strategy.
Figure 5: Current AUM in Largest US Commodity ETFs - $Bn
GLD, 52%
Others - Energy, 3%
SLV, 11%
UNG, 2%
GSG, 2%USO, 2%
DBC, 5%
IAU, 5%
DBA, 3%
DJP, 3%
Others - Metals, 7%
Others - Broad, 2%
Others - Softs, 2%
Source: J.P. Morgan Equity Derivatives Strategy
In addition to Gold, Silver and Oil based ETFs, those with agricultural commodity underlyings have gained greater attention. The United Nations FAO Food Price Index that tracks the prices of 55 agricultural commodities globally has risen 40% over the last year. Over the same period, the total assets under management of ETFs that track the prices of soft commodities like wheat, corn, sugar, cotton and livestock increased ~65% to ~US$ 5 billion, though this still represents a small proportion (~5%) of overall commodity ETF assets. Energy based ETFs that track the prices of crude oil and natural gas currently manage ~US$ 7 billion of assets. Broad based commodity ETFs that invest in diversified baskets of commodities such as oil, metals, and agricultural commodities currently manage ~12% of total commodity ETF assets. The average expense ratios of these broad based commodity ETFs is ~8 bps higher than the average across all commodity ETFs. The following chart shows the evolution of the different types of US commodity based ETFs over the past four years.
Figure 6: Growth of Commodity Based ETFs (US) - $Bn
$0
$10
$20
$30
$40
$50
$60
$70
$80
$90
Jan, 07 Nov, 07 Sep, 08 Jul, 09 May, 10 Mar, 11
AU
M ($
B)
$-
$2
$4
$6
$8
$10
$12
$14
$16
AU
M ($
B)
Metals: [Left]Broad Commodity: [Right]Soft: [Right]Energy: [Right]
Source: J.P. Morgan Equity Derivatives Strategy The following table shows the evolution of assets under management in the top 10 US listed commodity ETFs over the past five years.
Table 2: Average AUM in Top US Commodity Based ETFs - $Bn
ETF Type '06 '07 '08 '09 '10 YTD GLD Metals 7.26 11.69 18.69 33.53 48.82 54.73 SLV Metals 6.26 1.83 2.86 4.05 6.31 10.52 DBC Broad 0.47 1.03 2.02 2.77 4.50 5.53 IAU Metals 0.76 1.07 1.74 2.28 3.59 5.16 DBA Soft -- 0.43 2.02 1.99 2.23 3.35 DJP Broad 0.21 1.77 2.89 1.38 2.22 3.02 UNG Energy -- 0.21 0.74 2.75 3.01 2.37 GSG Broad 0.03 0.28 0.69 1.22 1.64 1.88 USO Energy 0.30 0.73 0.90 2.59 1.91 1.86 RJA Soft -- 0.01 0.22 0.22 0.33 0.65 Others Metals -- 0.14 0.58 1.79 4.42 7.60 Others Broad 0.06 0.24 0.48 0.65 1.17 2.11 Others Soft -- 0.01 0.38 0.35 0.54 1.20 Others Energy 0.01 0.15 0.43 1.87 2.43 2.69
Source: J.P. Morgan Equity Derivatives Strategy. Average AUM over year
Special Topic 2: Commodity ETFs

10
The pace of new Commodity ETF launches has slowed. In 2008, 53 new commodity ETFs were launched, while only 15 new ETFs have been launched over the past two years. Most of these new launches are ETFs that track metals and energy underlyings. Among the most recent launches, three of the largest in terms of assets under management are: PPLT, PALL and USCI, which track the prices of Platinum, Palladium and a diversified commodity index, respectively. The Structure of Commodity Based ETFs While some Commodity ETFs hold the physical commodity (common with precious metals), lack of heterogeneity (commodities may differ in quality, weight and type), the perishable nature of some commodities and difficulties associated with physical delivery and storage can make it impractical for asset managers to hold the physical asset. Therefore the majority of Commodity ETFs hold futures or swap contracts rather than the underlying asset. The use of futures solves many of the problems inherent in trading physical commodities, but can create a drag on performance. Contango and Backwardation Futures returns are driven by prices of the underlying asset, changes in interest rates and carrying costs and the roll yield (roll return). The main source of divergence between the performance of a rolling commodity futures position and the performance of the underlying spot price is the roll yield. To maintain exposure and avoid taking delivery of the physical commodity, it is necessary for the ETF provider to roll the investment by selling the near-expiry futures contract and reinvesting the funds in a later-dated contract. The process of rolling may lead to a boost or drag to the investment. Positive roll yield occurs when the futures term structure is downward sloping (Backwardation), i.e. futures prices are lower for longer maturities than they are for shorter maturities. Rolling futures contracts in this market condition will positively influence the fund returns as the ETF provider sells the more expensive front contract to purchase the longer-dated contract at a lower price. Negative roll yield occurs when the futures term structure is upward sloping (Contango). This will negatively affect the fund returns with a rolling futures contract strategy, as the ETC will erode in value due to selling the cheaper front contracts and buying the more expensive longer-dated contracts each time the position is rolled. The shape of the futures curve depends on several factors: interest rates, storage and transportation costs, inventories, the interaction between demand and supply for hedging purposes by producers and consumers of the commodity and potentially the actions of speculators. The simplest and most effective way to avoid the drag due to contango is to invest in physically backed ETCs. Because these ETCs hold the actual commodity, the returns received will be the same as the spot price of the commodity less management fees (which include the cost of storage). The problem, as we have highlighted above, is that not all commodities lend themselves to physical investment. In Europe, for example, physical ETCs are currently available on gold, silver, platinum, palladium, copper, tin and nickel, and are expected to be listed on aluminium, lead and zinc.
Another way to potentially gain exposure to certain commodities without having to invest in futures based ETFs could be to invest in equity based sector ETFs, or ETFs tracking the performance of certain resource rich countries. For example, the Energy Select Sector SPDR (XLE) that tracks the performance of companies that develop and produce crude oil and natural gas, drilling and other energy related services, is highly correlated to crude oil prices, due to high individual correlation between oil prices and E&P stock price performance. Similarly, Market vectors Russia ETF (RSX), and iShares MSCI Canada (EWC) offer indirect exposure to oil due to the high correlation between oil prices and the respective countries’ stock markets. Oil ETFs Take the case of oil. ETCs gain exposure to oil through futures due to the high transportation and storage costs associated with trading the physical commodity. Oil futures contracts have been in a persistent state of contango since 2009, causing tracker products to suffer significant negative roll yield. The United States Oil Fund (NYSE Arca: USO) which tracks the NYMEX WTI crude futures has often been in the spotlight as being a poor proxy for the spot price of crude oil due to the performance drag resulting from its strategy of rolling from the first to second month contract. The wide divergence between USO and the NYMEX WTI crude price is primarily due to the fact that the oil futures curve has had a steep upward slope, resulting in negative roll yield. Figure 7: Performance of USO vs. WTI Spot
0
50
100
150
200
250
Jan'09 Apr'09 Jul'09 Oct'09 Jan'10 Apr'10 Jul'10 Oct'10 Jan'11
USO
WTI Crude Oil Spot
Source: J.P. Morgan Equity Derivatives Strategy The following strategies are amongst those employed by Commodity ETF providers. In some cases, more advanced rolling strategies have been developed to minimize, mitigate, or even exploit, roll yield.
Special Topic 2: Commodity ETFs

11
Investing in near month futures contracts and rolling to the next month before expiration. As contango or backwardation is frequently steepest at the front end of commodity forward curves, ETCs that roll shorter dated maturities will generally be most sensitive to roll yield. Funds like the United States Oil Fund (USO) that tracks WTI crude oil and the United States Brent Oil fund (BNO) that tracks Brent crude oil employ this rolling front month futures strategy and have therefore suffered due to contango in the oil futures curve. Investing in a strip of futures contracts spanning several months. Many ETFs invest in longer-dated futures contracts or spread exposure over a range of different maturities. For example, United States 12-month oil ETF (USL) offers exposure to WTI Crude oil using a strip comprising futures contracts from the next 12 months. Though the expense ratio of USL is higher than USO, it has suffered a smaller performance drag from negative roll yield. Selecting a specific contract from amongst a strip of futures contracts. Some ETCs adopt rule based strategies to select the most favorable contract while rolling over their positions. Before the contract being held expires, these ETFs purchase the “cheapest” contract from a strip of contracts to minimize the “roll yield”. The Source S&P crude oil enhanced ETC (SEWTI) for instance, chooses between the next month and six month contracts depending on the steepness of the forward oil curve. There are also some ‘Optimum Yield’ ETCs which use rules-based quantitative strategies to manage the process of rolling futures positions in the component commodities. An ETC using this strategy is the Powershares DB Oil Fund (DBO). Investing in a weighted average strip of long term futures. Several ETCs invest in oil through a pre defined combination of futures contracts spanning several months. A very recently launched oil ETC, Teucrium Crude Oil Fund (CRUD) (launched on Feb 24, 2011) offers exposure to crude oil by investing in a strip comprising of 35% nearest to spot June or December contract, 30% June or December contract following it, and 35% following December futures contract. ETNs Exchange Traded Notes are debt instruments that closely replicate the benchmark oil indices, but hold no futures or securities. They do carry issuer credit risk. Some examples are Powershares DB Crude Oil ETN (OLO) and Ipath GS Crude Oil Total Return Index ETN (OIL). While holding longer dated contracts may reduce ETF performance drag due to negative “roll yield”, it also reduces an ETF’s sensitivity to changes in the spot oil price. An instructive metric to consider is the annualized “roll yield” drag per unit of beta delivered. Generally, one would prefer an oil ETF that has a smaller negative “roll yield” for the same amount of exposure to WTI (beta). The following table shows the US listed ETFs (long, short, and levered long/short) that track the WTI crude oil spot price. The historical alpha, beta, and correlation to WTI oil of each ETF are also shown.
Table 3: Annualized “Roll Yield” vs. WTI Beta of US listed WTI Oil Based ETFs with Trading History of at least One Year.
ETF Leverage Oil Correl. "Roll Yield" Beta Roll Yield/Beta
DBO +1 WTI 89% -4% 0.76 -0.06 USL +1 WTI 88% -1% 0.74 -0.02 OLO +1 WTI 86% -5% 0.75 -0.06 USO +1 WTI 94% -16% 0.92 -0.18 OIL +1 WTI 94% -18% 0.97 -0.18 DNO -1 WTI -94% 7% -0.92 -0.08 SZO -1 WTI -90% 7% -0.88 -0.08 SCO -2 WTI -93% 3% -1.77 -0.02 DTO -2 WTI -92% 9% -1.77 -0.05 UCO +2 WTI 93% -33% 1.74 -0.19
Source: J.P. Morgan Equity Derivatives Strategy. Daily Returns from March 2010 to March 2011 WTI Crude vs. Brent Brent and WTI crude are the most widely followed oil benchmarks. WTI, which is refined in the mid west and Gulf cost regions of the US, is sweeter and lighter than Brent which is refined in Northwest Europe. WTI crude oil futures have historically traded at a premium to Brent (the average WTI-Brent premium has been ~$1 per contract over the last ten years). However, this spread has recently reversed and moved to an extreme discount of ~$10 due to an inventory build up in the US and Middle East tensions affecting supplies to Europe.
Figure 8: Premium of WTI Crude Oil over Brent
-25
-20
-15
-10
-5
0
5
10
15
20
25
Jan,04 Jun,05 Nov,06 Apr,08 Sep,09 Feb,11
Premium1 M Moving Avg.
Current discount ~ $10.8, 98th percentile (5-year)
Source: J.P. Morgan Equity Derivatives Strategy
If this dislocation is fundamentally driven and the spread reverts to its historical average, it could highlight a potential trading opportunity. Investors may monetize this view by trading futures, or ETFs tracking these contracts. There are a number of ETFs that track WTI oil futures, including USO, WTI, DBO, USL and CRUD. BNO (United States Brent Oil Fund, launched in June last year) tracks the Brent crude futures. OILB LN is another 1 month open-ended ETC that tracks the total return of ICE Brent oil futures.
Special Topic 2: Commodity ETFs

12
European ETF Markets Since the first European ETF was launched in 2000, assets under management have grown to €233Bn, spread across over 2,000 funds. Despite the rapid growth in this market, European ETFs account for just ~5% of cash equity exchange volumes, compared to ~32% in the US. The European ETF market has several idiosyncrasies which have impacted the development of this market, leading to much lower liquidity levels of European ETFs compared to their US counterparts. In the following paragraphs we highlight some of the key characteristics of the European ETF markets. Fragmentation of Liquidity European ETFs are often listed in multiple countries in order to attract retail investor flows, as many European investors often can only trade (or prefer to trade) on their domestic exchange. In the 2011 version of our guide, we have included the major listings for each ETF on foreign exchanges (‘cross listings’). For example, the iShares Euro Stoxx 50 ETF has listings in London (EUE LN), Italy (EUE IM), and Switzerland (EUNE SW), among others. Table 4 below, extracted from the EMEA tables later in the guide, shows the main cross-listings for this fund in each European currency.
Table 4: Main cross-listings for iShares Euro STOXX 50 ETF
Ticker ETF Name Total Assets (€M)
Stocks in ETF (#)
Exp. Ratio (%)
Options Available
EUE LN iShares EuroStoxx 50 € 3,185 50 0.35 N Main X-listings: EUE IM (EUR), EUNE SW (CHF)
Source: J.P. Morgan Equity Derivatives Strategy.
The widespread use of multiple exchange listings has led to a fragmentation of liquidity for many European ETFs, as investor flows and market maker quotes have become dispersed across multiple exchanges rather than being consolidated on a single order book. While the Deutsche Boerse and London Stock Exchange control the largest portion of ETF trading volumes (~20% of volume), there are at least another 20 trading platforms across Europe where ETF trading is available including ‘alternative platforms’ such as Chi-X and Turquoise. In order to capture investor preference for trading in home markets and local currencies, ETF providers in Europe offer multiple currency versions of their ETFs, further dispersing liquidity. As a result of fragmented liquidity (and lower total volumes), European ETFs often have wider quoted bid-ask spreads for many products compared to their US counterparts. Table 5 below shows average intraday bid-ask spreads for the iShares MSCI Emerging Markets ETF in the US compared to several European listings; the volume weighted average spread on European exchanges is ~14 times larger for this fund than its US counterpart.
Table 5: Liquidity and spreads on iShares MSCI Emerging Markets ETF
BBG Ticker RIC Exchange 20D Avg Bid-Ask Spread
(bps) 3M ADV
(EUR Mn)
EEM US EEM NYSE 2.1 2256.0
IEEM LN IEEM.L LSE 30.5 11.3
IEMM NA IEEM.AS EN Amsterdam 21.8 3.1
IQQE GY IQQE.DE Deutsche Boerse 23.7 6.7
IEEM SW IEEM.S SWX Europe 27.0 6.0
IDEM LN IDEM.L LSE (USD listing) 39.0 9.6
IEEM IX IEEMI.CHI Chi-X 31.3 0.1
IEEM EB IEEMI.BS BATS Europe 31.3 0.1 Source: J.P. Morgan Equity Derivatives Strategy. MIFID: driving a mostly OTC market Trade reporting for ETFs is not required by European law, therefore the majority of ETF trades in Europe are transacted OTC, creating a misrepresentation of the actual liquidity available. The European Commission’s Market in Financial Instruments Directive (MiFID), introduced in 2006, omitted ETFs from its definition of shares, and therefore did not subject ETFs to the transparency regime. According to estimates produced by iShares, up to two-thirds of European ETF volumes are transacted OTC. Due to the administrative work required to report ETF trade details, the vast majority of these trades go unreported. In 2010, the UK regulator, the Financial Services Authority (FSA) unveiled its plans to again conduct a review of the equities market that may lead to a further set of reforms (dubbed MiFID II). Amongst the proposed reforms, a consolidated tape of share prices is to be considered by the commission. A number of groups have also been lobbying for the reporting of ETF trades. UCITS III UCITS III provides a stamp of EU-wide approval, enabling a UCITS compliant fund listed on one European exchange the ability to “passport” to and distribute in all other European member states. The ability to cross list in various European markets, enables a broader base of investors from which to attract flow (as we mentioned above – given European investors’ preferences to trade in home markets). In order to comply with the UCITS III rules, European ETFs (ex Swiss funds) are subject to more stringent diversification rules than those issued in the US. Under UCITS III guidelines, a fund can invest no more than 20% of its net asset value into an individual constituent. These diversification limits therefore limit the ability of ETF providers to issue products on commodities, currencies and sectors. Stamp duty In 2006, the UK waived the obligatory 0.5% stamp duty on ETF transactions. Transactions for the creation of ETFs encompassing physical UK stocks remain subject to stamp duty requirements, which are often passed along by the ETF provider.
Special Topic 3: European ETF Markets

13
US Listed ETFs
Ticker ETF NameTotal Assets
($M)Stocks in
ETF (#)Exp. Ratio
(%)Options
Available Ticker ETF NameTotal Assets
($M)Stocks in
ETF (#)Exp. Ratio
(%)Options
Available
SPY SPDR Trust Series 1 $95,366 500 0.10 Y MYY ProShares Short MidCap 400 $23 - 0.95 NIVV iShares S&P 500 Index Fund $28,321 499 0.09 Y IVOO Vanguard S&P Mid-Cap 400 ETF $13 400 0.15 NQQQ PowerShares QQQ Nasdaq 100 $25,488 100 0.20 Y MWN DirexionShares Mid Cap Bear 3x Shares $11 - 1.15 YVTI Vanguard Total Stock Market $19,170 3,388 0.07 Y EWRM Rydex Russell Midcap Equal Weight $7 783 0.40 NDIA DIAMONDS Trust Series I $9,924 30 0.18 Y TRNM RBS US Midcap Trendpilot ETN $4 - - NIWB iShares Russell 1000 $7,271 973 0.15 Y SMDD ProShares Ultrapro Short Mid400 $3 - 0.95 YIWV iShares Russell 3000 $3,472 2,906 0.21 Y Small CapOEF iShares S&P 100 $3,159 100 0.20 Y IWM iShares Russell 2000 $16,318 1,955 0.28 YVV Vanguard Large-Cap $3,156 758 0.12 Y IJR iShares S&P SmallCap 600 $7,460 595 0.20 YRSP Rydex S&P Equal Weight $3,023 500 0.40 Y VB Vanguard Small-Cap $5,075 1,723 0.14 YSDS ProShares UltraShort S&P500 $2,169 - 0.90 Y TZA DirexionShares Small Cap Bear 3X Shares $668 - 1.15 YSSO ProShares Ultra S&P500 $1,725 - 0.92 Y TNA DirexionShares Small Cap Bull 3X Shares $617 - 0.98 YSH ProShares Short S&P500 $1,447 - 0.92 Y SCHA Schwab US Small-Cap ETF $490 1,751 0.13 YVOO Vanguard S&P 500 ETF $915 500 0.06 N TWM ProShares UltraShort Russell2000 $402 - 0.95 YQLD ProShares Ultra QQQ $869 - 0.95 Y RWM ProShares Short Russell2000 $269 - 0.95 YQID ProShares UltraShort QQQ $692 - 0.95 Y UWM ProShares Ultra Russell2000 $233 - 0.95 YSCHB Schwab US Broad Market ETF $684 1,512 0.06 Y JKJ iShares Morningstar Small Core $189 261 0.25 NIYY iShares DJ US Index Fund $658 1,364 0.20 Y SLY SPDR DJ Wilshire Small Cap $75 600 0.20 NSCHX Schwab US Large-Cap ETF $515 753 0.08 Y URTY ProShares Ultrapro Russell2000 $63 - 0.95 YXLG Rydex Russell Top 50 ETF $378 50 0.20 N SBB ProShares Short SmallCap600 $49 - 0.95 NDXD ProShares UltraShort Dow30 $360 - 0.95 Y SAA ProShares Ultra SmallCap600 $45 - 0.95 YDDM ProShares Ultra Dow30 $353 - 0.95 Y SRTY ProShares Ultrapro Short Russell2000 $35 - 0.95 YISI iShares S&P 1500 $345 1,490 0.20 N VTWO Vanguard Russell 2000 $19 1,964 0.15 NJKD iShares Morningstar Large Core $312 93 0.20 N SDD ProShares UltraShort SmallCap600 $12 - 0.95 NMGC Vanguard Mega Cap 300 ETF $304 305 0.13 Y RTLA iPath Long Extended Russell 2000 ETN $8 - 0.50 NSPXU ProShares UltraPro Short S&P 500 $297 - 0.95 Y RTSA iPath Short Extended Russell 2000 ETN $7 - 0.50 NUPRO ProShares UltraPro S&P 500 $265 - 0.95 Y EWRS Rydex Russell 2000 Equal Weight $7 1,909 0.40 NBGU DirexionShares Large Cap Bull 3X Shares $257 - 0.98 Y VIOO Vanguard S&P Small-Cap 600 ETF $6 600 0.15 NDOG ProShares Short Dow30 $234 - 0.95 Y Micro CapPSQ ProShares Short QQQ $224 - 0.95 Y IWC iShares Russell Microcap $557 1,330 0.71 YTMW SPDR DJ Wilshire Total Market $204 1,006 0.20 N FDM First Trust DJ Select Microcap $155 209 0.60 YBGZ DirexionShares Large Cap Bear 3X Shares $188 - 1.15 Y PZI PowerShares Zacks Micro Cap $117 400 0.70 NONEQ Fidelity NASDAQ Comp. Index $186 1,999 0.30 N WMCR Wilshire Micro-Cap ETF $55 850 0.50 NTQQQ ProShares Ultrapro QQQ $148 - 0.95 YNYC iShares NYSE Composite $100 1,218 0.25 NRSU Rydex 2x S&P 500 ETF $90 500 0.70 YQQEW First Trust NASDAQ-100 Equal Wgt. $86 100 0.60 Y Growth (Large Cap)EQL ALPS Equal Sector Weight ETF $67 9* 0.37 N IWF iShares Russell 1000 Growth $13,746 625 0.20 YNY iShares NYSE 100 $67 100 0.20 N IVW iShares S&P 500 Growth $6,265 325 0.18 YSQQQ ProShares Ultrapro Short QQQ $61 - 0.95 Y VUG Vanguard Growth $5,534 430 0.14 YRSW Rydex Inverse 2x S&P 500 ETF $55 - 0.70 Y MGK Vanguard Mega Cap 300 Growth ETF $430 187 0.13 YELR SPDR DJ Wilshire Large Cap $47 750 0.20 N JKE iShares Morningstar Large Growth $388 90 0.25 NIWL iShares Russell Top 200 $41 194 0.15 N IWZ iShares Russell 3000 Growth $360 1,809 0.25 NUDOW ProShares Ultrapro Dow30 $36 - 0.95 Y IWY iShares Russell Top 200 Growth $357 134 0.20 NSDOW ProShares Ultrapro Short Dow $28 - 0.95 Y SCHG Schwab U.S. Large-Cap Growth $299 432 0.13 YQQXT First Trust Nasdaq-100 Ex-Tech $25 61 0.60 N RPG Rydex S&P 500 Pure Growth $247 126 0.35 NBXUC Barclays ETN+long C Linked to S&P 500 $22 - T+751 N VONG Vanguard Russell 1000 Growth $218 627 0.15 NVTHR Vanguard Russell 3000 $18 2,937 0.15 N SPYG SPDR DJ Wilshire Large Cap Growth $199 326 0.20 NBXUB Barclays ETN+long B Linked to S&P 500 $18 - T+751 N PWB Powershares Dynamic Large Cap Growth $195 50 0.60 NVONE Vanguard Russell 1000 $12 976 0.12 N VOOG Vanguard S&P 500 Growth ETF $37 326 0.15 NSPGH UBS E-Tracs S&P 500 Gold Hedged ETN $12 - 0.85 N ROI WisdomTree LargeCap Growth Fund $25 289 0.38 NUWC ProShares Ultra Russell 3000 $9 - 0.95 N UKF ProShares Ultra Russell1000 Growth $17 - 0.95 NEWRI Rydex Russell 1000 Equal Weight ETF $8 977 0.40 N SFK ProShares UltraShort Russell1000 Growth $5 - 0.95 NWXSP Wilshire 4500 Completion ETF $6 1,495 0.18 N Growth (Mid Cap)WFVK Wilshire 5000 Total Market $6 1,197 0.12 N IWP iShares Russell Midcap Growth $3,463 491 0.25 YSFLA iPath Long Extended S&P 500 ETN $6 - 0.35 N IJK iShares S&P MidCap 400 Growth $3,278 236 0.25 YBXDB Barclays ETN+short B Linked to S&P 500 $5 - T-401 N VOT Vanguard Mid-Cap Growth $1,245 243 0.14 NROLA iPath Long Extended Russell 1000 ETN $5 - 0.50 N RFG Rydex S&P Midcap 400 Pure Growth $544 102 0.35 NBXDC Barclays ETN+short C Linked to S&P 500 $4 - T-401 N JKH iShares Morningstar Mid Growth $206 176 0.30 NBXDD Barclays ETN+short D Linked to S&P 500 $4 - T-401 N PWJ Powershares Dynamic Mid Cap Growth $127 75 0.63 NROSA iPath Short Extended Russell 1000 ETN $3 - 0.50 N MDYG SPDR DJ Mid Cap Growth $76 238 0.25 NTWQ ProShares UltraShort Russell 3000 $3 - 0.95 N IVOG Vanguard S&P Mid-Cap 400 Growth $20 238 0.20 NSFSA iPath Short Extended S&P 500 ETN $3 - 0.35 N UKW ProShares Ultra Russell MidCap Growth $16 - 0.95 NEUSA iShares MSCI USA Index Fund $1 590 0.15 N SDK ProShares UltraShort Russell MCap Growth $3 - 0.95 NMid Cap Growth (Small Cap)MDY Midcap SPDR Trust Series 1 $11,831 400 0.25 Y IWO iShares Russell 2000 Growth $4,083 1,255 0.25 YIJH iShares S&P MidCap 400 $10,692 397 0.22 Y VBK Vanguard Small-Cap Growth $2,253 989 0.14 NIWR iShares Russell Midcap $6,444 780 0.20 Y IJT iShares S&P SmallCap 600 Growth $1,993 356 0.25 YVO Vanguard Mid-Cap $3,916 453 0.14 Y SLYG SPDR DJ Wilshire Small Cap Growth $182 358 0.25 NVXF Vanguard Extended Market $1,288 3,038 0.13 N JKK iShares Morningstar Small Growth $130 225 0.30 NJKG iShares Morningstar Mid Core $167 210 0.25 N PWT PowerShares Dynamic Small Cap Growth $37 99 0.63 YMVV ProShares Ultra MidCap400 $145 - 0.95 Y RZG Rydex S&P Sm Cap 600 Pure Growth $32 159 0.35 NEMM SPDR DJ Wilshire Mid Cap $69 496 0.25 N UKK ProShares Ultra Russell2000 Growth $32 - 0.95 NMWJ DirexionShares Mid Cap Bull 3X Shares $61 - 0.98 Y VTWG Vanguard Russell 2000 Growth $20 1,261 0.20 NSCHM Schwab US Mid Cap ETF $38 498 0.13 N VIOG Vanguard S&P Small-Cap 600 Growth $13 358 0.20 NUMDD ProShares Ultrapro Midcap400 $38 - 0.95 Y SKK ProShares UltraShort Russell2000 Growth $8 - 0.95 NMZZ ProShares UltraShort MidCap400 $26 - 0.95 Y1 Expense ratio = 91 days Treasury Bills +/- bps * ETF of ETFs
Style
Broad Based Broad Based
Large Cap Mid Cap (continued)

14
US Listed ETFs
Ticker ETF NameTotal Assets
($M)Stocks in
ETF (#)Exp. Ratio
(%)Options
Available Ticker ETF NameTotal Assets
($M)Stocks in
ETF (#)Exp. Ratio
(%)Options
Available
Value (Large Cap)IWD iShares Russell 1000 Value $11,770 665 0.20 Y FEX First Trust Large Cap Core $186 374 0.70 NVTV Vanguard Value $4,865 417 0.14 Y FTA First Trust Large Cap Value $130 208 0.70 NIVE iShares S&P 500 Value $4,556 339 0.18 Y FTC First Trust Large Cap Growth $115 167 0.70 NPWV PowerShares Dynamic Lg Cap Value $410 50 0.63 N PIV PowerShares Value Line Timeliness $108 125 0.70 NIWW iShares Russell 3000 Value $343 1,900 0.26 N FVL First Trust Value Line 100 $104 100 0.70 NMGV Vanguard Mega Cap 300 Value ETF $336 154 0.13 Y EPS WisdomTree Earnings 500 Fund $76 499 0.28 NJKF iShares Morningstar Large Value $226 76 0.25 N RYJ Guggenheim Raymond James SB-1 Equity $73 149 0.75 NIWX iShares Russell Top 200 Value $222 128 0.20 N EXT WisdomTree Total Earnings Fund $54 1,182 0.28 NSCHV Schwab U.S. Large-Cap Value $177 322 0.13 Y FDV First Trust DB Strategic Value $39 50 0.65 NSPYV SPDR DJ Wilshire Large Cap Value $176 339 0.20 N PWO PowerShares Dynamic OTC $39 100 0.60 NRPV Rydex S&P 500 Pure Value $86 118 0.35 N PJF PowerShares Dynamic Large Cap $34 100 0.73 NVONV Vanguard Russell 1000 Value $18 667 0.15 N PQY PowerShares Active AlphaQ Fund $34 50 0.75 NVOOV Vanguard S&P 500 Value ETF $15 339 0.15 N FAB First Trust MultiCap Value $30 619 0.70 NUVG ProShares Ultra Russell1000 Value $15 - 0.95 N PIQ PowerShares Dynamic MagniQuant $27 200 0.67 NSJF ProShares UltraShort Russell1000 Value $2 - 0.95 N EZY WisdomTree Low P/E Fund $26 295 0.38 NGVT Grail American Beacon Large Cap Value $2 99 0.79 N XRO Guggenheim Sector Rotation $23 100 0.60 NValue (Mid Cap) DENT Dent Tactical ETF $20 10* 1.56 NIWS iShares Russell Midcap Value $3,449 537 0.25 Y PYH PowerShares Val Line Industry Rotation $19 46 0.76 NIJJ iShares S&P Mid-Cap 400 Value $2,335 292 0.28 N FAD First Trust MultiCap Growth $19 495 0.70 NVOE Vanguard Mid-Cap Value $877 263 0.14 N RWV RevenueShares Navellier Overall A-100 $10 100 0.60 NJKI iShares Morningstar Mid Value $117 172 0.30 N WMW ELEMENTS Morningstar Wide Moat Focus TR $8 - 0.75 NRFV Rydex S&P Midcap 400 Pure Value $56 99 0.35 N RWG RP Focused Large Cap Growth ETF $12 20 0.89 NPWP PowerShares Mid Cap Value $41 75 0.63 N FVI First Trust Val Line Equity Allocation $7 151 0.70 NMDYV SPDR DJ Wilshire MidCap Value $26 294 0.25 N RPX RP Growth ETF $5 57 0.89 NUVU ProShares Ultra Russell MidCap Value $9 - 0.95 N PMA PowerShares Active Mega-Cap Portfolio $4 47 0.75 NIVOV Vanguard S&P Mid-Cap 400 Value $3 294 0.20 N PQZ PowerShares Active Alpha Multi-Cap Fund $3 50 0.75 NSJL ProShares UltraShort Russell MidCap Value $2 - 0.95 N DOD ELEMENTS-"Dogs of the Dow" Linked to DJ HY $3 - 0.75 NValue (Small Cap) EEH ELEMENTS SPECTRUM ETN $1 - 0.75 NIWN iShares Russell 2000 Value $4,709 1,285 0.41 Y BVT ELEMENTS Ben Graham Total Market Value $1 - 0.75 NVBR Vanguard Small-Cap Value $2,045 979 0.14 Y BVL ELEMENTS Ben Graham Large Cap Value $1 - 0.75 NIJS iShares S&P SmallCap 600 Value $1,895 426 0.25 Y Enhanced (Mid Cap)JKL iShares Morningstar Small Value $200 226 0.30 N PRFZ PowerShares FTSE RAFI US 1500 Sm-Mid $434 1,429 0.71 NSLYV SPDR DJ Wilshire Small Cap Value $140 431 0.25 N FNX First Trust Mid Cap Core AlphaDEX Fund $187 297 0.70 NRZV Rydex S&P Smallcap 600 Pure Value $99 152 0.35 N RWK RevenueShares Mid Cap ETF $154 400 0.54 NPWY PowerShares Small Cap Value $69 100 0.63 N EZM WisdomTree MidCap Earnings Fund $115 625 0.38 NUVT ProShares Ultra Russell2000 Value $26 - 0.95 N PJG PowerShares Dynamic Mid Cap $22 150 0.73 NSJH ProShares UltraShort Russell2000 Value $6 - 0.95 N CZA Guggenheim Mid-Cap Core $14 100 0.60 NVIOV Vanguard S&P Small-Cap 600 Value $6 431 0.20 N Enhanced (Small Cap)VTWV Vanguard Russell 2000 Value $6 1,291 0.20 N RWJ RevenueShares Small Cap ETF $133 600 0.54 NDividend EES WisdomTree SmallCap Earnings Fund $132 914 0.38 NPFF iShares S&P US Preferred Stock $6,666 227 0.48 Y FYX First Trust Small Cap Core AlphaDEX Fund $101 445 0.70 NDVY iShares DJ Select Dividend $5,958 100 0.40 Y PJM PowerShares Dynamic Small Cap $18 200 0.79 NVIG Vanguard Dividend Appreciation $5,498 142 0.23 Y BSC ELEMENTS Ben Graham Small Cap Value $2 - 0.75 NSDY SPDR Dividend ETF $5,294 60 0.35 Y ThemePGF PowerShares Financial Preferred $1,779 43 0.72 Y CVY Guggenheim Multi Asset Income $432 140 0.60 NVYM Vanguard High Dividend Yield ETF $1,219 438 0.20 N NFO Guggenheim Insider Sentiment $163 100 0.60 NDLN WisdomTree LargeCap Dividend $594 300 0.28 N KLD iShares KLD Select Social SM $159 190 0.50 YPID PowerShares International Div. Achvrs $511 64 0.56 N DSI iShares KLD 400 SocialSM Index $151 398 0.50 YDWM WisdomTree DEFA Fund $464 568 0.48 N WMCR Wilshire Micro-Cap ETF $55 850 0.50 NDTN WisdomTree Dividend Top 100 Fund $344 88 0.38 N PKW PowerShares Buyback Acheivers $39 144 0.73 NDON WisdomTree MidCap Dividend $263 344 0.38 N GRID First Trust Nasdaq Clean Edge Smart Grid $29 36 0.70 NDES WisdomTree SmallCap Dividend Fund $247 593 0.38 N MNA IQ ARB Merger Arbitrage ETF $23 39 0.75 NFVD First Trust Value Line Dividend $236 164 0.70 N DEF Guggenheim Defensive $22 99 0.60 NPFM PowerShares Dividend Achievers $217 191 0.60 N OTP Guggenheim Ocean Tomo Patent $21 292 0.60 NPEY PowerShares High Yld Eq. Div. Achvrs $197 50 0.60 N FPX First Trust US IPO Index Fund $17 100 0.60 NDHS WisdomTree Equity Income Fund $173 337 0.38 N JCO Jets Contrarian Opporunity Index Fund $15 114 0.58 NDTD WisdomTree Total Dividend $171 816 0.28 N CSD Guggenheim Spin-Off $13 27 0.60 NFDL First Trust Morningstar Div. Leaders $163 100 0.45 N CPI IndexIQ ETF Trust - IQ CPI Inflation Hedged $13 7* 0.48 NDTH WisdomTree DEFA Equity Income Fund $133 197 0.58 N OTR Guggenheim Ocean Tomo Growth $6 60 0.60 NPSK SPDR Wells Fargo Preferred Stock ETF $105 158 0.45 N FCV FaithShares Catholic Values Fund $3 101 0.87 NAlpha FOC FaithShares Christian Values Fund $3 101 0.87 NQAI IndexIQ ETF Trust IQ Hedge Multi-Strategy $137 20 0.75 N NASI Pax MSCI North America ESG Index $3 349 0.50 NPBP PowerShares S&P 500 BuyWrite Portfolio $136 500 0.75 Y FMV FaithShares Methodist Values Fund $2 99 0.87 NALT iShares Diversified Alternatives Trust $119 - 0.95 N FZB FaithShares Baptist Values Fund $1 99 0.87 NCSM ProShares Credit Suisse 130/30 $91 252 0.95 Y FKL FaithShares Lutheran Values Fund $1 100 0.87 NCSMA Credit Suisse Merger Arbitrage $55 - 0.55 N VolatilityWDTI Wisdomtree Managed Futures Strategy $41 - 0.95 N VXX iPath S&P 500 VIX Short-Term Futures ETN $1,250 - 0.89 YHDGE Active Bear ETF $37 - 1.85 N VXZ iPath S&P 500 VIX Mid-Term Futures ETN $710 - 0.89 YCSLS CS Long/Short Liquid Index $29 - 0.45 N XIV VelocityShares Inverse VIX Short-Term $39 - 1.35 NMCRO IQ Hedge Macro Tracker ETF $28 14 0.75 N XVIX E-Tracs Daily Long Short VIX ETN $37 - 0.85 NGRV Mars Hill Global Relative Value $26 19 1.49 N IVO iPath Inverse Jan 2021 VIX Short Term Futures $29 - 0.89 NBWV iPath CBOE S&P 500 BuyWrite Index ETN $17 - 0.75 N XXV iPath Inverse S&P 500 VIX Short Term Futures $29 - 0.89 NRALS ProShares Rafi Long/Short $11 230 0.95 N TVIX VelocityShares 2X VIX Short Terrm $21 - 1.65 NJFT Keynotes FT 130/30 Large Cap $4 - 0.95 N CVOL C-Tracks ETN Volatility Index $15 - 1.15* NEnhanced (Large Cap) VZZ iPath LE SP500 VIX M/T Future $14 - 0.89 NPRF PowerShares FTSE RAFI US 1000 $1,110 986 0.66 Y VIXY ProShares VIX Short-Term $11 - 0.95 YPDP PowerShares DWA Technical Leaders $379 100 0.71 N VIXM ProShares VIX Mid-Term Future $7 - 0.95 YRWL RevenueShares Large Cap ETF $221 500 0.49 Y VIIX VelocityShares VIX Short-Term $7 - 0.89 NPWC PowerShares Dynamic Market $194 100 0.59 N
* ETF of ETFs
Style Style
Enhanced (Large Cap) (Continued)

15
US Listed ETFs
Ticker ETF NameTotal Assets
($M)Stocks in
ETF (#)Exp. Ratio
(%)Options
Available Ticker ETF NameTotal Assets
($M)Stocks in
ETF (#)Exp. Ratio
(%)Options
Available
ZIV VelocityShares Inv VIX Medium $6 - 1.35 N FCGS Direxion Daily Natural Gas Bear 2X $2 - 0.95 YTVIZ VelocityShares 2X VIX Med-Tm $5 - 1.65 NVIIZ VelocityShares VIX Med-Term $4 - 0.89 N XLF Financial SPDR $7,958 81 0.20 Y
KBE SPDR KBW Bank $2,103 24 0.35 YFAS DirexionShares Financial Bull 3X Shares $1,683 - 0.99 YUYG ProShares Ultra Financials $1,378 - 0.95 YFAZ Direxion Financial Bear 3X Shares $740 - 1.16 Y
XLY Consumer Discretionary SPDR $2,126 79 0.20 Y KRE SPDR KBW Regional Banking $732 50 0.35 YXHB SPDR Homebuilders $823 25 0.35 Y VFH Vanguard Financials $680 499 0.24 YXRT SPDR Retail $608 64 0.35 Y IYF iShares DJ US Financials $560 257 0.48 YFXD First Trust C Disc AlphaDEX Fund $509 123 0.70 N FXO First Trust Financial AlphaDEX Fund $447 151 0.70 YITB iShares DJ US Home Construction $493 27 0.47 Y PSP PowerShares Listed Private Equity $376 61 0.71 NVCR Vanguard Consumer Discretionary $386 373 0.24 N SKF ProShares UltraShort Financials $316 - 0.95 YRTH Retail HOLDRs Trust $290 18 -1 Y IYG iShares DJ US Financial Services $252 117 0.48 YIYC iShares DJ US Consumer Services $212 193 0.48 N KIE SPDR KBW Insurance ETF $230 24 0.35 YBJK Market Vectors Gaming ETF $131 54 0.66 N IAI iShares DJ US Broker Dealers $212 23 0.48 YPBS PowerShares Media $126 30 0.63 N IAT iShares DJ US Regional Banks $150 65 0.48 YPEJ PowerShares Leisure & Entertainment $78 30 0.63 N RKH Regional Bank HOLDRs Trust $108 17 -1 YPSCD PowerShares S&P Smallcap Cons. Discretionary $52 108 0.29 N IAK iShares DJ US Insurance $101 60 0.47 NRCD Rydex S&P Equal Wgt C. Discretion $24 79 0.50 N SEF ProShares Short Financials $88 - 0.95 YSCC ProShares UltraShort C. Services $21 - 0.95 N KCE SPDR KBW Capital Markets ETF $83 24 0.35 YPEZ PowerShares Dynamic C. Disc. $19 60 0.70 N PSCF PowerShares S&P SmallCap Financial $62 102 0.29 NPMR PowerShares Retail $12 30 0.63 N PJB PowerShares Dynamic Banking Portfolio $43 30 0.66 NUCC ProShares Ultra Consumer Services $12 - 0.95 N RYF Rydex S&P Equal Wgt Financial $24 81 0.50 NRETL Direxion Daily Retail Bull $6 - 0.95 N KRS ProShares Short KBW Regional Banks $23 - 0.95 NRETS Direxion Daily Retail Bear $3 - 0.95 N RWW RevenueShares Financials Sector Fund $22 81 0.49 N
PFI PowerShares Dynamic Financial Sector $21 60 0.72 NXLP Consumer Staples SPDR $3,032 41 0.20 Y PIC PowerShares Insurance $16 30 0.63 NVDC Vanguard Consumer Staples $616 109 0.24 N QABA First Trust NASDAQ ABA Community Bank $14 99 0.60 NIYK iShares DJ US Consumer Goods $298 126 0.48 N KBWD PowerShares KBW High Dividend Financials $10 38 0.35 NPBJ PowerShares Food & Beverage $72 30 0.63 N KRU ProShares Ultra KBW Regional Banks $8 - 0.95 NFXG First Trust C. Staples AlphaDEX Fund $41 39 0.70 N KBWP PowerShares KBW Prop. & Casualty Insurance $3 24 0.35 NPSL PowerShares Dynamic C. Staples $38 60 0.69 N Health CareUGE ProShares Ultra Consumer Goods $16 - 0.95 N XLV Health Care SPDR $2,625 51 0.20 YRHS Rydex S&P Equal Wgt C. Staples $15 41 0.50 N IBB iShares Nasdaq Biotechnology $1,359 128 0.48 YPSCC PowerShares S&P SmallCap Consumer Staples $13 20 0.29 N VHT Vanguard Health Care $664 294 0.24 NSZK ProShares UltraShort Consumer Goods $8 - 0.95 N IYH iShares DJ US Healthcare $588 124 0.48 Y
PPH Pharmaceutical HOLDRs Trust $541 15 -1 YXLE Energy SPDR $10,950 41 0.20 Y XBI SPDR Biotech $429 30 0.35 YOIH Oil Service HOLDRs Trust $3,171 14 -1 Y IHI iShares DJ US Medical Devices $392 40 0.47 YAMJ JPMorgan Alerian MLP Index ETN $2,583 - 0.85 Y BBH Biotech HOLDRs Trust $249 12 -1 YVDE Vanguard Energy $2,081 159 0.24 Y FBT First Trust AMEX Biotech Index $216 20 0.60 YXOP SPDR Oil & Gas Exp. & Prod. $1,431 37 0.35 Y XPH SPDR Pharmaceuticals $211 24 0.35 NIYE iShares DJ US Energy $1,147 91 0.48 Y PBE PowerShares Biotech & Genome $195 30 0.63 NAMLP Alerian MLP ETF $799 25 0.85 Y IHF iShares DJ US Health Care Providers $159 48 0.47 YIEZ iShares DJ US Oil Equipment & Srvcs $653 43 0.47 Y IHE iShares DJ US Pharmaceuticals $155 36 0.47 NIEO iShares DJ US Oil & Gas Exp. & Prod. $572 59 0.48 Y PJP PowerShares Pharmaceuticals $84 30 0.63 NXES SPDR Oil & Gas Equipment and Srvcs $571 25 0.35 Y FXH First Trust Health Care AlphaDEX Fund $82 75 0.70 NPBW PowerShares WilderHill Clean Energy $555 57 0.67 Y PSCH PowerShares S&P SmallCap Health Care $62 74 0.29 NDIG ProShares Ultra Oil & Gas $541 - 0.95 Y PTH PowerShares Dynamic Healthcare Sector $54 60 0.66 NFCG First Trust ISE-Revere Nat Gas Index Fund $478 31 0.60 Y RYH Rydex S&P Equal Wgt Healthcare $50 51 0.50 NERX DirexionShares Energy Bull 3X Shares $411 - 0.98 Y RXL ProShares Ultra Health Care $34 - 0.95 NNLR Market Vectors Nuclear Energy $297 23 0.62 N XHE Spdr S&P Health Care Equipment $8 58 0.35 NPXJ PowerShares Oil & Gas Services $273 30 0.62 Y BIB ProShares Ultra Nasdaq Biotech $6 - 0.95 NMLPI E-Tracs Alerian Infrastructure $193 - 0.85 N RXD ProShares UltraShort Health Care $4 - 0.95 NENY Guggenheim Canadian Energy Income $162 36 0.65 N BIS ProShares UltraShort Nasdaq Biotech $2 - 0.95 NPXI PowerShares Dynamic Energy $161 60 0.68 N IndustrialsFXN First Trust Energy AlphaDEX Fund $154 56 0.70 N XLI Industrials SPDR $3,867 58 0.20 YPZD PowerShares Cleantech $152 71 0.69 N PHO PowerShares Water Resources $1,241 32 0.63 YMLPN Credit Suisse Cushing 30 MLP $127 - 0.85 Y VIS Vanguard Industrials $558 366 0.24 NPSCE PowerShares S&P Small Cap Energy $116 22 0.29 N IYT iShares DJ US Transportation $526 20 0.47 YPXE PowerShares Energy E&P $108 30 0.63 N IYJ iShares DJ US Industrials $500 245 0.47 NGNR Spdr S&P Global Natural Resources $106 91 0.40 N ITA iShares DJ US Aerospace & Defense $157 32 0.47 NMLPL E-Tracs UBS 2X Leveraged Long ETA $74 - 0.85 N PPA PowerShares Aerospace & Defense $115 56 0.66 NDUG ProShares UltraShort Oil & Gas $72 - 0.95 Y PRN PowerShares Dynamic Industrials Sector $76 60 0.68 NPUW PowerShares WilderHill Prog. Energy $70 53 0.73 N FIW First Trust ISE Water Index Fund $62 37 0.60 YERY Direxion Energy Bear 3X Shares $54 - 1.11 Y UXI ProShares Ultra Industrials $59 - 0.95 YRYE Rydex S&P Equal Wgt Energy $40 41 0.50 N RGI Rydex S&P Equal Wgt Industrial $54 58 0.50 NKWT Market Vectors Solar Energy $40 31 0.66 Y FXR First Trust Industrials AlphaDEX Fund $51 100 0.70 NQCLN First Trust Nasdaq Clean Edge Green Energy $39 51 0.60 N PKB PowerShares Building & Construction $47 30 0.63 NWCAT Jefferies Tr/J CRB Wildcatters Exploration $29 62 0.65 N PSCI PowerShares S&P SmallCap Industrial $37 90 0.29 NPWND PowerShares NASDAQ OMX Clean $26 32 0.75 N FAA Guggenheim Airline ETF $35 23 0.65 YMLPW E-Tracs Wells Fargo MLP Index $22 - 0.85 N EVX Market Vectors Environmental Srvcs $31 21 0.56 NMLPG UBS E-Tracs Alerian Natural Gas MLP Index $12 - 0.85 N SIJ ProShares UltraShort Industrials $8 - 0.95 YMLPS E-Tracs UBS 1xMonthly Short MLP ETAS $8 - 0.85 N XTN SPDR S&P Transportation ETF $8 40 0.35 NDDG ProShares Short Oil & Gas $8 - 0.95 N FLYX Direxion Airline Shares $4 - 0.55 NFCGL Direxion Daily Natural Gas Bull 2X $8 - 0.95 Y1 The Bank of New York, as trustee and as custodian, charges a quarterly custody fee of $2.00 for each round-lot of 100 HOLDRs, deducted from any cash dividend or other cash distibutions on underlying securities received by the trust. With repect to the aggregate custody fee payable in any calendar year for each HOLDR, the trustee will waive portion of the fee which exceeds the total cash dividends and other cash distributions received, or to be received, and payable with respect to such calendar year.
Sector Funds
Consumer Discretionary
Volatility (continued) Energy (Continued)
Sector Funds
Consumer Staples
Energy
Style
Financials

16
US Listed ETFs
Ticker ETF NameTotal Assets
($M)Stocks in
ETF (#)Exp. Ratio
(%)Options
Available Ticker ETF NameTotal Assets
($M)Stocks in
ETF (#)Exp. Ratio
(%)Options
Available
GDX Market Vectors Gold Miners ETF $6,866 30 0.53 Y PNQI PowerShares NASDAQ Internet Portfolio $39 56 0.60 NMOO Market Vectors Agribusiness ETF $3,815 46 0.56 Y IAH Internet Architecture HOLDRs Trust $32 14 -1 NXLB Materials SPDR $2,706 30 0.20 Y SSG ProShares UltraShort Semiconductors $19 - 0.95 YIGE iShares S&P NA Natural Resources $2,389 145 0.48 Y WMH Wireless HOLDRs Trust $17 17 -1 NGDXJ Market Vectors Junior Gold Miners ETF $2,350 60 0.59 Y SOXS Direxion Daily Semiconductor 3X Short $16 - 0.95 YXME SPDR Metals & Mining $1,247 26 0.35 Y FONE First Trust CEA Smartphone $15 73 0.70 NIYM iShares DJ US Basic Materials $1,217 67 0.47 Y REW ProShares UltraShort Technology $14 - 0.95 YVAW Vanguard Materials $686 135 0.24 Y BDH Broadband HOLDRs Trust $14 17 -1 NFXZ First Trust Materials AlphaDEX Fund $551 53 0.70 N BHH B2B Internet HOLDRs Trust $13 2 -1 NSIL Global X Silver Miners ETF $486 25 0.65 Y IIH Internet Infrastructure HOLDRs Trust $12 8 -1 NREMX Market Vectors Rare Earth $427 25 0.57 Y TelecomUYM ProShares Ultra Basic Materials $380 - 0.95 Y IYZ iShares DJ US Telecom $634 31 0.48 YSLX Market Vectors Steel $262 26 0.56 Y VOX Vanguard Telecom Services $324 38 0.24 NURA Global X Uranium ETF $218 23 0.69 Y TTH Telecom HOLDRs Trust $130 12 -1 YLIT Global X Lithium ETF $191 20 0.75 Y XTL SPDR S&P Telecom ETF $13 61 0.35 NCU First Trust ISE Global Copper $128 30 0.70 Y LTL ProShares Ultra Telecommunications $8 - 0.95 NCOPX Global X Copper Miners ETF $106 30 0.65 Y TLL ProShares UltraShort Telecommunications $3 - 0.95 NPYZ PowerShares Dynamic Basic Materials $82 60 0.68 N UtilitiesSMN ProShares UltraShort Basic Materials $74 - 0.95 Y XLU Utilities SPDR $3,695 34 0.20 YRTM Rydex S&P Equal Wgt Materials $46 30 0.50 N VPU Vanguard Utilities $681 87 0.24 NPLTM First Trust ISE Global Platinum $34 25 0.70 Y IDU iShares DJ US Utilities $521 73 0.48 YGLDX Global X Gold Explorers ETF $24 30 0.65 Y UTH Utilities HOLDRs Trust $57 18 -1 YNUGT Direxion Gold Miners Bull 2X $13 - 0.95 Y FXU First Trust Utilities AlphaDEX Fund $47 54 0.70 NDUST Direxion Gold Miners Bear 2X $6 - 0.95 Y PSCU PowerShares S&P Smallcap Utilities $46 22 0.29 NALUM Global X Aluminum ETF $5 22 0.69 N PUI PowerShares Utilities $45 60 0.63 NSBM ProShares Short Basic Materials $4 - 0.95 N RYU Rydex S&P Equal Wgt Utilities $23 43 0.50 NPSCM PowerShares S&P SmallCap Materials $3 31 0.29 N UPW ProShares Ultra Utilities $20 - 0.95 NReal Estate SDP ProShares UltraShort Utilities $5 - 0.95 NVNQ Vanguard REIT $8,690 103 0.13 YIYR iShares DJ US Real Estate $3,356 77 0.47 YICF iShares Cohen & Steers Realty Maj. $2,458 29 0.35 YRWR SPDR DJ REIT $1,548 82 0.25 Y PCEF PowerShares CEF Income Composite $195 113 0.50 YURE ProShares Ultra Real Estate $534 - 0.95 Y AOR iShares S&P Growth Allocation Fund $102 10 0.32 NSRS ProShares UltraShort Real Estate $212 - 0.95 Y AOM iShares S&P Moderate Allocation Fund $84 10 0.31 NREM iShares FTSE NAREIT Mortgage Plus $127 50 0.48 N AOA iShares S&P Aggressive Allocation Fund $74 9* 0.35 NDRW WisdomTree International Real Estate $123 151 0.58 N AOK iShares S&P Conservative Allocation Fund $47 10 0.30 NDRN Direxion Daily Real Estate Bull 3x Shares $120 - 0.98 Y TDH TDAX Independence 2020 ETF $42 450 0.65 NVNQI Vanguard Global Ex-US Real Estate $96 423 0.35 N TDV TDAX Independence 2040 ETF $34 465 0.65 NREZ iShares FTSE NAREIT Residential $85 34 0.48 N TDN TDAX Independence 2030 ETF $34 467 0.65 NFRI First Trust S&P REIT $76 111 0.50 N PAO PowerShares RF Tactical Balanced Growth $23 32 0.25 NSCHH Schwab US REIT ETF $66 83 0.13 N VQT Barclays ETN+ Dyn Veqtortm $20 - 0.95 NFTY iShares FTSE NAREIT Real Estate 50 $62 49 0.48 N PCA PowerShares RF Tactical Bal Growth Income $19 29 0.25 NDRV Direxion Daily Real Estate Bear 3x Shares $45 - 1.13 Y TDX TDAX Independence In-Target ETF $15 425 0.65 NPSR PowerShares Active U.S. Real Estate Fund $17 48 0.80 N TRND Rbs US Large Cap Trendpilot $14 - 0.50 NRTL iShares FTSE NAREIT Retail $15 26 0.48 N TDD TDAX Independence 2010 ETF $14 378 0.65 NREK ProShares Short Real Estate $15 - 0.95 N TZG iShares S&P Target Date 2020 Index Fund $14 9* 0.29 NFIO iShares FTSE NAREIT Industrial/Office $14 30 0.48 N TZV iShares S&P Target Date 2040 Index Fund $12 8* 0.30 NWREI Wilshire US REIT ETF $11 94 0.32 N TZL iShares S&P Target Date 2030 Index Fund $12 9* 0.30 NKBWY PowerShares KBW Premium Yield REIT $4 30 0.35 N TZI iShares S&P Target Date 2025 Index Fund $12 9* 0.29 NTechnology TZE iShares S&P Target Date 2015 Index Fund $12 9* 0.29 NXLK Technology SPDR $7,021 85 0.20 Y PTO PowerShares Ibbotson Alt. Completion $9 16* 0.25 NVGT Vanguard Information Technology $1,817 421 0.24 Y FOL FactorShares 2X: Oil-S&P500 $8 - 0.75 NIYW iShares DJ US Technology $1,677 166 0.47 Y TGR iShares S&P Target Date Retirement Income Index $6 9* 0.29 NSMH Semiconductor HOLDRs Trust $745 18 -1 Y TZO iShares S&P Target Date 2035 Index Fund $5 9* 0.29 NFDN First Trust DJ Internet $699 41 0.60 Y FSU FactorShares 2X: S&P500-USD $5 - 0.75 NQTEC First Trust NASDAQ-100 Tech $585 40 0.60 Y FSE FactorShares 2X: S&P500-Treasure Bond $5 - 0.75 NIGV iShares S&P NA Software $526 53 0.48 N FSG FactorShares 2X: Gold-S&P500 $5 - 0.75 NIGM iShares S&P NA Technology $492 258 0.48 N FSA FactorShares 2X: Treasure Bond-S&P500 $5 - 0.75 NIGN iShares S&P NA Networking $314 34 0.48 N TZD iShares S&P Target Date 2010 Index Fund $5 9* 0.29 NSOXX iShares S&P NA Semiconductor $264 30 0.48 Y TBAR RBS Gold Trendpilot ETN $4 - - NTYH DirexionShares Technology Bull 3X Shares $234 - 0.98 Y GCE Claymore CEF GS Connect ETN $4 - 0.95 NMTK SPDR Morgan Stanley Technology $231 35 0.50 NPXQ PowerShares Networking $202 30 0.63 YXSD SPDR S&P Semiconductor $186 27 0.35 YFXL First Trust Technology AlphaDEX $178 86 0.70 N GlobalROM ProShares Ultra Technology $149 - 0.95 Y EFA iShares MSCI EAFE $39,478 921 0.35 YRYT Rydex S&P Equal Wgt Technology $132 76 0.50 N VEU Vanguard FTSE All-World ex-US ETF $7,418 2,278 0.25 YHHH Internet HOLDRs Trust $123 13 -1 Y VEA Vanguard Europe Pacific ETF $6,096 946 0.15 YSOXL Direxion Daily Semiconductor Bull 3X $98 - 0.95 Y ACWI iShares MSCI ACWI Index Fund $1,912 968 0.35 NPSCT PowerShares S&P SmallCap Info Tech $88 131 0.29 N SCZ iShares MSCI EAFE Small Cap Index Fund $1,521 1,182 0.40 YSWH Software HOLDRs Trust $81 13 -1 Y EFV iShares MSCI EAFE Value Index $1,514 504 0.40 YUSD ProShares Ultra Semiconductors $73 - 0.95 Y EFG iShares MSCI EAFE Growth $1,438 564 0.40 YPSJ PowerShares Software $73 30 0.63 N IOO iShares S&P Global 100 $1,132 106 0.40 NPSI PowerShares Semiconductors $51 30 0.63 N VT Vanguard Total World Stock Index Fund $940 2,883 0.30 NPTF PowerShares Dynamic Technology Sector $48 60 0.68 N GWX SPDR S&P International Small Cap ETF $931 660 0.59 NPXN PowerShares Lux Nanotech $45 22 0.70 N VSS Vanguard FTSE All World ex-US Sm-Cap $862 2,693 0.40 NTYP DirexionShares Technology Bear 3X Shares $44 - 1.14 Y ACWX iShares MSCI ACWI ex US Index Fund $823 835 0.35 N
* ETF of ETFs
Materials Technology (continued)
Sector FundsSector Funds
Asset Allocation Funds
International

17
US Listed ETFs
Ticker ETF NameTotal Assets
($M)Stocks in
ETF (#)Exp. Ratio
(%)Options
Available Ticker ETF NameTotal Assets
($M)Stocks in
ETF (#)Exp. Ratio
(%)Options
Available
TOK iShares MSCI Kokusai Index Fund $662 1,204 0.25 N DND WisdomTree Pacific ex-Japan Dividend $87 117 0.48 NSCHF Schwab International Equity ETF $576 883 0.13 Y DNH WisdomTree Pacific ex-Japan Equity Income $80 67 0.58 NDLS WisdomTree Int'ntl SmallCap Dividend $477 483 0.58 N DEW WisdomTree Europe Equity Income $76 446 0.58 NCWI SPDR MSCI ACWI ex-US $473 563 0.34 N PAF PowerShares FTSE RAFI Asia Pac. ex-Japan $61 175 0.80 NIDV iShares Dow Jones EPAC Select Dividend $436 95 0.50 N ADRA BLDRS Asia 50 ADR $48 50 0.30 NDWX SPDR S&P International Dividend ETF $390 98 0.45 N LBJ Direxion Daily Latin America Bull 3X $45 - 0.94 NPXF PowerShares FTSE RAFI DM ex-US $257 830 0.75 N FEU SPDR DJ STOXX 50 $42 50 0.29 NDOL WisdomTree Int'ntl LargeCap Dividend $165 150 0.48 N EPV ProShares UltraShort MSCI Europe $41 - 0.95 YDIM WisdomTree Int'ntl MidCap Dividend $158 343 0.58 N EET ProShares Ultra MSCI Emerging Markets $35 - 0.97 YDOO WisdomTree Int'ntl Dividend Top 100 $149 90 0.58 N ESR iShares MSCI Emerging Mkts East Europe $32 57 0.69 NPIZ PowerShares DWA DM Technical Leaders $148 100 0.80 N EEG Emerging Global Shares DJ Emerging Markets $30 85 0.75 NSCHC Schwab Intl Small-Cap Equity $147 918 0.35 Y GXF Global X FTSE Nordic 30 ETF $30 30 0.50 NGWL SPDR S&P World ex-US $147 608 0.34 N DFE WisdomTree Europe SmallCap Div $29 246 0.58 NDGT SPDR DJ Global Titans $139 50 0.50 N LATM Market Vectors Latin America Small Cap Index $27 106 0.63 NFGD First Trust DJ Global Select Dividend $98 101 0.60 N IFAS iShares FTSE EPRA/NAREIT Asia $25 73 0.48 NGTAA Cambria Global Tactical ETF $84 77 0.99 N EEO DJ Emerging Markets Energy $23 24 0.85 NADRD BLDRS Developed Markets 100 ADR $82 100 0.30 N PMNA PowerShares MENA Frontier Countries $23 39 0.95 NEFZ ProShares Short MSCI EAFE $78 - 0.95 N MES Market Vectors Gulf States ETF $22 40 0.99 NRTR RevenueShares ADR Fund $66 170 0.49 N ADRU BLDRS Europe 100 ADR $21 87 0.30 NVXUS Vanguard Total Intl Stock ETF $56 6,547 0.20 N GULF WisdomTree Middle East Dividend Fund $19 51 0.88 NIFSM iShares FTSE Developed SC ex-North Am $48 775 0.51 N EMFN iShares MSCI EM Financial Sector Index Fund $13 87 0.69 NMDD SPDR S&P International Mid Cap ETF $43 465 0.45 N IFNA iShares FTSE EPRA/NAREIT North America $13 123 0.48 NLVL Guggenheim S&P Global Dividend $36 98 0.60 N EMMT iShares MSCI EM Materials Sector Index Fund $12 60 0.69 NPFA PowerShares Dynamic Developed Intl Opp $33 229 0.75 N EWEM Rydex MSCI Emerging Market Equal Weight $12 569 0.70 NDZK DirexionShares Developed Markets Bull 3X $32 - 1.01 Y FDD First Trust DJ STOXX Select Div 30 $11 31 0.60 NHEDJ WisdomTree International Hedged $22 477 0.58 N IFEU iShares FTSE EPRA/NAREIT Europe $11 79 0.48 NEWEF Rydex MSCI EAFE Equal Weight $18 839 0.55 N EUFN iShares MSCI Europe Financial Sector Index $10 100 0.48 NONEF One Funds $15 5* 0.51 N EDIV SPDR S&P Emerging Markets Dividend $8 102 0.59 NEFU ProShares UltraShort MSCI EAFE $14 - 0.95 Y AND Global X FTSE Andean 40 ETF $6 40 0.72 NMKH Market 2000 HOLDRs Trust $13 54 - N EKH Europe 2001 HOLDRs Trust $5 31 - NDPK DirexionShares Developed Markets Bear 3X $12 - 1.13 Y EMSA iPath Short Enhanced MSCI EM Index ETN $5 - 0.80 NXGC Guggenheim International Small Cap LDRs $11 82 0.45 N BRIL Direxion Daily BRIC BULL 2X Shares $4 - 0.95 NEFO ProShares Ultra MSCI EAFE $9 - 0.95 N EMLB iPath Long Enhanced MSCI EM Index ETN $4 - 0.80 NAADR WCM BNY Mellon Focused Growth $8 23 1.25 N UPV ProShares Ultra MSCI Europe $4 - 0.95 NMFLA iPath Long Enhanced MSCI EAFE Index ETN $5 - 0.80 N UXJ ProShares Ultra MSCI Pacific $4 - 0.95 NEWAC Rydex MSCI All Country World $4 628 0.60 N LHB Direxion Daily Latin America Bear 3X Shares $4 - 0.95 NGWO ELEMENTS Linked to the CS Global Warming $3 - 0.75 N EEN Guggenheim EW Euro-Pacific LDRs $3 112 0.35 NMFSA iPath Se MSCI EAFE Index ETN $3 - 0.80 N FEFN iShares MSCI Far East Financial Sector Index $3 85 0.48 N
BRIS Direxion Daily Bric Bear 2X Shares $3 - 0.95 NVWO Vanguard Emerging Markets $43,195 890 0.27 Y JPX ProShares UltraShort MSCI Pacific ex-Japan $3 - 0.95 NEEM iShares MSCI Emerging Markets $36,637 763 0.69 Y EAPS Pax MSCI EAFE ESG Index ETF $3 138 0.55 NEPP iShares MSCI Pacific ex-Japan $3,996 149 0.50 Y EMVX Global X EM Value $3 82 0.69 NVGK Vanguard European $3,200 385 0.16 Y EMGX Global X EM Growth $2 142 0.69 NILF iShares S&P Latin America 40 $2,663 33 0.50 Y ASEA Global X Asean 40 ETF $2 40 0.65 NAAXJ iShares MSCI All Country Asia ex Japan $1,954 219 0.69 Y GULFX Barclays Middle East Non-ETN - - - NVPL Vanguard Pacific $1,636 396 0.16 NIEV iShares S&P Europe 350 $1,332 346 0.60 Y EWZ iShares MSCI Brazil $12,756 81 0.61 YDEM WisdomTree Emerging Mrkt High-Yield $1,225 280 0.63 N FXI iShares FTSE/Xinhua China 25 $6,909 25 0.72 YBKF iShares MSCI BRIC Index Fund $1,174 214 0.69 Y EWJ iShares MSCI Japan $6,219 318 0.54 YDGS WisdomTree EM SmallCap Dividend $895 470 0.63 N EWC iShares MSCI Canada $5,808 99 0.53 YEZU iShares MSCI EMU $819 264 0.54 Y EWY iShares MSCI South Korea $4,270 100 0.61 YGMF SPDR S&P Emerging Asia Pacific $759 260 0.59 N EWT iShares MSCI Taiwan $3,420 119 0.71 YEEB Guggenheim BRIC $757 90 0.60 Y RSX Market Vectors Russia ETF $3,290 43 0.62 YEWX SPDR S&P Emerging Small Cap ETF $655 726 0.65 N EWA iShares MSCI Australia $3,154 72 0.53 YADRE BLDRS Emerging Markets 50 ADR $625 50 0.30 N EWG iShares MSCI Germany $2,652 53 0.53 YBIK SPDR S&P BRIC 40 $531 40 0.50 N EWH iShares MSCI Hong Kong $2,004 41 0.53 YPXH PowerShares FTSE RAFI EM $523 264 0.85 N EWS iShares MSCI Singapore $1,894 31 0.53 YEDC DirexionShares Emerging Markets Bull 3X $381 - 1.02 Y EWW iShares MSCI Mexico $1,485 45 0.53 YSCHE Schwab Emerging Markets Equity $313 512 0.25 Y EWU iShares MSCI United Kingdom $1,377 106 0.53 YPIE PowerShares DWA EM Technical Leaders $309 104 0.90 N EPI WisdomTree India Earnings Fund $1,376 141 0.88 YGML SPDR S&P Emerging Latin America $275 109 0.59 N BRF Market Vectors Brazil Small-Cap ETF $928 62 0.65 YEUM ProShares Short MSCI Emerging Markets $254 - 0.95 N EWM iShares MSCI Malaysia $924 40 0.53 YGMM SPDR S&P Emerging Markets $237 563 0.59 N ECH iShares MSCI Chile $877 34 0.61 YGUR SPDR S&P Emerging Europe $236 82 0.59 Y INP iPath MSCI India ETN $795 - 0.89 YAIA iShares S&P Asia 50 $229 48 0.52 N GXC SPDR S&P China $680 138 0.59 YPXR PowerShares EM Infrastructure $202 76 0.75 N EWD iShares MSCI Sweden $676 32 0.53 NBICK First Trust Bick Index Fund $196 87 0.64 N EPU iShares MSCI All Peru Capped Index Fund $671 26 0.62 YFRN Guggenheim Frontier Markets ETF $190 43 0.65 N EZA iShares MSCI South Africa $610 47 0.61 YEEV ProShares UltraShort MSCI EM $178 - 0.95 Y THD iShares MSCI Thailand $574 85 0.62 NECON Egshares Dow Jones Emerging Markets $174 30 0.85 N TUR iShares MSCI Turkey $508 94 0.61 NFEZ SPDR DJ EURO STOXX 50 $172 50 0.29 Y PIN PowerShares India Portfolio $506 52 0.78 YFNI First Trust ISE Chindia Index Fund $165 50 0.60 Y EWL iShares MSCI Switzerland $504 37 0.53 NGAF SPDR S&P Emrg. Middle East & Africa $152 131 0.59 N PGJ PowerShares Golden Dragon China $449 214 0.69 YEMIF iShares S&P Emerg Mkts Infrastructure $125 26 0.75 N IDX Market Vectors Indonesia $410 33 0.68 NPDN PowerShares FTSE RAFI Dev Mkts ex-US $121 1,142 0.75 N HAO Guggenheim China Small Cap ETF $376 201 0.70 YAFK Market Vectors Africa Index ETF $117 50 0.84 N EWQ iShares MSCI France $317 76 0.54 NEDZ DirexionShares Emerging Markets Bear 3X $117 - 1.09 Y EWP iShares MSCI Spain $300 28 0.54 Y
* ETF of ETFs
Country
International International
Regional
Global (continued) Regional (continued)

18
US Listed ETFs
Ticker ETF NameTotal Assets
($M)Stocks in
ETF (#)Exp. Ratio
(%)Options
Available Ticker ETF NameTotal Assets
($M)Stocks in
ETF (#)Exp. Ratio
(%)Options
Available
VNM Market Vectors Vietnam ETF $272 31 0.76 N JXI iShares S&P Global Utilities $268 76 0.48 NDXJ WisdomTree Japan Dividend $253 252 0.48 N HAP Market Vectors Hard Assets Producers ETF $246 328 0.65 YFXP ProShares UltraShort FTSE/Xinhua China 25 $221 - 0.95 Y RWO SPDR DJ Wilshire Global Real Estate $245 201 0.50 NEIDO iShares MSCI Indonesia Investible Market $218 62 0.61 N EXI iShares S&P Global Industrials $237 176 0.48 NEWO iShares MSCI Austria $207 29 0.54 N CGW Guggenheim S&P Global Water Index ETF $236 49 0.65 NEWN iShares MSCI Netherlands $196 54 0.53 N WOOD iShares S&P Global Timber & Forestry Idx $226 23 0.48 NINDY iShares S&P India Nifty 50 Index Fund $178 49 0.89 Y CUT Guggenheim Global Timber $185 27 0.65 NCHIQ Global X China Consumer ETF $160 40 0.65 Y TAN Guggenheim Global Solar Energy $179 34 0.65 YRBL SPDR S&P Russia ETF $147 37 0.59 N PBD PowerShares Global Clean Energy Portfolio $150 98 0.75 NEWI iShares MSCI Italy $147 30 0.54 Y WPS iShares S&P Dev ex-U.S. Property $144 273 0.48 NDFJ WisdomTree Japan SmallCap Div $144 315 0.58 N GEX Market Vectors Global Alternative Energy $142 30 0.62 YGXG Global X/InterBolsa FSTE Colombia 20 $135 21 0.86 N RXI iShares S&P Global C. Discretion $140 161 0.48 NCNDA IQ Canada Small Cap ETF $128 99 0.69 N CRBQ Jefferies TR/J CRB Global Commodity $138 151 0.65 YEIS iShares MSCI Israel $122 80 0.61 N PAGG PowerShares Global Agriculture Portfolio $118 40 0.75 NEPOL iShares MSCI Poland Investible Market $118 60 0.61 N GRES IndexIQ ETF Trust - IQ ARB Glbl Resources $76 152 0.75 NITF iShares S&P/TOPIX 150 $105 149 0.50 N FFR First Trust FTSE EPRA/NAREIT Gl. R.Estate $69 283 0.60 NYAO Guggenheim China All-Cap ETF $91 192 0.70 Y PSAU PowerShares Global Gold and Precious Metals $65 68 0.75 NJSC SPDR Russ/Nomura SmCap Japan $85 396 0.55 N ICLN iShares S&P Global Clean Energy $58 30 0.48 NERUS iShares MSCI Russia Capped Index $82 29 0.65 N FAN First Trust Global Wind Energy ETF $53 59 0.60 NBRXX Emerging Global Shares Index Brazil Infra $79 31 0.85 N GII SPDR FTSE/Mac Global Inf. 100 $52 98 0.59 NENZL iShares MSCI New Zealand $73 22 0.55 N GRI Cohen & Steers Global Realty Majors $50 76 1.65 NINXX Emerging Global Shares Index India Infra $72 30 0.85 N IRV SPDR S&P International Materials $45 116 0.50 NPLND Market Vectors Poland ETF $65 28 0.65 N DKA WisdomTree Int'ntl Energy $45 51 0.58 NFCHI iShares FTSE China HK Listed Index Fund $60 104 0.72 N DBN WisdomTree Int'ntl Basic Materials $43 109 0.58 NCZM Direxion Daily China 3X Bull $57 - 0.94 N FLM First Trust ISE Global Engg. & Construction $42 63 0.70 NXPP ProShares Ultra FTSE/Xinhua China 25 $53 - 0.95 Y PKN PowerShares Global Nuclear Energy $38 64 0.75 NEWZS iShares Brazil Small Cap Index Fund $49 70 0.65 N DBU WisdomTree Int'ntl Utilities $38 65 0.58 NDNL WisdomTree Japan Equity Income $49 145 0.58 N PKOL PowerShares Global Coal Portfolio $35 30 0.75 NTAO Guggenheim China Real Estate $48 47 0.65 Y EMT DJ Emer Mkts Metals & Mining $34 24 0.85 NSCIF Market Vectors India Small Cap Index $47 124 0.85 Y IPN SPDR S&P International Industrials $30 139 0.50 NCQQQ Guggenheim China Technology $47 40 0.70 Y IPK SPDR S&P International Technology $28 100 0.50 NSCJ iShares MSCI Japan Small Cap Index Fund $45 655 0.53 N IPD SPDR S&P International C. Discretionary $26 120 0.50 NKROO IQ Australia Small Cap ETF $42 99 0.69 N NUCL iShares S&P Global Nuclear Energy $24 24 0.48 NEWK iShares MSCI Belgium $42 50 0.54 N IPW SPDR S&P International Energy $18 66 0.50 NBRAZ Global X Brazil Mid Cap ETF $30 40 0.69 N SEA Guggenheim Shipping ETF $16 30 0.65 NBRAQ Global X Brazil Consumer ETF $30 28 0.77 N IRY SPDR S&P International Health Care $12 74 0.50 NSCIN Emerging Global Index India Small Cap $30 74 0.85 N IPS SPDR S&P International Consumer Staples $12 60 0.50 NEGPT Market Vectors Egypt Index $27 28 0.94 N PSTL PowerShares Global Steel Portfolio $12 62 0.75 NINDL Direxion Daily India 2X Shares $26 - 0.95 N IST SPDR S&P International Telecoms $12 45 0.50 NECNS iShares MSCI China Small Cap $23 309 0.65 N CRBA Jefferies TR/J CRB Agriculture $11 35 0.65 NNORW Global X Norway ETF $23 30 0.50 N EFN DJ Emerging Mkts Financials Titans $10 28 0.85 NPEK Market Vectors China ETF $22 - 0.72 N IPU SPDR S&P International Utilities $9 57 0.50 NEPHE iShares MSCI Philippines $22 29 0.65 N AXMT iShares MSCI ACWI Ex US Materials $7 184 0.48 NBZQ ProShares UltraShort MSCI Brazil $22 - 0.95 Y AXEN iShares MSCI ACWI Ex US Energy $7 92 0.48 NCHXX Emerging Global Shares Index China Infra $19 30 0.85 N AXDI iShares MSCI ACWI Ex US Cons. Disc $7 173 0.48 NUBR ProShares Ultra MSCI Brazil $13 - 0.95 N IPF SPDR S&P International Financial Sector $6 123 0.50 NEZJ ProShares Ultra MSCI Japan $13 - 0.95 N AXID iShares MSCI ACWI Ex US Industrial $6 223 0.48 NEWV ProShares UltraShort MSCI Japan $11 - 0.95 N AXIT iShares MSCI ACWI Ex US I. Tech $6 82 0.48 NYXI ProShares Short FTSE China 25 $11 - 0.95 N AXTE iShares MSCI ACWI Ex US Telecom $6 67 0.48 NCZI Direxion Daily China 3X Bear $10 - 0.95 N AXHE iShares MSCI ACWI Ex US H. Care $6 62 0.48 NCHIE Global X China Energy ETF $10 24 0.65 N AXUT iShares MSCI ACWI Ex US Utilities $6 76 0.48 NCHIM Global X China Materials ETF $9 28 0.65 N CRBI Jefferies TR/J CRB Global Industrial Metals $5 36 0.65 NBRAF Global X Brazil Financials $9 25 0.77 N AXSL iShares MSCI ACWI Ex US Cons. Stap $3 108 0.48 NSKOR IQ South Korea Small Cap ETF $9 98 0.79 N KBWX PowerShares KBW International Financials $3 61 0.40 NJPP SPDR Russ/Nomura Prime Japan $9 380 0.50 N AXFN iShares MSCI Ex US Financials $3 263 0.48 NCHII Global X China Industrials ETF $8 40 0.65 YTWON IQ Taiwan Small Cap ETF $7 96 0.79 NCHIX Global X China Financials $7 25 0.65 YEIRL iShares MSCI Ireland Capped Investable Market $7 22 0.53 NCHIB Global X China Technology $5 26 0.65 N SHY iShares Barclays 1-3 Year Treasury $7,947 35 0.15 YINDZ Direxion Daily India Bear 2X $5 - 0.95 N TBT ProShares UltraShort 20+ Year Treasury $5,673 - 0.95 YARGT Global X FTSE Argentina 20 $4 20 0.75 N SHV iShares Barclays Short Treasury $4,144 12 0.15 NSMK ProShares UltraShort MSCI Mexico $3 - 0.95 Y IEF iShares Barclays 7-10 Year Treasury $2,773 12 0.15 YUMX ProShares Ultra MSCI Mexico $2 - 0.95 N TLT iShares Barclays 20+ Year Treasury $2,680 14 0.15 Y
IEI iShares Barclays 3-7 Year Treasury $1,273 34 0.15 YRWX SPDR DJ Wilshire Int'ntl Real Estate $1,695 117 0.59 N BIL SPDR Barclays Capital 1-3 Month T-Bill $1,022 8 0.13 NIXC iShares S&P Global Energy $1,565 87 0.48 Y TBF ProShares Short 20+ Year Treasury $902 - 0.95 YMXI iShares S&P Global Materials $828 119 0.48 N PST ProShares UltraShort Lehman 7-10 Year $464 - 0.95 YIXN iShares S&P Global Technology $649 115 0.48 N TMV Direxion Daily 30-Year Treasury Bear 3X $414 - 1.13 YKOL Market Vectors Coal ETF $638 39 0.59 Y AGZ iShares Barclays Agency Bond Fund $405 78 0.20 NIGF iShares S&P Global Infrastructure $521 74 0.48 N PLW PowerShares 1-30 Laddered Treasury $282 26 0.25 NIXJ iShares S&P Global Healthcare $486 79 0.48 N ITE SPDR Barclays Capital Interm Term Treasury $193 158 0.13 NIXP iShares S&P Global Telecom $429 42 0.48 N TLH iShares Barclays 10-20 Year Treasury Bond $191 22 0.15 NIFGL iShares FTSE EPRA/NAREIT Gl Rl Est exUS $393 171 0.48 N EDV Vanguard Extended Duration Treasury $124 - 0.13 NPIO PowerShares Global Water Portfolio $349 29 0.75 N VGSH Vanguard Short-Term Govt Bond $109 - 0.15 NKXI iShares S&P Global C. Staples $316 97 0.48 N TUZ PIMCO 1-3 Year U.S. Treasury Index Fund $107 23 0.09 NIXG iShares S&P Global Financials $312 207 0.48 N
1 For Fixed Income Funds the number of stocks held refers to the number of bonds.
Sector
International
Sector (continued)
Fixed Income Funds1
Treasuries
International
Country (continued)

19
US Listed ETFs
Ticker ETF NameTotal Assets
($M)Stocks in
ETF (#)Exp. Ratio
(%)Options
Available Ticker ETF NameTotal Assets
($M)Stocks in
ETF (#)Exp. Ratio
(%)Options
Available
DTYS iPath US Treasury 10Y Bear $89 - 0.75 N CMF iShares S&P California Municipal Bond $207 215 0.25 NSCHO Schwab Short-Term US Treasury $65 38 0.12 Y HYD Market Vectors High Yield Muni Index $184 111 0.35 NTYO Direxion Daily 10-Year Treasury Bear 3X $64 - 1.12 Y SMB Market Vectors LB AMT-Free Short Muni $94 190 0.20 NZROZ PIMCO 25+ Year ZC US Treasury $46 13 0.15 N MUNI PIMCO Intermediate Muni Bond Strategy $79 104 0.35 NVGLT Vanguard Long-Term Govt Bond $42 - 0.15 N NYF iShares S&P New York Municipal Bond $73 136 0.25 NVGIT Vanguard Intermediate-Term Govt Bond $33 - 0.15 N CXA SPDR Barclays Capital California Municipal $67 78 0.20 NSCHR Schwab Intermediate-Term US $30 46 0.12 Y MLN Market Vectors LB AMT-Free Long Muni $54 155 0.24 NTLO SPDR Barclays Capital LT Treasury $28 36 0.13 N PWZ PowerShares Insured California Muni Bond $40 49 0.28 NUBT ProShares Ultra 20+ Year Treasury $23 - 0.95 Y PZT PowerShares Insured NY Muni Bond $39 45 0.28 NTMF Direxion Daily 30-Year Treasury Bull 3X $23 - 0.97 Y PRB Market Vectors Pre-Refunded Muni Index $37 77 0.24 NFIVZ PIMCO 3-7 Year US Treasury $20 21 0.15 N BABS SPDR Capital Build America Bond ETF $34 152 0.35 NSBND PowerShares DB 3X Short 25+ Treasury $17 - 0.95 N BABZ Pimco Build America Bond Stratregy Fund $31 35 0.45 NDLBL iPath US Treasury Long Bond Bull $17 - 0.75 N MUAA iShares 2012 S&P AMT-Free Municipal Series $25 115 0.30 NDLBS iPath US Treasury Long Bond Bear $16 - 0.75 N INY SPDR Barclays Capital NY Municipal $25 73 0.20 NTENZ PIMCO 7-15 Year US Treasury Index Fund $14 12 0.15 N MUAC iShares 2014 S&P AMT-Free Municipal Series $25 123 0.30 NDSTJ Jpmorgan 2X Short Treasury $12 - 0.85 N MUAF iShares 2017 S&P AMT-Free Municipal Series $23 90 0.30 NDTYL iPath US Treasury 10Y Bull $11 - 0.75 N SMMU Pimco Short Term Municipal Bond $23 73 0.35 NTRSY Pimco Broad US Treasury Index Funds $10 - 0.25 N MUAD iShares 2015 S&P AMT-Free Municipal Series $23 91 0.30 NTYD Direxion Daily 10-Year Treasury Bull 3X $8 - 0.97 Y MUAB iShares 2013 S&P AMT-Free Municipal Series $23 95 0.30 NDTUS iPath US Treasury 2Y Bear $8 - 0.75 N MUAE iShares 2016 S&P Amt-Free Municipal Series $18 81 0.30 NUST ProShares Ultra 7-10 Year Treasury $8 - 0.95 N VRD SPDR S&P VRDO Municipal Bond ETF $9 28 0.20 NDTUL iPath US Treasury 2Y Bull $8 - 0.75 N GMMB Grail Mcdonnell Inter Municipal Bond $2 21 0.35 NDSXJ JPMorgan 2X Short 10 Yr Treasury $5 - 0.85 NLBND PowerShares Db 3X Long 25+ Treasury $3 - 0.95 N TIP iShares Barclays TIPS Bond $19,445 30 0.20 Y
MBB iShares Barclays MBS Bond $2,339 121 0.33 YLQD iShares iBoxx Investment Grade Corp Bond $12,997 416 0.15 Y EMB iShares JPMorgan USD Emerging Markets $2,246 72 0.60 NAGG iShares Barclays Aggregate Bond $11,051 707 0.24 Y BWX SPDR Barclays Capital Intl Treasury Bond $1,394 208 0.50 YBND Vanguard Total Bond Market $9,112 - 0.12 Y WIP SPDR DB Intl Govt Inflation-Protected Bond $999 74 0.50 NHYG iShares iBoxx $ High Yield Corporate Bond $8,325 421 0.50 Y MINT PIMCO Enhanced Short Maturity Strategy $915 467 0.35 NCSJ iShares Barclays 1-3 Year Credit Bond $7,674 661 0.20 Y PCY PowerShares Emer Markets Sovereign Debt $867 56 0.50 YJNK SPDR Barclays Capital High Yield Bond $7,288 215 0.40 Y STPZ PIMCO 1-5 Year US TIPS Index Fund $848 11 0.20 NBSV Vanguard Short-Term Bond $5,944 - 0.12 N ELD Wisdomtree Emerging Markets Debt $622 84 0.55 NCIU iShares Barclays Int Credit Bond $3,105 1,262 0.20 N IPE SPDR Barclays Capital TIPS ETF $380 30 0.18 NBIV Vanguard Intermediate-Term Bond ETF $1,929 - 0.12 Y EMLC Market Vectors Emerging Markets $258 165 0.49 NPGX PowerShares Preferred Portfolio $1,376 76 0.50 Y LTPZ PIMCO 15+ Year US TIPS Index Fund $228 7 0.20 NVCSH Vanguard Short-Term Corp Bond $1,220 - 0.15 N BWZ SPDR Barclays Capital Short Term Intl Treasury $209 96 0.35 NCFT iShares Barclays Credit Bond $766 1,176 0.20 N IGOV iShares S&P/Citigroup Intl Treasury Bond $187 72 0.35 NCWB SPDR Barclays Capital Convertible Bond $719 113 0.40 N SCHP Schwab U.S. Tips ETF $132 31 0.14 YGVI iShares Barclays Int. Gov't/Credit Bond $518 385 0.20 N ISHG iShares S&P/Citigroup 1-3 Year Intl Treasury $128 41 0.35 NPHB PowerShares Fundamental HighYield Corp $438 177 0.50 Y GBF iShares Barclays Gov't/Credit Bond $107 307 0.20 NVCIT Vanguard Intermediate-Term Corp Bond $365 - 0.15 N HGI Guggenheim International MultiAsset Income $93 146 0.65 NBLV Vanguard Long-Term Bond ETF $331 - 0.12 N STIP iShares Barclays 0-5 Yr TIPS $66 - 0.20 NSCPB SPDR Barclays Capital Short Term Corp $329 402 0.12 N VMBS Vanguard Mortgage-Backed Securities $45 - 0.15 NLAG SPDR Barclays Capital Agg Bond $222 395 0.18 N FLAT iPath US Treasury Flattener $39 - 0.75 NITR SPDR Barclays Capital Interm Term Credit $151 425 0.15 N TIPZ PIMCO Broad US TIPS Index Fund $39 17 0.20 NCORP Pimco Investment Grade Corp Bond $72 172 0.20 N MBG SPDR Barclays Capital Mortgage Backed $29 24 0.20 NVCLT Vanguard Long-Term Corporate Bond $78 - 0.15 N STPP iPath US Treasury Steepener $20 - 0.75 NBKLN PowerShares Senior Loan Portfolio $55 - 0.65 N EBND SPDR Barclays Capital Emerging Market $9 - 0.50 NBSCD Guggenheim Bulletshares 2013 Corp Bond $47 82 0.24 N KME SPDR KBW Mortgage Finance ETF $4 - 0.35 NBSCC Guggenheim Bulletshares 2012 Corp Bond $40 78 0.24 N TPS ProShares UltraShort TIPS $4 - 0.95 NPICB PowerShares Intl. Corporate Bond $40 169 0.50 N GMTB Grail Mcdonnell Core Taxable Bond $3 78 0.35 NBSCH Guggenheim Bulletshares 2017 Corp Bond $35 40 0.24 NBSCB Guggenheim Bulletshares 2011 Corp Bond $30 59 0.24 NLWC SPDR Barclays Capital Long Term Credit $28 202 0.15 NBSCE Guggenheim Bulletshares 2014 Corp Bond $28 40 0.24 N Broad CommoditiesHYLD Peritus High Yield ETF $24 34 1.35 N DBC PowerShares DB Commodity Index Tracking $5,885 - 0.85 YBSCF Guggenheim Bulletshares 2015 Corp Bond $22 38 0.24 N DJP iPath DJ AIG Commodity $3,159 - 0.75 YCLY iShares 10+ Year Credit Bond Fund $21 215 0.20 N GSG iShares S&P GSCI Commodity Trust $1,969 - 0.75 YBSCG Guggenheim Bulletshares 2016 Corp Bond $19 32 0.24 N RJI ELEMENTS Rogers Intl Commodity Index $830 - 0.75 YIBND SPDR Barclays Cap Intl Corp Bond $17 - 0.55 N GCC GreenHaven Continous Commodity $700 - 1.09 YGLJ iShares 10+ Year Govt/Credit Bond $16 212 0.20 N USCI United States Commodity Index $326 - 0.95 NPLK PowerShares Active Low Duration Portfolio $11 43 0.29 N UCI E-TRACS UBS BBG CMCI ETN $155 - 0.65 NUBD Claymore Capital Markets Bond $10 206 0.27 N GSP iPath GSCI Total Return ETN $118 - 0.75 NBSJC Guggenheim Bulletshares 2012 HY Corp Bond $8 73 0.42 N LSC ELEMENTS S&P Cmdty Trends Indicator - TR $79 - 0.75 NBSJF Guggenheim Bulletshares 2015 HY Corp Bond $5 174 0.42 N GSC GS Connect S&P GSCI Enh Commodity TRS $78 - 0.95 NBSJE Guggenheim Bulletshares 2014 HY Corp Bond $5 170 0.42 N DJCI DJ-UBS Commodity Index TR ETN $26 - 0.50 NBSJD Guggenheim Bulletshares 2013 HY Corp Bond $5 119 0.42 N DYY PowerShares DB Commodity Double Long ETN $23 - 0.75 NULQ Claymore Reserves ETF $5 16 0.27 N UCD ProShares Ultra DJ AIG Commodity $21 - 0.95 N
DPU PowerShares DB Commodity Long ETN $8 - 0.75 NMUB iShares S&P National Municipal Bond $1,979 1,163 0.25 Y CMD ProShares UltraShort DJ AIG Commodity $3 - 0.95 NSHM SPDR Barclays Capital Short Term Muni Bond $1,264 333 0.20 N DEE PowerShares DB Commdity Double Short ETN $2 - 0.75 NTFI SPDR Barclays Capital Municipal Bond $826 289 0.30 Y DDP PowerShares DB Commodity Short ETN $1 - 0.75 NBAB PowerShares Build America Bond $669 344 0.28 N Soft CommoditiesPZA PowerShares Insured National Muni Bond $483 159 0.28 Y DBA PowerShares DB Agriculture Fund $3,819 - 0.85 YPVI PowerShares VRDO Tax Free Weekly $481 70 0.25 N RJA ELEMENTS Rogers Intl Cmdty Index Agri TR $739 - 0.75 YSUB iShares S&P Short Term National Muni Bond $402 486 0.25 N JJG iPath DJ AIG Grains $378 - 0.75 YITM Market Vectors LB AMT-Free Interm Muni $208 388 0.24 N JJA iPath Dow Jones AIG Agriculture $304 - 0.75 N
Commodity Funds
Other
Fixed Income Funds
Municipal
Municipals
Fixed Income Funds
Treasuries
Corporates

20
US Listed ETFs
Ticker ETF NameTotal Assets
($M)Stocks in
ETF (#)Exp. Ratio
(%)Options
Available Ticker ETF NameTotal Assets
($M)Stocks in
ETF (#)Exp. Ratio
(%)Options
Available
DAG PowerShares DB Agri Double Long ETN $142 - 0.75 N PTD E-TRACS UBS Short Platinum ETN $3 - 0.65 NBAL iPath DJ AIG Cotton $117 - 0.75 Y BOS PowerShares DB Base Metals Short ETN $3 - 0.75 NCOW iPath DJ AIG Livestock $116 - 0.75 Y BDG PowerShares DB Base Metals Long ETN $2 - 0.75 NJJS iPath DJ AIG Softs $111 - 0.75 NCORN Teucrium Corn Fund $79 - 1.00 YSGG iPath DJ AIG Sugar TR Sub-Index ETN $66 - 0.75 NJO iPath DJ AIG Coffee $43 - 0.75 N UUP PowerShares DB US Dollar Bullish Fund $892 - 0.75 YGRU ELEMENTS MLCX Grains Index TR $39 - 0.75 N FXA CurrencyShares Australian Dollar $710 - 0.40 YFUD E-TRACS UBS Bloomberg CMCI Food ETN $35 - 0.65 N CYB WisdomTree Dreyfus Chinese Yuan $655 - 0.45 YNIB iPath DJ AIG Cocoa $26 - 0.75 N FXC CurrencyShares Canadian Dollar $635 - 0.40 YUAG E-TRACS UBS Bbg CMCI Agriculture ETN $16 - 0.65 N FXF CurrencyShares Swiss Franc $437 - 0.40 YAGF PowerShares DB Agri Long ETN $7 - 0.75 N EUO ProShares UltraShort Euro $432 - 0.95 YAGA PowerShares DB Agri Double Short ETN $6 - 0.75 N CEW WisdomTree Dreyfus Emerging Currency Fund $381 - 0.55 YUBC E-TRACS UBS BG CMCI Livestock ETN $5 - 0.65 N FXE CurrencyShares Euro Trust $378 - 0.40 YADZ PowerShares DB Agri Short ETN $2 - 0.75 N DBV PowerShares DB G10 Currency Harvest $353 11 0.75 Y
YCS ProShares UltraShort Yen $334 - 0.95 YUNG United States Natural Gas Fund LP $2,399 - 0.60 Y FXY CurrencyShares Japanese Yen $151 - 0.40 YUSO United States Oil Fund LP $1,889 - 0.45 Y UDN PowerShares DB US Dollar Bearish Fund $150 - 0.75 YOIL iPath GS Crude Oil $820 - 0.75 Y BZF WisdomTree Dreyfus Brazilian Real Fund $140 - 0.45 NDBO PowerShares DB Oil Fund $642 - 0.75 Y FXB CurrencyShares British Pound Sterling $129 - 0.40 YUCO ProShares Ultra DJ AIG Crude Oil $459 - 0.95 Y CCX Wisdomtree Dreyfus Commodity Currency Fund $124 - 0.55 NUSL United States 12 Month Oil Fund LP $249 - 0.60 Y CNY Market Vectors Renminbi/USD ETN $102 - 0.55 NDBE PowerShares DB Energy Fund $240 - 0.75 Y FXS CurrencyShares Swedish Krona $87 - 0.40 YUGA United States Gasoline Fund LP $118 - 0.60 Y DRR Market Vectors Double Short Euro ETN $64 - 0.65 NGAZ iPath DJ AIG Natural Gas $110 - 0.75 Y BNZ WisdomTree New Zealand Dollar Fund $28 - 0.45 YSCO ProShares UltraShort DJ AIG Crude Oil $92 - 0.95 Y ICI iPath Optimized Currency Carry ETN $25 - 0.65 NDTO PowerShares DB Crude Oil Dbl Short ETN $91 - 0.75 N FXM CurrencyShares Mexican Peso $25 - 0.40 YRJN ELEMENTS Rogers Intl Cmdty Energy TR $87 - 0.75 Y ICN WisdomTree Dreyfus Indian Rupee Fund $24 - 0.45 YBNO United States Brent Oil Fund $37 - 0.75 N JYN iPath JPY/USD Exchange Rate ETN $15 - 0.40 NUNL United States 12 Month Nat Gas $29 - 0.75 Y SZR WisdomTree South African Rand Fund $11 - 0.45 NOLO PowerShares DB Crude Oil Long ETN $28 - 0.75 N AYT Barclays GEMS Asia-8 ETN $10 - 0.89 NJJE iPath DJ AIG Energy $19 - 0.75 N EU WisdomTree Dreyfuss Euro Fund $10 - 0.35 YUHN United States Heating Oil Fund LP $10 - 0.60 N ULE ProShares Ultra Euro $8 - 0.95 YFUE ELEMENTS MLCX Biofuels Index TR $8 - 0.75 N ERO iPath EUR/USD Exchange Rate ETN $7 - 0.40 NSZO PowerShares DB Crude Oil Short ETN $8 - 0.75 N JYF WisdomTree Dreyfus Japanese Yen Fund $6 - 0.35 YCRUD Teucrium Crude Oil Fund $5 - 1.00 Y INR Market Vectors Rupee/USD ETN $5 - 0.55 NDNO United States Short Oil Fund LP $4 - 0.60 Y XRU CurrencyShares Russian Ruble Trust $5 - 0.40 NUBN E-TRACS UBS Bbg CMCI Energy ETN $3 - 0.65 N GBB iPath GBP/USD Exchange Rate ETN $5 - 0.40 NGRN iPath Global Carbon ETN $3 - 0.75 N PGD Barclays Asian and Gulf Currency Revaluation $4 - 0.89 NNAGS Teucrium Natural Gas Fund $2 - 1.00 N JEM Barclays GEMS Index ETN $4 - 0.89 NMetals YCL ProShares Ultra Yen $3 - 0.95 YGLD SPDR Gold Trust $54,927 - 0.40 Y URR Market Vectors Double Long Euro ETN $1 - 0.65 NSLV iShares Silver Trust $11,655 - 0.50 YIAU iShares COMEX Gold Trust $5,377 - 0.25 Y Source: Bloomberg; Adelante Shares; AMEX; Barclays; Claymore; CurrencyShares;SGOL ETFS Gold Trust $1,242 - 0.39 Y Deutsche Bank; ELEMENTS; First Trust; FocusShares; GreenHaven; HealthShares;PALL ETFS Palladium Trust $918 - 0.60 N HOLDRs (Merrill Lynch); iShares; J.P. Morgan Securities Inc.; MacroShares;PPLT ETFS Platinum Trust $817 - 0.60 N Market Vectors; Northern Trust; NYSE; Opta; PowerShares; ProShares; RevenueShares;AGQ ProShares Ultra Silver $736 - 0.95 Y Rydex; SPA ETF; State Street Global Advisors (SSGA); TDX Independence; UBS;DBB PowerShares DB Base Metals Fund $603 - 0.75 Y Vanguard; WisdomTreeSIVR ETFS Silver Trust $571 - 0.30 YDGP PowerShares DB Gold Double Long ETN $490 - 0.75 N Note: Total Assets ($M) is calculated as the number of ETF shares that have been issued,DBP PowerShares DB Precious Metals Fund $325 - 0.75 Y multiplied by the last price of a share. Stocks in ETF shows the number of stocks that areJJC iPath DJ AIG Copper $293 - 0.75 Y actually held in the ETF currently, and not the targeted number of names to be held.DGL PowerShares DB Gold Fund $278 - 0.75 YDBS PowerShares DB Silver Fund $261 - 0.75 YUGL ProShares Ultra Gold $239 - 0.95 YGLTR ETFs Physical Precious Metal $201 - 0.60 NZSL ProShares UltraShort Silver $132 - 0.95 YDZZ PowerShares DB Gold Double Short ETN $102 - 0.75 NJJM iPath DJ AIG Industrial Metals $102 - 0.75 NGLL ProShares UltraShort Gold $102 - 0.95 YDGZ PowerShares DB Gold Short ETN $97 - 0.75 NJJT iPath DJ AIG Tin $71 - 0.75 NRJZ ELEMENTS Rogers Intl Cmdty Idx Mtl TR $71 - 0.75 NPGM iPath DJ AIG Platinum $71 - 0.75 NPTM E-TRACS UBS Long Platinum ETN $57 - 0.65 NAGOL ETFs Asian Gold Trust $56 - 0.39 NWITE ETFs White Metals Basket Trust $55 - 0.60 NJJP iPath DJ AIG Precious Metals $33 - 0.75 NBDD PowerShares DB Base Metals Double Long ETN $22 - 0.75 NJJN iPath DJ AIG Nickel $22 - 0.75 NJJU iPath DJ AIG Aluminum $15 - 0.75 NUSV E-TRACS UBS Bloomberg CMCI Silver ETN $8 - 0.40 NUBG E-TRACS UBS Bloomberg CMCI Gold ETN $7 - 0.30 NLD iPath DJ AIG Lead $7 - 0.75 NUBM E-TRACS UBS Bbg CMCI Industrial Metals $7 - 0.65 NBOM PowerShares DB Base Mtls Dbl Short ETN $6 - 0.75 N
Metals (continued)
Commodity Funds Commodity Funds
Soft Commodities (continued)
Energy
Currency Funds

21
Canada & Latin America Listed ETFs
Ticker ETF NameTotal Assets
($M)Stocks in
ETF (#)Exp. Ratio
(%)Options
Available Ticker ETF NameTotal Assets
($M)Stocks in
ETF (#)Exp. Ratio
(%)Options
Available
XIU CN iShares CDN S&P/TSX 60 $11,678 60 0.17 Y VXX/U CN iPath S&P 500 VIX Short-Trm Futures $1,250 - 0.89 NXIC CN iShares CDN S&P/TSX Cap Comp $1,346 245 0.25 Y VXZ/U CN iPath S&P 500 VIX Mid-Term Futures $710 - 0.89 NZCN CN BMO DJ Canada Titans 60 $632 60 0.16 Y HUV CN Horizons S&P 500 VIX Short Term Futures $8 - 0.85 NHXT CN Horizons S&P/TSX 60 $293 - 0.07 N HVU CN Horizons S&P 500 VIX Bull Plus $6 - 1.15 NXTR CN iShares Diversified Monthly Income $254 9^ 0.55 NHXD CN Horizons S&P/TSX 60 Bear $151 - 1.15 YHXU CN Horizons S&P/TSX 60 Bull $65 - 1.15 YHIX CN Horizons S&P/TSX 60 Inv $51 - 1.15 Y FIE/A CN Claymore CDN Financial Monthly Income $153 29 2.21 NHEW CN Horizons S&P/TSX60 Eq Wt $11 - 0.50 N HAC CN Horizons Seasonal Rotation $40 - 0.75* N
CBD CN Claymore Balanced Income Core $26 11^ 0.68 NXMD CN iShares CDN S&P/TSX MidCap $232 185 0.55 N HAG CN Horizons AlphaPro Gartman $21 - 0.75* N
XAL CN iShares Alternatives Completion Portfolio $16 9^ 0.70 NXCS CN iShares CDN S&P/TSX SmallCap $205 209 0.55 N CBD/A CN Claymore Balanced Income Core $15 11^ 1.83 N
CBN CN Claymore Balanced Growth Core $14 16 0.82 NHAA CN Horizons Alphapro Balanced ETF $11 - 0.70 NXCR CN iShares Conservative Core $10 16^ 0.60 NCBN/A CN Claymore Balanced Growth Core $9 16 2.00 N
XGD CN iShares CDN S&P/TSX Global Gold $1,265 56 0.55 Y XGR CN iShares Growth Core $8 21^ 0.60 NXEG CN iShares CDN S&P/TSX Cap Energy $1,117 48 0.55 Y XGC CN iShares Global Completion Portfolio $5 15^ 0.70 NXMA CN iShares CDN S&P/TSX Cap Materials $353 67 0.55 Y ZMI CN BMO Monthly Income ETF $3 10^ 0.55 NHGU CN Horizons Global Gold Bull $180 - 1.15 YZJG CN BMO Junior Gold Index ETF $116 34 0.58 NCMW CN Claymore S&P/TSX Global Mining $61 143 0.59 NHGD CN Horizons Global Gold Bear $56 - 1.15 YCLO CN Claymore Oil Sands Sector ETF $41 17 0.65 N XCH CN iShares China Index Fund $28 25 0.85 NHEU CN Horizons Energy Bull Plus $32 - 1.15 Y XID CN iShares S&P CNX NIFTY India $24 - 0.98 NZEO CN BMO S&P/TSX Eq Wt Oil & Gas Index $29 14 0.59 N XBZ CN iShares Msci Brazil Index Fund $22 81 0.75 NZJO CN BMO Junior Oil Index ETF $26 105 0.59 N ZCH CN BMO China Equity Hdged To CAD Index $14 48 0.71 NHMD CN Horizons S&P/TSX Global Mining Bear $18 - 1.15 N ZID CN BMO India Equity Hdged To CAD Index $13 17 0.71 NCLO/A CN Claymore Oil Sands Sector ETF - A $10 17 1.40 N CJP CN Claymore Japan F'mental C$ Hedged $12 250 0.71 NZJN CN BMO Junior Gas Index ETF $9 - 0.59 N CHI CN Claymore China ETF $8 - 0.70 NZGI CN BMO Global Infrastructure $9 47 0.61 N CJP/A CN Claymore Japan F'mental C$ Hedged $1 250 1.46 NHMU CN Horizons S&P/TSX Glbl Mining Bull $8 - 1.15 NHED CN Horizons Energy Bear Plus $8 - 1.15 Y COW CN Claymore Global Agriculture $303 35 0.69 YHIG CN Horizons Global Gold Inverse $2 - 1.15 N CIE CN Claymore Intl Fundamental Index $123 1,011 0.68 NHIE CN Horizons Energy Inverse $1 - 1.15 N CYH CN Claymore Global Monthly Adv Dividend $102 18 0.67 N
ZDM CN BMO Intl Equity Hedged to CAD $74 303 0.49 NXRE CN iShares CDN S&P/TSX Capped REIT $1,193 13 0.55 Y ZMT CN BMO S&P/TSX Eq Wt Global Base Metal $61 48 0.58 NXFN CN iShares CDN S&P/TSX Capped Financials $1,067 27 0.55 Y XWD CN iShares CDN MSCI World Index Fund $44 3* 0.45 NCEW/A CN Claymore Equal Weight Banc & Lifeco-A $84 10 1.33 N COW/A CN Claymore Global Agriculture $33 35 1.44 NZRE CN BMO Equal Weight REITS Index $69 17 0.59 N CGR CN Claymore Global Real Estate $33 76 0.70 NZEB CN BMO S&P/TSX Equal Weight Banks $68 6 0.58 N CWW CN Claymore S&P Global Water $32 50 0.64 NCEW CN Claymore Equal Weight Banc & Lifeco $33 10 0.58 N CIF CN Claymore Global Infrastructure $27 60 0.70 NHFU CN Horizons S&P/TSX Cap. Fin. Bull $32 - 1.15 Y CYH/A CN Claymore Global Monthly Adv Dividend-A $23 18 1.42 NHFD CN Horizons S&P/TSX Cap. Fin. Bear $29 - 1.15 Y CIE/A CN Claymore International Fundamental $13 1,011 1.40 NZUB CN BMO Eq. Wgt US Bank Hedged CAD $5 16 0.38 N HAZ CN Horizons Alpha Global Dividend ETF $12 - 0.8* NHIF CN Horizons S&P/TSX Cap. Financials Inverse $4 - 1.15 N CWW/A CN Claymore S&P Global Water -A $2 50 1.39 N
CIF/A CN Claymore Global Infrastructure $1 60 1.45 NZUH CN BMO Equal Weight US Health Care $4 51 0.38 N CGR/A CN Claymore Global Real Estate $0 76 1.45 N
HCH CN CP HOLDRS $99 - - N XSP CN iShares CDN S&P 500 CAD-Hedged $1,564 499 0.24 YZUT CN BMO Equal Weight Utilities Index ETF $47 16 0.59 N CLU CN Claymore US Fundamental $124 349 0.69 NXIT CN iShares CDN S&P/TSX Cap Info. Tech $47 5 0.55 Y ZUE CN BMO US Equity Hedged to CAD Index $115 293 0.24 NCMW/A CN Claymore S&P/TSX Global Mining - A $7 143 1.34 N XSU CN iShares CDN Russell 2000 CAD-Hedged $88 1,955 0.35 N
ZQQ CN BMO Nasdaq 100 Equity Hedged $75 100 0.37 NHSD CN Horizons S&P 500 Bear Plus $54 - 1.15 NHXS CN Horizons Betapro S&P500 ETF $24 - 0.15 N
Growth ZDJ CN BMO DJIA Hedged to CAD Index $19 30 0.26 NCRQ CN Claymore Canadian Fundamental $180 68 0.69 N CLU/A CN Claymore US Fundamental -A $16 349 1.45 NCRQ/A CN Claymore Canadian Fundamental - A $47 68 1.44 N HSU CN Horizons S&P 500 Bull Plus $14 - 1.15 NXCG CN iShares CDN Growth $46 55 0.50 N CLU/C CN Claymore US Fundamental -C $13 349 0.69 NValue HAW CN Horizons Alphapro North America $12 - 0.7* NXCV CN iShares CDN Value $58 71 0.50 N HAL CN Horizons Alphapro Dividend ETF $12 - 0.7* NDividend HAV CN Horizons Alphapro North America $11 - 0.20 NXDV CN iShares CDN DJ Canada Select Div $1,020 30 0.50 Y HQU CN Horizons NASDAQ-100 Bull Plus $8 - 1.15 NCDZ CN Claymore CDN Dividend & Income Achvrs $468 41 0.64 N HQD CN Horizons NASDAQ-100 Bear Plus $7 - 1.15 NCDZ/A CN Claymore CDN Div & Inc Achvrs - A $82 41 1.39 N HIU CN Horizons S&P 500 Inverse ETF $6 - 1.15 NSocially Responsible CLU/B CN Claymore US Fundamental -B $2 349 1.45 NXEN CN iShares CDN Jantzi Social Index $23 60 0.50 NAlpha XIN CN iShares 100% Hedged to CAD $1,099 944 0.50 YZWB CN BMO Covered Call Canadian Bank $22 - 0.65 N CBQ CN Claymore BRIC ETF $332 90 0.64 NBWV/U CN iPath CBOE S&P 500 BuyWrite Index $17 - 0.75 N XEM CN iShares CDN MSCI EM Index Fund $234 763 0.82 NHAH CN Horizons S&P/TSX60 130/30 $13 - 0.95 N CWO CN Claymore Broad Emerging Markets $93 890 0.65 NHAX CN Horizons Managed S&P/TSX 60 $6 - 0.7* N CBQ/A CN Claymore BRIC ETF -A $31 90 1.39 N
^ ETF of ETFs* Expense ratio exclusive of performance fees.
Sector Funds
Energy / Materials
Mid Cap
Financials / REITs
Health Care
North America
Regional
Style
Canadian Listed ETFs
Broad Style
Large Cap Volatility
Canadian Listed ETFs
Asset Allocation Funds
International
Country
Global & Sectors
Industrials/ Technology/ Utilities
Small Cap

22
Canada & Latin America Listed ETFs
Ticker ETF NameTotal Assets
($M)Stocks in
ETF (#)Exp. Ratio
(%)Options
Available Ticker ETF NameTotal Assets
($M)Stocks in
ETF (#)Exp. Ratio
(%)Options
Available
Regional (continued)ZEM CN BMO Emerging Markets Equity Index $29 274 0.57 N DGJ CN PowerShares DB Gold Double Short $102 - 0.75 NHJU CN Horizons MSCI EM Markets Bull Plus $11 - 1.15 N DOE CN PowerShares Crude Oil Double Short $91 - 0.75 NCWO/A CN Claymore Broad Emerging Markets -A $10 535 1.40 N HND CN Horizons NYMEX Natural Gas Bear $84 - 1.15 YXLA CN iShares S&P Latin America 40 $8 - 0.65 N HBU CN Horizons COMEX Gold Bullion Bull $53 - 1.15 NHJD CN Horizons MSCI EM Market Bear Plus $4 - 1.15 N HZU CN Horizons COMEX Silver Bull $53 - 1.15 N
CBR CN Claymore Broad Commodity ETF $37 - 0.80 NHZD CN Horizons COMEX Silver Bear $17 - 1.15 NHUZ CN Horizons COMEX Silver ETF $11 - 0.65 N
II/U CN iPath Optimized Currency Carry ETN $25 - 0.65 N HUG CN Horizons COMEX Gold ETF $11 - 0.65 NJYN/U CN iPath JPY/USD Exchange Rate ETN $15 - 0.40 N HKU CN Horizons Comex Copper Bull Plus $8 - 1.15 NHDD CN Horizons US Dollar Bear Plus $9 - 1.15 N HBD CN Horizons COMEX Gold Bullion Bear $6 - 1.15 NHDU CN Horizons US Dollar Bull Plus $8 - 1.15 N DAD CN PowerShares DB Agri Double Short $6 - 0.75 NERO/U CN iPath EUR/USD Exchange Rate ETN $7 - 0.40 N HUK CN Horizons Comex Copper ETF $5 - - NGBX/U CN iPath GBP/USD Exchange Rate ETN $5 - 0.40 N HON CN Horizons Long Natural Gas/ Short Oil $4 - 1.15 N
HKD CN Horizons Comex Copper Bear Plus $4 - 1.15 NZCE CN BMO Energy Commodities Index $3 - 0.65 NZCP CN BMO Precious Metals Commodities $3 - 0.65 N
XSB CN iShares CDN DEX Short Term Bond $1,960 221 0.25 Y ZCA CN BMO Agriculture Commodities $3 - 0.65 NXBB CN iShares CDN DEX Universe Bond $1,451 407 0.30 N ZCB CN BMO Base Metals Commodities $3 - 0.65 NXCB CN iShares CDN DEX All Corporate Bond $1,274 433 0.40 Y HUC CN Horizons Winter-Term Crude Oil $3 - 0.75 NCBO CN Claymore 1-5 Yr Laddered Corp Bond $800 36 0.27 N HNO CN Horizons NYMEX Long $3 - 1.15 NCLF CN Claymore 1-5 Yr Laddered Govt Bond $613 28 0.16 N HUN CN Horizons LT NYMEX Natural Gas $2 - 0.75 NXRB CN iShares CDN DEX Real Return Bond $612 14 0.35 N HIN CN Horizons NYMEX Natural Gas Inverse $2 - 1.15 NCPD CN Claymore S&P/TSX CDN Pref Share $572 142 0.48 N HIO CN Horizons NYMEX Crude Oil Inverse $1 - 1.15 NHAB CN Horizons Alphapro Corp Bond $304 - 0.50 NXHY CN iShares Us High Yield Bond Index $239 - 0.60 NXGB CN iShares CDN DEX All Govt Bond $207 169 0.35 NCHB CN Claymore Advantaged HY Bond $148 138 0.53 NXLB CN iShares CDN DEX Long Term Bond $130 155 0.35 NCBO/A CN Claymore 1-5 Yr Laddered Corp Bond $97 36 0.77 NCLF/A CN Claymore 1-5 Yr Laddered Govt Bond $88 28 0.66 N NAFTRAC MM iShares NAFTRAC 02 $6,077 37 0.25 YCAB CN Claymore Advantaged CDN Bond $79 151 0.56 N ILCTRAC MM iShares IPC Large Cap T.Ret TRAC $510 22 0.38 YZCS CN BMO Short Corp Bond Index $75 101 0.32 N MEXTRAC MM MEXTRAC 09 $345 22 0.25 NZHY CN BMO HY US Corp Bond CAD Hdged $74 167 0.69 N ANGELD MM ANGELD 10 $7 - 1.90 NZCM CN BMO Mid Corporate Bond Index $70 91 0.32 N DIABLOI MM DIABLOI 10 $6 - 1.90 NCPD/A CN Claymore S&P/TSX CDN Pref Share-A $64 142 0.98 N IMXTRAC MM iShares INMEX Total Return TRAC $3 20 0.38 NXPF CN iShares S&P/TSX North America Pref $48 - 0.45 N ICMTRAC MM iShares IPC CompMx T.Return TRAC $1 60 0.38 NXHB CN iShares Dex Hybrid Bond Index $47 - 0.45 NZAG CN BMO Aggregate Bond Index ETF $44 28 0.33 N IMCTRAC MM iShares IPC Mid Cap T.Return TRAC $71 20 0.45 NCMR CN Claymore Premium Money Market $37 - 0.18 NZFS CN BMO Short Federal Bond Index ETF $31 21 0.22 NXIG CN iShares US IG Corporate Bond $31 - 0.30 NZPS CN BMO Short Provincial Bond Index $31 26 0.27 N CONSTRU MM CONSTRU 10 $8 12 0.35 NZLC CN BMO Long Corporate Bond Index $19 59 0.33 N CONSUMO MM Consumo 10 $2 12 0.35 NCHB/A CN Claymore Advantaged HY Bond -A $16 138 1.07 N ENLACE MM Enlace 10 $2 12 0.35 NZEF CN BMO EM Bond CAD Hedged $14 22 0.54 N IHBTRAC MM iShares Habita Total Return TRAC $1 6 0.48 NHTD CN Horizons US 30-yr Bond Bear Plus $14 - 1.15 NHFR CN Horizons Alphapro Float ETF $12 - 0.40 NHPR CN Horizons Alphapro Preferred Share ETF $10 - 0.55 NCAB/A CN Claymore Advantaged CDN Bond -A $10 151 1.07 NZFM CN BMO Mid Federal Bond Index $9 9 0.36 N EFA* MM iShares MSCI EAFE $39,478 948 0.35 NZRR CN BMO Real Return Bond Index $8 6 0.28 N VEU* MM Vanguard FTSE All-World ex-US $7,418 2,269 0.25 NZFL CN BMO Long Federal Bond Index $6 9 0.23 N VEA* MM Vanguard Europe Pacific $6,096 946 0.15 NZXA CN BMO 2013 Corporate Bond Target $5 - 0.30 N IWRDN MM iShares MSCI World $3,585 1,036 0.50 NCIB CN Claymore Inverse 10 Year Govt $4 - 0.50 N ACWI* MM iShares MSCI ACWI $1,912 959 0.35 NZXC CN BMO 2020 Corporate Bond Target $3 - 0.30 N SCZ* MM iShares MSCI EAFE Small Cap $1,521 1,182 0.40 NZXD CN BMO 2025 Corporate Bond Target $3 - 0.30 N EFV* MM iShares MSCI EAFE Value Index $1,514 516 0.40 NZXB CN BMO 2015 Corporate Bond Target $3 - 0.30 N EFG* MM iShares MSCI EAFE Growth Index $1,438 570 0.40 NHTU CN Horizons US 30-yr Bond Bull Plus $3 - 1.15 N IOO* MM iShares S&P Global 100 $1,132 108 0.40 NCMR/A CN Claymore Premium Money Market $3 - 0.26 N GWX* MM SPDR S&P International Small Cap $931 699 0.59 N
ACWX* MM iShares MSCI ACWI ex-US $823 834 0.35 NTOK* MM iShares MSCI Kokusai $662 1,217 0.25 NLYWLD* MM Lyxor ETF MSCI World USD $221 1,678 0.45 N
IGT CN iShares COMEX Gold Trust $5,377 - - N GWL* MM SPDR S&P World ex-US ETF $147 635 0.34 NPHY/U CN Sprott Physical Gold Trust $1,211 - 0.35 N DGT* MM SPDR DJ Global Titans ETF $139 55 0.50 NPHS/U CN Sprott Physical Silver Trust $878 - 0.45 NHNU CN Horizons NYMEX Nat. Gas Bull Plus $605 - 1.15 Y VWO* MM Vanguard Emerging Markets $43,195 892 0.27 NDGU CN PowerShares DB Gold Double Long $490 - 0.75 N EEM* MM iShares MSCI Emerging Markets $36,637 764 0.69 NCGL CN Claymore Gold Bullion ETF $453 - 0.53 Y XLE* MM Energy SPDR $10,950 43 0.20 NHOU CN Horizons NYMEX Crude Oil Bull Plus $324 - 1.15 Y XLF* MM Financial SPDR $7,958 83 0.20 NGAS CN Claymore Natural Gas Commodity $162 - 0.86 Y XLK* MM Technology SPDR $7,021 87 0.20 NDAA CN PowerShares DB Agri Double Long $142 - 0.75 N GDX* MM Market Vectors Gold Miners $6,865 30 0.53 NHOD CN Horizons NYMEX Crude Oil Bear $113 - 1.15 Y
*For Fixed Income Funds the number of stocks held refers to the number of bonds.
Mid Cap
Large Cap
Canadian Listed ETFs
Mexican Listed ETFs
Broad
Currency Funds
Fixed Income Funds*
International
Canadian Listed ETFs
Commodity Funds
Sector
International
Global
Regional
Commodity Funds

23
Canada & Latin America Listed ETFs
Ticker ETF NameTotal Assets
($M)Stocks in
ETF (#)Exp. Ratio
(%)Options
Available Ticker ETF NameTotal Assets
($M)Stocks in
ETF (#)Exp. Ratio
(%)Options
Available
EUE MM iShares DJ Euro STOXX 50 $4,057 50 0.35 N XIU* MM iShares CDN S&P/TSX 60 $11,623 60 0.17 NEPP* MM iShares MSCI Pacific ex-Japan $3,996 151 0.50 N IJH* MM iShares S&P MidCap 400 $10,692 397 0.22 NXLI* MM Industrials SPDR $3,867 60 0.20 N DIA* MM DIAMONDS Trust Series I $9,924 31 0.17 NMOO* MM Market Vectors Agribusiness $3,815 46 0.56 N IUSA* MM iShares S&P 500 $8,999 499 0.40 NXLU* MM Utilities SPDR $3,695 36 0.20 N VNQ* MM Vanguard REIT ETF $8,690 104 0.13 NIYR* MM iShares DJ US Real Estate $3,356 77 0.47 N EXS1N MM iShares DAX DE $8,177 30 0.17 NVGK* MM Vanguard European $3,200 481 0.16 N IJR* MM iShares S&P SmallCap 600 $7,460 595 0.20 NXLP* MM Consumer Staples SPDR $3,032 43 0.20 N IWB* MM iShares Russell 1000 $7,271 973 0.15 NXLB* MM Materials SPDR $2,706 32 0.20 N FXI* MM iShares FTSE/Xinhua China 25 $6,909 25 0.72 NILF* MM iShares S&P Latin America 40 $2,663 34 0.50 N IVW* MM iShares S&P 500 Growth $6,265 325 0.18 NXLV* MM Health Care SPDR $2,625 53 0.20 N EWJ* MM iShares MSCI Japan $6,219 318 0.54 NXLY* MM Consumer Discretionary SPDR $2,126 81 0.20 N EWC* MM iShares MSCI Canada $5,808 99 0.53 NVDE* MM Vanguard Energy $2,081 160 0.24 N VUG* MM Vanguard Growth $5,534 432 0.14 NAAXJ* MM iShares MSCI AC Asia ex-Japan $1,954 225 0.69 N VIG* MM Vanguard Dividend Appreciation ETF $5,498 142 0.23 NVGT* MM Vanguard Information Technology $1,817 424 0.24 N VTV* MM Vanguard Value $4,865 417 0.14 NIYW* MM iShares DJ US Technology $1,677 166 0.47 N IVE* MM iShares S&P 500 Value $4,556 339 0.18 NVPL* MM Vanguard Pacific $1,636 493 0.16 N EWY* MM iShares MSCI South Korea $4,270 100 0.61 NUYG* MM ProShares Ultra Financials $1,378 258 0.95 N VO* MM Vanguard Mid-Cap $3,916 455 0.14 NIBB* MM iShares Nasdaq Biotechnology $1,359 128 0.48 N IWV* MM iShares Russell 3000 $3,472 2,906 0.21 NIEV* MM iShares S&P Europe 350 $1,332 355 0.60 N EWT* MM iShares MSCI Taiwan $3,420 119 0.71 NIYM* MM iShares DJ US Basic Materials $1,217 67 0.47 N RSX* MM Market Vectors Russia ETF $3,290 43 0.62 NBKF* MM iShares MSCI BRIC Index Fund $1,174 220 0.69 N IJK* MM iShares S&P MidCap 400 Growth Idx $3,278 236 0.25 NIYE* MM iShares DJ US Energy $1,147 91 0.48 N OEF* MM iShares S&P 100 $3,159 100 0.20 YEZU* MM iShares MSCI EMU $819 274 0.54 N VV* MM Vanguard Large-Cap $3,156 759 0.12 NGMF* MM SPDR S&P Emerging Asia Pacific $759 265 0.59 N EWA* MM iShares MSCI Australia $3,154 72 0.53 NVAW* MM Vanguard Materials $686 135 0.24 N EWG* MM iShares MSCI Germany $2,652 53 0.53 NVPU* MM Vanguard Utilities $681 87 0.24 N GDXJ* MM Market Vectors Junior Gold Miners $2,342 60 0.59 NVFH* MM Vanguard Financials $680 500 0.24 N IJJ* MM iShares S&P MidCap 400/BARRA Val $2,335 292 0.28 NVHT* MM Vanguard Health Care $664 296 0.24 N VBK* MM Vanguard Small-Cap Growth $2,253 1,000 0.14 NIYZ* MM iShares DJ US Telecom $634 31 0.48 N VBR* MM Vanguard Small-Cap Value $2,045 988 0.14 NVDC* MM Vanguard Consumer Staples $616 109 0.24 N VB* MM Vanguard Small-Cap $2,045 1,737 0.14 NIYH* MM iShares DJ US Healthcare $588 124 0.48 N EWH* MM iShares MSCI Hong Kong $2,004 41 0.53 NIEO* MM iShares DJ US Oil & Gas Exp. & Prod. $572 59 0.48 N IJT* MM iShares S&P SmallCap 600 Growth $1,993 356 0.25 NIYF* MM iShares DJ US Financials $560 257 0.48 N IJS* MM iShares S&P SmallCap 600 Value $1,895 426 0.25 NVIS* MM Vanguard Industrials $558 369 0.24 N EWS* MM iShares MSCI Singapore $1,894 31 0.53 NDIG* MM ProShares Ultra Oil & Gas $541 90 0.95 N EWU* MM iShares MSCI United Kingdom $1,377 106 0.53 NIDU* MM iShares DJ US Utilities $521 73 0.48 N VXF* MM Vanguard Extended Market $1,288 3,022 0.13 NIYJ* MM iShares DJ US Industrials $500 245 0.47 N VOT* MM Vanguard Mid-Cap Growth $1,245 242 0.14 NITB* MM iShares DJ US Home Construction $493 27 0.47 N XOP* MM SPDR S&P Oil & Gas E&P $1,035 39 0.35 NBBVAL MM Accion FTSE Latibex Top ETF/FI $481 36 0.55 N BRTRAC MM BRTRAC 10 $1,006 15 0.50 YIXP* MM iShares S&P Global Telecom $429 42 0.48 N BRF* MM Market Vectors Brazil Small-Cap ETF $928 61 0.65 NIFGL* MM iShares FTSE Global Real Est ex-US $393 171 0.48 N EWM* MM iShares MSCI Malaysia $924 40 0.53 NVCR* MM Vanguard Consumer Discretionary $386 376 0.24 N VOE* MM Vanguard Mid-Cap Value $877 263 0.14 NVOX* MM Vanguard Telecom Services $324 39 0.24 N ECH* MM iShares MSCI Chile $877 34 0.61 NSKF* MM ProShares UltraShort Financials $316 258 0.95 N QLD* MM ProShares Ultra QQQ $869 - 0.95 NIYK* MM iShares DJ US Consumer Goods $298 126 0.48 N GXC* MM SPDR S&P China ETF $680 146 0.59 NGML* MM SPDR S&P Emerging Latin America $275 109 0.60 N EWD* MM iShares MSCI Sweden $676 32 0.53 NIYC* MM iShares DJ US Consumer Services $212 193 0.48 N EPU* MM iShares MSCI All Peru Capped Idx $671 26 0.62 NSRS* MM ProShares UltraShort Real Estate $212 76 0.95 N KOL* MM Market Vectors - Coal ETF $638 38 0.59 NFEZ* MM SPDR DJ Euro Stoxx 50 Fund $172 55 0.29 N EZA* MM iShares MSCI South Africa $610 47 0.61 NITA* MM iShares DJ US Aerospace & Defense $157 32 0.47 N THD* MM iShares MSCI Thailand $574 85 0.62 NGEX* MM Market Vectors Global Alt. Energy $142 30 0.62 N URE* MM ProShares Ultra Real Estate $534 76 0.95 NBBVAD MM AFI Bonos Medio Plazo Euro ETF/FI $131 36 0.15 N TUR* MM iShares MSCI Turkey $508 94 0.61 NLYAEJ* MM Lyxor ETF MSCI AC APxJ USD $88 598 0.65 N EWL* MM iShares MSCI Switzerland Index Fund $504 37 0.53 NSMN* MM ProShares UltraShort Basic Materials $74 - 0.95 N MGK* MM Vanguard Mega Cap 300 Growth $430 187 0.13 NDUG* MM ProShares UltraShort Oil & Gas $72 90 0.95 N IDX* MM Market Vectors - Indonesia Index ETF $410 29 0.68 NFEU* MM SPDR DJ STOXX 50 Fund $42 57 0.29 N TWM* MM ProShares UltraShort Russell2000 $402 - 0.95 NLYLTM* MM Lyxor ETF MSCI EM Latin America USD $32 124 0.65 N ISI* MM iShares S&P 1500 Index Fund $345 1,490 0.20 NIFAS* MM iShares FTSE EPRA/NAREIT Asia $25 75 0.48 N MGV* MM Vanguard Mega Cap 300 Value $336 154 0.13 NMES* MM Market Vectors Gulf States $22 40 0.99 N EWQ* MM iShares MSCI France $317 76 0.54 NSCC* MM ProShares UltraShort Cons. Services $21 195 0.95 N MGC* MM Vanguard Mega Cap 300 $304 305 0.13 NREW* MM ProShares UltraShort Technology $14 160 0.95 N EWP* MM iShares MSCI Spain $300 28 0.54 NIFNA* MM iShares FTSE EPRA/NAREIT NA $13 128 0.48 N NLR* MM Market Vectors - Nuclear Energy ETF $297 23 0.62 NIFEU* MM iShares FTSE EPRA/NAREIT Europe $11 83 0.48 N SLX* MM Market Vectors - Steel Index Fund $262 26 0.56 NSIJ* MM ProShares UltraShort Industrials $8 246 0.95 N HAP* MM Market Vectors - Hard Asset Prod. $246 318 0.65 NAFK* MM Market Vectors Africa Index $7 50 0.84 N DOG* MM ProShares Short Dow30 $234 - 0.95 N
EWO* MM iShares MSCI Austria $207 29 0.54 NSPY* MM SPDR Trust Series 1 $95,366 501 0.09 N TMW* MM SPDR Dow Jones Total Market ETF $204 1,013 0.20 NIVV* MM iShares S&P 500 $28,321 501 0.09 Y EWN* MM iShares MSCI Netherlands $196 54 0.53 NQQQQ* MM Powershares QQQ $25,488 100 0.20 Y EWI* MM iShares MSCI Italy $147 30 0.54 NVTI* MM Vanguard Total Stock Market $19,170 3,389 0.07 N EIS* MM iShares MSCI Israel Capped $122 80 0.61 NIWM* MM iShares Russell 2000 $16,318 1,974 0.28 N LYUSA* MM Lyxor ETF MSCI USA US $89 597 0.35 NEWZ* MM iShares MSCI Brazil $12,756 81 0.61 N JSC* MM SPDR Russell/Nomura Small Cap JPN $85 401 0.55 N
SCJ* MM iShares MSCI Japan Small Cap $45 657 0.53 N
Country (continued)
International International
Mexican Listed ETFs Mexican Listed ETFs
Regional (continued)
Country

24
Canada & Latin America Listed ETFs
Ticker ETF NameTotal Assets
($M)Stocks in
ETF (#)Exp. Ratio
(%)Options
Available Ticker ETF NameTotal Assets
($M)Stocks in
ETF (#)Exp. Ratio
(%)Options
Available
PIBB11 BZ PIBB Fundo de Indice Brasil 50 $1,236 50 - NUUP* MM PowerShares DB USD Idx Bullish $892 - 0.75 N BOVA11 BZ iShares IBOVESPA $495 74 0.54 YFXA* MM CurrencyShares Aus. Dollar Trust $710 - 0.40 N SMAL11 BZ iShares BM&FBOVESPA Small Cap $32 57 0.69 NFXC* MM CurrencyShares CDN Dollar Trust $635 - 0.40 N CSMO11 BZ iShares Bm&F BOVESPA Consumo $18 28 0.69 YFXF* MM CurrencyShares Swiss Franc Trust $437 - 0.40 N BRAX11 BZ iShares BOVESPA IBRX $13 106 0.54 YDBV* MM PowerShares DB G10 Crncy Harvest $353 11 0.75 N MOBI11 BZ iShares Bm&F BOVESPA Imobil $13 15 0.69 YFXY* MM CurrencyShares Japanese Yen Trust $151 - 0.40 N MILA11 BZ iShares BM&FBOVESPA MidLarge Cap $9 80 0.54 YUDN* MM PowerShares DB USD Idx Bearish $150 - 0.75 NFXB* MM CurrencyShares Brit. Pound Sterling $129 - 0.40 N EFA CI iShares MSCI EAFE Index Fund $39,478 921 0.35 NFXS* MM CurrencyShares Swedish Krona Trust $87 - 0.40 N EEM CI iShares MSCI Emerging Markets $36,637 763 0.69 NFXM* MM CurrencyShares Mexican Peso Trust $25 - 0.40 N IVV CI iShares S&P 500 Index Fund/US $28,321 499 0.09 N
IWM CI iShares Russell 2000 Index Fund $16,318 1,955 0.28 NLQD CI iShares iBoxx IG Corporate Bond $12,997 416 0.15 NEWZ CI iShares MSCI Brazil Index Fund $12,756 81 0.61 N
GLD* MM SPDR Gold Trust $54,927 - 0.40 N SHY CI iShares Barclays 1-3 Yr Treasury Bond $7,947 35 0.15 NSLV* MM iShares Silver Trust $11,655 - 0.50 N FXI CI iShares FTSE/Xinhua China 25 Index $6,909 25 0.72 NDBC* MM PowerShares DB Commodity $5,885 - 0.85 N EWJ CI iShares MSCI Japan Index Fund $6,219 318 0.54 NIAU* MM iShares COMEX Gold Trust $5,377 - 0.25 N EWY CI iShares MSCI South Korea Index $4,270 100 0.61 NDBA* MM PowerShares DB Agriculture Fund $3,819 - 0.85 N EWT CI iShares MSCI Taiwan Index Fund $3,420 119 0.71 NGSG* MM iShares S&P GSCI Commodity $1,969 - 0.75 N EWA CI iShares MSCI Australia Index Fund $3,154 72 0.53 NDBO* MM PowerShares DB Oil Fund $642 - 0.75 N ILF CI iShares S&P Latin America 40 Index $2,663 33 0.50 NDBB* MM PowerShares DB Base Metals Fund $603 - 0.75 N EWG CI iShares MSCI Germany Index Fund $2,652 53 0.53 NOILBN MM ETFs Brent 1month Oil Securities $492 - 0.49 N EWH CI iShares MSCI Hong Kong Index Fund $2,004 41 0.53 NDBP* MM PowerShares DB Precious Metals $325 - 0.75 N AAXJ CI iShares MSCI AC Asia ex-Japan $1,954 219 0.69 NDBE* MM PowerShares DB Energy Fund $240 - 0.75 N EWW CI iShares MSCI Mexico Investable Mkt $1,485 45 0.53 N
EWU CI iShares MSCI UK Index Fund $1,377 106 0.53 NIEV CI iShares S&P Europe 350 Index Fund $1,332 346 0.60 NBKF CI iShares MSCI BRIC Index Fund $1,174 214 0.69 N
TIP* MM iShares Barclays TIPS Bond $19,445 30 0.20 N ECH CI iShares MSCI Chile Investable Mkt Index $877 34 0.61 NLQD* MM iShares iBoxx Inv. Grade Corp Bond $12,997 416 0.15 N EZU CI iShares MSCI EMU Index Fund $819 264 0.54 NAGG* MM iShares Barclays Aggregate Bond $11,051 707 0.24 N EPU CI iShares MSCI All Peru Capped Index $671 26 0.62 NBND* MM Vanguard Total Bond Market $9,112 4,741 0.12 NHYG* MM iShares iBoxx $ HY Corporate Bond $8,325 421 0.50 N QQQ PE Powershares QQQ $25,488 100 0.20 NSHY* MM iShares Barclays 1-3 Yr Treasury Bond $7,947 35 0.15 N DIA PE DIAMONDS Trust Series I $9,924 30 0.18 NCSJ* MM iShares Barclays 1-3 Yr Credit Bond $7,674 661 0.20 NJNK* MM SPDR Barclays Capital H. Yield Bond $7,288 215 0.40 N SIAF TP Savinvest India Asia Fund $186 - - NBSV* MM Vanguard Short-Term Bond $5,944 1,273 0.12 NIBCXN MM iShares € Corporate Bond $4,685 90 0.20 N VENDEBT NT Venezuelan Domestic Debt Fund Ltd $5 - 0.25 NSHV* MM iShares Barclays Short Treasury Bond $4,144 12 0.15 NCIU* MM iShares Barclays Interm. Credit Bond $3,105 1,262 0.20 N *For Fixed Income Funds the number of stocks held refers to the number of bonds. IEF* MM iShares Barclays 7-10 Yr Treasury Bond $2,773 14 0.15 NTLT* MM iShares Barclays 20+Y Treasury Bond $2,680 14 0.15 NMBB* MM iShares Barclays MBS Bond Fund $2,339 121 0.33 NEMB* MM iShares JPMorgan USD EM Bond $2,246 72 0.60 NBIV* MM Vanguard Intermediate-Term Bond $1,929 1,079 0.12 NEXHBN MM iShares Govt Germany 1.5-2.5DE $1,863 6 0.16 NBWX* MM SPDR Barclays Intl. Trsry Bond $1,394 211 0.50 NIEI* MM iShares Barclays 3-7 Yr Treasury Bond $1,273 34 0.15 NIBGSN MM iShares € 1-3 Government Bond $1,071 10 0.20 NIBCIN MM iShares € Inflation Linked Bond $1,067 24 0.25 NBIL* MM SPDR Barclays 1-3 Month T-Bill $1,022 10 0.13 NEXHAN MM iShares eb.rexx Govt. Germany DE $1,012 25 0.16 NWIP* MM SPDR DB Intl Govt Infl.-Protected $999 70 0.50 NCFT* MM iShares Barclays Credit Bond Fund $766 1,194 0.20 NIBTS* MM iShares $ Treasury Bond 1-3 $594 30 0.20 NIBGX* MM iShares Euro Government Bond 3-5 $582 17 0.20 NIBGM* MM iShares Euro Government Bond 7-10 $560 12 0.20 NGVI* MM iShares Barclays Interm .Govt/Credit Bond $518 388 0.20 NAGZ* MM iShares Barclays Agency Bond Fund $405 78 0.20 NITPS* MM iShares $ TIPS $395 30 0.25 NIPE* MM SPDR Barclays Capital TIPS ETF $380 31 0.18 NIBTM* MM iShares USD Treasury Bond 7-10 $366 12 0.20 NBLV* MM Vanguard Long-Term Bond $330 1,114 0.12 NIBGL* MM iShares Euro Government Bond 15-30 $206 31 0.20 NTLH* MM iShares Barclays 10-20 Yr Treasury Bond $191 22 0.15 NCORPTRC MM iShares Mexico Corp Bond TRAC $160 64 0.30 NUDITRAC MM iShares LATixx Mexico UDITRAC $151 11 0.30 NGBF* MM iShares Barclays Govt/Credit Bond $107 307 0.20 NCETETRC MM iShares LATixx Mexico CETETRAC $53 13 0.30 NUMSTRAC MM iShares LATixx Mexico UMSTRAC $12 11 0.30 NM5TRAC MM iShares LATixx Mexico M5TRAC $3 9 0.30 NM10TRAC MM iShares LATixx Mexico M10TRAC $3 6 0.30 N
Mexican Listed ETFs Other Latin American Listed ETFs
Currency Funds
Commodity Funds
Fixed Income Funds*
Venuzuela
Brazil
Chile
Peru
Trinidad

25
EMEA Listed ETFs
Ticker ETF NameTotal Assets
(€M)Stocks in
ETF (#)Exp. Ratio
(%)Options
Available Ticker ETF NameTotal Assets
(€M)Stocks in
ETF (#)Exp. Ratio
(%)Options
Available
Austria Italy (continued)ATXEX AV iShares ATX (DE) € 72 20 0.32 N IMIB LN iShares FTSE MIB € 67 41 0.35 NCBATX GY ComStage ETF ATX € 31 -- 0.25 N Main X-listings: IMIB IM (EUR)Main X-listings: CBATX SW (CHF) XMIB IM db x-trackers FTSE MIB Index ETF € 56 40 0.30 NBelgium Main X-listings: XMIB SW (CHF)BEL BB Lyxor ETF BEL 20 € 39 20 0.50 N BERMIB IM Lyxor ETF Bear FTSE MIB € 30 -- 0.60 NFinland FMI FP Amundi ETF FTSE MIB € 18 -- 0.18 NH25ETF FH OMX Helsinki 25 € 203 25 0.17 N CSMIB IM CSETF on FTSE MIB € 17 39 0.33 NFrance Main X-listings: CMB1 LN (GBP), CSMIB SW (CHF)CAC FP Lyxor ETF CAC 40 € 2,937 4 0.25 N CI1 IM Amundi ETF MSCI Italy € 11 -- 0.25 NE40 FP EasyETF CAC 40 € 684 40 0.25 N ITS2 IM ETFX FTSE MIB Super Short 2X € 5 40 0.60 NC40 FP Amundi ETF CAC 40 € 672 -- 0.25 N ITL2 IM ETFX FTSE MIB Leveraged 2X € 3 40 0.60 NBX4 FP Lyxor ETF XBear CAC 40 € 295 40 0.60 N NetherlandsLVC FP Lyxor ETF Leverage CAC 40 € 236 -- 0.40 N IAEX NA iShares AEX € 263 26 0.30 NX40 FP db x-trackers CAC 40 € 50 41 0.20 N Main X-listings: IAEX LN (GBp)CL4 FP Amundi ETF Leveraged CAC 40 € 41 -- 0.30 N AEXT NA SPDR AEX € 137 25 0.30 NSHC FP Lyxor ETF Short CAC 40 € 31 -- 0.40 N NTH NA ETFX AEX Fund € 33 25 0.30 NC4S FP Amundi ETF Short CAC 40 € 22 -- 0.35 N EAMX NA ETFX AMX Fund € 22 25 0.35 NZ40 FP ComStage ETF CAC 40 € 21 -- 0.20 N SHA NA Lyxor ETF Short AEX € 11 -- 0.40 NMain X-listings: CD40 SW (CHF) CH1 FP Amundi ETF MSCI Netherlands € 10 -- 0.25 NCF1 FP Amundi ETF MSCI France € 20 -- 0.25 N LVA NA Lyxor ETF Leverage AEX € 10 -- 0.40 NK40 FP HSBC CAC 40 ETF € 15 40 0.25 N TMX NA Think AMX Tracker -- -- 0.35 NX4S FP db x-trackers CAC 40 Short € 14 41 0.40 N TDT NA Think AEX Tracker -- -- 0.30 NMain X-listings: XC4S SW (CHF), XC4S LN (GBP) NorwayZ4L FP ComStage ETF CAC 40 Leverage € 10 -- 0.30 N OBXEDNBN NO DnB NOR OBX € 177 25 0.60 NMain X-listings: CD42 SW (CHF) OBXBULL NO XACT Derivat Bull € 173 25 0.80 NZ4S FP ComStage ETF CAC 40 Short Tr € 9 -- 0.35 N OBXEXACT NO XACT OBX € 96 25 0.30 NMain X-listings: CD41 SW (CHF) OBXBEAR NO XACT Derivat Bear € 73 25 0.80 NEZC FP EasyETF CAC40 Double Short € 9 40 0.50 N OBXBEARD NO DnB NOR OBX Derivat Bear € 4 25 0.80 NF4M FP Lyxor ETF Flexible CAC 40 € 8 40 1.00 N BULLOBX3 NO BULL OBX X3 Ha -- -- 0.60 NFRL2 NA ETFX CAC 40 2x Long Fund € 3 -- 0.50 N BEAROBX3 NO BEAR OBX X3 Ha -- -- 0.60 NFRS2 NA ETFX CAC 40 2x Short Fund € 2 40 0.60 N PortugalKCAC451 IT KSM CAC40 51 ETF € 1 -- 0.80 N PP2 PL ComStage PSI 20 Leverage € 12 -- 0.50 NMBCAC39 IT Clal - Mabat CAC 40 -- -- - N PPP PL ComStage PSI 20 € 11 -- 0.50 NGermany RussiaDAXEX GY iShares DAX (DE) € 4,632 30 0.17 Y RUS FP Lyxor ETF Russia € 1,059 10 0.65 NXDAX GY db x-trackers DAX ETF € 3,216 30 0.15 N XMRC IM db x-trackers MSCI Russia Capped € 455 29 0.65 NMain X-listings: XDAX SW (CHF), XDAX SS (SEK) Main X-listings: XMRD LN (USD), XMRC LN (GBP)MDAXEX GY iShares MDAX (DE) € 1,162 50 0.52 N RDXS LN Source - RDX Source ETF € 412 15 0.65 NDAX FP Lyxor ETF DAX € 924 30 0.15 N LYRUS SE Lyxor ETF Russia USD € 113 10 0.65 NETFDAX GY ETFLab DAX € 813 31 0.15 N RUSSDX IM Market Access Daxglobal Russia € 80 -- 0.70 NCBDAX GY ComStage ETF DAX TR € 625 -- 0.12 N Main X-listings: MDRI SW (USD), RUSD LN (GBP)Main X-listings: CBDAX SW (CHF) CSRU SW CSETF on MSCI Russia € 49 -- 0.65 NXSDX GY db x-trackers ShortDAX Daily € 432 30 0.40 N Main X-listings: CSRU IM (EUR), CRU1 LN (GBP)Main X-listings: XSDX LN (GBP), XSDX SW (CHF), XSDX SS (SEK) CBMRUC30 GY ComStage MSCI Russia 30% Capped € 18 -- 0.60 NDAXLEV IM Lyxor ETF LevDAX € 313 30 0.40 N Main X-listings: X018US SW (USD), CBMRUC30 GY (EUR)ETFDAXK GY ETFlab DAX € 252 31 0.15 N RUSS LN iShares MSCI Russia Capped € 18 -- 0.74 NCG1 FP Amundi ETF MSCI Germany € 132 -- 0.25 N Main X-listings: ISOB GR (EUR)DS2P LN ETFX DAX 2x Short Fund € 53 30 0.60 N ERR FP EasyETF DJ Russia Titans 10 € 13 10 0.55 NMain X-listings: DEL2 GY (EUR) RSTRS RU Troika Dialog- RTS Standard € 6 -- -- NDAXPUT IM Lyxor ETF DAXplus Protective Put € 28 30 0.40 N KSMRUSIA IT KSM Russia € 1 16 1.00 NDAX30S GY Source - DAX Source ETF € 21 30 0.15 N South AfricaDAX2S IM Lyxor ETF Daily Shortdax X2 € 21 30 0.60 N STX40 SJ Satrix 40 € 715 40 0.45 NDL2P LN ETFX DAX 2x Long Fund € 19 30 0.40 N SAFRI IM Lyxor FTSE JSE Top 40 € € 197 40 0.65 NMain X-listings: DEL2 LN (EUR) STXSWX SJ Satrix SWIX Top 40 € 83 40 0.45 NLYXDAXCC GY Lyxor ETF DAXplus Covered Call € 17 30 0.40 N NRD SJ Trackhedge-NewRand € 66 10 0.30 NDBPD GY db x-trackers ShortDax 2X € 10 -- 0.60 N BIPS40 SJ BIPS - FTSE/JSE Top 40 € 52 42 0.22 NMain X-listings: XSD2 SW (CHF), XSD2 SS (SEK), XSDX LN (GBP) CSZA IM CSETF on MSCI South Africa € 24 47 0.65 NC2D FP Amundi ETF Short DAX 30 € 4 -- 0.35 N Main X-listings: CSZA LN (USD), CZA1 LN (GBP)KSMDAX IT KSM DAX € 1 -- 0.50 N AFRI IM Market Access FTSE/JSE Top 40 € 19 -- 0.70 NMBDX21 IT Clal - Mabat DAX € 1 -- - N Main X-listings: MFAI SW (USD)INDXS19 IT INDEX DAX NIS19 € 1 -- - N LSAF LN Lyxor ETF FTSE JSE Top 40 € 10 42 0.65 NPSDAX68 IT Psagot Sal DAX Nis € 1 -- 0.80 N SRSA LN iShares MSCI South Africa € 7 48 0.74 NTCDX20 IT TACHLIT DAX € 1 -- 0.50 N Main X-listings: IRSA LN (USD), IBC4 GY (EUR)XLDX IM db x-trackers LevDAX -- -- 0.35 N BBET40 SJ Bettabeta Eq Weight Top40 € 4 44 0.42 NMain X-listings: XLDX LN (GBP), XLDX SW (CHF), XLDX SS (SEK) PMMSCI9 IT KSM MSCI South Africa € 1 -- 0.80 NC002EU SW ComStage ETF DAX FR -- -- 0.15 N STAN40 SJ STANLIB Top 40 Fund -- 40 0.50 NMain X-listings: C002 SW (CHF) STANSX SJ STANLIB Swix 40 Fund -- -- 0.50 NTCDAX53 IT Tachlit Dax Ils -- -- 0.80 N SpainGreece BBVAI SM BBVA Accion Ibex 35 ETF € 128 36 0.33 NGRE FP Lyxor ETF MSCI Greece € 79 8 0.45 N LYXIB SM Lyxor ETF IBEX 35 € 93 35 0.30 NAETF20 GA Alpha ETF FTSE Athex 20 € 45 20 0.38 N INVEX SM Lyxor ETF IBEX 35 Inverso € 49 35 0.40 NETFASE GA NBGAM - Athex General Domestic € 5 42 0.50 N CS1 FP Amundi ETF MSCI Spain € 15 -- 0.25 NIreland PMSCI14 IT KSM MSCI Spain -- 28 - NIETF ID ISEQ 20 ETF Shares € 18 20 0.50 N SwedenItaly XACTSBX SS XACT OMXSB € 280 -- 0.30 NETFMIB IM Lyxor ETF FTSE MIB € 391 40 0.35 N XACBULL SS XACT Bull € 237 -- 0.60 NXBRMIB IM Lyxor ETF XBear FTSE MIB € 228 -- 0.60 N XACBEAR SS XACT Bear € 136 -- 0.60 NLEVMIB IM Lyxor ETF Leveraged FTSE MIB € 115 -- 0.60 N XABULL2 SS XACT Bull 2 € 101 -- 0.60 N
XABEAR2 SS XACT Bear 2 € 35 -- 0.60 N
Country Country

26
EMEA Listed ETFs
Ticker ETF NameTotal Assets
(€M)Stocks in
ETF (#)Exp. Ratio
(%)Options
Available Ticker ETF NameTotal Assets
(€M)Stocks in
ETF (#)Exp. Ratio
(%)Options
Available
Sweden (continued) UK (Continued)OMXDS SS Carnegie OMX Double Short ETF € 4 -- 0.40 N L250 LN Lyxor ETF FTSE 250 € 19 254 0.35 NOMXDL SS Carnegie OMX Double Long ETF € 3 -- 0.40 N HMCX LN HSBC FTSE 250 ETF € 19 254 0.35 NBULLOMX3 SS BULL OMX X3 H-A -- -- -- N CUKX LN CSETF on FTSE 100 £ € 15 102 0.33 NBEAROMX3 SS BEAR OMX X3 H -- -- -- N Main X-listings: CSUKX IM (EUR)Switzerland 8H84 LN ComStage FTSE 100 Leveraged TR € 12 -- 0.45 NCSSMI SW Xmtch CH on SMI € 2,635 20 0.39 Y Main X-listings: 8H84 GY (EUR), 8H84 SW (CHF)Main X-listings: XMT GY (EUR) 8H82 LN ComStage ETF FTSE 250 Tr-I € 11 -- 0.30 NCSSMIM SW Xmtch CH on SMIM € 1,193 30 0.49 N Main X-listings: 8H82 GY (EUR), 8H82 SW (CHF)SMICHA SW UBS-ETF SMI € 674 20 0.35 N 8H80 LN ComStage FTSE All-Share Tr-I € 11 -- 0.35 NCSSLI SW Xmtch CH on SLI € 473 31 0.39 N Main X-listings: 8H80 GY (EUR), 8H80 SW (CHF)XSMI SW db x-trackers SMI ETF € 280 20 0.30 N F1GBAS SW UBS-ETF FTSE 100 Sf - A £ € 9 -- 0.30 NMain X-listings: XSMI IM (EUR) 8H83 LN ComStage ETF FTSE 100 Short-I € 9 -- 0.45 NSLICHA SW UBS-ETF SLI € 132 30 0.35 N Main X-listings: 8H83 GY (EUR), 8H83 SW (CHF)SMIEX SW iShares SMI (DE) € 111 20 0.52 N S250 LN Source - FTSE 250 Source - £ € 7 261 0.35 NMain X-listings: SMIEX GY (EUR) Main X-listings: SF250 GY (EUR)CSW FP Amundi ETF MSCI Switzerland € 52 -- 0.25 N FTAS LN Lyxor ETF FTSE All-Share € 7 628 0.40 NMain X-listings: CSWCHF SW (CHF) 250F LN Lyxor ETF FTSE 250 € 5 254 0.35 NCBSMI GY ComStage ETF SMI € 45 -- 0.25 N XUL2 IM db x-trackers FTSE 100 Leveraged € 2 102 0.50 NMain X-listings: CBSMI SW (CHF) Main X-listings: XUL2 LN (GBP), XUL2 SW (CHF)XSLI SW db x-trackers SLI ETF € 31 30 0.35 N KSMFTSE IT KSM FTSE 100 € 1 -- - NMain X-listings: XSLI GY (EUR) MBFT23 IT Clal - Mabat FTSE 100 € 1 -- - NSMMCHI SW UBS-ETF SMIM ETF I € 29 30 0.20 N SF100 GY Source - FTSE 100 Source ETF -- 103 0.30 NSMMCHA SW UBS-ETF SMIM ETF A € 24 30 0.32 N SF250 GY Source - FTSE 250 Source ETF -- 261 0.35 NLYSLE SW Lyxor Daily Leveraged SMI € 15 20 0.40 N IF10048 IT IndexSal FTSE 100 48 -- -- - NLYSSL SW Lyxor ETF Daily Double Short SMI € 12 20 0.60 N Eastern EuropeVSLA1 SE Vontobel - SLI Bonus € 4 -- 0.60 N CEC FP Lyxor Eastern Europe CECE EUR € 448 -- 0.50 NXSVS SW db x-trackers SMI Short Daily-1C € 3 20 0.50 N IEER LN iShares MSCI Eastern Europe 10/40 € 386 50 0.74 NMain X-listings: XSVS GY (EUR) Main X-listings: IEER IM (EUR), IDEE LN (USD)Turkey ETFW20L PW Lyxor ETF WIG-20 € 62 20 0.50 NTUR FP Lyxor ETF Turkey € € 268 20 0.65 N CBNDUEEM GY ComStage MSCI EM Eastern Europe € 27 -- 0.60 NITKY LN iShares MSCI Turkey € 169 19 0.74 N Main X-listings: CBNDUEEM SW (CHF), X016US SW (USD)Main X-listings: ITKY NA (EUR), ITKY SW (USD) BUXETF HB OTP BUX Index Tracking € 13 12 -- NEETEUR FP EasyETF DJ Turkey Titans 20 € 19 20 0.65 N CE9 FP Amundi ETF MSCI Eastern Europe ex-Russia € 10 -- 0.45 NDJIST TI Dow Jones Istanbul 20 € 13 20 0.95 N Main X-listings: CE9USD SW (USD)TURK IM Market Access DJ Turkey Titans 20 € 12 -- 0.85 N LEEU LN Lyxor ETF Eastern Europe € 9 -- 0.50 NMain X-listings: MDJT SW (USD) Main X-listings: LEUU LN (USD)ISDJE TI IS Invest. - DJ Turkey Eq Weight 15 € 4 15 1.00 N 9J6W GY RBS - CECE Index € 7 -- 0.50 NHTRD LN HSBC MSCI Turkey ETF € 3 19 0.60 N MPEU SV Alta Eurostock Slovenia € 6 30 1.38 NPMMSCI1 IT KSM MSCI Turkey € 1 20 0.85 N M9SG GY Market Access South-East Europe € 6 -- 0.80 NNFIST TI Non-Financial Istanbul 20 € 1 21 0.95 N SPOL LN iShares MSCI Poland € 4 23 0.74 NBNKTR TI Banka Turkey Large - Cap € 1 6 0.95 N Main X-listings: IPOL LN (USD)SPTUR TI Akbank - S&P/IFCI Turkey Type A -- 55 1.28 N ETFGT30P GA NBGAM Greece And Turkey 30 € 3 30 0.95 NUK KSMESEU IT KSM East Europe € 1 -- - NISF LN iShares FTSE 100 € 4,381 102 0.40 N PMMXME6 IT KSM MSCI East Europe -- -- 0.85 NMain X-listings: ISF IM (EUR) ABN20590 GY Crobex CW50 Croatia Zagreb S -- -- - NMIDD LN iShares FTSE 250 € 610 256 0.40 N GT30 TI Finansbank Gt30 A Tipi -- 30 0.95 NXUKX LN db x-trackers FTSE 100 € 562 102 0.30 N Middle East & AfricaMain X-listings: XUKX GY (EUR) LAFRI IM Lyxor ETF Pan Africa € 196 30 0.85 NL100 LN Lyxor ETF FTSE 100 € 435 102 0.30 N XMEA IM db x-trackers MSCI EM EMEA TR € 136 139 0.65 NMain X-listings: L100 FP (EUR) Main X-listings: XMXD LN (USD), XMEA LN (GBP), XMEA SS (SEK)XASX LN db x-trackers FTSE All Share € 212 627 0.40 N LKUU LN Lyxor ETF FTSE Coast Kuwait 40 € 36 40 0.65 NMain X-listings: XASX GY (EUR) Main X-listings: LKUW LN (GBP)100GBA SW UBS-ETF FTSE 100 € 197 106 0.30 N CEME LN CSETF on MSCI EM EMEA € 29 139 0.65 NMain X-listings: 100EUA GY (EUR), 100CHA SW CHF Main X-listings: CSEMEM IM (EUR), CME1 LN (GBP)HUKX LN HSBC FTSE 100 ETF € 167 100 0.35 N KSM100 IT KSM Financial - KSM TA 100 € 24 100 - NMain X-listings: UKX FP (EUR), HUKX SW (USD) IST30 TI IST-30 ISE 30 ETF € 24 30 0.95 NUKXEX GY iShares FTSE 100 (DE) € 136 102 0.52 N TGTA758 IT Tachlit TA-75 € 17 -- 1.00 NCU1 FP Amundi ETF MSCI UK € 82 -- 0.25 N MBTG75 IT Clal - Mabat Gidur TA-75 € 14 -- - NXUKS LN db x-trackers FTSE 100 Short € 76 102 0.50 N KSM75 IT KSM Financial - KSM TA 75 € 14 75 0.50 NMain X-listings: XUKS IM (EUR), XUKS SW (CHF) SGCC LN iShares MSCI GCC ex-Saudi Arabia € 13 54 0.80 NLFAS LN Lyxor ETF FTSE All-Share € 73 628 0.40 N Main X-listings: IGCC LN (USD), IGCC NA (EUR)S100 LN Source - FTSE 100 ETF - £ € 65 103 0.30 N TALI IT Psagot - TA-25 € 12 25 - NMain X-listings: SF100 GY (EUR) KSM9010 IT KSM 90/10 € 10 -- - NCSUKL SW CSETF on MSCI UK Large Cap € 63 40 0.48 N FALCOM30 AB Falcom Saudi Equity ETF € 9 30 0.50 NMain X-listings: CSUKL IM (EUR) KSM8020 IT KSM Financial - KSM 80/20 € 9 -- - NXMCX LN db x-trackers FTSE 250 ETF € 58 254 0.35 N ENBT1 IT Clal - Mabat TA 25 € 8 -- - NMain X-listings: XMCX GY (EUR) KSM25 IT KSM Financial - KSM 25 € 7 25 0.50 NSUK2 LN ETFX FTSE 100 Super Short 2x € 48 102 0.60 N MBT1002 IT Clal - Mabat TA 100 € 6 -- - NC1U FP Amundi ETF FTSE 100 € 40 -- 0.25 N TC100 IT Tachlit TA 100 € 6 -- - NMain X-listings: C1UGBP SW (GBP) TC25 IT Tachlit TA 25 € 5 -- - NCSUK SW CSETF on MSCI UK € 40 107 0.33 N 9J6V GY RBS MSCI GCC Ex Saudi Arabia € 5 -- 0.85 NMain X-listings: CSUK IM (EUR) MBT1929 IT Clal - Mabat 19 90/10 € 5 -- - NDBXUK SJ db x-trackers FTSE 100 Portfolio € 36 102 1.14 N 00I1 GY RBS MSCI EFM Africa Ex Za Daily € 4 -- 1.35 NCUKS LN CSETF on MSCI UK Small £ € 26 219 0.58 N 1UAE UH NBAD Oneshare DJ UAE 25 ETF € 3 25 0.99 NMain X-listings: CSUKS IM (EUR) HRL100 IT Harel Sal TA 100 € 3 100 - N8H81 LN ComStage ETF FTSE 100 Tr € 24 -- 0.25 N IND1002 IT Indexsal - Index Tel Aviv 100 € 3 -- - NMain X-listings: 8H81 GY (EUR), 8H81 SW (CHF) KSMYT120 IT KSM Yeter 120 € 3 -- 1.00 NLYUK LN Lyxor ETF FTSE 100 € 20 100 0.30 N TTA1003 IT Psagot Sal TA 100 € 3 -- - NLUK2 LN ETFX FTSE 100 Leveraged 2x Fund € 19 100 0.50 N KSMBIT IT KSM Financial - KSM BITUACH € 2 -- 0.50 N
Country Broad Based

27
EMEA Listed ETFs
Ticker ETF NameTotal Assets
(€M)Stocks in
ETF (#)Exp. Ratio
(%)Options
Available Ticker ETF NameTotal Assets
(€M)Stocks in
ETF (#)Exp. Ratio
(%)Options
Available
Middle East & Africa (continued) Large Cap (continued)TCLYT10 IT Tachlit Yeter 120 € 2 -- 1.00 N CBNDDUEM GY ComStage ETF MSCI EMU TRN € 391 -- 0.25 NINDX251 IT IndexSal - TA 25 € 2 -- - N Main X-listings: CBNDDUEM SW (CHF), X012US SW (USD)PST7517 IT Psagot Sal TA 75 € 2 -- 0.05 N ERO FP SPDR MSCI Europe € 374 474 0.30 NHRL75 IT Harel Sal TA 75 € 2 75 0.40 N E50CHA SW UBS-ETF EuroStoxx 50 € 374 51 0.30 NHRL25 IT Harel Sal TA 25 € 2 25 - N Main X-listings: E50EUA IM (EUR), E50GBP SW (GBP), E50SKA SS (SEK)KSMMA IT KSM TA MAALA 20 € 2 20 0.20 N XACTVINX SS XACT Nordic 30 € 368 30 0.40 NTCT2540 IT Tachlit TA 25 Aggressive € 1 -- - N CBSXXR GY ComStage ETF Stoxx Europe 600 € 350 -- 0.20 NKSHOR25B IT KSM Short TA-25 € 1 25 - N Main X-listings: CBSXXR SW (CHF)MBT2520 IT Clal - Mabat TA25 Short € 1 -- - N CBSX5T GY ComStage EuroStoxx 50 TR € 292 -- 0.10 NMTA7534 IT Clal - Mabat TA 75 Short € 1 -- - N Main X-listings: CBSX5T SW (CHF)TC90102 IT Tachlit Composite 90/10 € 1 -- 0.50 N CEU FP Amundi ETF MSCI Europe € 284 -- 0.28 NIND7515 IT IndexSal - Index TA 75 € 1 -- - N XSSX IM db x-trackers EuroStoxx 50 Short € 270 51 0.40 NMBMN30 IT Clal - Mabat 30 TA25 € 1 -- - N Main X-listings: XSSX SW ((CHF), XSSX SS (SEK)PS12019 IT Psagot Sal Yeter 120 € 1 120 - N EMUEUA SW UBS-ETF MSCI EMU € 229 276 0.35 NMBT2526 IT Clal - Mabat 25 AGR25 Short € 1 -- - N Main X-listings: EMUCHA SW (CHF)KSM30 IT KSM Small Cap 30 € 1 30 1.00 N ETB FP EasyETF EuroStoxx 50 € 206 50 0.25 NTGTA255 IT Tachlit Short TA 25 € 1 -- - N BBVAE SM BBVA Accion EuroStoxx 50 € 186 52 0.15 NTC20803 IT Tachlit Composite 8020 € 1 -- 0.50 N SPE FP Amundi ETF S&P Europe 350 € 177 -- 0.35 NPSG5020 IT Psagot Sal Yeter 50 € 1 -- 1.00 N LVE FP Lyxor ETF Leveraged EuroStoxx 50 € 164 -- 0.40 NMBTYT38 IT Clal - Mabat Small-Cap 120 € 1 -- - N XMPE IM db x-trackers MSCI Pan-Euro € 161 199 0.30 NKSHORTYT IT KSM Short Yeter 30 € 1 -- - N SMSEUR GY Source - MSCI Europe Source € 157 473 0.30 NKST2523 IT KSM Long TA 25 X3 Daily € 1 25 1.50 N CMU FP Amundi ETF MSCI EMU € 149 -- 0.25 NKST7520 IT KSM Long TA 75 X2 € 1 75 1.50 N SEUA LN iShares EuroStoxx 50 Acc € 135 51 0.35 NMT1S32 IT Clal - Mabat TA 100 Short € 1 -- - N Main X-listings: IEUA NA (EUR)INDXM30 IT IndexSal - Index Share 30 € 1 -- - N SDJ600 GY Source - Stoxx Europe 600 Source € 135 603 0.19 NPR15S18 IT Psagot Sal Nadlan 15 -- -- - N CSSX5E IM CSETF on EuroStoxx 50 € 133 50 0.20 NHDSGLN5 IT Hadas Indices Gilon -- -- - N Main X-listings: CS51 LN (GBP)KSM5070 IT KSM Short Yeter 750 -- 50 - N CN1 FP Amundi ETF MSCI Nordic € 133 -- 0.25 NHRLA25 IT Harel Sal TA 25 Aggressive -- 25 - N MSET FP Lyxor ETF EuroStoxx 50 Tr-C € 128 50 0.30 NIN10010 IT IndexSal - Index Short 100 -- -- - N Main X-listings: MSEG PZ (GBP)INTA259 IT IndexSal - Index Short 25 -- -- - N BXX FP Lyxor EuroStoxx 50 Double Short € 110 50 0.60 NKSRT75X2 IT KSM SHORT TA 75 X2 daily -- 25 - N ETZEUR FP EasyETF Stoxx Europe 600 € 104 600 0.30 NMBTF302 IT Clal - Mabat Yeter 50 -- -- - N SPO FP Amundi ETF S&P Euro € 85 -- 0.35 NMB10058 IT Mabat Short TA-100 -- -- - N IEUT LN iShares PLC - FTSEurofirst 100 € 83 102 0.40 NKSRT25X3 IT KSM SHORT TA 25 X3 daily -- 25 - N Main X-listings: IETA NA (EUR), IEUT SW (CHF)ITA7546 IT Index Ta75 46 -- -- - N CBNDDUE1 GY ComStage ETF MSCI Europe TRN € 82 -- 0.25 NHRSHR43 IT Harel Sal Equity Portfolio -- -- 0.50 N Main X-listings: CBNDDUE1 SW (CHF), X011US SW (USD)HY12018 IT Harel Sal Mid-Cap -- -- 1.00 N CU9 FP Amundi ETF MSCI Europe x EMU € 80 -- 0.30 NHRY5014 IT Harel Sal Yeter 50 -- -- 1.00 N ETM FP EasyETF Stoxx Europe 50 € 78 50 -- NKT10019 IT KSM SHORT TA 100 X3 daily -- 100 1.50 N 50E FP HSBC EuroStoxx 50 ETF € 76 365 0.60 NNote: Total Assets (€M) is calculated as the number of ETF shares that have been issued, Main X-listings: HMFD LN (USD), H50E LN (GBP)multiplied by the last price of a share. Stocks in ETF shows the number of stocks that are BSX FP Lyxor EuroStoxx 50 Daily Short € 69 50 0.60 Nactually held in the ETF currently, and not the targeted number of names to be held. CS9 FP Amundi MSCI Europe ex Switz € 69 -- 0.30 N
ETFSTX5 GY ETFlab Stoxx Europe 50 € 59 50 0.19 NIEUR LN iShares FTSEurofirst 80 € 59 80 0.40 NMain X-listings: IEUR IM (EUR), IEUR SW (CHF)
Large Cap ETX FP EasyETF EuroStoxx € 49 313 0.30 NMSE FP Lyxor ETF Euro Stoxx 50 € 6,194 50 0.25 N DBXEU SJ db x-trackers EuroStoxx 50 € 37 50 1.14 NSX5EEX GY iShares EuroStoxx 50 DE € 4,096 50 0.17 N CD5 FP Amundi ETF EuroStoxx 50 € 35 -- 0.15 NEUE LN iShares EuroStoxx 50 € 3,185 50 0.35 N XACTNORD SS XACT Nordic 120 € 35 120 0.40 NMain X-listings: EUE IM (EUR), EUNE SW (CHF) CBMLCUEU GY ComStage MSCI Europe Large € 30 -- 0.25 NXESX LN db x-trackers EuroStoxx 50 ETF € 1,491 51 -- N Main X-listings: X024US SW (USD)Main X-listings: XESX IM (EUR), XESX SW (CHF) ETFEULC GY ETFlab MSCI Europe Large Cap € 29 201 0.30 NSXXPIEX IM iShares Stoxx Europe 600 DE € 1,371 600 0.21 N ETFEUAC GY ETFlab MSCI Europe € 29 50 0.30 NETFSX5E GY ETFlab EuroStoxx 50 € 1,243 50 0.15 N SDJE5D GY Source - EuroStoxx 50 Source € 28 50 0.15 NIMEU LN iShares MSCI Europe € 1,109 390 0.35 N EMUEUI SW UBS-ETF MSCI EMU I € 28 274 0.18 NMain X-listings: IMEU NA (EUR), IMEU SW (CHF) CBSX5TS GY ComStage EuroStoxx 50 Short TR € 25 -- 0.35 NXMEU IM db x-trackers MSCI Europe TR € 1,031 467 0.30 N Main X-listings: CBSX5TS SW (CHF)Main X-listings: XMEU SP (USD), XMEU LN (GBP), XMEU SS (SEK) EUREUI SW UBS-ETF MSCI Europe I € 25 476 0.18 NMEU FP Lyxor ETF MSCI Europe € 1,013 467 0.35 N SMEA LN iShares MSCI Europe Acc € 24 399 0.35 NXESC IM db x-trackers EuroStoxx 50 1C € 784 50 0.74 N Main X-listings: IMAE NA (EUR)Main X-listings: XESC LN (GBP), XESC SW (CHF), XESC SS (SEK) LCXPEX GY iShares Stoxx Europe Large 200 DE € 24 200 0.21 NEUN LN iShares Stoxx Europe 50 € 744 50 0.35 N C054 GY ComStage ETF EuroStoxx 50 F € 24 -- 0.15 NMain X-listings: EUN IM (EUR), EUN SW (CHF) Main X-listings: C054 SW (CHF)CSEMU SW CSETF on MSCI EMU € 668 270 0.33 N GXW FP iShares Stoxx EU Enlarged 15 DE € 22 15 0.52 NMain X-listings: CEU1 LN (GBP) C6E FP Amundi ETF Stoxx Europe 600 € 20 -- 0.18 NIEUX LN iShares MSCI Europe ex UK € 663 351 0.40 N HMEU LN HSBC MSCI Europe ETF € 20 364 0.30 NMain X-listings: IEUX NA (EUR), IEUX SW (CHF) Main X-listings: HEU FP (EUR), HMEU SW (USD)XSX6 IM db x-trackers Stoxx Europe 600 € 629 601 0.20 N CLE FP Amundi Leveraged MSCI Europe € 17 -- 0.35 NMain X-listings: XSX6 LN (GBP), XSX6 SW (CHF) C5L FP Amundi Leveraged EuroStoxx 50 € 17 -- 0.30 NSDJE50 GY Source - EuroStoxx 50 € 611 50 0.15 N CBSX5EL GY ComStage EuroStoxx 50 Leveraged € 16 -- 0.35 NC50 FP Amundi ETF EuroStoxx 50 € 598 -- 0.15 N Main X-listings: CBSX5EL SW (CHF)CSEMUL SW CSETF on MSCI EMU Large Cap € 596 119 0.54 N RAFISA SJ eRAFI Overall SA ETF € 16 40 2.00 NMain X-listings: CEL1 LN (GBP) LEU2 LN ETFX EuroStoxx 50 Leverage 2x € 15 50 0.40 NSXXEEX IM iShares DJ Euro Stoxx DE € 589 315 0.21 N Main X-listings: LE2P LN (GBP)MFE FP Lyxor ETF MSCI EMU € 488 267 0.35 N CSEU SW CSETF on MSCI Europe € 15 455 0.33 NETD FP EasyETF EuroStoxx 50 € 464 50 0.25 N Main X-listings: CSE1 LN (GBP)GXN FP iShares Stoxx Europe 50 DE € 418 50 0.52 N EUREUA SW UBS-ETF MSCI Europe € 15 470 0.30 NE50EUI SW UBS-ETF EuroStoxx 50 I € 395 52 0.10 N Main X-listings: EURGBA SW (GBP), EURSKA SS (SEK)
Broad BasedCountry
Broad Based
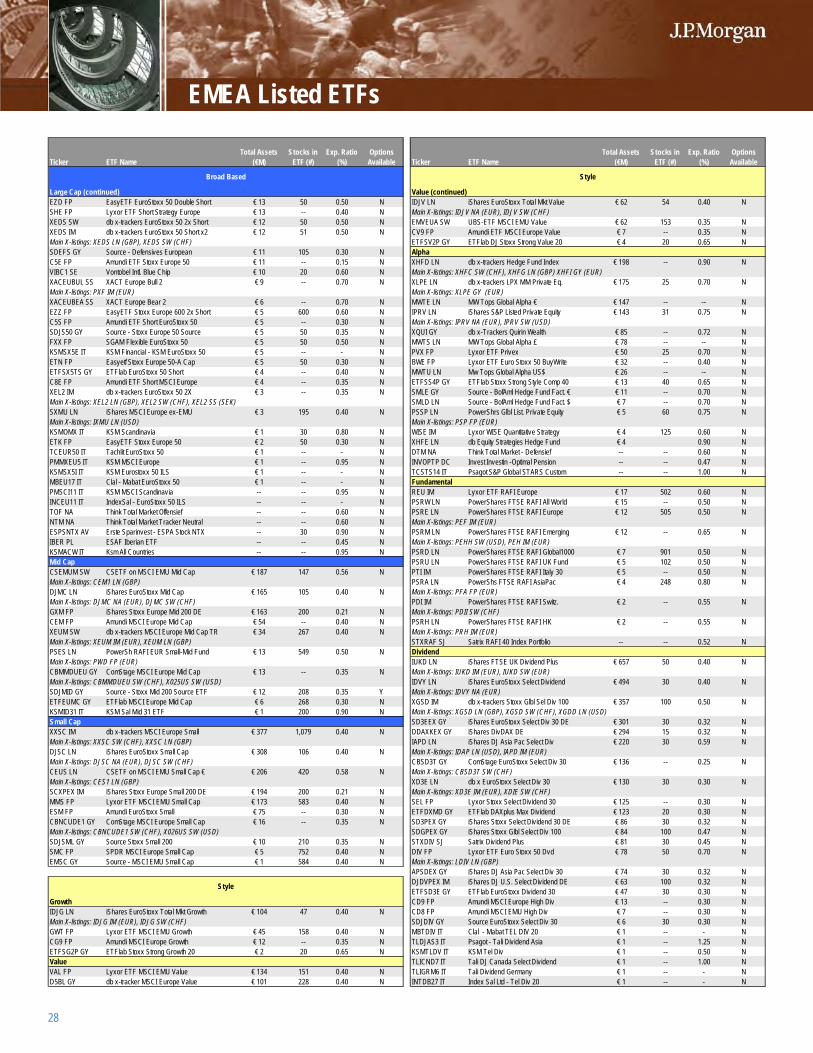
28
EMEA Listed ETFs
Ticker ETF NameTotal Assets
(€M)Stocks in
ETF (#)Exp. Ratio
(%)Options
Available Ticker ETF NameTotal Assets
(€M)Stocks in
ETF (#)Exp. Ratio
(%)Options
Available
Large Cap (continued) Value (continued)EZD FP EasyETF EuroStoxx 50 Double Short € 13 50 0.50 N IDJV LN iShares EuroStoxx Total Mkt Value € 62 54 0.40 NSHE FP Lyxor ETF Short Strategy Europe € 13 -- 0.40 N Main X-listings: IDJV NA (EUR), IDJV SW (CHF)XEDS SW db x-trackers EuroStoxx 50 2x Short € 12 50 0.50 N EMVEUA SW UBS-ETF MSCI EMU Value € 62 153 0.35 NXEDS IM db x-trackers EuroStoxx 50 Short x2 € 12 51 0.50 N CV9 FP Amundi ETF MSCI Europe Value € 7 -- 0.35 NMain X-listings: XEDS LN (GBP), XEDS SW (CHF) ETFSV2P GY ETFlab DJ Stoxx Strong Value 20 € 4 20 0.65 NSDEFS GY Source - Defensives European € 11 105 0.30 N AlphaC5E FP Amundi ETF Stoxx Europe 50 € 11 -- 0.15 N XHFD LN db x-trackers Hedge Fund Index € 198 -- 0.90 NVIBC1 SE Vontobel Intl. Blue Chip € 10 20 0.60 N Main X-listings: XHFC SW (CHF), XHFG LN (GBP) XHFI GY (EUR)XACEUBUL SS XACT Europe Bull 2 € 9 -- 0.70 N XLPE LN db x-trackers LPX MM Private Eq. € 175 25 0.70 NMain X-listings: PXF IM (EUR) Main X-listings: XLPE GY (EUR)XACEUBEA SS XACT Europe Bear 2 € 6 -- 0.70 N MWTE LN MW Tops Global Alpha € € 147 -- -- NEZZ FP EasyETF Stoxx Europe 600 2x Short € 5 600 0.60 N IPRV LN iShares S&P Listed Private Equity € 143 31 0.75 NC5S FP Amundi ETF Short EuroStoxx 50 € 5 -- 0.30 N Main X-listings: IPRV NA (EUR), IPRV SW (USD)SDJS50 GY Source - Stoxx Europe 50 Source € 5 50 0.35 N XQUI GY db x-Trackers Quirin Wealth € 85 -- 0.72 NFXX FP SGAM Flexible EuroStoxx 50 € 5 50 0.50 N MWTS LN MW Tops Global Alpha £ € 78 -- -- NKSMSX5E IT KSM Financial - KSM EuroStoxx 50 € 5 -- - N PVX FP Lyxor ETF Privex € 50 25 0.70 NETN FP Easyetf Stoxx Europe 50-A Cap € 5 50 0.30 N BWE FP Lyxor ETF Euro Stoxx 50 BuyWrite € 32 -- 0.40 NETFSX5TS GY ETFlab EuroStoxx 50 Short € 4 -- 0.40 N MWTU LN Mw Tops Global Alpha US$ € 26 -- -- NC8E FP Amundi ETF Short MSCI Europe € 4 -- 0.35 N ETFSS4P GY ETFlab Stoxx Strong Style Comp 40 € 13 40 0.65 NXEL2 IM db x-trackers EuroStoxx 50 2X € 3 -- 0.35 N SMLE GY Source - BofAml Hedge Fund Fact. € € 11 -- 0.70 NMain X-listings: XEL2 LN (GBP), XEL2 SW (CHF), XEL2 SS (SEK) SMLD LN Source - BofAml Hedge Fund Fact. $ € 7 -- 0.70 NSXMU LN iShares MSCI Europe ex-EMU € 3 195 0.40 N PSSP LN PowerShrs Glbl List. Private Equity € 5 60 0.75 NMain X-listings: IXMU LN (USD) Main X-listings: PSP FP (EUR)KSMOMX IT KSM Scandinavia € 1 30 0.80 N WISE IM Lyxor WISE Quantitative Strategy € 4 125 0.60 NETK FP EasyETF Stoxx Europe 50 € 2 50 0.30 N XHFE LN db Equity Strategies Hedge Fund € 4 0.90 NTCEUR50 IT Tachlit EuroStoxx 50 € 1 -- - N DTM NA Think Total Market - Defensief -- -- 0.60 NPMMXEU5 IT KSM MSCI Europe € 1 -- 0.95 N INVOPTP DC Invest Investin -Optimal Pension -- -- 0.47 NKSMSX5I IT KSM Eurostoxx 50 ILS € 1 -- - N TCSTS14 IT Psagot S&P Global STARS Custom -- -- 1.00 NMBEU17 IT Clal - Mabat EuroStoxx 50 € 1 -- - N FundamentalPMSCI11 IT KSM MSCI Scandinavia -- -- 0.95 N REU IM Lyxor ETF RAFI Europe € 17 502 0.60 NINCEU11 IT IndexSal - EuroStoxx 50 ILS -- -- - N PSRW LN PowerShares FTSE RAFI All World € 15 -- 0.50 NTOF NA Think Total Market Offensief -- -- 0.60 N PSRE LN PowerShares FTSE RAFI Europe € 12 505 0.50 NNTM NA Think Total Market Tracker Neutral -- -- 0.60 N Main X-listings: PEF IM (EUR)ESPSNTX AV Erste Sparinvest - ESPA Stock NTX -- 30 0.90 N PSRM LN PowerShares FTSE RAFI Emerging € 12 -- 0.65 NIBER PL ESAF Iberian ETF -- -- 0.45 N Main X-listings: PEHH SW (USD), PEH IM (EUR)KSMACW IT Ksm All Countries -- -- 0.95 N PSRD LN PowerShares FTSE RAFI Global1000 € 7 901 0.50 NMid Cap PSRU LN PowerShares FTSE RAFI UK Fund € 5 102 0.50 NCSEMUM SW CSETF on MSCI EMU Mid Cap € 187 147 0.56 N PTI IM PowerShares FTSE RAFI Italy 30 € 5 -- 0.50 NMain X-listings: CEM1 LN (GBP) PSRA LN PowerShs FTSE RAFI AsiaPac € 4 248 0.80 NDJMC LN iShares EuroStoxx Mid Cap € 165 105 0.40 N Main X-listings: PFA FP (EUR)Main X-listings: DJMC NA (EUR), DJMC SW (CHF) PDI IM PowerShares FTSE RAFI Switz. € 2 -- 0.55 NGXM FP iShares Stoxx Europe Mid 200 DE € 163 200 0.21 N Main X-listings: PDII SW (CHF)CEM FP Amundi MSCI Europe Mid Cap € 54 -- 0.40 N PSRH LN PowerShares FTSE RAFI HK € 2 -- 0.55 NXEUM SW db x-trackers MSCI Europe Mid Cap TR € 34 267 0.40 N Main X-listings: PRH IM (EUR)Main X-listings: XEUM IM (EUR), XEUM LN (GBP) STXRAF SJ Satrix RAFI 40 Index Portfolio -- -- 0.52 NPSES LN PowerSh RAFI EUR Small-Mid Fund € 13 549 0.50 N DividendMain X-listings: PWD FP (EUR) IUKD LN iShares FTSE UK Dividend Plus € 657 50 0.40 NCBMMDUEU GY ComStage MSCI Europe Mid Cap € 13 -- 0.35 N Main X-listings: IUKD IM (EUR), IUKD SW (EUR)Main X-listings: CBMMDUEU SW (CHF), X025US SW (USD) IDVY LN iShares EuroStoxx Select Dividend € 494 30 0.40 NSDJMID GY Source - Stoxx Mid 200 Source ETF € 12 208 0.35 Y Main X-listings: IDVY NA (EUR)ETFEUMC GY ETFlab MSCI Europe Mid Cap € 6 268 0.30 N XGSD IM db x-trackers Stoxx Glbl Sel Div 100 € 357 100 0.50 NKSMID31 IT KSM Sal Mid 31 ETF € 1 200 0.90 N Main X-listings: XGSD LN (GBP), XGSD SW (CHF), XGDD LN (USD)Small Cap SD3EEX GY iShares EuroStoxx Select Div 30 DE € 301 30 0.32 NXXSC IM db x-trackers MSCI Europe Small € 377 1,079 0.40 N DDAXKEX GY iShares DivDAX DE € 294 15 0.32 NMain X-listings: XXSC SW (CHF), XXSC LN (GBP) IAPD LN iShares DJ Asia Pac Select Div € 220 30 0.59 NDJSC LN iShares EuroStoxx Small Cap € 308 106 0.40 N Main X-listings: IDAP LN (USD), IAPD IM (EUR)Main X-listings: DJSC NA (EUR), DJSC SW (CHF) CBSD3T GY ComStage EuroStoxx Select Div 30 € 136 -- 0.25 NCEUS LN CSETF on MSCI EMU Small Cap € € 206 420 0.58 N Main X-listings: CBSD3T SW (CHF)Main X-listings: CES1 LN (GBP) XD3E LN db x EuroStoxx Select Div 30 € 130 30 0.30 NSCXPEX IM iShares Stoxx Europe Small 200 DE € 194 200 0.21 N Main X-listings: XD3E IM (EUR), XDIE SW (CHF)MMS FP Lyxor ETF MSCI EMU Small Cap € 173 583 0.40 N SEL FP Lyxor Stoxx Select Dividend 30 € 125 -- 0.30 NESM FP Amundi EuroStoxx Small € 75 -- 0.30 N ETFDXMD GY ETFlab DAXplus Max Dividend € 123 20 0.30 NCBNCUDE1 GY ComStage MSCI Europe Small Cap € 16 -- 0.35 N SD3PEX GY iShares Stoxx Select Dividend 30 DE € 86 30 0.32 NMain X-listings: CBNCUDE1 SW (CHF), X026US SW (USD) SDGPEX GY iShares Stoxx Glbl Select Div 100 € 84 100 0.47 NSDJSML GY Source Stoxx Small 200 € 10 210 0.35 N STXDIV SJ Satrix Dividend Plus € 81 30 0.45 NSMC FP SPDR MSCI Europe Small Cap € 5 752 0.40 N DIV FP Lyxor ETF Euro Stoxx 50 Dvd € 78 50 0.70 NEMSC GY Source - MSCI EMU Small Cap € 1 584 0.40 N Main X-listings: LDIV LN (GBP)
APSDEX GY iShares DJ Asia Pac Select Div 30 € 74 30 0.32 NDJDVPEX IM iShares DJ U.S. Select Dividend DE € 63 100 0.32 NETFSD3E GY ETFlab EuroStoxx Dividend 30 € 47 30 0.30 N
Growth CD9 FP Amundi MSCI Europe High Div € 13 -- 0.30 NIDJG LN iShares EuroStoxx Total Mkt Growth € 104 47 0.40 N CD8 FP Amundi MSCI EMU High Div € 7 -- 0.30 NMain X-listings: IDJG IM (EUR), IDJG SW (CHF) SDJDIV GY Source EuroStoxx Select Div 30 € 6 30 0.30 NGWT FP Lyxor ETF MSCI EMU Growth € 45 158 0.40 N MBTDIV IT Clal - Mabat TEL DIV 20 € 1 -- - NCG9 FP Amundi MSCI Europe Growth € 12 -- 0.35 N TLDJAS3 IT Psagot - Tali Dividend Asia € 1 -- 1.25 NETFSG2P GY ETFlab Stoxx Strong Growth 20 € 2 20 0.65 N KSMTLDV IT KSM Tel Div € 1 -- 0.50 NValue TLICND7 IT Tali DJ Canada Select Dividend € 1 -- 1.00 NVAL FP Lyxor ETF MSCI EMU Value € 134 151 0.40 N TLIGRM6 IT Tali Dividend Germany € 1 -- - ND5BL GY db x-tracker MSCI Europe Value € 101 228 0.40 N INTDB27 IT Index Sal Ltd - Tel Div 20 € 1 -- - N
Style
Style
Broad Based

29
EMEA Listed ETFs
Ticker ETF NameTotal Assets
(€M)Stocks in
ETF (#)Exp. Ratio
(%)Options
Available Ticker ETF NameTotal Assets
(€M)Stocks in
ETF (#)Exp. Ratio
(%)Options
Available
Dividend (continued) Theme (continued)TSD3E12 IT Tali EuroStoxx Select Div 30 € 1 -- 1.00 N XSHJ LN db x-trackers S&P Japan 500 Shariah € 5 169 0.50 NKSMDJDVP IT KSM - US Dividend € 1 -- 1.00 N Main X-listings: XSHJ GY (EUR)TLSDGV9 IT Psagot Stoxx Glbl Select Div 100 € 1 -- 1.00 N XSHE LN db x-trackers S&P Eur 350 Shariah € 5 98 0.50 NTDJDVP7 IT Psagot DJ U.S. Select Dividend € 1 -- - N Main X-listings: XSHE GY (EUR)TDJSD13 IT Tali Dow Jones Japan Select Div 30 € 1 -- 1.20 N XIMT LN db x-trackers Islamic Titans 100 € 4 100 0.50 NTLASTR8 IT Psagot Australia Select Dividend 30 € 1 -- 1.00 N NFSH40 SJ NewFunds Shariah Top 40 € 4 21 0.80 NTLSD2G4 IT Tali Dividend Scandinavia -- -- 1.10 N TDJTEN6 IT Tali Dow Jones Oil & Gas Titans 30 € 1 -- - NTLSD2G4 IT Tali Dividend Scandinavia -- -- 1.10 N DJIMT TI Dow Jones Islamic Market Turkey € 1 32 0.11 NTLTDB10 IT Tali Tel-Aviv 20 Dividend -- -- 0.50 N KSMDJWA IT KSM Water € 1 38 1.00 NKSMSDGL IT KSM Global Dividend -- -- 1.00 N VolatilityKSMSD3E IT KSM Euro Dividend -- -- N VSXG LN Ipath Vstoxx Short-Term Fut € 37 -- 0.89 NHTD2017 IT Harel Sal Tel-Div Index -- -- 0.50 N Main X-listings: VSXX GY (EUR)Socially Responsible VIXS LN Source S&P 500 VIX Short-Term € 18 -- 0.60 NINRG LN iShares S&P Global Clean Energy € 116 30 0.65 N XVOL GY db x-trackers € Int Rates Volatility € 9 -- 0.25 NMain X-listings: INRG IM (EUR), DNRG LN (USD) VXIS LN iPath S&P 500 VIX Short-Term € 8 -- 0.89 NSUBEEX GY iShares EuroStoxx Sustainability 40 € 112 40 0.42 N Main X-listings: VXIS GY (EUR)ECN FP EasyETF Low Carbon 100 Eur € 55 -- 0.60 N VXIM LN iPath S&P 500 VIX Mid-Term € 7 -- 0.89 N3551B FP EasyETN Global Energy Efficiency € 42 -- -- N Main X-listings: VXIM GY (EUR)EEVEUR FP EasyETF FTSE ET50 Environment € 20 51 0.45 N XVLS GY db x € Int Rates Volatility Short € 6 -- 0.25 NPSBW LN PowerShares Global Clean Energy € 8 95 0.75 N VSXY IM iPath Vstoxx Mid-Term Future € 4 -- 0.89 NMain X-listings: PBW IM (EUR)OCS LN Osmosis Climate Solutions € 7 100 0.70 NAWWF FP Amundi ETF Green Tech € 5 -- 0.45 NXGED GY db x-trackers Glbl Fund Supporters € 4 -- 0.25 N Consumer DiscretionaryCSAE SW CSETF on Global Aternative Energy € 2 -- 0.65 N XAPS GY Source Stoxx 600 Opt. Auto&Parts € 213 14 0.30 YMain X-listings: CSAE IM (EUR), CAE1 LN (GBP) AUT FP Lyxor ETF Stoxx 600 Auto & Parts € 49 -- 0.30 NMTIEC12 IT Clal - Mabat Indx ECO12 -- -- - N XRPS GY Source Stoxx 600 Opt Retail € 49 25 0.30 NXGRC IM db x-trackers S&P US Carbon -- 362 0.50 N XMPS GY Source Stoxx 600 Opt Media € 40 27 0.30 NMain X-listings: XGRC LN (GBP), XGRD LN (USD) TRV FP Lyxor Stoxx 600 Travel & Leisure € 40 23 0.30 NNRJ FP Lyxor New Energy € 83 20 0.60 N MDA FP Lyxor Stoxx Europe 600 Media € 35 28 0.30 NALTE IM ETFX DAX Glob. Alt. Energy Fund € 14 15 0.65 N SXAPEX GY iShares Stoxx 600 Autos & Parts € 35 14 0.52 NMain X-listings: ALTP LN (GBP) RTA FP Lyxor Stoxx Europe 600 Retail € 29 25 0.30 NKSMCLNT IT KSM Financial - KSM Cleantech € 1 -- 1.00 N CD6 FP Amundi ETF MSCI Europe C. Disc € 19 -- 0.25 NTheme AUTX FP Lyxor Stoxx 600 Auto & Parts Short € 18 -- 0.45 NINFR LN iShares Macquarie Glbl Infr. 100 € 252 100 0.65 N DISW IM Lyxor MSCI World C.Discretion € 17 242 0.45 NMain X-listings: IDIN LN (USD), INFR IM (EUR) STR FP SPDR MSCI Europe Cons. Disc € 17 63 0.30 NGOLDA IM Market Access AMEX Gold Bugs € 200 -- 0.70 N XTPS GY Source Stoxx 600 Opt Travel & Les € 16 21 0.30 NMain X-listings: MAGB SW (USD), GOLB LN (GBP) CBSXAR GY ComStage Stoxx 600 Auto & Parts € 13 -- 0.25 NXSGI IM db x-trackers S&P Glbl Infrastruct. € 197 74 0.60 N Main X-listings: CBSXAR SW (CHF)Main X-listings: XGID LN (USD), XSG1 SW (CHF), XSGI LN (GBP) SXRPEX GY iShares Stoxx Europe 600 Retail DE € 12 25 0.52 NIEMI LN iShares S&P EM Infrastructure € 182 30 0.74 N CBSXMR GY ComStage Stoxx Europe 600 Media € 12 -- 0.25 NMain X-listings: DEIN LN (USD), IEMI IM (EUR) Main X-listings: CBSXMR SW (CHF)IH2O LN iShares S&P Global Water 50 € 150 50 0.65 N CBSXRR GY ComStage Stoxx Europe 600 Retail € 12 -- 0.25 NMain X-listings: IH2O IM (EUR), DH20 LN (USD) Main X-listings: CBSXRR SW (CHF)NUKE LN ETFS WNA Global Nuclear Energy € 107 65 0.65 N SXMPEX GY iShares Stoxx Europe 600 Media € 10 28 0.53 NMain X-listings: NUKE NA (EUR) CBSXTR GY ComStage Stoxx 600 Travel & Leis. € 10 -- 0.25 NEAGEUR FP EasyETF S-Box Global Agribusiness € 70 30 0.60 N Main X-listings: CBSXTR SW (CHF)WAT FP Lyxor ETF World Water € 62 20 0.60 N SXTPEX GY iShares Stoxx 600 Travel & Leisure DE € 9 22 0.53 NAUCO LN ETFX DAXGlobal Gold Mining € 61 20 0.65 N SYA FP EasyETF Euro Automobile € 7 14 0.30 NMain X-listings: AUCO NA (EUR) SXRREX GY iShares Stoxx 600 Retail Swap DE € 7 25 0.32 NAGRP LN ETFX S-Net ITG Glbl Agri Business € 61 30 0.65 N SYM FP EasyETF Euro Media € 6 28 0.30 NMain X-listings: AGRI IM (EUR), AGRI LN (USD) 3297B FP EasyETN World Luxury ETN € 6 -- -- NWOOD LN iShares S&P Gl. Timber & Forestry € 54 25 0.65 N SXAREX IM iShares Stoxx Autos & Parts Swap € 5 14 0.32 NMain X-listings: WOOD IM (EUR), DWOD LN (USD) GXK FP iShares Stoxx 600 Media Swap EX € 4 28 0.32 NISWD LN iShares MSCI World Islamic Fund € 35 281 0.60 N GXZ FP iShares Stoxx Travel & Leisure Swap DE € 3 22 0.32 NMain X-listings: ISDW LN (USD), IUSD GY (EUR) SCYCS GY Source - Cyclicals European Source € 2 329 0.30 NSHPP LN ETFX DAX Global Shipping Fund € 29 28 0.65 N XLYS LN Source C. Disc S&P US Sector € 1 83 0.30 NMain X-listings: SHIP IM (EUR), SHIP LN (USD) SCODS GY Source - Consumer Discretionary € 1 85 0.30 N3903B FP EasyETN Emerging Infrastructure € 28 -- -- N Consumer Staples3902B FP EasyETN Global Infrastructure ETN € 27 -- -- N PHG FP Lyxor Stoxx Pers & HHold Goods € 148 27 0.30 NPSGA LN PowerShrs Global Agriculture OMX € 26 40 0.75 N IND FP Lyxor Stoxx 600 Ind Goods & Svcs € 76 93 0.30 NMain X-listings: PSU FP (EUR), PSUU SW (USD) FOO IM Lyxor Stoxx 600 Food & Beverage € 68 28 0.30 NISEM LN iShares MSCI EM Islamic Fund € 25 204 0.85 N XS3R GY db x-trackers Stoxx 600 Food & Bev € 56 28 0.30 NMain X-listings: ISDE LN (USD), ISEM NA (EUR) Main X-listings: XS3R LN (GBP)ENG FP EasyETF NMX30 Glbl Infra € 21 30 0.50 N X3PS GY Source Stoxx 600 Opt Fd & Bev € 54 26 0.30 NCD91 GY ComStage ETF Gold Bugs € 18 -- 0.65 N XQPS GY Source Stoxx 600 Opt Pers & Hhold Goods € 37 27 0.30 NMain X-listings: CD91 SW (CHF) STS FP SPDR MSCI Europe C. Staples € 34 38 0.30 NCOAP LN ETFX Dax Global Coal Mining € 18 21 0.65 N SX3PEX GY iShares Stoxx 600 Food & Bevs DE € 33 28 0.52 NMain X-listings: COAL LN (USD), COAL IM (EUR) CBSX3R GY ComStage Stoxx 600 Food & Bev € 29 -- 0.25 NETI SW EasyETF DJ Islamic Titans 100 € 13 100 0.50 N Main X-listings: CBSX3R SW (CHF)XECD GY db x-trackers Stoxx Christian ETF € 10 -- 0.40 N STAA LN Lyxor MSCI Asia Ex JP Cons Staples € 28 36 0.65 NPSHO LN PowerShares Palisades Global Water € 7 29 0.75 N SXQREX IM iShares Stoxx 600 P&HG Swap DE € 25 27 0.32 NMain X-listings: PIO IM (EUR) SX3REX GY iShares Stoxx 600 Food & Bev Swap € 24 28 0.32 NLWAT LN Lyxor ETF World Water (TR) € 7 -- 0.60 N CS5 FP Amundi ETF MSCI Eur C. Staples € 21 -- 0.25 NMain X-listings: LWAU LN (USD) SXQPEX GY iShares Stoxx 600 P&HG DE € 19 27 0.52 NWATP LN ETFS Janney Global Water Fund € 6 60 0.65 N COSW FP Lyxor MSCI World Cons Staple € 15 -- 0.45 NMain X-listings: WATE LN (USD), WATE IM (EUR) CBSXQR GY ComStage Stoxx 600 P&HG TR € 14 -- 0.25 NXSHU LN db x-trackers S&P 500 Shariah € 6 221 0.50 N Main X-listings: CBSXQR SW (CHF)Main X-listings: XSHU GY (EUR) COSA FP Lyxor MSCI Asia Ex JP C.Staples € 13 37 0.65 N
Style Style
Sector Funds

30
EMEA Listed ETFs
Ticker ETF NameTotal Assets
(€M)Stocks in
ETF (#)Exp. Ratio
(%)Options
Available Ticker ETF NameTotal Assets
(€M)Stocks in
ETF (#)Exp. Ratio
(%)Options
Available
Consumer Staples (continued) Financials (continued)STAW LN Lyxor MSCI World Cons Staples € 12 125 0.45 N RAFFIN SJ NewFunds eRAFI SA Financial 15 € 3 16 1.70 NXIGS LN db x Stoxx 600 Ind Goods Short € 7 93 0.50 N MBTGBN IT Clal - Mabat TA-Banks € 2 -- - NMain X-listings: XIGS IM (EUR) KSMFN15 IT KSM TA Financials € 1 15 0.50 NXLPS LN Source C. Staples S&P US Sector € 2 41 0.30 N MBTGSBN IT Clal - Mabat TA-Banks Short € 1 -- - NSCOSS GY Source Consumer Staples European € 2 47 0.30 N HQFINANS SS Carnegie Finans ETF € 1 -- 0.40 NEnergy INDXBN4 IT IndexSal Index Banks € 1 -- - NOIL FP LYXOR Stoxx 600 Oil & Gas € 274 -- 0.30 Y HRLBNK IT Harel Sal TA Banks € 1 5 0.50 NXEPS GY Source Stoxx 600 Opt Oil & Gas € 258 32 0.30 Y TCMR12 IT Tachlit Double Short T.A. Bank € 1 -- - NXSER LN db x-trackers Stoxx 600 Oil & Gas € 184 34 0.30 N KSMDJBK IT KSM Dow Jones Banks € 1 -- 1.00 NMain X-listings: XSER IM (EUR), XSER SS (SEK) IFN1560 IT IndexSal - Index Finn15 60 € 1 -- - NSXEPEX GY iShares Stoxx Europe 600 Oil & Gas € 165 34 0.52 N KSHORTBK IT KSM Short TA Banks -- -- - NCBSXER GY ComStage ETF Stoxx 600 Oil & Gas € 54 -- 0.25 N MBTF151 IT Clal - Mabat Finance 15 -- -- - NMain X-listings: CBSXER SW (CHF) TGTAB33 IT Tachlit Short TA Banks -- -- - NSYE FP EasyETF Stoxx 600 Oil & Gas € 42 34 0.30 N INBNK45 IT IndexSal - Index Ta Bank45 -- -- - NNRGW LN Lyxor MSCI World Energy - $ € 40 114 0.45 N KSRTBKX2 IT KSM SHORT TA Banks X2 daily -- 5 1.50 NMain X-listings: NRGG LN (GBP) Health CareSTN FP SPDR MSCI Europe Energy € 38 25 0.30 N HLT FP Lyxor Stoxx 600 Health Care € 171 35 0.30 NGXG FP iShares Stoxx 600 Oil & Gas Swap € 28 34 0.32 N SXDPEX GY iShares Stoxx 600 Health Care DE € 150 35 0.52 NANRJ FP Amundi ETF Europe Energy € 28 -- 0.25 N XSDR IM db x-trackers Stoxx 600 Health Care € 117 35 0.30 NXLES LN Source US Energy Sector ETF € 20 40 0.30 N Main X-listings: XSDR LN (GBP)ENERW IM Lyxor World Energy € 19 114 0.45 N XDPS GY Source Stoxx 600 Opt Hcare € 87 34 0.30 NCWE FP Amundi MSCI World Energy € 17 -- 0.35 N CBSXDR GY ComStage Stoxx 600 Health Care € 58 -- 0.25 NMain X-listings: CWEUSD SW (USD) Main X-listings: CBSXDR SW (CHF)OILX FP Lyxor Stoxx 600 Oil & Gas Short € 11 -- 0.45 N STW FP SPDR MSCI Europe Health Care € 49 32 0.30 NXOS FP db x Stoxx 600 Oil & Gas Short € 7 34 0.50 N GXH FP iShares Stoxx 600 Health Care Swap DE € 28 35 0.32 NMain X-listings: XSES LN (GBP), XSES SS (SEK) CH5 FP Amundi MSCI Europe Healthcare € 21 -- 0.25 NOILS LN ETFX Stoxx 600 Oil & Gas € 5 33 0.30 N SYH FP EasyETF Euro Healthcare € 17 35 0.30 NMain X-listings: OILG NA (EUR) HLTW IM Lyxor MSCI World Health Care € 16 -- 0.45 NFPETRO AB Falcom Petrochemical ETF € 3 14 0.50 N SXDEEX GY iShares EuroStoxx Health Care DE € 13 14 0.53 NXACTENER SS XACT Nordic Energy € 2 -- 0.50 N HLTW LN Lyxor MSCI World Health C-$ € 12 118 0.45 NKSMENG IT KSM Financial - KSM Energy € 1 -- - N Main X-listings: HLTG LN (GBP)BULLOOSX NO Bulloilserviceh -- -- -- N XSDS LN db x-trackers Stoxx 600 Hcare Short € 4 35 0.50 NBEAROOSX NO Bearoilserviceh -- -- -- N Main X-listings: XDS FP (EUR)Financials XACTLAKE SS XACT Nordic Health Care € 3 -- 0.50 NBNK FP Lyxor Stoxx 600 Banks € 465 -- 0.30 Y XLVS LN Source H.Care S&P US Sector € 2 52 0.30 NXS7R IM db x-trackers Stoxx 600 Banks € 357 53 0.30 N KSMDJHC IT KSM Health Care € 1 -- 1.00 NMain X-listings: XS7R LN (GBP), XS7R SS (SEK) IndustrialsSX7PEX GY iShares Stoxx Europe 600 Banks DE € 305 52 0.52 N XNPS GY Source Stoxx 600 Opt Ind Gds&Svcs € 162 91 0.30 YSX7EEX GY iShares EuroStoxx Banks DE € 255 35 0.52 N XSNR LN db x-trackers Stoxx 600 Ind Goods € 67 93 0.30 NXS7S GY db x-trackers Stoxx 600 Banks Short € 241 53 0.50 N Main X-listings: XSNR IM (EUR)Main X-listings: XS7S LN (GBP), XS7S SS (SEK) SXNREX IM iShares Stoxx IndGds&Svcs Swap € 50 93 0.32 NXIPS GY Source Stoxx 600 Opt Insurance € 240 32 0.30 Y SXNPEX GY iShares Stoxx 600 Ind Gds&Svcs DE € 48 93 0.52 NX7PS GY Source Stoxx 600 Opt Banks € 235 43 0.30 Y STQ FP SPDR MSCI Europe Industrials € 23 88 0.30 NSTXFIN SJ Satrix FINI € 183 16 0.45 N CBSXNR GY ComStage Stoxx 600 Ind Gds & Svcs € 22 -- 0.25 NINS FP Lyxor ETF Stoxx 600 Insurance € 182 33 0.30 N Main X-listings: CBSXNR SW (CHF)STZ FP SPDR MSCI Europe Financials € 107 113 0.30 N CIN FP Amundi ETF MSCI Europe Inds € 20 -- 0.25 NSXIPEX GY iShares Stoxx 600 Insurance DE € 94 33 0.52 N INDW FP Lyxor MSCI World Industrials € 17 265 0.45 NXFPS GY Source Stoxx 600 Opt Fin Services € 64 25 0.30 N IFRA FP Lyxor MSCI Asia Ex Japan Infrastr € 15 48 0.65 NCBSX7R GY ComStage ETF Stoxx 600 Banks TR € 60 -- 0.25 N XACTVERK SS XACT Nordic Industrials € 5 -- 0.50 NMain X-listings: CBSX7R SW (CHF) RAFIND SJ NewFunds eRAFI SA Industrial 25 € 3 27 1.71 NCBSXIR GY ComStage ETF Stoxx 600 Insurance € 50 -- 0.25 N XLIS LN Source Industrials S&P US Sector € 3 58 0.30 NMain X-listings: CBSXIR SW (CHF) STXIND SJ Satrix INDI € 3 27 0.45 NSYI FP EasyETF Euro Insurance € 42 33 0.30 N AA1FM4 GY RBS S&P Cons & Eng Infrastr Index ETN -- -- - NCBSXFR GY ComStage ETF Stoxx 600 Fin Svcs € 39 -- 0.25 N MaterialsMain X-listings: CBSXFR SW (CHF) BRE FP Lyxor Stoxx 600 Basic Resources € 308 -- 0.30 YXSIR LN db x-trackers Stoxx 600 Insurance € 38 33 0.30 N SXPPEX GY iShares Stoxx 600 Basic Res DE € 283 31 0.52 NMain X-listings: XSIR IM (EUR) XSPR IM db x-trackers Stoxx 600 Basic Res € 149 31 0.30 NSYB FP EasyETF Euro Bank € 36 53 0.30 N Main X-listings: XSPR LN (GBP)XLFS LN US Financials Sector ETF € 35 81 0.30 N XPPS GY Source Stoxx 600 Opt Basic Res € 141 30 0.30 YBNKX FP Lyxor Stoxx 600 Banks Short € 33 -- 0.45 N XOPS GY Source Stoxx 600 Opt Const & Mat € 83 24 0.30 YCB5 FP Amundi MSCI Europe Banks € 25 -- 0.25 N CBSXPR GY ComStage Stoxx 600 Basic Res TR € 68 -- 0.25 NSXFPEX GY iShares Stoxx 600 Fin. Services DE € 23 30 0.52 N Main X-listings: CBSXPR SW (CHF)FINS IM Lyxor Stoxx 600 Financial Services € 22 30 0.30 N CST FP Lyxor Stoxx 600 Cons & Mats € 62 27 0.30 NCI5 FP Amundi MSCI Europe Insurance € 20 -- 0.25 N SXPREX IM iShares Stoxx 600 Basic Res Swap € 55 31 0.32 NGXX FP iShares Stoxx 600 Insurance Swap € 16 33 0.32 N CHM FP Lyxor Stoxx 600 Chemicals € 52 22 0.30 NFINSW IM Lyxor MSCI World Financials € 16 -- 0.45 N STXRES SJ Satrix RESI € 34 22 0.45 NMain X-listings: FINW LN (USD) STP FP SPDR MSCI Europe Materials € 33 51 0.30 NCWF FP Amundi MSCI World Financials € 12 -- 0.35 N CBSX4R GY ComStage Stoxx 600 Chemicals TR € 29 -- 0.25 NMain X-listings: CWFUSD SW (USD) Main X-listings: CBSX4R SW (CHF)SX7REX IM iShares Stoxx 600 Banks Swap EX € 10 52 0.32 N SYC FP EasyETF Euro Construction € 26 27 0.30 NCWF FP Amundi MSCI World Financials € 12 -- 0.35 N CBSXOR GY ComStage Stoxx 600 Constr & Mats TR € 25 -- 0.25 NMain X-listings: CWFUSD SW (USD) Main X-listings: CBSXOR SW (CHF)SX7REX IM iShares Stoxx 600 Banks Swap EX € 10 52 0.32 N SX4PEX GY iShares Stoxx 600 Chemicals DE € 25 23 0.52 NGXF FP iShares Stoxx 600 Fin Services Swap € 6 30 0.32 N SXOPEX GY iShares Stoxx 600 Cons & Mats DE € 21 27 0.52 NXSIS GY db x-trackers Stoxx 600 Ins. Short € 5 33 0.50 N X4PS GY Source Stoxx 600 Opt Chemicals € 21 22 0.30 NKSMTABK IT KSM Financial - KSM TA Banks € 5 5 0.50 N C8M FP Amundi MSCI Europe Materials € 19 -- 0.25 NTLTABN5 IT Psagot - Tali Bank € 3 -- 0.45 N MATW FP Lyxor MSCI World Materials TR € 18 160 0.45 NXACTBANK SS XACT Bank & Insurance € 3 -- 0.50 N Main X-listings: MATW LN (USD), MATG LN (GBP)TCBNK IT Tachlit TA Banks € 3 -- 0.50 N
Sector Funds Sector Funds

31
EMEA Listed ETFs
Ticker ETF NameTotal Assets
(€M)Stocks in
ETF (#)Exp. Ratio
(%)Options
Available Ticker ETF NameTotal Assets
(€M)Stocks in
ETF (#)Exp. Ratio
(%)Options
Available
Materials (continued) Technology (continued)MATA FP Lyxor MSCI Asia Ex Japan Material € 16 -- 0.65 N CI6 FP Amundi MSCI Europe IT € 20 -- 0.25 NMain X-listings: MATA LN (USD) TNOW IM Lyxor MSCI World Info Tech € 17 147 0.45 NSX4REX IM iShares Stoxx 600 Chemicals Swap € 15 23 0.32 N Main X-listings: TNOW LN (USD), TNOG LN (GBP)MATW LN Lyxor MSCI World Materials € 12 163 0.45 N STK FP SPDR MSCI Europe Technology € 9 17 0.30 NBREX FP Stoxx Eur 600 Resources Shrt € 12 -- 0.45 N XS8S GY db x-trackers Stoxx 600 Tech Short € 7 26 0.50 NBASP LN ETFX Stoxx 600 Basic Resources € 10 26 0.30 N SX8REX IM iShares Stoxx 600 Technology Swap € 6 26 0.32 NMain X-listings: BASR LN (EUR) SYQ FP EasyETF Euro Technology € 1 26 0.30 NSXOREX IM iShares Stoxx 600 Cons & Mats Swap DE € 9 27 0.33 N KSMTEC15 IT KSM Tel Aviv Technology 15 € 1 15 0.90 NRAFRES SJ NewFunds eRAFI SA Resource 20 € 4 21 1.68 N MBT1T15 IT Clal - Mabat TelTech 15 -- -- 0.80 NHQVERKST SS Carnegie Verkstad ETF € 3 -- 0.40 N TelecomXACTBASI SS XACT Nordic Materials € 2 -- 0.50 N TEL FP Lyxor Stoxx 600 Telecom € 231 20 0.30 YXLBS LN Source Materials S&P US Sector € 2 30 0.30 N SXKPEX GY iShares Stoxx 600 Telecom DE € 119 20 0.52 NHQMATERI SS Carnegie Material ETF € 1 -- 0.40 N XKPS GY Source Stoxx 600 Opt Telecom € 78 19 0.30 YNBAGL1 SJ Nb Anglo Stub 27Jul2011 -- -- -- N XSKR LN db x-trackers Stoxx 600 Telecom € 51 20 0.30 NXBRS IM db x Stoxx 600 Basic Res Short -- 31 0.50 N Main X-listings: XSKR IM (EUR)Main X-listings: XBRS LN (GBP) SYT FP EasyETF Euro Telecom € 37 20 0.30 NReal Estate CBSXKR GY ComStage ETF Stoxx 600 Telecom € 35 -- 0.25 NIWDP LN iShares FTSE EPRA Dev Prop Yield € 798 228 0.59 N Main X-listings: CBSXKR SW (CHF)Main X-listings: IDWP LN (USD), IWDP NA (EUR) SXKEEX GY iShares DJ EuroStoxx Telecom DE € 28 11 0.52 NIPRP LN iShares FTSE/EPRA Euro Property € 556 41 0.40 N CT5 FP Amundi MSCI Europe Telecom € 20 -- 0.25 NMain X-listings: IPRP NA (EUR), IPRP SW (CHF) SXKREX IM iShares Stoxx 600 Telecom Swap DE € 20 20 0.32 NIUKP LN iShares FTSE EPRA UK Property € 299 31 0.40 N TELEW IM Lyxor MSCI World Telcoms € 16 -- 0.45 NMain X-listings: IUKP SW (CHF), IUKP IM (EUR) Main X-listings: TELW LN (USD)EEE FP EasyETF FTSE EPRA €zone € 253 40 0.45 N SPYT GY SPDR MSCI Europe Telecom Svcs € 14 22 0.30 NMain X-listings: EEE BQ (KWD) XSKS LN db x-trackers Stoxx 600 Telco Short € 4 20 0.50 NIASP LN iShares FTSE EPRA Asia Prop Yield € 200 59 0.59 N Main X-listings: XKS FP (EUR)Main X-listings: IDAR LN (USD), IASP NA (EUR) UtilitiesEEP FP EasyETF FTSE EPRA Europe € 180 82 0.45 N UTI FP Lyxor ETF Stoxx 600 Utilities € 152 31 0.30 NXDER LN db x-trackers FTSE EPRA Europe € 176 82 0.40 N SX6PEX GY iShares Stoxx 600 Utilities DE € 145 31 0.52 NMain X-listings: XDER IM (EUR) XS6R LN db x-trackers Stoxx 600 Utilities € 129 31 0.30 NIUSP LN iShares FTSE EPRA US Prop Yield € 164 88 0.40 N Main X-listings: XS6R IM (EUR)Main X-listings: IDUP LN (USD), IUSP IM (EUR) X6PS GY Source Stoxx 600 Opt Utilities € 125 29 0.30 YSRECHI SW UBS-ETF SXI Real Estate (Chf)-I € 47 20 0.20 N CBSX6R GY ComStage Stoxx 600 Utilities TR € 53 -- 0.25 NSRECHA SW UBS-IS SWX Immobilienfonds € 41 20 0.36 N Main X-listings: CBSX6R SW (CHF)SREEEX GY iShares Stoxx 600 Real Estate DE € 35 21 0.47 N SYU FP EasyETF Euro Utilities € 33 31 0.30 NREEU IM Lyxor ETF MSCI Europe Real Est € 31 12 0.40 N SX6REX IM iShares Stoxx 600 Utilities Swap DE € 28 31 0.32 NMWO FP Lyxor ETF MSCI Wld Real Estate € 28 85 0.45 N STU FP SPDR MSCI Europe Utilities € 24 29 0.30 NSREPEX GY iShares Stoxx 600 Asia Real Estate € 24 55 0.73 N CU5 FP Amundi MSCI Europe Utilities € 20 -- 0.25 NMUA FP Lyxor ETF MSCI USA Real Estate € 22 24 0.40 N UTIW IM Lyxor ETF MSCI World Utilities € 15 89 0.45 NC8R FP Amundi Real Estate REIT IEIF € 16 -- 0.35 N Main X-listings: UTIW LN (USD)SREAEX GY iShares Stoxx Americas Real Estate € 15 24 0.74 N XLUS LN Source Utils S&P US Select Sector € 6 34 0.30 NREASIA IM Lyxor MSCI Asia Ex JP Real Estate € 14 52 0.65 N XS6S LN db x-trackers Stoxx 600 Utils Short € 3 31 0.50 NLYMWO SW Lyxor MSCI World Real Estate € 12 85 0.45 N Main X-listings: XS6S IM (EUR)CBSX86R GY ComStage Stoxx 600 Real Estate TR € 11 -- 0.25 N UTIP LN ETFX Stoxx 600 Utilities € 2 33 0.30 NMain X-listings: CBSX86R SW (CHF) Main X-listings: UTIL LN (EUR)LYMUA SW Lyxor ETF MSCI USA Real Estate € 10 24 0.40 NLYAHJ SW Lyxor MSCI AC Asiaex JP R.Estate € 5 52 0.65 NXACTBYGG SS XACT Nordic Cons & Real Est € 3 -- 0.50 NHQFASTIG SS Carnegie Fastighet ETF € 3 -- 0.40 N GlobalFFA SJ Fortress Income Fund Ltd € 2 18 0.86 N IEEM LN iShares MSCI Emerging Markets € 4,722 364 0.75 NKSMRE15 IT KSM Financial - KSM REIT € 1 -- 0.50 N Main X-listings: IDEM LN (USD), IEEM IM (EUR)KSHORTRE IT KSM Short Real Estate 15 € 1 -- - N XMEM IM db x-trackers MSCI Emerging Mkt € 3,739 803 0.65 ND5BJ GY db x-trackers EPRA €zone R.Estate € 1 40 0.35 N Main X-listings: XMEM SW (USD), XMEM LN (GBP), XMEM SS (SEK)Main X-listings: XREU LN (GBP) IWRD LN iShares MSCI World € 2,660 692 0.50 NMBTIN15 IT Clal - Mabat Real Estate 15 € 1 -- - N Main X-listings: IDWR LN (USD), IWRD NA (EUR)MND1531 IT Clal - Mabat Short Real Estate € 1 -- - N XMWO IM db x-trackers MSCI World TR € 1,892 1,662 0.45 NTGND153 IT Tachlit Real Estate 15 € 1 -- 0.50 N Main X-listings: XMWO SW (USD), XMWO SS (SEK), XMWO LN (GBP)MBRE22 IT Clal - Mabat DJ US Real Estate € 1 -- - N LEM FP Lyxor ETF MSCI Emerging Markets € 1,413 803 0.65 NKSRX222 IT KSM Long Real Estate 15 X2 daily -- 15 1.50 N Main X-listings: LLAT LN (GBP), LYLEM SW (USD)MTA1566 IT Clal - Mabat Short Real Estate 15 -- -- - N BRIC LN iShares FTSE BRIC 50 € 899 50 0.74 NINND158 IT IndexSal - Index Real Estate 15 -- -- - N Main X-listings: BR50 IM (EUR), DBRC LN (EUR)TCLGL32 IT Tachlit Short Real-Estate 15 500 -- -- - N XMAS IM db x-trackers MSCI EM Asia € 765 530 0.65 NTEPRA15 IT Psagot EPRA Europe -- -- 1.00 N Main X-listings: XMAI SW (USD), XMAS LN (GBP), XMAS SS (SEK)KSRTREX2 IT KSM Short TA Real Estate 15 X2 -- 15 - N CSEM SW CSETF on MSCI Emerging Mkts € 745 756 0.74 NQFDI IM Delta Immobiliare -- -- -- N Main X-listings: CSEM IM ((EUR), CM1 LN (GBP)PTXSPY SJ Property Index Tracker Managers -- 20 0.86 N WLD FP Lyxor ETF MSCI World € € 684 1,662 0.45 NHFN1516 IT Harel Real Estate 15 -- -- 0.50 N XMLD LN db x-trackers MSCI EM LATAM € 394 134 0.65 NTechnology Main X-listings: XMLA IM (EUR), XMLA LN (GBP), XMLA SS (SEK)TNO FP Lyxor Stoxx 600 Technology € 123 26 0.30 N MXFS LN Source MSCI Emerging Mkt € 239 811 0.65 NTDXPEX GY iShares TecDAX DE € 115 30 0.52 N CBNDDUWI GY ComStage ETF MSCI World TRN € 238 -- 0.40 NXS8R LN db x-trackers Stoxx 600 Technology € 69 26 0.30 N Main X-listings: CBNDDUWI SW (CHF), X010US SW (USD)Main X-listings: XS8R IM (EUR) CM9 FP Amundi MSCI World Ex EMU € 221 -- 0.35 NX8PS GY Source Stoxx 600 Opt Technology € 48 26 0.30 N Main X-listings: CE8USD SW (USD)CBSX8R GY ComStage Stoxx 600 Tech TR € 29 -- 0.25 N SEMS LN iShares MSCI EM Mkt SmallCap € 193 351 0.74 NMain X-listings: CBSX8R SW (CHF) Main X-listings: IEMS LN (USD), EUNI GY (EUR)XLKS LN Source Tech S&P US Select Sector € 28 86 0.30 N WRDCHA SW UBS MSCI World € 169 1,584 0.40 NSX8PEX GY iShares Stoxx 600 Technology DE € 24 26 0.52 N Main X-listings: WRDCHA SW (CHF), WRDEUA GY (EUR), WRDGBA SW (GBP)TNOA FP Lyxor MSCI Asia Ex JP Info Tech € 20 83 0.65 N LYWLD SW Lyxor ETF MSCI World USD € 162 1,662 0.45 NMain X-listings: IFNG LN (GBP), TNOA LN (USD) CW8 FP Amundi ETF MSCI World € 113 -- 0.38 N
Sector FundsSector Funds
International

32
EMEA Listed ETFs
Ticker ETF NameTotal Assets
(€M)Stocks in
ETF (#)Exp. Ratio
(%)Options
Available Ticker ETF NameTotal Assets
(€M)Stocks in
ETF (#)Exp. Ratio
(%)Options
Available
Global (continued) North America (continued)SWDA LN iShares MSCI World Acc € 105 931 0.50 N CSNDX SW CSETF on Nasdaq 100 € 130 100 0.33 NMain X-listings: IWDA NA (EUR), SWDA PZ (USD) Main X-listings: CSNDX IM (EUR), CNX1 LN (GBP)WRDUSI SW UBS-ETF MSCI World I € 102 1,603 0.25 N HSPX LN HSBC S&P 500 ETF € 130 500 0.15 NMain X-listings: WRDEUI GY (EUR) Main X-listings: HHH FP (EUR), HSPD LN (USD)AUEM FP Amundi MSCI Emerging Markets € 98 -- 0.45 N USAUSI SW UBS-ETF MSCI USA I € 101 594 0.18 NMain X-listings: AEEM FP (USD) Main X-listings: USAEUI GY (EUR)SEMA LN iShares MSCI Emerging Mkts Acc € 84 342 0.75 N CANCDA SW UBS-ETF MSCI Canada € 92 100 0.45 NMain X-listings: SEMA IM (EUR), IEMA LN (USD) Main X-listings: CANEUA IM (EUR)XSFR IM db x-trackers S&P Select Frontier € 63 40 0.95 N CSCA IM CSETF on MSCI Canada € 90 102 0.48 NMain X-listings: XSFR SW (CHF), XSFR LN (GBP), XSFD LN (USD) Main X-listings: CSCA SW (CAD), CSCA LN (GBP)SMSWLD GY MSCI World Source ETF € 58 1,693 0.45 N CBNDX GY ComStage ETF Nasdaq-100 € 88 -- 0.25 NDBXWD SJ db x-trackers MSCI World € 56 1,661 1.14 N Main X-listings: C011US SW (USD), CBNDX SW (CHF)EBR FP EasyETF DJ BRIC 50 € 53 50 0.55 N CSUSL SW CSETF on MSCI USA Large Cap € 87 274 0.33 NDJGTEEX GY iShares DJ Global Titans 50 DE € 52 50 0.52 N Main X-listings: CSUSL IM (EUR), CUL1 LN (GBP)MGT IM Lyxor ETF DJ Global Titans 50 € 48 50 0.40 N XSPX IM db x-trackers S&P 500 ETF € 81 500 0.20 NE11EUR FP EasyETF S-Box Next 11 Emerging € 42 48 0.68 N Main X-listings: XSPU LN (USD), XSPX LN (GBP), XSPX SW (CHF), XSPX SS (SEK)HMWD LN HSBC MSCI World ETF-$ € 38 742 0.35 N LSPU LN Lyxor ETF S&P 500 US$ € 75 500 0.25 NEMMUSI SW UBS-ETF MSCI Emerging Market I € 35 -- 0.40 N Main X-listings: LSPX LN (GBP)Main X-listings: UIMJ GY (EUR) ANX IM Amundi ETF Nasdaq 100 € 69 -- 0.23 NIWDE LN iShares MSCI Wld Month Eur Hedge € 34 906 0.55 N Main X-listings: ANXUSD SW (USD)IGWD LN iShares MSCI Wld Month £ Hedge € 26 868 0.55 N LYUSA SW Lyxor ETF MSCI USA US$ € 68 592 0.35 NSWXU LN iShares FTSE Dec World ex-UK € 25 580 0.50 N SR2000 GY Russell 2000 Source ETF € 62 1,991 0.45 NMain X-listings: IWXU LN (GBp) RUSA IM Lyxor ETF RAFI US 1000 € 62 990 0.60 NLWOR LN Lyxor ETF MSCI World € 24 -- 0.45 N ETFUSLC GY ETFlab MSCI USA LC € 59 274 0.30 NMain X-listings: LWOU LN (USD) SCAN LN iShares MSCI Canada € 58 99 0.59 NEMMUSA SW UBS-ETF MSCI Emerging Market A € 21 -- 0.65 N Main X-listings: ICAN LN (USD), IBC2 GY (EUR)Main X-listings: EMMUSA SW (USD), UIMI GY (EUR) HMUS LN HSBC MSCI USA ETF € 49 591 0.30 NU11 FP EasyETF S-Box Next 11 EM USD € 20 48 68.00 N Main X-listings: MUS FP (EUR), HMUD LN (USD)CE8 FP Amundi MSCI World Ex Europe € 12 -- 0.35 N ISP6 LN iShares S&P SmallCap 600 € 49 442 0.40 NMain X-listings: CW8USD SW (USD) Main X-listings: IDP6 LN (USD), IUS3 GY (EUR)9J6X GY Source MSCI Emerging Market € 7 -- 0.64 N ESEEUR FP EasyETF S&P 100 € 48 100 0.20 N00I5 GY Source MSCI BRIC ADR Top 50 € 7 -- 0.64 N IUSE LN iShares S&P 500 Monthly € € 46 500 0.45 N9J6T GY Source MSCI Frontier Markets € 7 -- 1.25 N PSRF LN PowerShares FTSE RAFI US 1000 € 46 986 0.39 NETFEMMA GY ETFlab MSCI Emerging Markets € 5 -- 0.65 N Main X-listings: PFT IM (EUR)CSWD SW CSETF on MSCI World € 4 -- 0.40 N EREEUR FP EasyETF Russell 1000-Eur € 45 997 0.35 NMain X-listings: CSWD IM (EUR), CWD1 LN (GBP) SACC LN iShares S&P 500 Acc € 42 500 0.40 NPMMXEF2 IT KSM MSCI Emerging Markets € 2 -- 1.00 N Main X-listings: SACC IM (EUR), IACC LN (USD)PMMXWO1 IT KSM MSCI World € 1 1,654 0.95 N RTWO LN ETFX Russell 2000 US Small Cap € 38 20,000 0.45 NTLCSTA2 IT Psagot - Tali 20/80 ETF € 1 -- 0.80 N Main X-listings: RTWP LN (GBP), RTWO IM (EUR)TGDAX9 IT Tachlit Bric Shiklit € 1 -- 0.90 N CSUS SW CSETF on MSCI USA € 37 591 0.33 NTLDJGT5 IT Tali Dow Jones Global Titans 50 € 1 -- - N Main X-listings: CSUS IM (EUR), CU1 LN (GBP)MBIMS11 IT Clal - Mahat Index MSC11 -- -- - N LQQ FP Lyxor ETF Leveraged Nasdaq-100 € 35 100 0.60 NBRICDX IM Market Access DAXglobal Bric -- -- 0.70 N CBNCUDUS GY ComStage MSCI USA Small Cap € 34 -- 0.35 NMain X-listings: MABI SW (USD), BRDX LN (GBP) Main X-listings: X023US SW (USD), CBNCUDUS SW (CHF)TMSCI41 IT Tachlit MSCI All Countries -- -- 1.00 N XCAN IM db x-trackers MSCI Canada € 30 100 0.35 NNorth America Main X-listings: XCAD LN (USD), XCAN LN (GBP), XCAN SW (CHF)IUSA LN iShares S&P 500 Index Fund € 6,751 500 0.40 N ETFUSAC GY ETFlab MSCI USA € 30 592 0.30 NMain X-listings: IDUS LN (USD), IUSA IM (EUR) CSINDU SW CSETF on DJIA € 27 30 0.33 NXMUS SW db x-trackers MSCI USA TR € 1,718 592 0.30 N Main X-listings: CSINDU IM (EUR), CID1 LN (GBP)Main X-listings: XMUS IM, XMUS LN (GBP), XMUS SS (SEK) SPXS LN Source S&P 500 Source ETF € 25 504 0.20 NINAA LN iShares MSCI North America € 1,374 488 0.40 N CAN IM Lyxor ETF S&P TSX 60-A € 24 60 0.40 NMain X-listings: IDNA LN (USD), INAA IM (EUR) LCAU LN Lyxor ETF Canada S&P TSX 60 € 22 60 0.45 NUSACHA SW UBS-ETF MSCI USA € 1,077 592 0.30 N Main X-listings: LCAN LN (GBP)Main X-listings: USACHA SW (CHF), USAGBA SW (GBP), USAEUA IM (EUR), USASKA SS (SEK) ISUS LN iShares MSCI USA Islamic Fund € 22 231 0.50 NEQQQ IM PowerShares Nasdaq 100 € 731 100 0.30 N Main X-listings: ISUS NA (EUR)Main X-listings: EQQQ LN (GBP), EQQQ SW (USD) LMUS LN Lyxor ETF MSCI USA € 21 592 0.35 NCU2 FP Amundi ETF MSCI USA € 474 -- 0.28 N Main X-listings: LMUU LN (GBP)Main X-listings: CU2USD SW (USD) IGUS LN iShares S&P 500 Monthly £ Hedge € 20 500 0.45 NDJE FP Lyxor ETF DJIA Euro € 459 30 0.50 N DBXUS SJ db x-trackers MSCI USA € 19 592 1.14 NUSA FP Lyxor ETF MSCI USA Euro € 380 592 0.35 N PSWC LN PowerShs Dynamic US Market Fund € 18 100 0.75 NUST FP Lyxor ETF Nasdaq 100 Euro € 288 -- 0.30 N Main X-listings: PWC IM (EUR)CSPX LN CSETF on S&P 500 $ € 246 500 0.20 N LIND LN Lyxor ETF DJIA € 15 30 0.50 NMain X-listings: CSSPX IM (EUR), CSP1 LN (GBP) Main X-listings: LINU LN (USD)NDXEX GY iShares Nasdaq-100R DE € 233 100 0.32 N ERDUSD FP EasyETF Russell 1000 € 15 965 0.35 NXRU FP db x-trackers Russell 2000 € 229 1,967 0.45 N CBMLCUUS GY ComStage MSCI USA Large Cap € 12 -- 0.25 NMain X-listings: XRU2 LN (GBP), XRUD LN (USD), XRUD SW (CHF) Main X-listings: X021US SW (USD)500 FP Amundi ETF S&P 500 € 218 -- 0.15 N CL2 FP Amundi ETF Lev MSCI USA x2 € 12 -- 0.35 NMain X-listings: 500USD SW (USD) Main X-listings: CL2USD SW (USD)SMSUSA GY MSCI USA Source ETF € 179 600 0.30 N CANCDI SW UBS-ETF MSCI Canada I € 9 100 0.28 NINDUEX GY iShares DJIA DE € 178 30 0.52 N Main X-listings: CANEUI GY (EUR)CBNDDUUS GY ComStage ETF MSCI USA TRN € 173 -- 0.25 N ETFUSMC GY ETFlab MSCI USA MC € 8 317 0.30 NMain X-listings: X020US SW (USD) XT21 SW db x-trackers S&P 500 2X Inverse € 7 500 0.70 NCBINDU GY ComStage ETF DJIA € 157 -- 0.45 N Main X-listings: XT2D LN (USD), XT21 SS (SEK)Main X-listings: CBINDU SW (CHF), C010US SW (USD) SSAM LN iShares MSCI USA € 6 460 0.40 NCSUSS SW CSETF on MSCI USA Small Cap € 140 946 0.43 N Main X-listings: ISAM LN (USD), ISAM NA (EUR)Main X-listings: CUS1 LN (GBP), CSUSS IM (EUR) MBTSP1 IT Clal - Mabat MABATINT S&P 500 € 6 -- - NSPX IM Lyxor ETF S&P 500-A € 132 500 0.20 N RONE LN ETFX Russell 1000 US Large Cap € 5 1,002 0.35 NXSPD LN db x-trackers S&P 500 Short € 131 500 0.50 N Main X-listings: RONP LN (GBP), RONE IM (EUR)Main X-listings: XSPS IM (EUR), XSPS LN (GBP), XSPS SS (SEK) KSMSP IT KSM Financial - KSM S&P 500 € 5 500 0.70 N
International International

33
EMEA Listed ETFs
Ticker ETF NameTotal Assets
(€M)Stocks in
ETF (#)Exp. Ratio
(%)Options
Available Ticker ETF NameTotal Assets
(€M)Stocks in
ETF (#)Exp. Ratio
(%)Options
Available
North America (continued) Asia PacificKSMDJIA IT KSM Financial - KSM DJIA € 4 -- 0.50 N INR FP Lyxor ETF MSCI India € 1,213 66 0.85 NC2U IM Amundi ETF Short MSCI USA € 4 -- 0.35 N CINA IM Lyxor ETF China Enterprise HSCEI € 928 40 0.65 NN100ETF SS Carnegie Nasdaq 100 ETF € 3 -- 0.40 N Main X-listings: LCHU LN (USD), LCHN LN (GBP)PSM FP PowerShs MENA Nasdaq OMX € 3 -- 0.75 N FXC LN iShares FTSE/XINHUA China 25 € 796 25 0.74 NKSMNSDQ IT KSM Financial - KSM Nasdaq 100 € 2 100 0.50 N Main X-listings: FXC IM (EUR), IDFX LN (USD)MBTFNS1 IT Clal - Mabat Nasdaq 100 € 2 -- - N XAXJ IM db x-trackers MSCI AC Asia ex-JP € 667 602 0.65 NTCSP4 IT Tachlit S&P 500 € 2 -- - N Main X-listings: XAXD LN (USD), XAXJ LN (GBP), XAXJ SS (SEK)HRS&P25 IT HarelSal S&P 500 € 2 500 0.70 N AEJ FP Lyxor ETF MSCI AC Asia Pac ex-JP € 552 679 0.65 NESDUSD FP EasyETF S&P 500 US$ € 2 500 0.20 N JPN FP Lyxor ETF Japan Topix € 542 1,662 0.50 NHRNSD26 IT HarelSal Nasdaq 100 € 2 -- 0.50 N Main X-listings: LTPX LN (GBP), LTPU LN (USD)INDSP18 IT IndexSal S&P 500 € 1 -- - N CSJPL SW CSETF on MSCI Japan Large Cap € 485 150 0.48 NTCNSX5 IT Tachlit Nasdaq 100 € 1 -- 0.45 N Main X-listings: CSJPL IM (EUR), CJPL LN (GBP)INDNDX6 IT IndexSal Nasdaq Shekel € 1 -- - N XMJD LN db x-trackers MSCI Japan TRN € 417 340 0.50 NTCNBI8 IT Tachlit Nasdaq BioTech € 1 -- 1.00 N Main X-listings: XMJP IM (EUR), XMJP SW (JPY), XMJP LN (GBP), XMJP SS (SEK)KSHORTSP IT KSM Financial - Short S&P 500 € 1 500 - N IKOR LN iShares MSCI Korea € 417 104 0.74 NPSNAS48 IT Psagot Sal Nasdaq 100 € 1 -- 0.50 N Main X-listings: IKOR IM (EUR), IKOR SW (USD)PNASD62 IT Psagot Sal Nasdaq 100 NIS € 1 -- 0.80 N JPNJPA SW UBS ETF MSCI Japan A € 413 340 0.50 NKSMRU2K IT KSM Financial - KSM Russel 20000 € 1 2,016 0.50 N Main X-listings: JPNCHA SW (CHF), JPNEUA IM (EUR), JPNGBA SW (GBP)KSMSPTSX IT KSM Financial - KSM Canada € 1 -- 0.60 N CSJP SW CSETF on MSCI Japan € 388 340 0.48 NPRUSS52 IT Psagot Russell 2000 € 1 -- 0.50 N Main X-listings: CSJP IM (EUR), CSJP LN (GBP)PS50047 IT Psagot Sal S&P NIS € 1 -- 0.80 N NKYEX GY iShares Nikkei 225R DE € 369 225 0.52 NKSHORTNS IT KSM Short Nasdaq 100 -- -- - N ITWN LN iShares MSCI Taiwan € 316 122 0.74 NMBTGNS3 IT Clal - Mabat Nasdaq Short -- -- - N Main X-listings: ITWN IM (EUR), IDTW LN (USD)PSP IT Psagot Sal S&P 500 -- -- 0.70 N XX25 IM db x-trackers FTSE China 25 € 266 25 0.60 NAA1FJ3 GY ABN AMRO S&P 500 Short -- -- - N Main X-listings: XXXI SW (USD), XX25 LN (GBP), XX25 SS (SEK)C012US SW ComStage ETF S&P 500 -- -- 0.18 N XNIF GY db x-trackers S&P CNX NIFTY € 265 50 0.85 NMain X-listings: C012 SW (CHF), C012 GY (EUR) XFVT IM db x-trackers FTSE Vietnam € 245 33 0.85 NX022US SW ComStage MSCI USA Mid Cap -- -- 0.35 N Main X-listings: XVTD LN (USD), XFVT LN (GBP), XFVI SW (CHF), XFVT SS (SEK)Main X-listings: CBMMDUUS SW (CHF), CBMMDUUS GY (EUR) XPXJ IM db x-trackers MSCI Pacific ex-JP € 224 149 0.45 NCBNDDUJN SW ComStage MSCI North America -- -- 0.25 N Main X-listings: XPXD LN (USD), XPXJ LN (GBP), XPXJ SS (SEK)Main X-listings: CBNDDUNA GY (EUR), X013US SW (USD) HSI FP Lyxor ETF HSI Euro € 209 45 0.65 NXS2L IM db x-trackers S&P 500 2X Lev -- -- 0.60 N LYINR SW Lyxor ETF MSCI India USD € 208 66 0.85 NMain X-listings: XS2D LN (USD), XSL2 LN (GBP), XS2L SW (CHF), XSL2 SS (SEK) XMKO IM db x-trackers MSCI Korea TRN € 200 102 0.65 NTCNSD37 IT Tachlit Nasdaq 100 Ils -- -- 0.80 N Main X-listings: XMKO SW (USD), XKS2 LN (GBP), XMKO SS (SEK)TSP5038 IT Tachlit S&P 500 Ils -- -- 0.80 N JPNJPI SW UBS ETF MSCI Japan I € 182 343 0.30 NKSMSPILS IT KSM S&P 500 -- -- - N Main X-listings: JPNEUI GY (EUR)Latin America SPXJ LN iShares MSCI Pacific ex-JP € 176 150 0.60 NIBZL LN iShares MSCI Brazil € 811 81 0.74 N Main X-listings: IPXJ LN (USD), SPXJ IM (EUR)Main X-listings: IBZL SW (USD), IBZL NA (EUR) XMTW IM db x-trackers MSCI Taiwan TR € 165 122 0.65 NBRA IM Lyxor ETF Brazil Ibovespa € 618 64 0.65 N Main X-listings: XMTW SW (USD), XMTW LN (GBP), XMTW SS (SEK)BBVAL SM Accion FTSE Latibex Top ETF/FI € 371 24 0.44 N KRW FP Lyxor ETF MSCI Korea € 161 102 0.65 NXMBR IM db x-trackers MSCI Brazil TRN € 269 81 0.65 N CJ1 FP Amundi ETF MSCI Japan € 157 -- 0.45 NMain X-listings: XMBR SW (USD), XMBR PZ (GBP) Main X-listings: CJ1JPY SW (JPY)LTAM LN iShares MSCI Latin America Fund € 251 93 0.74 N XAUS IM db x-trackers S&P/ASX 200 € 144 200 0.50 NMain X-listings: LTAM IM (EUR), DLTM LN (USD) Main X-listings: XAUS LN (GBP)LTM FP Lyxor ETF MSCI EM Latin America € 167 134 0.65 N CBNKY GY ComStage ETF Nikkei 225 € 134 -- 0.45 NMain X-listings: LLAT LN (GBP) Main X-listings: CBNKY SW (CHF), C020JP SW (JPY)LYRIO SW Lyxor ETF Brazil Ibovespa USD € 88 69 0.65 N SMSJPN GY Source - MSCI Japan € 123 344 0.50 NBRZ FP Amundi ETF MSCI Brazil € 52 -- 0.55 N ISJP LN iShares MSCI Japan SmallCap € 108 507 0.59 NMain X-listings: BRZ IM (EUR) Main X-listings: IDP6 LN (USD), IUS4 GY (EUR)CSCL LN CSETF on MSCI Chile € 41 17 0.65 N IJPE LN iShares MSCI Japan Month € Hedge € 103 340 0.64 NMain X-listings: CSCL IM (EUR), CCL1 LN (GBP) MAL FP Lyxor ETF Malaysia € 95 -- 0.65 NCMXC LN CSETF on MSCI Mexico Capped € 30 23 0.65 N CP9 FP Amundi ETF MSCI Pacific ex-JP € 95 -- 0.45 NMain X-listings: CSMXCP IM (EUR), CMX1 LN (GBP) Main X-listings: CP9USD SW (USD)CSEMLA IM CSETF on MSCI EM LATAM € 28 133 0.65 N LYASI SW Lyxor China Enterprise HSCEI USD € 86 40 0.65 NMain X-listings: CEML LN (USD), CML1 LN (GBP) CSEMAS IM CSETF on MSCI EM Asia € 87 530 0.65 NCSBR SW CSETF on MSCI Brazil € 24 81 0.65 N Main X-listings: CSEMAS SW (USD), CEA1 LN (GBP)Main X-listings: CSBR IM (EUR) PACUSA SW UBS MSCI Pacific ex. JP € 77 153 0.40 NBBVAB SM Accion FTSE Latibex Brasil ETF/FI € 23 18 0.39 N Main X-listings: PACEUA GY (EUR), PACGBA SW (GBP), PACSKA SS (SEK)LYLTM SW Lyxor ETF MSCI EM Latam USD € 22 1,134 0.65 N CSTW IM CSETF on MSCI Taiwan € 69 122 0.65 NMXBS LN Source MSCI Brazil ETF € 20 81 0.65 N Main X-listings: CSTW LN (USD), CTW1 LN (GBP)EEB FP EasyETF DJ Brazil 15 € 15 15 0.55 N CSNKY SW CSETF on Nikkei 225 € 68 225 0.48 NLBRZ LN Lyxor ETF Brazil Ibovespa/UK € 13 64 0.65 N Main X-listings: CNKY LN (GBP), CSNKY IM (EUR)Main X-listings: LBRU LN (USD) CSIN SW CSETF on MSCI India € 66 66 0.75 NXMEX IM db x-trackers MSCI Mexico € 12 24 0.65 N Main X-listings: CSIN IM (EUR), CIN1 LN (GBP)Main X-listings: XMES LN (USD), XMEX LN (GBP), XMEX SW (CHF) EJP FP EasyETF Topix € € 64 1,500 0.50 NHMBR LN HSBC MSCI Brazil ETF € 8 81 0.60 N LYAEJ SW Lyxor MSCI AC APAC ex-JP USD € 63 679 0.65 NMain X-listings: HBZ FP (EUR) CC1 FP Amundi ETF MSCI China € 62 -- 0.55 N00I6 GY RBS MSCI EM LATAM W/Br Adr € 5 -- -- N CSCSI3 SW CSETF on CSI 300 € 59 300 0.50 NKBVSP50 IT KSM Financial - KSM Brazil € 2 -- 1.00 N Main X-listings: CSCSI3 IM (EUR), CCS1 LN (GBP)KSMLA40 IT KSM Latin America 40 € 2 40 1.50 N CI2 FP Amundi ETF MSCI India € 57 -- 0.80 NPMMSCI7 IT KSM MSCI Brazil € 2 -- 0.85 N Main X-listings: CI2USD SW (USD)TCBRZ29 IT Tachlit Brazil € 1 -- 1.00 N EEKEUR FP EasyETF DJ South Korea Titans 30 € 53 30 0.55 NTLIBV10 IT Psagot Brazil Bovespa Stock € 1 -- 1.00 N HMXJ LN HSBCI MSCI Pacific Ex JP £ € 52 148 0.40 NHBR2032 IT Harel Sal Dj Brazil Adr Indx € 1 -- 1.00 N Main X-listings: H4ZH GY (EUR)IJPN LN iShares MSCI Japan Fund € 1,674 340 0.59 N CSAU IM CSETF on MSCI Australia € 50 72 0.50 NMain X-listings: IJPN SW (JPY), IJPN IM (EUR), IJPA LN (USD) Main X-listings: CSAU LN (USD), CAU1 LN (GBP)IFFF LN iShares MSCI AC Far East ex-Japan € 1,423 -- 0.74 N ISFE LN iShares MSCI AC FarEast-ex-JP Sm € 50 361 0.74 NMain X-listings: IDFF LN (USD), IFFF NA (EUR) Main X-listings: IDFE LN (USD), IUS9 LN (EUR)
InternationalInternational

34
EMEA Listed ETFs
Ticker ETF NameTotal Assets
(€M)Stocks in
ETF (#)Exp. Ratio
(%)Options
Available Ticker ETF NameTotal Assets
(€M)Stocks in
ETF (#)Exp. Ratio
(%)Options
Available
Asia Pacific (continued) Asia Pacific (continued)TWN FP Lyxor ETF Taiwan € 42 122 0.65 N INDNKY3 IT IndexSal Nikkei Shekel -- -- - NDJCHOEX GY iShares DJ China Offshore 50 DE € 42 50 0.62 N INDNKY5 IT IndexSal Nikkei 225 -- -- - NHMJP LN HSBC MSCI Japan ETF € 41 340 0.40 N KSMCHIN IT KSM Short China -- -- - NMain X-listings: MJP FP (EUR), HMJD LN (USD) AA1DEW GY Access CSI 300 Index China Tracker -- -- 0.80 NCC2 FP Amundi ETF MSCI China US$ € 35 -- 0.55 N AA10CC GY ACCESS China H/China A Spread -- -- 1.00 NLYJPN SW Lyxor ETF Japan Topix JPY € 35 1,662 0.50 N AA12MX GY RBS MSCI Indonesia NET TR -- -- 1.00 NCBNDDUPX GY ComStage MSCI Pacific ex-JP TRN € 33 -- 0.45 N JAPG LN SG ETN MSCI Japan £ -- -- 0.50 NMain X-listings: X015US SW (USD), CBNDDUPX SW (CHF) X017US SW ComStage ETF MSCI Japan TRN -- -- 0.45 NETFJPLC GY ETFlab MSCI Japan LC € 30 150 0.50 N Main X-listings: CBNDDUJN GY (EUR)APX FP Lyxor ETF MSCI APEX 50 € 29 50 0.50 N TGKOS24 IT Tachlit Kospi 24 -- -- 1.00 NCSKR SW CSETF on MSCI Korea € 29 102 0.65 N X019US SW ComStage ETF MSCI Taiwan TRN -- -- 0.60 NMain X-listings: CSKR IM (EUR), CKR1 LN (GBP) Main X-listings: CBNDEUST GY (EUR), CBNDEUST SW (CHF)SAUS LN iShares MSCI Australia € 29 71 0.59 N MNFTY67 IT Clal - Mabat CNX Nifty -- -- - NMain X-listings: IAUS LN (USD), IBC6 GY (EUR) XHSS IM db x-trackers HSI Short Index ETF -- 45 0.75 NCSJPS SW CSETF on MSCI Japan Small Cap € 29 490 0.58 N Main X-listings: XHSD LN (GBP)Main X-listings: CSJPS IM (EUR), CJPS LN (GBP) C021JP SW ComStage ETF Topix -- -- 0.45 NETFJPMC GY ETFlab MSCI Japan MC € 29 190 0.50 N Main X-listings: CBTPX GY (EUR), CBTPX SW (CHF)LNFT LN Lyxor ETF India S&P CNX NIFTY € 27 50 0.85 N MAS5168 IT Mabat S&P/ASX 200 A -- -- - NMain X-listings: LNFU LN (USD)LYHSI SW Lyxor ETF Hong Kong HSI USD € 26 45 0.65 NEXCEUR FP EasyETF FTSE China 25 EUR € 25 25 0.60 NSJPA LN iShares MSCI Japan Acc € 25 340 0.59 N SEUP LN ETFS Short EUR Long USD € 55 -- 0.39 NMain X-listings: IJPA LN (USD), SJPA IM (EUR) Main X-listings: SEUR LN (USD)EIA FP EasyETF DJ India 15 € 23 15 0.55 N SJPL GY ETFS Short JPY Long EUR € 37 -- 0.39 NASIADX IM Market Access DaxGlobal Asia € 22 -- 0.70 N JPGB LN ETFS Short JPY Long GBP € 29 -- 0.39 NMain X-listings: ASDX LN (GBP), MDAI SW (USD) XBJQ GY ETFS Short USD Long EUR € 17 -- 0.39 NIFRA LN Lyxor MSCI Asia Ex Japan Infrastr € 22 50 0.65 N XCRG LN Currency Returns ETF (GBP) € 10 0.35 NMain X-listings: IFRG LN (GBP) SJPP LN ETFS Short JPY Long USD € 7 -- 0.39 NAUST IM Lyxor ETF S&P Asx 200-A € 20 200 0.40 N Main X-listings: SJPY LN (USD)CSPXJ IM CSETF on MSCI Pac Ex Jp € 19 149 0.48 N XBJA GY ETFS Long CHF Short EUR € 6 -- 0.39 NMain X-listings: CSPXJ SW (USD), CPJ1 LN (GBP) SAUP LN ETFS Short AUD Long USD € 5 -- 0.39 NC023 GY ComStage ETF HSCI € 19 -- 0.55 N Main X-listings: SAUD LN (USD)Main X-listings: C023 SW (CHF), C023USD SW (USD) GBPP LN ETFS Long GBP Short USD € 5 -- 0.39 NLAUS LN Lyxor ETF S&P ASX 200 - US$ € 18 200 0.45 N Main X-listings: LGBP LN (USD)Main X-listings: LYAU2 SW (USD) XCRD LN Currency Returns ETF (US$) € 3 0.35 NDBXJP SJ db x-trackers MSCI Japan € 17 340 1.14 N URGB LN ETFS Short EUR Long GBP € 3 -- 0.39 NMXIS LN Source - MSCI India Source ETF € 16 66 0.85 N XBJP GY ETFS Long USD Short EUR € 3 -- 0.39 NETFJPAC GY ETFlab MSCI Japan € 16 340 0.50 N LCNP LN ETFs Long CNY Short USD € 3 -- 0.59 NEEWEUR FP EasyETF TSEC Taiwan $15 50 0.60 N Main X-listings: LCNY LN (USD), XBJE GY (EUR)FICA FP Lyxor MSCI Asia Ex JP Financials € 15 152 0.65 N USD2 LN ETFS Short GBP Long USD € 2 -- 0.39 NMain X-listings: FINA LN (USD), FNLG LN (GBP) Main X-listings: SGBP LN (GBP)MXCS LN Source - MSCI China Source ETF $14 140 0.65 N LNOE GY ETFS Long NOK Short EUR € 2 -- 0.39 NLYKRW SW Lyxor ETF MSCI Korea USD $14 102 0.65 N XBJD GY ETFS Long SEK Short EUR € 2 -- 0.39 NCBNDDUP GY ComStage ETF MSCI Pacific TRN € 12 -- 0.45 N SJPS GY ETFS Long JPY Short EUR € 2 -- 0.39 NMain X-listings: CBNDDUP GY (EUR), CBNDDUP SW (CHF) GBCH LN ETFS Long CHF Short GBP € 2 -- 0.39 NNFTY LN iShares S&P CNX Nifty Fifty Swap € 10 -- 0.85 N AUDP LN ETFS Long AUD Short USD € 1 -- 0.39 NMain X-listings: NIFT LN (USD) Main X-listings: LAUD LN (USD)C022 GY ComStage ETF HSI € 10 -- 0.55 N PUS3 LN ETFS 3X Short USD Long GBP € 1 -- 0.98 NMain X-listings: C022 SW (CHF), C022USD SW (USD) SCHF LN ETFS Short CHF Long USD € 1 -- 0.39 NLYTWN SW Lyxor ETF MSCI Taiwan USD € 7 122 0.65 N Main X-listings: SCHF LN (USD)KSMNK IT KSM Financial - KSM Nikkei 225 € 7 225 0.75 N XBJC GY ETFS Short GBP Long EUR € 1 -- 0.39 NKSMINDIA IT KSM India € 6 -- 0.70 N SCHE GY ETFS Short CHF Long EUR € 1 -- 0.39 N9J6U GY RBS MSCI South East Asia € 6 -- 0.65 N SEU3 LN ETFS 3X Short EUR Long USD € 1 -- 0.98 NFAPX LN Lyxor ETF MSCI Asia APEX 50 € 6 50 0.50 N SJP3 LN ETFS 3X Short JPY Long USD € 1 -- 0.98 NETFCHINA GY ETFlab MSCI China € 5 140 0.65 N USGB LN ETFS Short USD Long GBP € 1 -- 0.39 NC22 FP Amundi ETF MSCI India USD € 4 -- 0.80 N XBJJ GY ETFS Long AUD Short EUR € 1 -- 0.39 NKSMCHN IT KSM China € 4 -- 1.00 N LNOK LN ETFS Long NOK Short USD € 1 -- 0.39 NPMMXFEJ IT KSM MSCI AC Far East ex JP € 2 -- 0.79 N Main X-listings: NOKP LN (GBp)KSMKOREA IT KSM Financial - KSM Korea € 2 -- 1.00 N LCHF LN ETFS Long CHF Short USD € 1 -- 0.39 NHRNFT30 IT Harel Sal Nifty € 1 50 1.00 N Main X-listings: CHFP LN (GBp)KMSCI48 IT KSM MSCI Singapore € 1 NTCE 1.00 N XBJK GY ETFS Short AUD Long EUR € 1 -- 0.39 NPMMXJP4 IT KSM MSCI Japan € 1 295 0.95 N SCAD LN ETFS Short CAD Long USD € 1 -- 0.39 NINHSCE7 IT IndexSal Index China Shekel € 1 -- - N Main X-listings: SCDP LN (USD)KSMTW IT KSM Taiwan € 1 100 1.00 N SNOK LN ETFS Short NOK Long USD € 1 -- 0.39 NINCNX14 IT IndexSal Index India ILS € 1 -- - N Main X-listings: SNOP LN (GBp)TDJTGR4 IT Tali Dow Jones Tiger Titans 50 € 1 -- - N GBUR LN ETFS Long EUR Short GBP € 1 -- 0.39 NTNIKI54 IT Tachlit Nikkei 225 Ils € 1 -- 1.00 N XBJL GY ETFS Long CAD Short EUR € 1 -- 0.39 NKA20052 IT KSM ASX200 52 € 1 200 1.00 N LCAD LN ETFS Long CAD Short USD € 1 -- 0.39 NTCSP21 IT Tachlit India € 1 -- 1.00 N Main X-listings: CADP LN (GBp)PMMSCI8 IT KSM MSCI India € 1 -- 0.85 N LEUR LN ETFS Long EUR Short USD € 1 -- 0.39 NKSMNKIL IT KSM Nikkei 225 ILS € 1 225 - N Main X-listings: EURP LN (GBp)TCNK16 IT Tachlit Nikkei 225 € 1 -- 0.65 N GBAU LN ETFS Long AUD Short GBP € 1 -- 0.39 NTCCHN38 IT Tachlit China € 1 -- 1.00 N AUGB LN ETFS Short AUD Long GBP € 1 -- 0.39 NMBINK10 IT Clal - Mabat Index NKY10 € 1 -- - N GBCA LN ETFS Long CAD Short GBP € 1 -- 0.39 NHRHSN29 IT HarelSal Hang Seng € 1 43 1.00 N GBUS LN ETFS Long USD Short GBP € 1 -- 0.39 NMBNK18 IT Clal - Mabat IN 18-NK € 1 -- - N GBSK LN ETFS Long SEK Short GBP -- -- 0.39 NPMSCI16 IT KSM Financial - KSM MSCI China € 1 -- - N SEN0 GY ETFS Short NOK Long EUR -- -- 0.39 NMBTIHS9 IT Clal - Mabat Indx HSI 9 € 1 -- - N LINP LN ETFS Long INR Short USD -- -- 0.59 NPSCHN56 IT Psagot Sal FTSE China 25 € 1 -- 1.00 N Main X-listings: LINR LN (USD)
International International
Currency Funds

35
EMEA Listed ETFs
Ticker ETF NameTotal Assets
(€M)Stocks in
ETF (#)Exp. Ratio
(%)Options
Available Ticker ETF NameTotal Assets
(€M)Stocks in
ETF (#)Exp. Ratio
(%)Options
Available
(continued) GovernmentsXBJG GY ETFS Long INR Short USD -- -- 0.59 N IBGM IM iShares € Government Bond 7-10 € 416 12 0.20 NGBJP LN ETFS Long JPY Short GBP -- -- 0.39 N Main X-listings: IBGM LN (GBP), IBGM SW (CHF)GBNO LN ETFS Long NOK Short GBP -- -- 0.39 N XGIN IM db x iBoxx Glbl Inflation-linked TR € 397 -- 0.25 NLEU3 LN ETFS 3X Long EUR Short USD -- -- 0.98 N XEMB GY db x-trackers EM Liquid Eurobond € 362 27 0.55 NXBJN GY ETFS Short NZD Long EUR -- -- 0.39 N CBOXES3 GY ComStage Liquid Sov Diversifd 3-5 € 322 -- 0.12 NSUP3 LN ETFS 3X Short EUR Long GBP -- -- 0.98 N Main X-listings: CBOXES3 SW (CHF)LNZD LN ETFS Long NZD Short USD -- -- 0.39 N ITPS LN iShares Barclays Capital $ TIPS € 306 30 0.25 NMain X-listings: NZDP LN (GBp) Main X-listings: IDTP LN (USD), ITPS IM (EUR)XBJH GY ETFS Short INR Long USD -- -- 0.59 N ISM FP EasyETF iBoxx Liquid Sov Global € 305 -- 0.15 NSAP3 LN ETFS 3X Short AUD Long GBP -- -- 0.98 N IGLS LN iShares FTSE Gilts UK 0-5 € 296 13 0.20 NXBJF GY ETFS Short CNY Long USD -- -- 0.59 N CBOXES1 GY ComStage Liquid Sov Diversifd 1-3 € 282 -- 0.12 NSINR LN ETFS Short INR Long USD -- -- 0.59 N Main X-listings: CBOXES1 SW (CHF)Main X-listings: SINP LN (GBP) IGLO LN iShares Citigroup Glbl Govt Bond € 265 533 0.20 NSCNY LN ETFS Short CNY Long USD -- -- 0.59 N Main X-listings: SGLO LN (GBP), EUN3 GY (EUR)Main X-listings: SCYP LN (GBp) ETFGS51 GY ETFlab DB EuroGov Germany 5-10 € 258 13 0.15 NXBJR GY ETFS Long NZD Short EUR -- -- 0.39 N ETFGS11 GY ETFlab DB EuroGov Germany € 253 16 0.15 NLJPY LN ETFS Long JPY Short USD -- -- 0.39 N C13 FP Amundi ETF Euromt Broad 1-3 € 225 -- 0.14 NMain X-listings: JPYP LN (GBp) MTD FP Lyxor ETF EuroMTS 7-10Y € 223 -- 0.17 NSSEE GY ETFS Short SEK Long EUR -- -- 0.39 N IDTM LN iShares Barclays Capital USD Treasury Bond 7 € 220 12 0.20 NCHGB LN ETFS Short CHF Long GBP -- -- 0.39 N Main X-listings: BTMA NA (EUR), IBTM LN (GBP)SSEK LN ETFS Short SEK Long USD -- -- 0.39 N MPFE GY Source Man GLG Europe Plus ETF € 217 -- 0.75 NMain X-listings: SSEP LN (GBp) CSBGE3 SW CSETF on iBoxx Eur Gov 1-3 € 215 40 0.23 NXBJB GY ETFS Long GBP Short EUR -- -- 0.39 N Main X-listings: CE31 LN (GBP)LAU3 LN ETFS 3X Long AUD Short USD -- -- 0.98 N DSB FP Lyxor ETF SGI Dly Dble Short Bund € 213 1 0.20 NSNZP LN ETFS Short NZD Long USD -- -- 0.39 N XEIN GY db x iBoxx € Inflation-linked € 208 -- 0.20 NMain X-listings: SNZD LN (USD) ETFGS35 GY ETFlab DB EuroGov Germany 3-5 € 199 10 0.15 NSAU3 LN ETFS 3X Short AUD Long USD -- -- 0.98 N X57E GY db x-trackers iBoxx Sov €zone 5-7 € 195 -- 0.15 NLSEK LN ETFS Long SEK Short USD -- -- 0.39 N CSBGC3 SW XMTCH Swiss Bond Dom Govt 1-3 € 167 2 0.22 NMain X-listings: SEKP LN (GBp) IBGL LN iShares BarCap € Govt Bond 15-30 € 161 31 0.20 NSGB3 LN ETFS 3X Short GBP Long USD -- -- 0.98 N Main X-listings: IBGL LN (GBP), IBGL SW (CHF)EUP3 LN ETFS 3X Long EUR Short GBP -- -- 0.98 N ETFES13 GY ETFlab iBoxx Liq Sov Diversifd 1-3 € 151 31 0.15 NGBNZ LN ETFS Long NZD Short GBP -- -- 0.39 N IGIL LN iShares Global Inflation-Linked € 149 86 0.25 NNZGB LN ETFS Short NZD Long GBP -- -- 0.39 N Main X-listings: SGIL LN (GBP), EGIL LN (EUR)JPP3 LN ETFS 3X Long JPY Short GBP -- -- 0.98 N MTE FP Lyxor ETF EuroMTS 10-15 Y € 138 -- 0.17 NXBJM GY ETFS Short CAD Long EUR -- -- 0.39 N CSBGE7 SW CSETF on iBoxx Eur Gov 3-7 € 138 40 0.23 NUSP3 LN ETFS 3X Long USD Short GBP -- -- 0.98 N Main X-listings: CE71 LN (GBP)CAGB LN ETFS Short CAD Long GBP -- -- 0.39 N IB83EX GY iShares iBoxx € LiqSov Cap 1.5-10.5 DE € 136 25 0.16 NLGB3 LN ETFS 3X Long GBP Short USD -- -- 0.98 N RXPXEX GY iShares eb.rexx Gov Germany 10.5+ € 129 11 0.16 NNOGB LN ETFS Short NOK Long GBP -- -- 0.39 N C33 FP Amundi ETF Euromts Broad 3-5 € 128 -- 0.14 NSKGB LN ETFS Short SEK Long GBP -- -- 0.39 N ETFIBOXG GY ETFLAB iBoxx Eur Liq Germany € 108 35 0.09 NAUP3 LN ETFS 3X Long AUD Short GBP -- -- 0.98 N XB13 GY db x-trackers iBoxx € Germany 1-3 € 107 -- 0.15 NSYP3 LN ETFS 3X Short JPY Long GBP -- -- 0.98 N CBOXGS1 GY ComStage Sov Germany Capped 1-5 € 104 -- 0.12 NLJP3 LN ETFS 3X Long JPY Short USD -- -- 0.98 N Main X-listings: CBOXGS1 SW (CHF)
CBOXES3M GY ComStage Eu Lq Sv Dv 3M-1-I € 101 -- 0.12 NMain X-listings: X501 SW (CHF)CBOXES5 GY ComStage Liquid Sov Diversifd 5-7 € 100 -- 0.12 N
Governments Main X-listings: CBOXES5 SW (CHF)RXP1EX GY iShares eb.rexx Gov Ger 1.5-2.5 DE € 1,424 6 0.16 N IB85EX GY iShares iBoxx € Liq Sov Cap 1.5-2.5 DE € 97 -- 0.16 NEM13 IM Lyxor ETF EuroMTS 1-3Y € 947 22 0.17 N IB89EX GY iShares iBoxx € Liq Sov Cap 2.5-5.5 € 96 15 0.16 NMTB FP Lyxor ETF EuroMTS 3-5 Y € 912 -- 0.17 N MTF FP Lyxor ETF EuroMTS 15+Y € 96 -- 0.17 NX13E IM db x-trackers iBoxx Sov €zone 1-3 € 895 -- 0.15 N PEU IM PowerShares EuroMTS Cash 3 Mth € 93 -- 0.15 NEBMMEX GY iShares eb.rexx Money Market DE € 795 8 0.13 N IB8ZEX GY iShares iBoxx € Liq SovCap 5.5-10.5 € 92 15 0.16 NXSGL IM db x-trackers Short iBoxx Sov €zone € 790 -- 0.15 N CB3 FP Amundi ETF Euromts Broad € 87 -- 0.14 NIBGS IM iShares € Gov Bond 1-3 € 741 10 0.20 N XBLC GY db x-trackers iBoxx € Liq Corp € 72 -- 0.20 NMain X-listings: IBGS LN (GBP), IBGS SW (CHF) X710 IM db x-trackers iBoxx Sov €zone 7-10 € 69 -- 0.15 NRXRGEX GY iShares eb.rexx Govt Germany DE € 724 25 0.16 N XBTR SW db x-trackers iBoxx Germany TR € 63 -- 0.15 NRXP2EX GY iShares eb.rexx Gov Ger 2.5-5.5 DE € 715 13 0.16 N C541 GY ComStage Germany Covered Cap € 61 -- 0.17 NIBCI NA iShares BarCap € Infl Linked Bond € 714 24 0.25 N Main X-listings: C541 SW (CHF)Main X-listings: IBCI LN (GBP), IBCI SW (CHF) X25E IM db x-trackers iBoxx Sov €zone 25+ € 57 -- 0.15 NSEMB LN iShares JPMorgan $ EM Bond Fund € 684 67 0.45 N 5X63 GY ComStage Future 2X Short € 56 -- 0.20 NMain X-listings: IEMB LN (USD), EEMB LN (GBP) Main X-listings: 5X63 SW (CHF)RXP5EX GY iShares eb.rexx Gov Germ 5.5-10.5 € 677 10 0.15 N ETFGS13 GY ETFlab DB EuroGov Germany 1-3 € 55 14 0.15 NETFGSMM GY ETFlab EuroGov Ger Money Market € 650 8 0.12 N CBOXGS5 GY ComStage Sov Germany Cap 5-10 € 54 -- 0.12 NXGLE IM db x-trackers iBoxx Sov Eurozone € 638 -- 0.15 N Main X-listings: CBOXGS5 SW (CHF)MTX FP Lyxor ETF EuroMTS Global € 628 147 0.17 N 5X62 GY ComStage Bond Future Short € 53 -- 0.20 NINXG LN iShares BarCap £ Index Linked Gilt € 624 16 0.25 N Main X-listings: 5X62 SW (CHF)MAA FP Lyxor EuroMTS AAA Gov Bond € 586 -- 0.17 N ISS FP EasyETF iBoxx Liq Sov Extra Short € 53 -- 0.15 NIHYG LN Ishares Markit iBoxx Eur H/Y € 566 -- 0.50 N ETFES71 GY ETFlab iBoxx Liq Sov Diversifi 7-10 € 52 28 0.15 NMain X-listings: SHYG LN (GBP) CBOXEINF GY ComStage Sov Infl-Link € Inflation € 51 -- 0.17 NEMI IM Lyxor EuroMTS Inflation Linked € 543 24 0.20 N Main X-listings: 8530 SW (CHF)IGLT LN iShares FTSE UK All Stocks Gilt € 524 36 0.20 N CBOXES7 GY ComStage Liq Sov Diversifd 7-10 € 49 -- 0.12 NMain X-listings: IGLT IM (EUR) Main X-listings: CBOXES7 SW (CHF)CSBGC7 SW Xmtch SBI Domestic Gov Bond 3-7 € 474 6 0.19 N CSBILE SW CS ETF On iBoxx € Infl.Link € 49 21 0.28 NMTC FP Lyxor ETF EuroMTS 5-7Y € 454 -- 0.17 N Main X-listings: CIE1 LN (GBP)IBGX IM iShares € Government Bond 3-5 € 453 17 0.20 N ISL FP EasyETF iBoxx Liq Sov Long € 48 -- 0.15 NMain X-listings: IBGX LN (GBP), IBGX SW (CHF) CBOXESOV GY ComStage Liq Sov Diversified € 48 -- 0.12 NIDBT LN iShares $ Treasury Bond 1-3 € 446 30 0.20 N CSBGC0 SW Xmtch SBI Domestic Govt 7+ € 47 5 0.25 NMain X-listings: IBTS IM (EUR), IBTS LN (GBP) JEG FP JPMorgan GBI EMU ETF € 46 -- 0.15 NX35E GY db-x iBoxx Sov Eurozone 3-5 TR € 441 -- 0.15 N
Fixed Income Funds
Currency Funds Fixed Income Funds

36
EMEA Listed ETFs
Ticker ETF NameTotal Assets
(€M)Stocks in
ETF (#)Exp. Ratio
(%)Options
Available Ticker ETF NameTotal Assets
(€M)Stocks in
ETF (#)Exp. Ratio
(%)Options
Available
Governments GovernmentsIEGY LN iShares Barc € Govt Bond 5-7 € 43 9 0.20 N XBUT LN db x iBoxx Gilts Total Return € 7 0.20 NMain X-listings: IBGY IM (EUR) JUL FP JPMorgan ETF GBI Local US € 7 -- 0.20 NEIE FP EasyETF iTraxx Europe Main € 41 125 0.15 N C10 FP Amundi Euromts Broad 10-15 € 7 -- 0.14 N5X61 GY ComStage Bond Fut Leveraged € 40 -- 0.20 N MBGE15 IT Clal - Mabat Gilon € 6 -- - NMain X-listings: 5X61 SW (CHF) US7 FP Amundi ETF US Treasury 7-10 € 6 -- 0.14 NXY4P GY db x-trackers Sov Eurozone € 38 124 0.15 N MBT2827 IT Clal - Mabat 20/80 € 6 -- - NXGSH IM db x-trackers Glbl Sov € Hedged € 37 -- 0.25 N XB4N GY db Liquid Corp 100 Non-Financials € 6 -- 0.20 NLEMB FP Lyxor iBoxx $ Liquid Emerging Mkt € 35 36 0.30 N MBT8228 IT Clal - Mabat 28 20/80 € 5 -- - NMain X-listings: EMKTB IM (EUR) TCLTMR8 IT Tachlit Gilon € 4 -- 0.40 NETFES57 GY ETFlab iBoxx Liq Sov Diversifd 5-7 € 35 29 0.15 N ETFES10 GY ETFlab iBoxx € Liquid Sov Div 10+ € 4 28 0.15 NCSBGU3 IM CSETF on iBoxx USD Gov 1-3 € 33 40 0.23 N JE1 FP JPMorgan GBI EMU 1-3Y € 4 -- 0.15 NMain X-listings: CSBGU3 SW (USD), CU31 LN (GBP) HDAS2 IT Hadas Indices - Galil Bonds 2-5Y € 4 -- - NPJS1 GY Pimco € Enh Short Maturity € 30 -- -- N XUT3 LN db x-trackers $ Treasury 1-3Y-1C € 4 0.15 NETFGS10 GY ETFlab DB EuroGov Germany 10+ € 28 11 0.15 N XBUI LN db x iBoxx Gilt Inflation linked € 4 0.25 NAGEB FP Amundi ETF Global Emrg Bnd € 27 -- 0.30 N SU7 FP Amundi ETF Short Treasury 7-10 € 3 -- 0.14 NS10 FP Amundi Short Govt Bond 10-15 € 27 -- 0.14 N HDAS3 IT Hadas Indices - Galil Bonds 5-7 Y € 3 -- - NCSBGU7 SW CSETF on iBoxx USD Gov 3-7 € 26 40 0.23 N KSMB5 IT KSM Government Linked Bond € 3 -- 0.40 NMain X-listings: CSBGU7 IM (EUR), CU71 LN (GBP) SB7CHI SW UBS SBI Swiss Gov 7-15 I € 3 -- 0.12 NCSBILU SW CSETF on iBoxx USD Infl.Link € 26 30 0.28 N JE4 FP JPMorgan GBI EMU 7-10Y € 3 -- 0.15 NMain X-listings: CSBILU IM (EUR), CIU1 LN (GBP) MBTLB41 IT Mabat Long Term Bond € 2 -- 0.40 NC542 GY ComStage Covered Cap 5-7 € 25 -- 0.17 N SB1CHA SW UBS SBI Swiss Gov 1-3 A € 2 -- 0.14 NMain X-listings: C542 SW (CHF) SB3CHI SW UBS SBI Swiss Gov 3-7 I € 2 -- 0.12 NCI3 IM Amundi ETF € Inflation € 25 -- 0.16 N HDAS1 IT Hadas Indices - Galil Bonds 0-2 Y € 2 -- - NSB0 IM Amundi Short Govt Bond € 25 -- 0.14 N MNGLN42 IT Mabat Short Term Bond € 2 -- 0.40 NZGOVI SJ Zshares GOVI € 23 9 0.34 N TLTGL30 IT Tachlit Makam € 2 -- - NS35 FP Amundi Short Govt Bond 3-5 € 23 -- 0.14 N PSMKM24 IT Psagot Sal Makam € 2 -- - NS71 IM Amundi Short Govt Bond 7-10 € 23 -- 0.14 N TALM613 IT Psagot - Tali Tel-Bond 60 Index € 2 -- - NCSBGE0 IM CSETF on iBoxx Eur Gov 7-10 € 22 39 0.23 N JE3 FP JPMorgan GBI EMU 5-7Y € 2 -- 0.15 NMain X-listings: CE01 LN (GBP) TALM412 IT Psagot - Tali Tel-Bond 40 Index € 2 -- - NFBIST TI Finans - FTSE Istanbul Bond € 22 16 0.51 N SB1CHI SW UBS SBI Swiss Gov 1-3 I € 2 -- 0.12 NIB87EX GY iShares iBoxx € Liq Sov Cap 10.5+ € 21 15 0.16 N MBGLL44 IT Clal - Mabat Galil 7-10 € 2 -- - NX105 GY db x-trackers iBoxx Sov €zone 10-15 € 20 -- 0.15 N US3 FP Amundi ETF US Treasury 3-7 € 2 -- 0.14 NX1G FP Amundi ETF ex Aaa Govt Bond € 20 -- 0.14 N US1 FP Amundi ETF US Treasury 1-3 € 2 -- 0.14 NXUTD LN db x-trackers iBoxx $ Treasury-1C € 20 0.15 N SU3 FP Amundi ETF Short Treasury 3-7 € 2 -- 0.14 NX15E IM db x-trackers iBoxx Sov €zone 15+ € 19 -- 0.15 N SU1 FP Amundi ETF Short Treasury 1-3 € 2 -- 0.14 N5X60 GY ComStage ETF Bond Future Tr € 19 -- 0.20 N TCGLL12 IT Tachlit Galil 2-5 € 2 -- 0.40 NMain X-listings: 5X60 SW (CHF) MBGLL43 IT Clal - Mabat Galil 2-5 € 2 -- - NUS10 LN Lyxor iBoxx $ Treasury 10Y+ € 19 -- 0.17 N INDX13 IT IndexSal Ltd - Index 75/25 € 2 -- - NC73 FP Amundi Euromts Broad 7-10 € 17 -- 0.14 N MBTSH45 IT Clal - Mabat Shahar 2-5 € 1 -- - NSEGA IM iShares BarCap € Treasury Bond € 17 255 0.20 N TCGLL20 IT Tachlit Galil 7-10 € 1 -- 0.40 NMain X-listings: SEGA LN (GBP) PSSHR16 IT Psagot - Tali Shahar 5+ € 1 -- - NETFES35 GY ETFlab iBoxx Liquid Sov Div 3-5 € 15 29 0.15 N MBGL16 IT Clal - Mabat Galil 5-7 € 1 -- - NPJS2 GY Pimco European Adv Govt Bond € 15 -- -- N KSMKM84 IT KSM Makam 84 € 1 -- - NIEGE NA iShares BarCap € Treasury Bond 0-1 € 14 28 0.20 N HDSHSH1 IT Hadas Indices - SHKL SH1 € 1 -- - NMain X-listings: IBGE LN (GBP) PSSHR15 IT Psagot - Tali Shahar 2-5 € 1 -- - NC3M IM Amundi EuroMTS Cash 3 Months € 13 -- 0.14 N TCSHR13 IT Tachlit Shahar 5+ € 1 -- 0.40 NS13 FP Amundi Short Govt Bond 1-3 € 13 -- 0.14 N KSGLL83 IT KSM Galil € 1 -- 0.40 NXBAT GY db x-trackers iBoxx Sov €zone AAA € 12 -- 0.15 N KTBSK88 IT Ksm Tel Bond Shekel € 1 -- - NJE2 FP JPMorgan GBI EMU 3-5Y ETF € 12 -- 0.15 N TCSHR11 IT Tachlit Shahar € 1 -- 0.40 NGILI LN Lyxor iBoxx UK Gilt Infl-Lnk € 12 -- 0.22 N INDX20 IT IndexSal - Index 90/10 € 1 -- - NGILS LN Lyxor iBoxx Gilts € 12 -- 0.18 N TCSHR22 IT Tachlit Shahar 2-5 € 1 -- 0.40 NKSMG710 IT KSM GALIL 7-10 € 11 -- 0.40 N TCGLL19 IT Tachlit Galil 0-2 € 1 -- 0.40 NCBOXGS10 GY ComStage Sov Germany Capped 10+ € 11 -- 0.12 N MBSHR14 IT Clal - Mabat Shahar 5+ € 1 -- - NMain X-listings: CBOXGS10 SW (CHF) PSSHR14 IT Psagot - Tali Shahar 0-2 € 1 -- - NS5B FP Amundi Short Govt Bond 5-7 € 10 -- 0.14 N MBGL237 IT Clal - Mabat Galil 0-2 € 1 -- - NKSMGL25 IT KSM GALIL 2-5 € 10 -- 0.40 N TCSHR21 IT Tachlit Shahar 0-2 € 1 -- 0.40 NC543 GY ComStage iBoxx € Cov Cap 7-10 € 10 -- 0.17 N TLGLN11 IT Tali Non-Linked Float Int Gov Bond € 1 -- - NMain X-listings: C543 SW (CHF) PSGGL23 IT Psagot Sal Galil 2-5 € 1 -- - NCBOXGS3M GY ComStage Sov Germany Cap 3m-2 € 10 -- 0.12 N SB7CHA SW UBS SBI Swiss Gov 7-15 A € 1 -- 0.14 NMain X-listings: 8520 SW (CHF) P950526 IT Psagot 9505 € 1 -- - NCBOXES15 GY ComStage Liquid Sov Div. 15+ € 10 -- 0.12 N SB3CHA SW UBS SBI Swiss Gov 3-7 A € 1 -- 0.14 NIEGZ LN iShares Barc € Govt Bond 10-15 € 10 15 0.20 N MBTS236 IT Clal - Mabat Shahar 0-2 € 1 -- - NMain X-listings: IBGZ LN (GBP) KSMGLBND IT KSM IL Gillon Gov Bonds € 1 5 0.40 NC540 GY ComStage iBoxx € Germany Cov.Cap € 10 -- 0.12 N INDXM24 IT INDEX GOV/5 24 € 1 -- - NMain X-listings: C540 SW (CHF) INDEX22 IT IndexSal - INDEX 22 € 1 -- - NCBOXES25 GY ComStage Liq Sov Div 25+ € 10 -- 0.12 N INDX36 IT IndexSal - Galil Bonds 2-5Y € 1 -- - NCBOXES10 GY ComStage Liq Sov Div 10-15 € 10 -- 0.12 N INDXM25 IT IndexSal - INDEX GOV/20 25 € 1 -- - NMain X-listings: CBOXES10 SW (CHF) P802027 IT Psagot 8020 € 1 -- - NXUIT LN db x-trackers $ IG Infl-link Treasury € 9 -- 0.20 N INDG35 IT IndexSal - Gilon Government Bonds € 1 -- - NXIF5 IM db x-trackers Euro Infl. Swap 5 Year € 9 -- 0.20 N KSMSH5 IT KSM SHAHAR 5+ € 1 5 0.40 NUS13 LN Lyxor iBoxx $ Treasury 1-3 Yr € 9 -- 0.17 N INBND62 IT IndexSal - Index Bond 62 € 1 -- - NAM3A FP Amundi ETF Aaa Gov Bd Euromts € 9 -- 0.14 N KSMSH02 IT KSM SHAHAR 0-2 € 1 2 - NETFES11 GY ETFlab iBoxx Liquid Sov Div 1-10 € 9 30 0.15 N P901028 IT Psagot 9010 € 1 -- 0.70 NC53 FP Amundi ETF Euromts Broad 5-7 € 9 -- 0.14 N KSMSH25 IT KSM SHAHAR 2-5 € 1 4 0.40 NUS57 LN Lyxor iBoxx $ Treasury 5-7 Yr € 8 -- 0.17 N MBBND74 IT Mabat Short Galil 2-5 € 1 -- - NCSBGU0 SW CSETF on iBoxx USD Gov 7-10 € 8 14 0.23 N MBSHA35 IT Clal - Mabat Short Shahar 5+ € 1 -- - NMain X-listings: CSBGU0 IM (EUR), CU01 LN (GBP) KSMSHBND IT KSM Il Shahar Bond € 1 -- 0.40 NXUGS LN db x UK Gilts Short Daily 1C € 8 0.25 N PSTLB34 IT Psagot Sal Alphabeta General € 1 -- 0.40 N
Fixed Income FundsFixed Income Funds

37
EMEA Listed ETFs
Ticker ETF NameTotal Assets
(€M)Stocks in
ETF (#)Exp. Ratio
(%)Options
Available Ticker ETF NameTotal Assets
(€M)Stocks in
ETF (#)Exp. Ratio
(%)Options
Available
Governments (continued) Corporates / Mortgage-backed (continued)PSG9031 IT Psagot Sal Alphabeta 90/10 D € 1 -- 0.50 N KSMTLBND IT KSM Tel Bond € 8 20 0.30 NPSG10 IT Psagot Sal AlphaBeta 9010 Gov € 1 -- 0.70 N TCMR15 IT Tachlit Tel Bond 60 ReInvest € 8 -- 0.35 NHDAS4 IT Hadas Indices - Galil Bonds 7-10 Y € 1 -- - N TCMR14 IT Tachlit Tel Bond 40 ReInvest € 8 -- 0.35 NPSG4032 IT Psagot Sal Alphabeta 60/40 € 1 -- - N TCMR16 IT Tachlit Tel Bond 20 ReInvest € 8 -- 0.30 NKSMGL02 IT KSM GALIL 0-2 € 1 -- - N KSBND64 IT KSM Tel Bond 60 € 8 60 0.35 NINKOR44 IT IndexSal - Index Korea 44 -- -- - N XB4F GY db Corp 100 Financials € 5 -- 0.20 NPSGGL45 IT Psagot Sal Galil 5-10 -- -- 0.40 N EIV FP EasyETF iTraxx Europe Hivol € 5 -- 0.20 NINDXM26 IT IndexSal - INDEX BON/15 26 -- -- - N XTH5 IM db x iTraxx HiVol 5Y Short TR € 5 -- 0.21 NINDXM29 IT IndexSal - INDEX GOVBND 29 -- -- - N TLTLBD1 IT Psagot - Tali Tel-Bond 20 Index € 3 -- 0.35 NHDS257 IT Hadas Indices Shahar 2-5 -- -- - N TGBND7 IT Tachlit TEL BOND € 3 -- 0.35 NINBND61 IT IndexSal - Index Bond 61 -- -- - N KSBND63 IT KSM Tel Bond 40 € 3 40 0.35 NHDS58 IT Hadas Indices Shahar 5+ -- -- - N MBB6049 IT Clal - Mabat Tel-Bond 60 € 2 -- - NHDS206 IT Hadas Indices Shahar 0-2 -- -- - N MBB4048 IT Clal - Mabat Tel-Bond 40 € 2 -- - NPSGGL22 IT Psagot Sal Galil 0-2 -- -- - N KSRTTBX2 IT KSM SHORT Tel Bond X2 daily € 2 20 - NM901078 IT Mabat 90/10 GOV -- -- - N HRLTB60 IT Harel Sal Tel-Bond 60 € 1 60 0.35 NINDX23 IT IndexSal - Index 80/20 -- -- - N HRLTB20 IT Harel Sal Tel-Bond 20 € 1 20 0.30 NHRLGLL25 IT Harel Sal Galil 2-5 -- 4 0.40 N KSMIBXH IT KSM High Bond € 1 -- 1.00 NHRLSHA IT Harel Sal Shachar 0-2 -- 4 0.40 N HRLTB40 IT Harel Sal Tel-Bond 40 € 1 40 0.40 NHRLGIL IT Harel Sal Gilon -- 5 0.40 N MTB2033 IT Clal - Mabat Short Tel Bond 20 € 1 -- - NHRLGLL02 IT Harel Sal Galil 0-2 -- 7 0.40 N PTBSK61 IT Psagot Sal Tel Bond Shekel € 1 -- - NXCS2 GY db x-trackers Australia Bonds TR -- 0.25 N MBT4061 IT Mabat Short Tel Bond 40 € 1 -- - NEFGJI SW EFG FP Bonus Coupon ETSF -- -- 0.89 N TBN6028 IT Tachlit Short Tel Bond 60 -- -- - NTA10050 IT Tachlit T100 50 -- -- 0.50 N D3V3 GY CFS db € Liquid Corporate 12.5 -- -- 0.35 NTBND247 IT Tachlit Bnd2 47 -- -- 0.50 N AA1RMS GY Access iBoxx $ HY Corp TR ETN -- -- 0.52 NTBND146 IT Tachlit Bnd2 46 -- -- 0.30 N AA1RMQ GY Access iBoxx € Liq Corp TR ETN -- -- 0.32 NT901034 IT Tchlit 9010 34 -- -- 0.50 N AA1RMR GY Access iBoxx £ Liq Corp TR ETN -- -- 0.52 NHR8542 IT Harel Sal 85/15 -- -- 0.50 N HTBSK24 IT Harel Tel Bond-Shekel -- -- 0.35 NTC95535 IT Tchlit 95 5 35 -- -- 0.50 N Money MarketHR9141 IT Harel Sal 90/10 -- -- 0.50 N LEONIA IM Lyxor € Cash EuroMTS Eonia Inv € 1,199 -- 0.15 NTMKGL36 IT Tachlit Mkgll 36 -- -- 0.40 N XEON GY db x-trackers EONIA Total Return € 1,144 -- 0.15 NHRSRT40 IT Harel Sal 95/5 -- -- 0.40 N BBVAM SQ AFI Monetario Euro ETF/FI € 762 34 0.05 NTCMR31 IT Tachlit TCT CMP Shaha31 -- -- - N CBEONIA GY ComStage Commerz EONIA TR € 461 -- 0.10 NTBNSK45 IT Tachlit Bndsk 45 -- -- - N Main X-listings: CBEONIA SW (CHF)TCTLB45 IT Tachlit Tlbnd45 -- -- - N XGBP LN db x-trackers Sterling Money Market € 289 -- 0.15 NTCMR33 IT Tachlit Tct Cmp Galil 33 -- -- - N CE3 FP Amundi ETF EONIA € 171 -- 0.14 NTFN1530 IT Tachlit Finc15 30 -- -- 0.50 N XCCR GY db x-trackers Currency Returns € 142 -- 0.30 NBIPINF SJ BIPS Govt Infl-linked Bond Fund -- 6 0.45 N XEO2 LN db x-trackers EONIA Tr 2C € 122 0.15 NHRSHR20 IT Harel General Sahar -- -- 0.40 N XFFE IM db x-trackers Fed Funds Eff Rate TR € 110 -- 0.15 NHRBND22 IT Harel Non-Linked Gov Bonds -- -- 0.40 N BBVAD SQ AFI Bonos Medio Plazo Euro ETF € 96 37 0.15 NCorporates / Mortgage-backed XST FP db x-trackers Sonia TR € 83 -- 0.15 NIBCX LN iShares Markit iBoxx € Corp Bond € 3,362 90 0.20 N CBFEDFER GY ComStage FED Funds Eff Rate € 66 -- 0.10 NMain X-listings: IBCX SW (CHF) Main X-listings: CBFEDFER SW (CHF)SLXX LN iShares Markit iBoxx £ Corp Bond € 1,270 58 0.20 N XUSD LN db x-trackers US Dollar Money Mkt € 34 -- 0.15 NR1JKEX GY iShares eb.rexx Jumbo Pfandbriefe € 1,201 25 0.10 N XCCC GY db x-trackers Currency Carry € 31 -- 0.30 NIEAC NA iShares Barclays € Corporate Bond € 1,084 1,138 0.20 N XVAL GY db x-trackers Currency Valuation € 12 -- 0.30 NMain X-listings: IEBC LN (GBP) XMOM GY db x-trackers Currency Momentum € 6 -- 0.30 NLQDE LN iShares Markit iBoxx $ Corp Bond € 615 35 0.20 N EFFUSD FP EasyETF EuroMTS Fed Funds € 5 -- 0.15 NMain X-listings: LQDE IM (EUR) MBTS76 IT Clal - Mabat Sh Tel Bnd Shekel -- -- - NCRPE IM Lyxor ETF Euro Corporate Bond € 551 -- 0.20 N XEOD IM db x-trackers EONIA TR-1D -- -- 0.15 NIEAG LN iShares Barclays € Aggregate Bond € 411 1,367 0.25 NMain X-listings: IEAG NA (EUR)XBCT GY db x-trackers iBoxx Germany Covd € 344 -- 0.15 NXTXC IM db x-trackers II iTraxx Xover 5Y € 287 -- 0.24 N Broad CommoditiesEEXF LN iShares Barc. € Corp Bond ex-Fin € 233 637 0.20 N XDBC LN db x-trackers DBLCI-OY Balanced € 1,065 -- 0.55 NMain X-listings: IEXF LN (EUR) Main X-listings: XDBD LN (USD), XDBC GY (EUR)ISXF LN iShares iBoxx £ Corp Bond ex-Fin € 148 295 0.20 N CRB IM Lyxor ETF Commodities CRB € 1,014 19 0.35 NMain X-listings: IEX5 LN (EUR) Main X-listings: CRB SW (USD)CC4 FP Amundi ETF Euro Corporates € 143 -- 0.16 N AIGC LN ETFS All Cmdty DJ-UBSCISM € 630 -- 0.49 NXTXE GY db x-trackers II iTraxx Eur. 5Y TR € 140 -- 0.18 N Main X-listings: AGCP LN (GBP), OD7V GY (EUR)EUNS GY iShares Euro Corp Bond ex Fin 1-5 € 140 394 0.20 N DJC FP iShares DJ AIG Commodity Swap € 510 28 0.47 NMain X-listings: EEX6 LN (GBP) CBCOMM GY ComStage Commodity EW Index € 474 -- 0.30 NECB FP Lyxor EuroMTS Cov Bond Aggr € 117 83 0.17 N Main X-listings: CBCOMM SW (CHF), C090US SW (USD)ETFLCD GY ETFlab iBoxx € Liq Corp Div € 114 83 0.20 N GSCIEUR GY EasyETF S&P GSCI € 453 -- 0.30 NCNB FP Lyxor Euro Corp Bond ex Fin € 105 20 0.20 N MRIC SW RBS Jim Rogers Intl Cmdty Index € 343 -- 0.85 NIE15 LN iShares Barc. Euro Corp Bond 1-5 € 77 614 0.20 N Main X-listings: M9SA GY (EUR), RICI LN (GBP)Main X-listings: SE15 LN (GBP) GSCIUSD SW EasyETF S&P GSCI € 311 -- 0.30 NSCOV LN iShares iBoxx Euro Covered Bond € 102 75 0.20 N LCTY LN Lyxor ETF CRB IDX € 115 19 0.35 NMain X-listings: ICOV LN (EUR) TCMCI SW UBS ETC CMCI - USD € 86 -- 0.38 NYIEL FP Lyxor ETF iBoxx EUR Liquid H/Y € 56 30 0.45 N COMF LN ETFX DJ-UBS All Cmdty Frd 3M-$ € 76 19 0.55 NXTC5 IM db x-trackers iTraxx Xover 5Y Short TR € 51 -- 0.24 N Main X-listings: CMFP LN (GBP), ETL2 GY (EUR)EIC FP EasyETF iTraxx Europe Crossover € 44 -- 0.25 N CCUSIS SW UBS-ETF CMCI Comp SF-$I € 74 0.45 NCOUK LN Lyxor iBoxx £ Corporates € 35 -- 0.20 N DCUSIS SW UBS DJ UBS CMDTY USD I ACC € 74 0.62 NXTXH IM db x-trackers II ITraxx HIVol 5Y € 25 -- 0.21 N XBCU LN db x-trackers DBLCI-OY Blnced USD € 70 NXSB5 IM db x-trackers iTraxx Eur Sub Fin 5Y € 12 -- 0.21 N LYCRN SW Lyxor ETF Cmdty CRB Non-Energy USD € 60 15 0.35 NXSN5 IM db x-trackers iTraxx Eur Snr Fin 5Y € 12 -- 0.18 N CNE FP EasyETF S&P GSNE € 49 -- 0.30 NXSNS IM db x iTraxx EurSnrFin5Y Short € 11 -- 0.18 N LCNE LN Lyxor ETF CRB Non-Energy € 36 15 0.35 NMBTB24 IT Clal - Mabat Tel-Bond 20 € 11 -- - N Main X-listings: LCNU LN (USD)XSBS IM db x iTraxx Eur Sub Fin 5Y Short € 10 -- 0.21 N XCBC SW db Cmdty Booster DJ-UBSCI ETF € 32 -- 0.95 NXTE5 GY db x iTraxx Eur 5Y Short € 9 -- 0.18 N
Fixed Income Funds Fixed Income Funds
Commodity Funds

38
EMEA Listed ETFs
Ticker ETF NameTotal Assets
(€M)Stocks in
ETF (#)Exp. Ratio
(%)Options
Available Ticker ETF NameTotal Assets
(€M)Stocks in
ETF (#)Exp. Ratio
(%)Options
Available
Broad Commodities (continued) Metals (continued)FAIG LN ETFS Fwd Cmdty DJ-UBSCI-F3SM € 31 -- 0.49 N AIGP LN ETFS Precious Metals DJ-AIGSM € 155 -- 0.49 NMain X-listings: FAIG IM (EUR) Main X-listings: AIGP IM (EUR)XCBL GY db x-trackers S&P GSCI Light Energy € 24 -- 0.95 N MRMI SW Market Access RICISM-M € 87 -- 0.85 NAIGX LN ETFS Ex-Energy DJ-UBSCISM € 20 -- 0.49 N Main X-listings: M9SC GY (EUR), RICM LN (GBP)Main X-listings: AIGX IM (EUR) XAD2 GY db Physical Silver € Hedge € 86 -- 0.75 NXEM8 LN db Mean Reversion ETC € 19 -- 0.45 N LSIL LN ETFS Leveraged Silver € 78 -- 0.98 N9J6I GY RBS - RICI Enhanced Index ETC € 12 -- 0.85 N Main X-listings: LSIL IM (EUR)XCTE GY db Commodity Booster € Hedge € 11 -- 0.45 N SLVR LN ETFS Silver € 70 -- 0.49 NCCUSAS SW UBS CMCI COMPOSITE SF-$A € 11 -- 0.65 N Main X-listings: SLVR IM (EUR)XACTRAVA SS XACT Commodity € 8 15 0.70 N JBSIEA SW JB Physical Silver-A € € 68 -- 0.60 NLALL LN ETFS Lev. All Cmdty DJ-UBSCI x2 € 7 -- 0.98 N Main X-listings: JBSIUA SW (USD), JBSICA SW (CHF), JBSIGA SW (GBP)Main X-listings: LALL IM (EUR) SCOP LN ETFS Short Copper € 68 -- 0.98 NNEG FP Amundi ETF GSCI Non-Energy € 5 -- 0.30 N Main X-listings: 9GA4 GY (EUR)XET5 LN db S&P GSCI ETC € 3 -- 0.85 N XAD3 GY db Physical Platinum € € 64 -- 0.75 NSALL LN ETFS Short All Cmdty DJ-UBSCI € 2 -- 0.98 N NICK LN ETFS Nickel € 52 -- 0.49 NMain X-listings: SALL IM (EUR) Main X-listings: NICK IM (EUR)EXEF LN ETFS Fwd Ex-Energy UBSCI-F3SM € 1 -- 0.49 N ALUM LN ETFS Aluminium € 47 -- 0.49 NMain X-listings: EXEF IM (EUR) Main X-listings: ALUM IM (EUR)LNEY LN ETFS Lev. Ex-Energy DJ-UBSCI € 1 -- 0.98 N FIND LN ETFS Fwd Ind Met DJ-UBSCI-F3SM € 35 -- 0.49 NMain X-listings: 4RTU GY (EUR) Main X-listings: FIND IM (EUR)XCT5 LN db Commodity Booster ETC € 1 -- 0.45 N XSIL LN db Physical Silver ETC € 33 -- 0.45 NSGSULE GY Source S&P GSCI Ultra Light T-Bill € 1 -- 0.49 N SPMETL GY Source S&P GSCI Prec Mets T-Bill € 30 -- 0.49 NTDBLCI8 IT Psagot Sal - DB Liquid Commodity € 1 -- - N Main X-listings: SPMETL SW (USD)KSMCMDT IT KSM Commodities € 1 -- 1.20 N ZINC LN ETFS Zinc € 25 -- 0.49 NXEMR GY db Mean Reversion EUR Hedge € 1 -- 0.45 N Main X-listings: ZINC IM (EUR), SNEY LN ETFS Short Ex-Energy DJ-UBSCI -- -- 0.98 N XURA LN db Uranium ETC € 25 -- 3.60 NMain X-listings: 9GAV GY (EUR) XPLA LN db Physical Platinum ETC € 22 -- 0.45 NSPGS LN iPath S&P GSCI TR Index ETN -- -- 0.75 N XAD6 GY db Physical Silver ETC € € 22 -- 0.45 NMain X-listings: SPGS GY (EUR) JBPLEA SW JB Phyical Platinum-A € € 18 -- 0.50 NDJUB LN iPath DJ-UBS Cmdty Tr ETN -- -- 0.75 N Main X-listings: JBPLUA SW (USD), JBPLCA SW (CHF), JBPLGA SW (GBP)Main X-listings: DJUB GY (EUR) SIMT LN ETFS Short Ind Metals DJ-UBSCI € 14 -- 0.98 NSNONEN GY Source S&P GSCI Non-Energy T-Bill -- -- 0.49 N Main X-listings: 9GAX GY (USD)TCM3M SW UBS CMCI 3M Constant Mat - US$ -- -- -- N XAD4 GY db Physical Palladium € € 14 -- 0.75 NEDJCM SW UBS DJ Constant Mat € Hedge -- -- 0.62 N SSIL LN ETFS Short Silver € 14 -- 0.98 NTDJCM SW UBS DJ Constant Maturity -- -- 0.50 N Main X-listings: SSIL IM (EUR)MLCU NA Torrus Funds - ML Commodity Extra -- 18 -- N SIMETL GY Source S&P GSCI Ind Met T-Bill € 14 -- 0.49 NCMCG LN UBS ETC Composite GBP -- -- 0.88 N Main X-listings: SIMETL SW (USD)CMDG LN UBS CMCI DJ-UBS £ -- -- 1.00 N LPLA LN ETFS Leveraged Platinum € 14 -- 0.98 NFLEG LN UBS CMSP £ -- -- 1.00 N Main X-listings: LPLA IM (EUR)CMCE LN UBS Composite € -- -- 0.50 N LCOP LN ETFS Leveraged Copper € 12 -- 0.98 NECMCI SW UBS ETC CMCI - EUR -- -- 0.50 N Main X-listings: LCOP IM (EUR)CMDE LN UBS CMCI DJ-UBS € -- -- 0.62 N PHCU LN ETFS Physical Copper € 11 -- 0.69 NFLEE LN UBS CMSP € -- -- 0.62 N CME FP Amundi ETF GSCI Metals € 11 -- 0.30 NESSG LN UBS ETC Essence GBP -- -- 1.25 N Main X-listings: CMEV IM (EUR)ACTG LN UBS CMCI Active £ -- -- 1.75 N SZIC LN ETFS Short Zinc € 10 -- 0.98 NTCM1Y SW UBS CMCI 1Y Constant Mat - US$ -- -- -- N Main X-listings: 4RTL GY (EUR)ESSE LN UBS Essence € -- -- 0.87 N PHSN LN ETFs Physical Tin € 9 -- 0.69 NCCMCI SW UBS ETC CMCI - CHF -- -- 0.81 N SNIK LN ETFS Short Nickel € 9 -- 0.98 NCMCI LN UBS ETC Composite USD -- -- 0.38 N LPMT LN ETFS Lev'd Prec Metals DJ-UBSCI € 9 -- 0.98 NACTE LN UBS CMCI Active € -- -- 1.37 N Main X-listings: PHAU IX (USD)CDJCM SW UBS DJ Constant Mat CHF Hedge -- -- 0.72 N XPAL LN db Physical Palladium ETC € 9 -- 0.45 NECMAM SW UBS CMCI Active EUR ETC -- -- 1.37 N JBPAEA SW JB Physical Palladium-A € € 8 -- 0.50 NTCM6M SW UBS CMCI 6M Constant Mat - US$ -- -- -- N Main X-listings: JBPAUA SW (USD), JBPACA SW (CHF), JBPAGA SW (GBP)CMDJ LN UBS CMCI DJ-UBS -- -- 1.00 N PTUSA SW UBS Platinum ETF A € 7 -- 0.40 NFLEU LN UBS ETC Cmsp USD -- -- 0.50 N Main X-listings: PTCHA SW (CHF)ESSU LN UBS Essence US$ -- -- 0.75 N JBSIEX SW JB Physical Silver-Ax € € 7 -- 0.60 NCCMAM SW UBS CMCI Active CHF ETC -- -- 1.47 N Main X-listings: JBSIUX SW (USD), JBSIGX SW (GBP)ACTI LN UBS CMCI Active US$ -- -- 1.25 N JBPLEX SW JB Physical Platinum-Ax Eur € 6 -- 0.50 NTCMAM SW UBS CMCI Active USD ETC -- -- 1.25 N Main X-listings: JBPLUX SW (USD), JBPLCX SW (CHF), JBPLGX SW (GBP)XCBE GY db Cmdty Booster DJ-UBSCI -- 19 0.95 N STEE LN ETFX DaxGlobal Steel Fund € 6 28 0.65 NMetals Main X-listings: STEP LN (GBP), STEE IM (EUR)ZSIL SW ZKB Silver ETF € 1,285 -- 0.60 N XETD GY db Industrial Metals Eur Hdg € 6 -- 0.45 NPHAG LN ETFS Physical Silver € 625 -- 0.49 N XCTG GY db Industrial Metals Booster € 6 -- 0.45 NMain X-listings: PHAG IM (EUR), PHAG IM (JPY) 9J6K GY RBS RICI Enhanced Ind Metals € 5 -- -- NPHPT LN ETFS Physical Platinum € 556 -- 0.49 N LALU LN ETFS Leveraged Aluminium € 5 -- 0.98 NMain X-listings: PHPT IM (EUR) Main X-listings: LALU IM (EUR)ZPLA SW ZKB Platinum ETF € 474 -- 0.50 N LNIK LN ETFS Leveraged Nickel € 4 -- 0.98 NPHPD LN ETFS Physical Palladium € 314 -- 0.49 N Main X-listings: 4RUD GY (EUR)Main X-listings: PHPD IM (EUR) XET7 LN db S&P GSCI Industrial Metal € 4 -- 0.85 NZSILUS SW ZKB Silver ETF US$ € 297 -- 0.60 N LLEA LN ETFS Leveraged Lead € 3 -- 0.98 NZSILEU SW ZKB Silver ETF € € 294 -- 0.60 N Main X-listings: 4RUL GY (EUR)ZPAL SW ZKB Palladium ETF € 259 -- 0.50 N SCOPP GY Source S&P GSCI Copper T-Bill € 3 -- 0.49 NPHPM LN ETFS Physical PM Basket € 254 -- 0.43 N Main X-listings: SCOPP SW (USD)Main X-listings: PHPM IM (EUR) JBPAEX SW JB Physical Palladium-Ax € € 3 -- 0.50 NAIGI LN ETFS Ind. Metals DJ-UBSCISM € 243 -- 0.49 N Main X-listings: JBPAUX SW (USD), JBPACX SW (CHF), JBPAGX SW (GBP)Main X-listings: AIGI IM (EUR) LZIC LN ETFS Leveraged Zinc € 3 -- 0.98 NCOPA LN ETFS Copper € 185 -- 0.49 N Main X-listings: 4RUK GY (EUR)Main X-listings: COPA IM (EUR)
Commodity Funds Commodity Funds

39
EMEA Listed ETFs
Ticker ETF NameTotal Assets
(€M)Stocks in
ETF (#)Exp. Ratio
(%)Options
Available Ticker ETF NameTotal Assets
(€M)Stocks in
ETF (#)Exp. Ratio
(%)Options
Available
Metals (continued) Metals (continued)SALU LN ETFS Short Aluminium € 2 -- 0.98 N SIL2S SW UBS ETC 2x Short CMCI Silver -- -- 1.05 NMain X-listings: SALU IM (EUR) PLAE LN SG ETN Platinum € -- -- 0.50 NSSILVR GY Source S&P GSCI Silver T-Bill € 2 -- 0.49 N PLAU LN SG ETN Platinum US$ -- -- 0.50 NLIME LN ETFS Lev Ind Metal DJ-UBSCI € 2 -- 0.98 N COPG LN SG ETN Copper £ -- -- 0.50 NMain X-listings: 4RTW GY (EUR) PHPP LN ETFS Physical PM Basket - £ -- 0.42 NPLTT LN ETFS Platinum Individual Securities € 2 -- 0.49 N COPE LN SG ETN Copper € -- -- 0.50 NXCT7 LN db Industrial Metals Booster € 2 -- 0.45 N ZING LN SG ETN Zinc £ -- -- 0.50 NPTUSI SW UBS Platinum ETF A € 2 -- 0.28 N ZINE LN SG ETN Zinc € -- -- 0.50 NMain X-listings: PTCHI SW (CHF) COPU LN SG ETN Copper US$ -- -- 0.50 NTGSLVR2 IT Tachlit Silver € 2 -- - N ALMG LN SG ETN Aluminum £ -- -- 0.50 NTINM LN ETFS Tin € 2 -- 0.49 N PLCHA SW UBS Palladium ETF A -- -- 0.40 NLTIM LN ETFS Leveraged Tin € 2 -- 0.98 N ZINU LN SG ETN Zinc US$ -- -- 0.50 NMain X-listings: 4RUN GY (EUR) ALME LN SG ETN Aluminum € -- -- 0.50 NPHNI LN ETFS Physical Nickel € 2 -- 0.69 N NCLG LN SG ETN Nickel £ -- -- 0.50 NSPMT LN ETFS Short Prec Metals DJ-UBSCI € 1 -- 0.98 N NCLE LN SG ETN Nickel € -- -- 0.50 NMain X-listings: 9GA0 GY (EUR) SLVG LN SG ETN Silver £ -- -- 0.50 NSPLA LN ETFS Short Platinum € 1 -- 0.98 N ALMU LN SG ETN Aluminum US$ -- -- 0.50 NMain X-listings: 4RTN GY (EUR) SLVE LN SG ETN Silver € -- -- 0.50 NLEED LN ETFS Lead € 1 -- 0.49 N NCLU LN SG ETN Nickel US$ -- -- 0.50 NSNICKL GY Source S&P GSCI Nickel TR T-Bill € 1 -- 0.49 N PHSP LN ETFS Physical Silver £ -- -- 0.49 NSZINC GY Source S&P GSCI Zinc TR T-Bill € 1 -- 0.49 N SLVU LN SG ETN Silver US$ -- -- 0.50 NSLEA LN ETFS Short Lead € 1 -- 0.98 N SBAS1 SJ Standard Bank Silver-Linker -- -- 0.50 NMain X-listings: 4RTM GY (EUR) SBAPD1 SJ Standard Bank Palladium -- -- 0.50 NSALUMI GY Source S&P GSCI Aluminum T-Bill -- -- 0.49 N SBAPL1 SJ Standard Bank Platinum-Linker -- -- 0.50 NSTIM LN ETFS Short Tin -- -- 0.98 N EPMCI SW UBS ETC Precious Metals - € -- -- 0.61 NMain X-listings: 4RTP GY (EUR) GoldIMET GY iPath S&P GSCI Industrial Metal -- -- 0.75 N PHAU LN ETFS Physical Gold € 4,018 -- 0.39 NMain X-listings: IMET LN (GBP) Main X-listings: PHAU IM (EUR)PMET GY iPath S&P GSCI Prec Metals -- -- 0.75 N GBS LN Gold Bullion Securities Ltd € 3,831 -- 0.40 NMain X-listings: PMET LN (GBP) Main X-listings: GBS FP (EUR)SVCHI SW UBS Silver ETF I -- -- 0.36 N ZGLD SW ZKB Gold ETF € 3,810 -- 0.40 NPLCHI SW UBS Palladium ETF I -- -- 0.28 N GLD SJ NewGold Issuer Ltd € 1,633 -- -- NSILG LN UBS ETC Silver £ -- -- 0.87 N ZGLDUS SW ZKB Gold ETF-A USD € 1,032 -- 0.40 NPREG LN UBS ETC Precious Metals £ -- -- 0.99 N CSGOLD SW Xmtch CH On Gold € 940 -- 0.33 NSIL2L SW UBS ETC 2x Long CMCI Silver -- -- 1.05 N JBGOEA SW JB Physical Gold Fnd-A € 738 -- 0.60 NMSUG LN UBS ETC Copper £ -- -- 0.87 N Main X-listings: JBGOUA SW (USD), JBGOGA SW (GBP)SILE LN UBS ETC Silver € -- -- 0.49 N ZGLDEU SW ZKB Gold ETF-A EUR € 734 -- 0.40 NESICI SW UBS ETC Silver - € -- -- 0.49 N SGLD LN Source Physical Markets Gold € 684 -- 0.29 NPREE LN UBS ETC Precious Metals € -- -- 0.61 N ZGLDHC SW ZKB Gold ETF-H CHF € 348 -- 0.40 NMSUE LN UBS ETC Copper € -- -- 0.49 N XAD1 GY db Physical Gold € Hedged € 315 -- 0.59 NELPCI SW UBS ETC Copper - € -- -- 0.49 N AUUSA SW UBS Gold ETF USD - A € 295 -- 0.28 NPLTG LN UBS ETC Platinum £ -- -- 0.99 N Main X-listings: AUUSAC SW (CHF)TSICI SW UBS ETC Silver - US$ -- -- 0.37 N AUCHAH SW UBS Gold ETF Hedged CHF € 263 -- 0.28 NSILU LN UBS ETC Silver US$ -- -- 0.37 N ZGLDHE SW ZKB Gold ETF Hedged € € 219 -- 0.40 NELLCI SW UBS ETC Lead - € -- -- 0.49 N CSGLDC SW CSETF on Gold Hedged CHF € 217 -- 0.41 NCSICI SW UBS ETC Silver - CHF -- -- 0.80 N CSGLDE SW CSETF on Gold Hedged € € 159 -- 0.41 NINDG LN UBS ETC Industrial Metals £ -- -- 0.87 N SGBS LN ETFS Physical Swiss Gold € 146 -- 0.39 NTLPCI SW UBS ETC Copper - US$ -- -- 0.37 N Main X-listings: GZUR GY (EUR)CLPCI SW UBS ETC Copper - CHF -- -- 0.81 N BULL LN ETFS Gold € 127 -- 0.49 NPLTE LN UBS ETC Platinum € -- -- 0.61 N Main X-listings: BULL IM (EUR), BULP LN (GBP)MSUU LN UBS ETC Copper US$ -- -- 0.37 N AUEUAH SW UBS Gold € Hedged ETF A € 104 -- 0.28 NPREC LN UBS ETC Precious Metals US$ -- -- 0.49 N XGLD LN db Physical Gold ETC € 96 -- 0.29 NTPMCI SW UBS ETC Precious Metals - US$ -- -- 0.49 N JBGOEX SW JB Physical Gold Fund € € 92 -- 0.40 NEPLCI SW UBS ETC Platinum - € -- -- 0.61 N Main X-listings: JBGOUX SW (USD), JBGOGX SW (GBP)CPMCI SW UBS ETC Precious Metals - CHF -- -- 0.92 N XAD5 GY db Physical Gold ETC € € 66 -- 0.29 NEIMCI SW UBS ETC Industrial Metals - € -- -- 0.49 N LBUL LN ETFS Leveraged Gold € 55 -- 0.98 NINDE LN UBS ETC Industrial Metals -- -- 0.49 N Main X-listings: 4RT8 GY (EUR)TLLCI SW UBS ETC Lead - US$ -- -- 0.37 N GLDTR TI Istanbul Gold ETF € 47 -- 0.47 NCLLCI SW UBS ETC Lead - CHF -- -- 0.81 N SBUL LN ETFS Short Gold € 25 -- 0.98 NCPLCI SW UBS ETC Platinum - CHF -- -- 0.92 N Main X-listings: SBUL IM (EUR)PLTI LN UBS ETC Platinum US$ -- -- 0.49 N AUCHIH SW UBS Gold Hedged CHF € 24 -- 0.24 NTPLCI SW UBS ETC Platinum - US$ -- -- 0.49 N AUUSI SW UBS Gold ETF USD - I € 16 -- 0.24 NALUG LN UBS ETC Aluminum £ -- -- 0.87 N XOB2 GY RBS Physical Gold ETC € 11 -- 0.28 NCIMCI SW UBS ETC Industrial Metals - CHF -- -- 0.81 N ZGLDGB SW ZKB Gold ETF-A £ € 7 -- 0.40 NTIMCI SW UBS ETC Industrial Metals - US$ -- -- 0.37 N ZGLDHG SW ZKB Gold ETF-H £ € 7 -- 0.40 NALUE LN UBS ETC Aluminum € -- -- 0.49 N AUEUIH SW UBS Gold € Hedged ETF I € 6 -- 0.24 NINDU LN UBS ETC Industrial Metals US$ -- -- 0.37 N KSMGLD IT KSM Gold € 3 -- 1.00 NELACI SW UBS ETC Aluminium - € -- -- 0.49 N XETB GY db Monthly Short Gold € Hedge € 2 -- 0.45 NELNCI SW UBS ETC Nickel - € -- -- 0.49 N SGOLD GY Source S&P GSCI Gold T-Bill Sec € 2 -- 0.49 NELXCI SW UBS ETC Zinc - € -- -- 0.49 N GOLE LN SG ETN Gold € -- -- 0.40 NALUU LN UBS ETC Aluminum US$ -- -- 0.37 N GLDG LN UBS ETC Gold £ -- -- 0.76 NCLACI SW UBS ETC Aluminium - CHF -- -- 0.81 N EGCCI SW UBS ETC Gold - EUR -- -- 0.38 NTLACI SW UBS ETC Aluminium - US$ -- -- 0.37 N GLDE LN UBS ETC Gold € -- -- 0.26 NCLNCI SW UBS ETC Nickel - CHF -- -- 0.81 N GLD2L SW UBS ETC 2x Long CMCI Gold -- -- 0.94 NTLNCI SW UBS ETC Nickel - US$ -- -- 0.37 N GLDD LN UBS ETC Gold US$ -- -- 0.26 NTLXCI SW UBS ETC Zinc - US$ -- -- 0.37 N TGCCI SW UBS ETC Gold - USD -- -- 0.26 NCLXCI SW UBS ETC Zinc - CHF -- -- 0.81 N CGCCI SW UBS ETC Gold - CHF -- -- 0.66 NSVCHA SW UBS Silver ETF A -- -- 0.48 N GLD2S SW UBS ETC 2x Short CMCI Gold -- -- 0.94 NPLAG LN SG ETN Platinum £ -- -- 0.50 N GOLG LN SG ETN Gold £ -- -- 0.40 N
Commodity Funds Commodity Funds

40
EMEA Listed ETFs
Ticker ETF NameTotal Assets
(€M)Stocks in
ETF (#)Exp. Ratio
(%)Options
Available Ticker ETF NameTotal Assets
(€M)Stocks in
ETF (#)Exp. Ratio
(%)Options
Available
Gold (continued) Soft Commodities (continued)FYGLD NA RBS Physical Gold ETC -- -- 0.29 N SCOTN GY Source S&P GSCI Cotton T-Bill € 3 -- 0.49 NLTNG LN Lyxor ETN Gold -- -- 0.65 N SSUGAR GY Source S&P GSCI Sugar T-Bill € 3 -- 0.49 NMain X-listings: GOLDL IM (EUR) Main X-listings: SSUGAR SWGBSS LN Gold Bullion Securities Ltd - £ -- -- 0.40 N SCFE LN ETFS Short Coffee € 3 -- 0.98 NGOLDS IM Lyxor ETN Short Gold -- -- 0.45 N Main X-listings: 9GA3 GY (EUR)GOLDP TI Kuveyt Turk Katilim - Goldp -- -- 0.49 N LSFT LN ETFS Leveraged Softs DJ-UBSCI € 3 -- 0.98 NSBAG1 SJ Standard Bank Gold-Linker -- -- 0.50 N Main X-listings: 4RT0 GY (EUR)PGOLD60 IT Psagot Sal Gold -- -- 1.00 N SOYO LN ETFS Soybean Oil € 3 -- 0.49 NMBGLD64 IT Mabat Gold -- -- -- N Main X-listings: SOYO IM (EUR)HRGLD33 IT Harel Sal Gold -- -- 1.00 N LGRA LN ETFS Leveraged Grains DJ-UBSCI € 3 -- 0.98 NSoft Commodities Main X-listings: 4RTV GY (EUR)AIGA LN ETFS Agriculture DJ-UBSCI € 964 -- 0.49 N LSOB LN ETFS Leveraged Soybeans € 2 -- 0.98 NMain X-listings: AIGA IM (EUR), AGAP LN (GBP) Main X-listings: 4RUG GY (EUR)MRAI SW Market Access RICISM-A Index € 217 -- 0.85 N SCOFF GY Source S&P GSCI Coffee T-Bill € 2 -- 0.49 NMain X-listings: RICIAG IM (EUR) XCT6 LN db Agriculture Booster ETC € 2 -- 0.45 NWEAT LN ETFS Wheat € 100 -- 0.49 N SGSCI GY Source S&P GSCI T-Bill Sec € 2 -- 0.49 NMain X-listings: WEAT IM (EUR) Main X-listings: SGSCI SW (USD)CORN LN ETFS Corn € 94 -- 0.49 N SCOR LN ETFS Short Corn € 2 -- 0.98 NMain X-listings: CORN IM (EUR) LLHO LN ETFS Leveraged Lean Hogs € 2 -- 0.98 NTAGCI SW UBS ETC Agriculture - US$ € 71 -- 0.47 N Main X-listings: 4RUA GY (EUR)AIGG LN ETFS Grains DJ-UBSCISM € 60 -- 0.49 N SAGR LN ETFS Short Agriculture DJ-UBSCI € 2 -- 0.98 NMain X-listings: AIGG IM (EUR), AGGP LN (GBP) Main X-listings: 9GAS GY (EUR)FAGR LN ETFS Fwd Agri DJ-UBSCI-F3SM € 46 -- 0.49 N SSOB LN ETFS Short Soybeans € 1 -- 0.98 NMain X-listings: FAGR IM (EUR) Main X-listings: 4RTH GY (EUR)SUGA LN ETFS Sugar € 39 -- 0.49 N FLIV LN ETFS Fwd Livestk DJ-UBSCI-F3SM € 1 -- 0.49 NMain X-listings: SUGA IM (EUR) Main X-listings: 9GAN GY (EUR)SOYB LN ETFS Soybeans € 36 -- 0.49 N LSYO LN ETFS Leveraged Soybean Oil € 1 -- 0.98 NMain X-listings: SOYB IM (EUR) Main X-listings: 4RUF GY (EUR)AIGL LN ETFS Livestock DJ-UBSCI € 35 -- 0.49 N LLST LN ETFS Leveraged Livestk DJ-UBSCI € 1 -- 0.98 NMain X-listings: AIGL IM (EUR) Main X-listings: 4RTX GY (EUR)COTN LN ETFS Cotton € 34 -- 0.49 N SLIVE GY Source S&P GSCI Livestock T-Bill € 1 -- 0.49 NMain X-listings: COTN IM (EUR) SSYO LN ETFS Short Soybean Oil € 1 -- 0.98 NGSALEUR GY EasyETF S&P GSAL € 32 -- 0.30 N Main X-listings: 4RTG GY (EUR)SSOFT GY Source S&P GSCI Softs T-Bill € 31 -- 0.49 N SLCT LN ETFS Short Live Cattle € 1 -- 0.98 NSCORN GY Source S&P GSCI Corn T-Bill € 24 -- 0.49 N Main X-listings: 4RTC GY (EUR)Main X-listings: SCORN SW (USD) SCOC LN ETFS Short Cocoa € 1 -- 0.98 NXCTF GY db Agriculture Booster € € 23 -- 0.45 N Main X-listings: 4RTQ GY (EUR)AIGS LN ETFS Softs DJ-AIGSM € 23 -- 0.49 N SGRA LN ETFS Short Grains DJ-UBSCI € 1 -- 0.98 NMain X-listings: AIGS IM (EUR) Main X-listings: 9GAW GY (EUR)COFF LN ETFS Coffee € 21 -- 0.49 N LLCT LN ETFS Leveraged Live Cattle -- -- 0.98 NMain X-listings: COFF IM (EUR) Main X-listings: 4RUB GY (EUR)HOGS LN ETFS Lean Hogs € 19 -- 0.49 N HOGF LN ETFS Forward Lean Hogs -- -- 0.49 NMain X-listings: HOGS IM (EUR) CATF LN ETFS Forward Live Cattle -- -- 0.49 NCATL LN ETFS Live Cattle € 17 -- 0.49 N SSOYB GY Source S&P GSCI Soybeans T-Bill -- -- 0.49 NMain X-listings: CATL IM (EUR) Main X-listings: SSOYB SWSFARM GY Source S&P GSCI Agri T-Bill S € 17 -- 0.49 N AGGS LN iPath S&P GSCI Agri Tr ETN -- -- 0.75 NMain X-listings: SFARM SW (USD) Main X-listings: AGGS GY (EUR)LAGA LN ETFS Lev Agriculture DJ-UBSCI € 14 -- 0.98 N SOFT LN iPath S&P GSCI Softs ETN -- -- 0.75 NMain X-listings: LAGR IM (EUR) Main X-listings: SOFT GY (EUR)CA8 FP Amundi ETF GSCI Agri € 13 -- 0.30 N SLHO LN ETFS Short Lean Hogs -- -- 0.98 NMain X-listings: CA8 IM (EUR) Main X-listings: SLHO PZ (EUR)LWEA LN ETFS Leveraged Wheat € 12 -- 0.98 N MOOO GY iPath S&P GSCI Livestock ETN -- -- 0.75 NMain X-listings: LWEA IM (EUR) Main X-listings: MOOO LN (GBP)COCO LN ETFS Cocoa € 11 -- 0.49 N SEED LN iPath S&P GSCI Grains Tr ETN -- -- 0.75 NSSUG LN ETFS Short Sugar € 11 -- 0.98 N Main X-listings: SEED GY (EUR)Main X-listings: 4RTJ GY (EUR) SSFT LN ETFS Short Softs DJ-UBSCI -- -- 0.98 NSCTO LN ETFS Short Cotton € 11 -- 0.98 N SLST LN ETFS Short Livestock DJ-UBSCI -- -- 0.98 NMain X-listings: 9GA6 GY (EUR) Main X-listings: 9GAY GY (EUR)SWEA LN ETFS Short Wheat € 11 -- 0.98 N ESYCI GY UBS ETC Soybeans € -- -- 0.46 NMain X-listings: 4RTK GY (EUR) Main X-listings: TSYCI SW (USD), CSYCI SW (CHF)SWHEAT GY Source S&P GSCI Wheat T-Bill € 11 -- 0.49 N AA1KH4 GY Access Cocoa Enhanced TR -- -- 0.25 N9J6J GY RBS RICI Enhanced Agriculture € 11 -- 0.85 N AA1KH3 GY Access Cocoa Enhanced TR Quanto -- -- 0.25 NGRAF LN ETFS Fwd Grains DJ-UBSCI-F3SM € 11 -- 0.49 N AA1KPW GY Access Corn Enhanced TR -- -- 0.52 NMain X-listings: GRAF IM (EUR) AA1KPX GY Access Corn Enhanced TR Quanto -- -- 0.32 N9J6L GY RBS RICI Enhanced Grains ETC € 7 -- -- N AA1KPU GY Access Wheat Enhanced TR -- -- 0.25 NSOFF LN ETFS Fwd Softs DJ-UBSCI-F3SM € 5 -- 0.49 N AA1KPV GY Access Wheat Enhanced TR Quanto -- -- 0.30 NMain X-listings: SOFF IM (EUR) TLHCI SW UBS ETC Lean Hogs - US$ -- -- 0.54 NLCOR LN ETFS Leveraged Corn € 5 -- 0.98 N ELCCI SW UBS ETC Live Cattle - € -- -- 0.61 NMain X-listings: 4RT4 GY (EUR) TSMCI SW UBS ETC Soybean Meal - US$ -- -- 0.53 NXET6 LN db S&P GSCI Agri ETC € 5 -- 0.85 N SUGG LN UBS ETC Sugar £ -- -- 1.13 NLCTO LN ETFS Leveraged Cotton € 5 -- 0.98 N COCG LN UBS ETC Cocoa £ -- -- 1.06 NMain X-listings: 4RT5 GY (EUR) SUGE LN UBS ETC Sugar € -- -- 0.74 NSGRAIN GY Source S&P GSCI Grains T-Bill € 4 -- 0.49 N ESBCI SW UBS ETC Sugar - € -- -- 0.74 NMain X-listings: SGRAIN SW (USD) ECTCI SW UBS ETC Cotton - € -- -- 0.58 NLSUG LN ETFS Leveraged Sugar € 4 -- 0.98 N COCE LN UBS ETC Cocoa € -- -- 0.68 NLCOC LN ETFS Leveraged Cocoa € 4 -- 0.98 N EQCCI SW UBS ETC Cocoa - € -- -- 0.68 NMain X-listings: 4RUP GY (EUR) FOOG LN UBS ETC Food £ -- -- 1.05 NLCFE LN ETFS Leveraged Coffee € 4 -- 0.98 N ESYCI SW UBS ETC Soybeans - € -- -- 0.58 NMain X-listings: 4RT2 GY (EUR) CSBCI SW UBS ETC Sugar - CHF -- -- 1.07 N
Commodity Funds Commodity Funds

41
EMEA Listed ETFs
Ticker ETF NameTotal Assets
(€M)Stocks in
ETF (#)Exp. Ratio
(%)Options
Available Ticker ETF NameTotal Assets
(€M)Stocks in
ETF (#)Exp. Ratio
(%)Options
Available
Soft Commodities (continued) Energy (continued)EAGCI SW UBS ETC Agriculture - € -- -- 0.55 N OILUSA SW UBS - CMCI Oil ETF US$ Sf € 19 -- 0.45 NSUGU LN UBS ETC Sugar US$ -- -- 0.63 N AIGO LN ETFS Petroleum DJ-UBSCI € 17 -- 0.49 NCCTCI SW UBS ETC Cotton - CHF -- -- 0.90 N Main X-listings: AIGO IM (EUR)EKCCI SW UBS ETC Coffee - € -- -- 0.66 N SEWTI GY Source S&P GSCI Crude Oil T-Bill € 17 -- 0.49 NCQCCI SW UBS ETC Cocoa - CHF -- -- 0.99 N Main X-listings: SEWTI SW (USD)FOOE LN UBS ETC Food € -- -- 0.63 N HEAT LN ETFS Heating Oil € 15 -- 0.49 NTSBCI SW UBS ETC Sugar - US$ -- -- 0.63 N Main X-listings: HEAT IM (EUR)TQCCI SW UBS ETC Cocoa - US$ -- -- 0.56 N EENCI SW UBS ETC Energy - EUR € 15 -- 0.52 NCOCU LN UBS ETC Cocoa US$ -- -- 0.56 N NGAF LN ETFS Forward Natural Gas € 14 -- 0.49 NEFOCI SW UBS ETC Food - € -- -- 0.63 N Main X-listings: 9GAQ GY (EUR)CSYCI SW UBS ETC Soybeans - CHF -- -- 0.90 N UGAS LN ETFS Gasoline € 14 -- 0.49 NTSYCI SW UBS ETC Soybeans - US$ -- -- 0.46 N Main X-listings: UGAS IM (EUR)CRNG LN UBS ETC Corn £ -- -- 0.97 N 9J6Q GY RBS - GSCI Brent ETC € 12 -- 0.35 NCAGCI SW UBS ETC Agriculture - CHF -- -- 0.84 N OSB1 LN ETFS Brent 1yr € 12 -- 0.49 NAGRY LN UBS ETC Agriculture US$ -- -- 0.47 N 9J6M GY RBS RICI Enhanced Brent Crude € 12 -- -- NTKCCI SW UBS ETC Coffee - US$ -- -- 0.54 N FCRU LN ETFS Forward Crude Oil € 10 -- 0.49 NCKCCI SW UBS ETC Coffee - CHF -- -- 0.98 N 9J6N GY RBS - RICI Enhanced WTI Crude € 10 -- 0.85 NERRCI SW UBS ETC Rough Rice € -- -- 1.08 N OILEUA SW UBS CMCI Oil ETF € Sf - A € 10 -- 0.45 NEWWCI SW UBS ETC Wheat - € -- -- 0.59 N FPET LN ETFS Fwd Petrol. DJ-UBSCI-F3SM € 10 -- 0.49 NCRNE LN UBS ETC Corn € -- -- 0.59 N Main X-listings: FPET IM (EUR)TBOCI SW UBS ETC Soybean Oil - US$ -- -- 0.53 N 9J6R GY RBS GSCI WTI ETC € 9 -- 0.35 NFOOD LN UBS ETC Food US$ -- -- 0.55 N SGSLE GY Source S&P GSCI Light T-Bill € 9 -- 0.49 NTFOCI SW UBS ETC Food - US$ -- -- 0.55 N Main X-listings: SGSLE SWCFOCI SW UBS ETC Food - CHF -- -- 0.92 N CL7 FP Amundi S&P GSCI Light Energy € 8 -- 0.30 NECNCI SW UBS ETC Corn - € -- -- 0.59 N Main X-listings: CL7 IM (EUR)LVSG LN UBS ETC Livestock £ -- -- 1.04 N SENERGY GY Source S&P GSCI Energy T-Bill € 7 -- 0.49 NCWWCI SW UBS ETC Wheat - CHF -- -- 0.91 N Main X-listings: SENERG SW (USD)TWWCI SW UBS ETC Wheat - US$ -- -- 0.47 N GSDEUR GY EasyETF S&P GSCI Lgt En Dynamic € 7 -- 0.30 NCRRCI SW UBS ETC Rough Rice CHF -- -- 1.18 N XET8 LN db S&P GSCI Energy € 6 -- 0.85 NCRNU LN UBS ETC Corn US$ -- -- 0.47 N OILUSI SW UBS CMCI WTI Crude Oil € 6 -- 0.26 NTRRCI SW UBS ETC Rough Rice US$ -- -- 0.96 N ENGCI SW UBS ETC Natural Gas - € € 5 -- 0.52 NCCNCI SW UBS ETC Corn - CHF -- -- 0.91 N OSW2 LN ETFS WTI 2yr € 5 -- 0.49 NTCNCI SW UBS ETC Corn - US$ -- -- 0.47 N 9J6P GY RBS RICI Enhanced Natural Gas € 5 -- 0.85 NLIVE LN UBS ETC Livestock € -- -- 0.66 N SNGA LN ETFS Short Natural Gas € 5 -- 0.98 NCLCCI SW UBS ETC Live Cattle - CHF -- -- 0.93 N Main X-listings: 4RTD GY (EUR)TLCCI SW UBS ETC Live Cattle - US$ -- -- 0.49 N 9J6S GY RBS GSCI Natural Gas € 5 -- 0.35 NELHCI SW UBS ETC Lean Hogs - € -- -- 0.66 N XCT9 LN db x-tracker WTI Crude Oil Booster € 5 -- 0.45 NLIVD LN UBS ETC Livestock US$ -- -- 0.54 N OSW3 LN ETFS WTI 3yr € 4 -- 0.49 NCLHCI SW UBS ETC Lean Hogs - CHF -- -- 0.98 N XCT8 LN db x-tracker Energy Booster € Hedge € 4 -- 0.45 NAGCG LN SG ETN Agriculture £ -- -- 0.50 N OSB3 LN ETFS Brent 3yr € 3 -- 0.49 NMain X-listings: AGCE LN, AGCU LN XCT2 LN db x-tracker Natural Gas Booster € 3 -- 0.45 NSOYG LN SG ETN Soybeans £ -- -- 0.50 N XETA GY db x Monthly Short Oil € Hedge € 3 -- 0.45 NMain X-listings: SOYE LN, SOYU LN OSW1 LN ETFS WTI 1yr € 3 -- 0.49 NWHEG LN SG ETN Wheat £ -- -- 0.50 N OSB2 LN ETFS Brent 2yr € 2 -- 0.49 NMain X-listings: WHEE LN, WHEU LN XCTH GY db Energy Booster € Hedge € 2 -- 0.45 NCONG LN SG ETN Corn £ -- -- 0.50 N OILCHI SW UBS CMCI Oil ETF Chf Sf-I € 2 -- 0.26 NMain X-listings: CON SG ETN Wheat US$ -- -- 0.50 N XCTK GY db Natural Gas Booster € € 2 -- 0.45 NKSAG86TA IT KSM Agriculture -- 1.20 N LNRG LN ETFS Leveraged Energy DJ-UBSCI € 1 -- 0.98 NTCTCI SW UBS-ETF Cotton -- -- 0.46 N Main X-listings: 4RTT GY (EUR)AGRG LN UBS ETC Agriculture £ -- -- 0.97 N SNGAS GY Source S&P GSCI Nat Gas T-Bill € 1 -- 0.49 NAGRE LN UBS ETC Agriculture € -- -- 0.55 N Main X-listings: SNGAS SW (USD)WHTG LN UBS ETC Wheat £ -- -- 0.97 N LGAS LN ETFS Leveraged Gasoline € 1 -- 0.98 NWHTE LN UBS ETC Wheat € -- -- 0.59 N SNRG LN ETFS Short Energy DJ-UBSCI € 1 -- 0.98 NWHTU LN UBS ETC Wheat US$ -- -- 0.47 N Main X-listings: 9GAU GY (EUR)Energy CARB LN ETFS Carbon € 1 -- 0.49 NCRUD LN ETFS Crude Oil € 451 -- 0.49 N Main X-listings: CARP LN (GBP)Main X-listings: CRUD IM (EUR) LHEO LN ETFS Leveraged Heating Oil € 1 -- 0.98 NNGAS LN ETFS Natural Gas € 379 -- 0.49 N Main X-listings: 4RT9 GY (EUR)Main X-listings: NGAS IM (EUR) TGBRNT1 IT Tachlit Oil € 1 -- - NOILB LN ETFS Brent 1mth Oil Securities € 291 -- 0.49 N KSMOIL IT KSM Oil € 1 -- - NMain X-listings: OILB IM (EUR), OLBP LN (GBP) SWTI GY Source S&P GSCI Crude Oil T-Bill € 1 -- 0.49 NLNGA LN ETFS Leveraged Natural Gas € 278 -- 0.98 N LPET LN ETFS Lev. Petroleum DJ-UBSCI € 1 -- 0.98 NMain X-listings: LNGA IM (EUR) Main X-listings: 4RTY GY (EUR)AIGE LN ETFS Energy DJ-UBSCI € 167 -- 0.49 N SPETRO GY Source S&P GSCI Petrol Tr Bill -- -- 0.49 NMain X-listings: AIGE IM (EUR) SHEA LN ETFS Short Heating Oil -- -- 0.98 NXETC GY db Brent Crude Oil € Hedge € 132 -- 0.45 N SGAS LN ETFS Short Gasoline -- -- 0.98 NLOIL LN ETFS Leveraged Crude Oil € 111 -- 0.98 N Main X-listings: 9GA8 GY (EUR)Main X-listings: LOIL IM (EUR) SPET LN ETFS Short Petroleum DJ-UBSCI -- -- 0.98 NOILCHA SW UBS CMCI Oil ETF CHF Sf-A € 8 -- 0.45 N Main X-listings: 9GAZ GY (EUR)ECLCI SW UBS ETC WTI Crude Oil - EUR € 86 -- 0.42 N HEAF LN ETFS Forward Heating Oil -- -- 0.49 NCUE FP EasyETF S&PGSCI Ultra-LG Energy € 77 -- 0.30 N TCFU22 IT Tachlit Short Oil/ETC -- -- 1.00 NOILW LN ETFS WTI 2mth Oil US$ Hedge € 67 -- 0.49 N NRGY LN iPath S&P GSCI Energy Tr ETN -- -- 0.75 NMain X-listings: OILW IM (EUR), OLWP LN (GBP) Main X-listings: NRGY GY (EUR)CCLCI SW UBS ETC WTI Crude CHF Hedge € 55 -- 0.72 N AA1HXT GY Access RICI Enh. Brent Crude Oil -- -- 0.25 NENEF LN ETFS Fwd Energy DJ-UBSCI-F3SM € 39 -- 0.49 N AA1HXS GY Access RICI Enh WTI Crude Oil -- -- 0.25 NMain X-listings: ENEF IM (EUR) AA1HXV GY Access RICI Enh BrentCrude Oil -- -- 0.25 NTENCI SW UBS ETC Energy - USD € 30 -- 0.40 N AA1HXU GY Access RICI Enh WTI Crude Oil -- -- 0.25 NSOIL LN ETFS Short Crude Oil € 26 -- 0.98 N NGSP LN ETFS Natural Gas - £ -- 0.49 NMain X-listings: SOIL IM (EUR) AA1KP3 GY Access RICI Enhanced Gas Oil TR -- -- 0.52 N
Commodity Funds Commodity Funds

42
EMEA Listed ETFs
Ticker ETF NameTotal Assets
(€M)Stocks in
ETF (#)Exp. Ratio
(%)Options
Available
Energy (continued)AA12GS GY Access RICI Enhcd Nat Gas -- -- 0.60 NAA12GR GY Access RICI Enhcd Nat Gas Quanto -- -- 0.60 NTCO6M SW UBS ETC Brent Crude 6M Cons Mat -- -- -- NEXBCI SW UBS ETC Gasoline - € -- -- 0.52 NTXBCI SW UBS ETC Gasoline - US$ -- -- 0.40 NTHOCI SW UBS ETC Heating Oil - US$ -- -- 0.40 NTCL6M SW UBS ETC WTI Crude 6M Cons Mat -- -- -- NLCOG LN UBS ETC Brent £ -- -- 0.80 NOILL LN UBS ETC WTI Crude Oil £ -- -- 0.80 NOIL2L SW UBS 2x Long CMCI WTI Crude Oil -- -- 0.98 NLCOE LN UBS ETC Brent € -- -- 0.42 NECOCI SW UBS ETC Brent Crude - € -- -- 0.42 NOILE LN UBS ETC WTI Crude Oil € -- -- 0.42 NENRG LN UBS ETC ENERGY £ -- -- 0.90 NTCO1Y SW UBS ETC Brent Crude 1Y Cons Mat -- -- -- NCXBCI SW UBS ETC Gasoline - CHF -- -- 0.84 NTCL1Y SW UBS ETC WTI Crude 1Y Cons Mat -- -- -- NTCOCI SW UBS ETC Brent Crude - US$ -- -- 0.30 NLCOU LN UBS ETC Brent US$ -- -- 0.30 NCCOCI SW UBS ETC Brent Crude - CHF -- -- 0.72 NENRE LN UBS ETC Energy € -- -- 0.52 NTCLCI SW UBS ETC WTI Crude Oil - US$ -- -- 0.30 NTCO3M SW UBS ETC Brent Crude 3M Cons Mat -- -- -- NOILD LN UBS ETC WTI CRUDE OIL US$ -- -- 0.30 NTQSCI SW UBS ETC Gasoil - US$ -- -- 0.40 NTCL3M SW UBS ETC WTI Crude 3M Cons Mat -- -- -- NENER LN UBS ETC Energy US$ -- -- 0.40 NCENCI SW UBS ETC Energy - CHF -- -- 0.84 NESS2L SW UBS ETC 2X Long CMCI Essence -- -- 0.99 NNATG LN UBS ETC Natural Gas £ -- -- 0.90 NNATE LN UBS ETC Natural Gas € -- -- 0.52 NNATU LN UBS ETC Natural Gas US$ -- -- 0.40 NTNGCI SW UBS ETC Natural Gas - US$ -- -- 0.40 NCNGCI SW UBS ETC Natural Gas - CHF -- -- 0.84 NOILL IM Lyxor ETN Oil -- -- 0.65 NOIL2S SW UBS 2x Short CMCI WTI Crude 3M -- -- 0.98 NCRDG LN SG ETN Crude Oil £ -- -- 0.40 NCRDE LN SG ETN Crude Oil € -- -- 0.40 NOILS IM Lyxor ETN Short Oil -- -- 0.75 NCRDU LN SG ETN Crude Oil US$ -- -- 0.40 NGASG LN SG ETN Natgas £ -- -- 0.50 NGASE LN SG ETN Natgas € -- -- 0.50 N
Commodity Funds

43
Asia-Pacific Listed ETFs
Ticker ETF NameTotal Assets
($M)Stocks in
ETF (#)Exp. Ratio
(%)Options
Available Ticker ETF NameTotal Assets
($M)Stocks in
ETF (#)Exp. Ratio
(%)Options
Available
XAXJ SP db x-trackers MSCI Asia Ex Jp $924 - 0.65 N China (continued)IAA AU iShares S&P Asia 50 $230 50 0.52 N 150022 CH SYWG Shenzhen Stock Growth Clss - - - NASEAN SP CIMB FTSE Asean 40 $165 40 0.75 N 159905 CH ICBC Shenzhen DVD Price ETF - - - N2815 HK Lyxor ETF MSCI AC Asia Ex Jp $123 679 0.65 N 008201 TT WISE - SSE 50 China Tracker - - 0.14 NAEJ SP Lyxor ETF MSCI AC Asia Ex Jp $123 679 0.65 N Hong Kong3010 HK iShares MSCI Asia Apex 50 $48 50 0.59 N 2800 HK Tracker Fund Of Hong Kong $6,712 45 0.10 Y2802 HK iShares MSCI Emerging Asia $31 116 0.59 N 2833 HK Hang Seng Index ETF $3,895 45 0.10 N3032 HK iShares MSCI Asia Apex M/C $22 50 0.59 N IHK AU iShares MSCI Hong Kong Index $1,968 41 0.53 N3004 HK iShares MSCI Asia Apex S/C $14 142 0.59 N 3022 HK DCI DA Cheng HK Private-Own $30 - 0.80 NAPEX SP Lyxor ETF MSCI Asia Apex50-B $13 50 0.50 N HSI SP Lyxor ETF Hang Seng Index 10 $25 45 0.65 N3043 HK db x-trackers MSCI Pac Ex Jp $8 - 0.45 N 3077 HK DCI DA Cheng HK State-Owned $20 - 0.80 NXPXJ SP db x-trackers MSCI Pac Ex Jp $8 - 0.45 N 2825 HK WISE - CSI HK100 Tracker $20 - 0.99 NXMAS SP db x-trackers MSCI EM Asia $6 - 0.65 N HSBEES IN Hang Seng BeES $13 - 1.00 N3035 HK db x-trackers MSCI EM Asia $6 - 0.65 N 0081 TT Hang Seng Index ETF $1 42 0.10 NAER SP Lyxor ETF MSCI AC Asia Ex Jp - - 0.65 N India
INDIA SP iShares MSCI India $826 60 1.05 N3015 HK db x-trackers S&P CNX Nifty $373 - 0.85 NXNIF SP db x-trackers S&P CNX Nifty $373 - 0.85 N
Australia INR SP Lyxor ETF MSCI India $293 - 0.85 NSTW AU SPDR S&P/ASX 200 $2,395 199 0.29 Y 2810 HK Lyxor ETF MSCI India $293 - 0.85 NSFY AU SPDR S&P/ASX 50 $280 50 0.29 N 2836 HK iShares BSE Sensex India $279 30 0.99 NVAS AU Vanguard Aust Shares Idx $228 - 0.27 N NBEES IN Nifty Exch - Nifty BeES $131 50 0.50 NLF1 SP db x-trackers - S&P/ASX 200 ETF $198 - 0.50 N MOSTM50 IN Motilal Oswal Most Shares $40 48 1.00 NRDV AU Russell High Dvd Aus Shares $145 51 0.46 N 1678 JP Next F India CNX Nifty $43 50 0.95 NOZY NZ Smartshares NZX Aus 20 Leaders $82 20 0.75 N LNFU SP Lyxor ETF India S&P CNX Nifty $43 50 0.85 NSYI AU SPDR MSCI Aus Select Dvd $51 - 0.35 N JBEES IN Nifty Exch - Junior BeES $24 50 1.00 NILC AU iShares S&P/ASX 20 Index Fd $46 20 0.24 N 1549 JP Nikko ETF S&P CNX Nifty India $11 - 0.55 NMZY NZ Smartshares NZX Aus M/C $44 32 0.75 N LG8 SP db x-trackers MSCI India TRN $9 - 0.75 NIOZ AU iShares MSCI Australia 200 Idx Fd $41 199 0.19 N KOTSS IN Kotak Sensex ETF $9 30 0.50 NISO AU iShares S&P/ASX Small Ord Idx $29 160 0.55 N KONIFTY IN Kotak Nifty 50 $5 50 0.50 NIHD AU iShares S&P/ASX High Dvd $26 49 0.30 N ICSPICE IN Prudential ICICI - Sensex Spice $0 30 0.80 NChina QINDEX IN Quantum Index Fund $0 50 0.50 N2823 HK iShares A50 China Tracker $7,847 50 0.99 Y SUNDER IN S&P CNX Nifty UTI SUNDER $0 50 0.35 NIZZ AU iShares FTSE China 25 $6,884 25 0.73 N SBEES IN Shariah Benchmark ETF BeES $0 30 1.00 N510050 CH China 50 ETF $3,454 56 0.60 N Indonesia159901 CH E Fund SI100 Index $3,193 115 0.50 N R/LQ45X IJ Premier ETF LQ-45 $3,405 - 0.70 N0080 TT Hang Seng H-Share Index ETF $2,797 44 0.60 N XMIN SP db x-trackers MSCI Indonesia TRN $110 - 0.65 N2828 HK Hang Seng H-Share Index ETF $2,797 44 0.60 N Japan510170 CH GTJA Allianz SSE Cmdty Equity Idx $2,475 - - N 1306 JP Nomura ETF Topix $8,302 1,668 0.11 Y2827 HK WISE - CSI 300 China Tracker $1,025 - 1.39 Y 1321 JP Nomura ETF Nikkei 225 $6,606 225 0.22 Y510180 CH Shanghai SSE180 Index Fund $1,000 177 0.50 N IJP AU iShares MSCI Japan $6,169 323 0.54 N159903 CH Shenzhen Stock Exch-Stock In $821 39 0.50 N 1330 JP Nikko ETF 225 $3,391 225 0.23 Y510010 CH Bank Of Comm Schroder SSE180 $721 - - N 1308 JP Nikko ETF Topix $3,347 1,668 0.09 N510130 CH E Fund SSE Mid-Cap ETF $570 133 0.50 N 1320 JP Daiwa ETF Nikkei 225 $2,917 225 0.23 Y510880 CH AIG Huatai Dividend $565 50 0.60 N 1305 JP Daiwa ETF Topix $2,872 1,665 0.23 N0061 TT Wise - Polaris CSI 300 Fund $489 - 0.40 N 1670 JP Maxis S&P Mitsubishi Gr $1,266 25 0.50 N3049 HK db x-trackers CSI 300 Ind-2D $484 - 0.50 N 1346 JP Maxis Nikkei 225 $640 225 0.17 N159902 CH China SME $437 111 0.60 N LF2 SP db x-trackers - MSCI JAPAN TRN $570 - 0.50 NXX25 SP db x-trackers FTSE China 25 $363 - 0.60 N 1348 JP Maxis Topix $317 1,660 0.08 N3007 HK db x-trackers FTSE China 25 $366 - 0.60 N 1344 JP Maxis Topix Core30 $215 30 0.19 N1309 JP SSE50 Index Linked ETF $334 50 0.95 N 1311 JP Nomura ETF Topix Core 30 $201 30 0.22 N510020 CH Bosera SSE Large Cap $301 21 0.50 N 1310 JP Daiwa ETF Topix Core 30 $93 30 0.22 N2846 HK iShares CSI 300 A-Share $235 65 0.99 N 1319 JP Nikkei 300 Stock Index $86 300 0.52 N510030 CH SSE 180 Value ETF $220 60 0.50 N 1329 JP iShares Nikkei 225 $47 225 0.22 N510060 CH ICBC Cred Suisse Cent 50 $215 46 0.50 N 1553 JP Maxis S&P Tokai ETF $46 50 0.50 N2801 HK iShares MSCI China Tracker $178 116 0.99 N 1312 JP R/N Small Cap Core Index ETF $36 350 0.50 N510190 CH Huaan Longtou Enterprise ETF $172 - - N JPN SP Lyxor ETF Japan Topix $27 1,669 0.50 N099140 KS Samsung Kodex China H $92 38 0.66 N 2814 HK Lyxor ETF Japan Topix $27 1,669 0.50 N1322 JP China A Share Panda CSI300 $89 300 0.95 N DFSJ SP Daiwa FTSE Shariah Japan 100 $18 - 0.75 N2818 HK Paragon CSI Rafi 50 ETF $85 50 1.39 N 1347 JP Nikko ETF FTSE Jpn Green Chip 35 $16 35 0.40 NASI SP Lyxor ETF China Enterprise $78 40 0.65 N 1551 JP Simplex Jasdaq Top 20 Exchan $15 - 0.50 N3073 HK SPDR FTSE Greater China ETF $70 - 0.28 N 1544 JP Nikko ETF MSCI Japan $15 340 0.16 NUSSE50 SP United SSE 50 China $59 - 0.75 N 1698 JP Japan High D TSE Divs Fo 100 $11 100 0.28 N510090 CH CCB Social Responsibility $58 - 0.50 N 1316 JP Topix100 Japan Large Cap $11 100 0.20 N150023 CH SYWG Stock Growth - Cap Accu $55 - 0.22 N 1318 JP Topix Small Japan Small Cap $11 1,157 0.50 N3024 HK WISE SSE 50 China Tracker $51 - 1.39 N 1317 JP Topix Mid400 Japan Mid Cap $10 400 0.50 NXCSI SP db x-trackers - CSI300 INDEX E $50 - 0.50 N 1314 JP Nikko ETF S&P JP Emer Eq 100 $6 100 0.50 N3046 HK Value China ETF $39 25 0.99 N 101280 KS Samsung Kodex Japan $3 85 0.65 N2838 HK Hang Seng FTSE/Xinhua China 25 $37 25 0.60 N 1556 JP Nikko ETF Nikkei China Re 50 - 50 0.40 NLG9 SP db x-trackers MSCI China TRN $15 - 0.65 N MalaysiaCHINA TB Wise KTAM CSI 300 China $12 - 1.50 N DJIM25 MK MyETF DJ Islamic Titans 25 $197 25 0.54 N1548 JP Nikko ETF China H Share $11 40 0.55 N MAL SP Lyxor ETF MSCI Malaysia $31 40 0.65 N117690 KS Mirae Maps Tiger China $7 - 0.49 N LG6 SP db x-trackers MSCI Malaysia TR $9 - 0.50 NCIMBC25 MK CIMB FTSE China 25 $6 - 0.60 N CIMBA40 MK Cimb FTSE Asean 40 Malaysia $4 - - N3051 HK CICC-SZSE 100 Index Tracker $2 - 1.00 N FBM30 MK FBM30 ETF $1 30 1.18 N510110 CH SSE Periodical Industry 50 $0 - 0.50 N Source: Bloomberg; AIG Huatai; AKD Investment; Bahana; Benchmark Funds510070 CH SSE Private-Owned Enterprise $0 - 0.50 N Boci-Prudential; China AM; CIMB; C-Tracks; Daiwa AM; Fubon; Hang Seng Investment510160 CH China Security Southern Well $0 - 0.50 N HSBC; iShares; J.P. Morgan Securities Inc.; Kotak; Lyxor; Mirae Asset; Nikko AM
Nomura AM; Polaris; Samsung Investment; SmartShares; SSGA; WCS AM
Regional
Country
Country

44
Asia-Pacific Listed ETFs
Ticker ETF NameTotal Assets
($M)Stocks in
ETF (#)Exp. Ratio
(%)Options
Available Ticker ETF NameTotal Assets
($M)Stocks in
ETF (#)Exp. Ratio
(%)Options
Available
New Zealand Consumer (continued)FNZ NZ Smartshares NZX 50 $62 50 0.75 N 136280 KS Samsung Kodex Consumer Goods $13 - 0.45 NTNZ NZ Smartshares NZX 10 $44 10 0.75 N 1647 JP Daiwa ETF Retail Topix-17 $10 146 0.28 NMDZ NZ Smartshares NZX Midcap $27 32 0.75 N 1617 JP Next Funds Topix-17 Foods $4 69 0.32 NSingapore 1630 JP Next Funds Topix-17 Retail $3 142 0.32 NISG AU iShares MSCI Singapore $1,942 31 0.53 N EnergyEWS SP iShares MSCI Singapore Free $1,680 31 0.55 N 3050 HK iShares CSI A-Sh Energy $68 23 0.99 NSTTF SP StreetTRACKS Straits Times $166 30 0.30 N QRE AU Betashares S&P/ASX 200 Resou $37 - 0.39 NDBSSTI SP DBS Singapore STI $34 30 0.20 N 117460 KS Samsung Kodex E & C $32 20 0.45 NSouth Korea 1644 JP Daiwa ETF E Power Topix-17 $17 17 0.28 NIKO AU iShares MSCI South Korea-CDI $4,290 104 0.61 N 3017 HK db CSI300 Energy Index ETF $15 - 0.50 N1313 JP Kodex 200 ETF $1,873 134 0.35 N RSR AU Aii S&P/ASX 200 Resources $9 63 0.43 N069500 KS Samsung Kodex 200 $1,687 134 0.35 N 137990 KS Mirae Asset Maps TIGER Green E $8 - 0.46 N102780 KS Samsung Kodex Samsung Grp ETF $444 15 0.40 N ENGY TB Mtrack Energy $6 12 - N122630 KS Samsung Kodex Leverage ETF $287 - 0.93 N 1627 JP Next Funds Topix-17 Elec&Gas $6 17 0.32 N2848 HK db x-trackers MSCI Korea TRN $277 - 0.65 N 1618 JP Next Funds Topix-17 Energy Rsrcs $5 16 0.32 NXMKO SP db x-trackers MSCI Korea TRN $277 - 0.65 N 1635 JP Daiwa ETF Energy Res Topix-17 $4 16 0.28 N102110 KS Mirae Maps Tiger 200 $222 176 0.34 N ENY AU Aii S&P ASX Energy $3 21 0.43 N105190 KS KITM Kindex 200 $196 136 0.19 N Financials069660 KS WCS KOSEF Kospi 200 $148 159 0.36 N 1615 JP Nomura ETF Banks Index $388 83 0.22 Y114800 KS Samsung Kodex Inverse $133 - 0.93 N 2829 HK iShares CSI A-Sh Financials $142 56 0.99 N2835 HK Mirae Asset Tiger Kospi 200 $101 - 0.60 N 0055 TT Polaris PS MSCI Taiwan Fin $123 22 0.40 N108590 KS Yurie TREX200 $82 140 0.33 N 3061 HK db x-trackers CSI300 Bank 1D $40 - 0.50 N122090 KS Hanhwa Arirang Kospi 50 $63 51 0.34 N QFN AU Betashares S&P/ASX 200 Finan $38 - 0.39 N122390 KS Mirae Maps Tiger Kq Prm ETF $56 - 0.46 N 091170 KS Samsung Kodex Banks $34 9 0.45 NKRW SP Lyxor ETF MSCI Korea-USD $51 102 0.65 N 1631 JP Next Funds Topix-17 Banks $28 83 0.32 N2813 HK Lyxor ETF MSCI Korea $51 102 0.65 N 1648 JP Daiwa ETF Banks Topix-17 $28 83 0.28 N108480 KS KB KStar KOSDAQ Elite30 $42 30 0.40 N 091220 KS Mirae Asset Tiger Banks $26 10 0.46 N105780 KS KB KStar Top5 Group $39 25 0.40 N 102970 KS Samsung Kodex Securities $20 11 0.45 N107560 KS Daishin Giant Hyundai MT ETF $33 10 0.40 N 1632 JP Next Funds Topix-17 Financials $20 49 0.32 N100910 KS WCS KOSEF KRX100 $27 101 0.23 N 2844 HK Db CSI300 Financials Index $19 - 0.50 N108450 KS KITM Kindex Samsung SW ETF $26 15 0.27 N 1612 JP Daiwa ETF Topix Banks $19 83 0.22 N104520 KS WCS KOSEF Bluechip $25 42 0.50 N 091190 KS WCS KOSEF Banks $17 10 0.50 N123760 KS KB Kstar Leverage ETF $24 - 0.50 N KOPSUB IN Kotak PSU Bank $14 12 0.65 N108630 KS Tongyang First Star Bluechip $22 39 0.26 N 1649 JP Daiwa ETF Financials Topix-17 $14 49 0.28 N120210 KS KTB Great SRI ETF $21 70 - N 0059 TT Fubon Taiwan Finance $13 25 0.48 N117740 KS Prudential Prex Lg Group ETF $19 16 0.27 N BBEES IN Banking Exch Trd Bank BeES $13 12 0.50 N108440 KS KITM Kindex KOSDAQ Star $16 28 0.27 N RBETF IN Reliance Banking $3 12 0.80 N091210 KS Mirae Maps Tiger KRX100 $11 99 0.46 N PSUBBE IN PSU Bank Ex Tr - PSU Bank BeES $2 12 0.75 N129270 KS Prudential Prex Neo Val ETF $11 - 0.27 N FIN AU AII S&P/ASX 200 Financials $2 39 0.43 N097710 KS Mirae Tiger Pure Value $11 173 0.46 N 124090 KS Hyundai Hit Insurance ETF $2 - 0.33 N138210 KS KTB Great Green ETF $10 - - N 10802 HK C-Tracks Taiex Finance Sub-I $0 - 0.99 N097720 KS Mirae Tiger Mid Value $10 70 0.46 N Health Care131890 KS KITM Kindex Samsung Ew ETF $10 - - N 3057 HK db CSI300 Health Care ETF $36 - 0.50 N105270 KS KITM Kindex F15 $9 15 0.27 N 1638 JP Daiwa ETF Topix-17 Pharma $15 35 0.28 N123320 KS Mirae Maps Tiger 200 2X ETF $7 - 0.92 N 1621 JP Next Funds Topix-17 Pharma $5 35 0.32 N123930 KS Woori KOSEF Inverse ETF $6 - - N Industrials104530 KS WCS KOSEF High Dividend $6 20 0.50 N 3006 HK iShares CSI A-Sh Infra Index $48 39 0.99 N123310 KS Mirae Maps Tiger 200 -1X ETF $5 - 0.92 N 091180 KS Samsung Kodex Autos $42 20 0.45 N097750 KS Yurie TREX Midsmall Value $4 215 0.46 N 1639 JP Daiwa ETF Automob Topix17 $40 73 0.28 NTaiwan 102960 KS Samsung Kodex Shipbuild $25 10 0.45 NITW AU iShares MSCI Taiwan Index-CDI $3,441 123 0.71 N 1645 JP Daiwa ETF Transpo&L Topix-17 $22 66 0.28 N0050 TT Polaris Taiwan Top50 Tracker $1,778 50 0.32 N 117700 KS Samsung Kodex Const $20 10 0.45 N3036 HK db x-trackers MSCI Taiwan $228 - 0.65 N 1641 JP Daiwa ETF Machine Topix-17 $19 119 0.28 NXMTW SP db x-trackers MSCI Taiwan $228 - 0.65 N 1646 JP Daiwa ETF Topix-17 Com Who $19 140 0.28 N0057 TT Fubon MSCI Taiwan $176 122 0.48 N 1636 JP Daiwa ETF Cons Mter Topix-17 $15 160 0.28 N2837 HK Lyxor ETF MSCI Taiwan $69 122 0.65 N 0060 TT Polaris PS TSEC TW Non-Tech $12 50 0.50 NTWN SP Lyxor ETF MSCI Taiwan $69 122 0.65 N 0058 TT Fubon Taiwan Eight Industries $11 86 0.48 N006201 TT Polaris Taiwan GreTai 50 ETF $50 - 0.44 N 3005 HK db CSI300 Industrials ETF $12 - 0.50 N0056 TT Polaris PS Taiwan Dvd $44 30 0.44 N 1619 JP Next Funds Topix-17 Cons&Mat $7 160 0.32 N0051 TT Polaris Taiwan Mid-Cap 100 $33 100 0.40 N 3063 HK db CSI300 Transportation ETF $7 - 0.50 N0054 TT Polaris PS S&P TW Chp50 $29 50 0.40 N 1624 JP Next Funds Topix-17 Machiner $7 119 0.32 N3002 HK Polaris Taiwan Top50 H.K $16 - 0.38 N 1622 JP Next Funds Topix-17 Auto&Trs $6 69 0.32 NThailand IBEES IN Infrastructure Benchmark ETF $5 25 0.75 NTDEX TB ThaiDEX SET50 $74 49 0.40 N 1629 JP Next Funds Topix-17 Wholesal $4 136 0.32 NLG7 SP db x-trackers MSCI Thailand TR $17 - 0.50 N 1628 JP Next Funds Topix-17 Tp&Lg $3 64 0.32 NTFTSE TB ThaiDEX FTSE SET Large Cap $2 30 0.55 N IDD AU Aii S&P/ASX 200 Industrials $2 32 0.43 NVietnam 10800 HK C-Tracks Taiex Building $0 - 0.99 N3087 HK db x-trackers FTSE Vietnam $351 - 0.85 N MaterialsXFVT SP db x-trackers FTSE Vietnam $351 - 0.85 N 3039 HK iShares CSI A-Sh Materials $108 51 0.99 N
1637 JP Daiwa ETF Raw Ma&Che Topix-17 $29 172 0.28 N117680 KS Samsung Kodex Steel $22 - 0.45 N3062 HK db x-trackers CSI300 Mat $17 - 0.50 N
Consumer 1640 JP Daiwa ETF Steel Topix-17 $14 59 0.28 N2841 HK iShares CSI Consumer Staples $82 20 0.99 N 1620 JP Next Funds Topix-17 Raw M&Ch $7 169 0.32 N3001 HK iShares CSI Consumer Discretionary $80 29 0.99 N MAM AU AII S&P Metals & Mining $4 67 0.43 N3025 HK db CSI300 Consumer Discretionary $38 - 0.50 N 1623 JP Next Funds Topix-17 Stl&Ml $3 58 0.32 N1634 JP Daiwa ETF Foods Topix-17 $16 69 0.28 N Real Estate2817 HK WISE - CSI HK Mainland Consumption Tracker $14 34 0.89 N SLF AU SPDR S&P/ASX 200 Listed Prop $311 - 0.40 N3071 HK Da Cheng CSI China Main Tr $13 - 1.49 N
Sector Funds
Country Sector Funds

45
Asia-Pacific Listed ETFs
Ticker ETF NameTotal Assets
($M)Stocks in
ETF (#)Exp. Ratio
(%)Options
Available Ticker ETF NameTotal Assets
($M)Stocks in
ETF (#)Exp. Ratio
(%)Options
Available
Real Estate (continued) Country1343 JP Next Funds REIT Nomura $100 35 0.32 N 1547 JP Nikko ETF US Equity S&P500 $14 - 0.16 N1345 JP Listed J-REIT Bi Monthly Dividend $59 35 0.30 N 1679 JP Simplex-X NY DJ $13 30 0.60 NVAP AU Vanguard AU Prop Sec Idx ETF $14 - 0.34 N 3027 HK db x-trackers MSCI Rus Cp-2D $10 - 0.65 N2816 HK db x-trackers CSI300 Real Es $13 - 0.50 N XMRC SP db x-trackers MSCI Rus Cp-2D $10 - 0.65 N2839 HK CSI HK Mainland R Estate Tracker $11 15 0.89 N 3048 HK db x-trackers - MSCI BRAZIL TRN $8 - 0.65 N1650 JP Daiwa ETF Real Est Topix-17 $9 44 0.28 N XMBR SP db x-trackers - MSCI BRAZIL TRN $8 - 0.65 N1555 JP Nikko ETF S&P/ASX200 A-REIT $6 - 0.45 N 2803 HK Lyxor ETF RAFI US 1000 $8 989 0.60 N1633 JP Next Funds Topix-17 Real Est $2 44 0.32 N DJI SP Lyxor ETF DJIA $7 30 0.50 NFIX AU Aii S&P/ASX 200 Fin X-A-REIT $2 21 0.43 N 133690 KS Mirae Tiger Nasdaq100 ETF $6 - 0.49 NTechnology 104580 KS Samsung Kodex Brazil $3 21 0.65 N1642 JP Daiwa ETF Elec App Topix-17 $59 180 0.28 N IVV SP iShares S&P 500 - 500 0.09 N0053 TT Polaris PS Taiwan Electr $41 156 0.40 N Sector1643 JP Daiwa ETF IT Serv Topix-17 $37 239 0.28 N IYW SP iShares DJ US Technology $1,191 166 0.48 N091160 KS Samsung Kodex Semicon $33 20 0.45 N IXJ AU iShares S&P Gl Healthcare $484 81 0.48 N091230 KS Mirae Tiger Semincon $29 21 0.46 N IXP AU iShares S&P Global Telecom $431 43 0.48 N0052 TT Fubon Taiwan Technology $21 39 0.48 N IXI AU iShares S&P Consumer Staples $318 99 0.48 N1613 JP Nomura ETF Electric Aplc Idx $19 155 0.22 N Volatility1610 JP Daiwa ETF Topix Electric $17 155 0.22 N 1552 JP Kokusai S&P500 VIX Short ETF $12 - 0.36 N091200 KS Woori KOSEF IT $11 30 0.50 N1625 JP Next Funds Topix-17 El&Pr $11 169 0.32 N1626 JP Next Funds Topix-17 IT&Serv $6 227 0.32 N10801 HK C-Tracks Taiex Electronics $0 - 0.99 N 1349 JP ABF Pan Asia Bond Index Fund $2,431 - 0.20 NTelecom 2821 HK ABF Pan Asia Bond Index Fund $2,431 - 0.20 N098560 KS Mirae Tiger Media Telecom $5 10 0.46 N 2819 HK ABF Hong Kong Bond Index Fund $326 52 0.15 NUtilities 114470 KS Woori KOSEF KTB $284 6 - N3052 HK db x-trackers CSI300 Util $7 - 0.50 N 122260 KS Woori KOSEF MSB ETF $260 8 - N
114100 KS KB Kstar KTB $253 72 0.16 NSBIF SP ABF Singapore Bond Indx Fund $248 40 0.20 NMBIF MK ABF Malaysia Bond Index Fund $188 36 0.20 N
Global LBEES IN Liquid Benchmark ETF BeES $116 - 0.60 NIVE AU iShares MSCI EAFE $38,950 944 0.35 N 130730 KS Woori KOSEF Enhncd Cash ETF $96 - - NIOO AU iShares S&P Global 100 $1,128 106 0.40 N 114820 KS Mirae Maps Tiger KTB3 $87 3 0.15 NXGSD SP db x-trackers STOXX GLOBAL SEL $489 - 0.50 N 114260 KS Samsung Kodex Tbond $73 3 0.15 N1680 JP Nikko ETF MSCI Kokusai $45 - 0.25 N 114460 KS KITM KINDEX TB $53 3 0.05 N1550 JP Maxis Global Equity MSCI Kokusai $28 1,278 0.25 N 3011 HK db x-trackers US Dollar $Mk $46 - 0.15 NVEU AU Vanguard FTSE AW Ex-US $28 2,273 0.25 N 1677 JP Nikko ETF Inl Bond Citi WGBI $42 23 0.25 N2812 HK Lyxor ETF MSCI World $16 1,661 0.45 N K6Y SP db x-trackers II DB Australia $41 - 0.25 NWLD SP Lyxor ETF MSCI World $16 1,661 0.45 N XUTD SP db x-trackers II - IBOXX $ TRE $27 - 0.15 N1554 JP Nikko ETF MSCI ACWI ex Japan $6 - 0.30 N XUIT SP db x-trackers II - USD IG INFL $13 - 0.20 NXMWO SP db x-trackers - MSCI WORLD TRN $6 - 0.45 N 006202 TT Polaris Taiwan Government Bond $12 - 0.30 N3019 HK db x-trackers - MSCI WORLD TRN $6 - 0.45 N KV7 SP db x-trackers II - Aus Money Market ETF - 3C $8 - 0.20 NRegional KV4 SP db x-trackers II Markit IBOXX - - 0.20 NIEM AU iShares MSCI Emerging Mkt $37,463 761 0.69 N KV6 SP db x-trackers II - Aus Money Market ETF - 2C - - 0.20 NXESX SP db x-trackers DJ EURO STOXX $2,170 - 0.00 N R/ABFII IJ Bahana ETF ABF IFI Fund - - - NXMEU SP db x-trackers MSCI Europe Tr $1,391 - 0.30 NIEU AU iShares S&P Europe 350 $1,320 351 0.60 NIBK AU iShares MSCI BRIC $1,153 219 0.69 N2820 HK Lyxor ETF MSCI Emerging Mkts $75 - 0.65 N 2840 HK SPDR Gold Trust $54,926 - 0.40 NLEM SP Lyxor ETF MSCI Emerging Mkts $75 - 0.65 N 1326 JP SPDR Gold Trust $54,926 - 0.40 N1681 JP Nikko ETF MSCI Emerging $54 - 0.25 N GLD SP SPDR Gold Trust $54,926 - 0.40 NLTM SP Lyxor ETF MSCI EM Lat Amer $24 134 0.65 N 1672 JP ETFS Physical Gold $5,702 - 0.39 N1323 JP Next Funds FTSE/JFE Africa Top40 $19 40 0.95 N 1687 JP ETFS Agriculture DJ-UBSCI $1,234 - 0.49 N105010 KS Mirae Asset Tiger Latin $14 - 0.49 N 1673 JP ETFS Physical Silver $908 - 0.49 N105020 KS Mirae Asset Tiger BRIC $12 - 0.49 N 1684 JP ETFS All Commodities DJ-UBSCI $893 - 0.49 N2806 HK Lyxor ETF RAFI Europe $8 501 0.60 N 1674 JP ETFS Physical Platinum $723 - 0.49 NMEU SP Lyxor ETF MSCI Europe-B $7 466 0.35 N GOLD AU ETFs Physical Gold $598 - 0.40 N3009 HK db x-trackers MSCI EM $6 - 0.65 N 1689 JP ETFS Natural Gas $514 - 0.49 NXMEM SP db x-trackers MSCI EM $6 - 0.65 N 1690 JP ETFS Crude Oil $518 - 0.49 NCEC SP Lyxor ETF Eastern Europe $6 31 0.50 N 1675 JP ETFS Physical Palladium $454 - 0.49 NCountry 1327 JP EasyETF S&P GSCI $441 - 0.30 N1557 JP SPDR S&P 500 ETF Trust $94,429 500 0.09 Y GBEES IN Gold Exch Trad Gold BeES $371 - 1.00 YIVV AU iShares S&P 500 Index Fund $28,272 500 0.09 N 1676 JP ETFS Physical PM Basket $372 - 0.43 NIRU AU iShares Russell 2000 $15,994 1,967 0.24 N 1686 JP ETFS Industrial Metals DJ-UBSC $348 - 0.49 NIJH AU iShares S&P Midcap 400 $10,693 400 0.21 N 1693 JP ETFS Copper $277 - 0.49 NIJR AU iShares S&P Smallcap 600 $7,462 600 0.20 N 1685 JP ETFS Energy DJ-UBSCISM $216 - 0.49 NXMUS SP db x-trackers MSCI USA TRN $2,374 - 0.30 N 1328 JP Gold Price Linked ETF $163 - 0.50 N3020 HK db x-trackers MSCI USA TRN $2,374 - 0.30 N 1695 JP ETFS Wheat $135 - 0.49 NXSPS SP db x-trackers S&P 500 Short $181 - 0.50 N 2809 HK Lyxor ETF Commodity Crb $126 - 0.65 N1325 JP Next Funds Ibovespa Link $146 69 0.95 N CRB SP Lyxor ETF Commodity Crb $126 - 0.65 NK6K SP db x-trackers - S&P 500 ETF $112 - 0.20 N 1696 JP ETFS Corn $128 - 0.49 N1546 JP Next Funds Dow Jones Industr $43 30 0.45 N UTIGOL IN UTI Gold ETF $103 - - NRUS SP Lyxor ETF Russia $41 10 0.65 N 1540 JP Japan Physical Gold ETF/MUFG $103 - 0.40 N2831 HK Lyxor ETF Russia $41 10 0.65 N 1688 JP ETFS Grains DJ-UBSCISM $95 - 0.49 NVTS AU Vanguard Totl St Mkt ETF-CDI $27 3,387 0.07 N REGOLD IN Reliance Gold ETF $78 - 1.00 N1324 JP Next Funds Russia Nomura ETF $26 50 0.95 N 1694 JP ETFS Nickel $75 - 0.49 NNDX SP Lyxor ETF Nasdaq 100 $19 100 0.30 N HDFGOLD IN HDFC Gold ETF $70 - 1.00 N2826 HK Lyxor ETF Nasdaq 100 $19 100 0.30 N 1692 JP ETFS Aluminium $68 - 0.49 N1545 JP Next Funds Nasdaq 100 ETF $15 100 0.45 N 3081 HK Value Gold ETF $57 - 0.35 N
Sector Funds
International
International
Fixed Income Funds
Commodity Funds

46
Asia-Pacific Listed ETFs
Ticker ETF NameTotal Assets
($M)Stocks in
ETF (#)Exp. Ratio
(%)Options
Available Ticker ETF NameTotal Assets
($M)Stocks in
ETF (#)Exp. Ratio
(%)Options
Available
1671 JP Simplex WTI Crude Oil $53 - 0.85 N USD AU BetaShares US Dollar ETF $11 - 0.45 NKOGOLD IN Kotak Gold ETF $51 - 1.00 N1542 JP Japan Physical Silv ETF/MUFG $49 - 0.50 N1697 JP ETFS Soybeans $49 - 0.49 NSGETS IN SBI Gold Exchange Traded Sch $38 - 0.50 NETPMAG AU ETFs Physical Silver $37 - 0.49 NCRN SP Lyxor ETF Commod Crb Non En $35 - 0.70 N137610 KS Maps Tiger Agri Futures ETF $28 - 0.70 NICPGOLD IN ICICI Prundential Gold ETF $22 - 0.80 N1691 JP ETFS Gasoline $17 - 0.49 NAXGOLD IN AXIS Gold ETF $15 - 0.90 NJ0S SP db x-trackers - DBLCI-OY Balan $12 - 0.55 NREGGOLD IN Religare Gold ETF $10 - 2.50 NL5F SP db x-trackers - DB Commodity B $9 - 0.95 N1541 JP Japan Physical Plat ETF/MUFG $9 - 0.50 N132030 KS Samsung Kodex Gold Futures $8 - 0.68 N1683 JP Mizuho Gold ETF $8 - 0.45 N1543 JP Japan Physical Pall ETF/MUFG $7 - 0.50 N130680 KS Mirae Maps Tiger WTI Fut ETF $7 - 0.70 NETPMPM AU ETFS Physical PM Basket $7 - 0.44 N1682 JP Next Funds Nikkei-Tocom Platinum $7 - 0.45 NQTGOLD IN Quantum Gold Fund $6 - 1.00 N1699 JP Next Funds Nomura Crude Oil $6 - 0.50 N110550 KS Hyundai Hit Gold $6 - - NETPMPT AU ETFS Physical Platium $4 - 0.49 NETPMPD AU ETFS Physical Palladium $2 - 0.49 NL5G SP db x-trackers Light Energy ETF $1 - 0.95 N
Commodity Funds Currency Funds

47
Important Disclosures Certain Conflicts of Interest: J.P. Morgan Securities LLC (“JPM”) has signed Authorized Participant Agreements covering the following fund families, which permits JPM to acquire fund shares for the purpose of resale: HOLDRs, FactorShares, FaithShares, First Trust, Global X, Guggenheim, iShares, Pax World, Powershares, Rydex,TDX Independence, Teucrium, Vanguard, [JETS], United States Commodities, AdvisorShares, ALPS, Direxion Shares, ETF Securities,First Trust, Grail Advisors, Powershares, PowerShares DB, RevenueShares, Rydex, State Street, US One Trust, Van Eck, WisdomTree, Emerging Global Shares, iShares, Schwab, PIMCO[, FocusShares] and Index IQ. The foregoing list of fund families will change from time to time as JPM executes or terminates Authorized Participant Agreements. JPM and its affiliates do not earn fees or collect revenue sharing from the various ETFs within these fund families or their advisers or distributors in connection with JPM’s role as authorized participant. JPM and/or its affiliates may also provide custodial or sub-custodial, administrative, brokerage, futures and swaps execution and/or clearing and other services to ETFs from time to time. In these capacities, JPM and its affiliates will earn fees for the services provided. Transaction fees in connection with brokerage and execution of swap transactions may include mark-ups, mark-downs and spreads. JPM and/or its affiliates may act as lender to the ETFs and their affiliated persons and, in that capacity, may earn interest and lending fees. JPM and/or its affiliates may license indices to ETFs and earn licensing fees that are tied to the assets under management of the ETF. As such, when JPM or its affiliates is the owner of an index underlying an ETF, they may be incented to promote that ETF over ETFs of other fund families. JPM and/or its affiliates or employees have or may have a long or short position in or hold securities, options, swaps and other related instruments on the ETFs mentioned herein as well as in the underlying portfolio securities or instruments. INVESTORS MAY OBTAIN PROSPECTUSES FOR EXCHANGE TRADED FUNDS (“ETFs”) FROM THE PARTICULAR ETF’S DISTRIBUTOR. AN INVESTOR SHOULD CAREFULLY CONSIDER THE CONFLICTS OF INTEREST DESCRIBED ABOVE AS WELL AS THE INVESTMENT OBJECTIVES, RISKS AND CHARGES AND EXPENSES OF AN ETF BEFORE INVESTING. EACH ETF’S PROSPECTUS CONTAINS MORE COMPLETE, IMPORTANT INFORMATION ABOUT THE ETF, INCLUDING WHETHER JPM OR ITS AFFILIATES ACT AS CUSTODIAN OR INDEX LICENSOR FOR THE ETF, AND SHOULD BE READ CAREFULLY BEFORE INVESTING. Risks associated with Leveraged and Inverse ETFs: Leveraged ETFs seek to provide a multiple of the investment returns of a given index or benchmark on a daily basis. Inverse ETFs seek to provide the opposite, or multiple times the opposite, of the daily returns, of an underlying index or benchmark. Leveraged and inverse ETFs usually reset daily and track their intended indices on a daily basis, but may fail to correlate over longer periods. Due to the effects of compounding and possible correlation errors, leveraged and inverse ETFs may experience greater losses than expected. Compounding can also cause a widening differential between the performance of an ETF and its underlying index or benchmark so that returns over periods longer than one day can differ in amount and direction from the target return of the same period. Consequently, these ETFs may experience losses even in situations where the underlying index or benchmark has performed as expected. Leveraged and inverse ETFs use aggressive investment techniques such as futures, forward contracts, swap agreements, derivatives and options that may increase ETF volatility and may cause a drag on performance. Investors holding these ETFs should therefore monitor their positions frequently -- i.e., in most cases, daily -- to look for possible divergences. Leveraged and inverse ETFs may not be suitable for all investors and should be used only by knowledgeable investors who understand the potential consequences of their strategies, including seeking daily leverage or daily inverse leveraged investment results. The Financial Industry Regulatory Authority has indicated that, in its view, inverse and leveraged ETFs that are reset daily typically are unsuitable for retail investors who plan to hold them for longer than one trading session, particularly in volatile markets. Accordingly, prior to investing in these instruments, all potential investors and, particularly, retail investors, should evaluate whether the instruments are suitable for them in light of their risk tolerance and investment horizon, carefully read the prospectus and consult with a financial professional as needed. INVESTORS SHOULD NOT INVEST IN THESE INSTRUMENTS UNLESS THEY FULLY UNDERSTAND AND HAVE EVALUATED THE RISKS AND HAVE, INDEPENDENTLY OF JPM, DETERMINED THAT THE INVESTMENT IS SUITABLE FOR THEM. Possible Risks of Investing in ETFs The following is an incomplete list of possible risks of investing in ETFs. Not all of the risks will apply to each investment in ETFs and the applicable risks will depend on the particular ETFs invested in and the particular facts and circumstances and investment objectives of the individual investor. Commodities Risk. Certain ETFs invest in commodities. The commodities industries can be significantly affected by the level and volatility of commodity prices; world events including international monetary and political developments; import controls and worldwide competition; exploration and production spending; and tax and other government regulations and economic conditions. Concentration Risk. An ETF may, at various times, concentrate in the securities of a particular industry, group of industries, or sector, and when a fund is overweighted in an industry, group of industries, or sector, it may be more sensitive to any single economic, business, political, or regulatory occurrence than a fund that is not overweighted in an industry, group of industries, or sector. Costs of Investing in Underlying ETFs. Certain ETFs invest in other ETFs, and will bear a pro rata portion of the underlying ETFs’ expenses (including operating costs and management fees). Credit Risk. An ETF could be subject to the risk that a decline in the credit quality of a portfolio investment could cause the ETF’s share price to fall. The ETF could lose money if the issuer or guarantor of a portfolio investment or the counterparty to a derivatives contract fails to make timely principal or interest payments or otherwise honor its obligations. Early Closing Risk. An unanticipated early closing of the exchange on which an ETF’s shares trade may result in a shareholder’s inability to buy or sell shares of the ETF on that day. Emerging Markets Risk. There is an increased risk of price volatility associated with an ETF’s investments in emerging market countries, which may be magnified by currency fluctuations relative to the U.S. dollar. Equity Risk. The prices of equity securities in which an ETF may invest rise and fall daily. These price movements may result from factors affecting individual companies, industries or the securities market as a whole. Fixed Income Risk. An ETF’s investments in fixed income securities are subject to the risk that the securities may be paid off earlier or later than expected. Either situation could cause the ETF to hold securities paying lower-than-market rates of interest, which could hurt the ETF’s yield or share price. Foreign Currency Risk. Currency movements may negatively impact the value of an ETF’s underlying securities, even when there is no change in the value of the security in the issuer’s home country. Foreign Securities Risk. An ETF’s investments in securities of foreign issuers involve certain risks including, but not limited to, risks of adverse changes in foreign economic, political, regulatory and other conditions, or changes in currency exchange rates or exchange control regulations (including limitations on currency movements and exchanges). In certain countries, legal remedies available to investors may be more limited than those available with respect to investments in the United States. In addition, the securities of some foreign companies may be less liquid and, at times, more volatile than securities of comparable U.S. companies. High Yield Risk. Certain ETFs may invest in high yield securities and unrated securities of similar credit quality (commonly known as “junk bonds”). High yield securities generally pay higher yields (greater income) than investment in higher quality securities; however, high yield securities and junk bonds may be subject to greater levels of interest rate, credit and liquidity risk than funds that do not invest in such securities, and are considered predominantly speculative with respect to an issuer’s continuing ability to make principal and interest payments. Income Risk. An ETF may derive dividend and interest income from certain of its investments. This income can vary widely over the short- and long-term. If prevailing market interest rates drop, distribution rates of an ETF’s income producing investments may decline, which then may adversely affect the ETF’s value. Interest Rate Risk. An ETF’s investments in fixed income securities are subject to the risk that interest rates rise and fall over time. Investment Risk. An investment in an ETF is not a bank deposit and is not insured or guaranteed by the Federal Deposit Insurance Corporation or any other government agency. Jurisdiction US-listed ETFs may not be marketed to foreign investors in certain jurisdictions, and vice versa. Liquidity Risk. The market for certain investments may become illiquid under adverse or volatile market or economic conditions, making those investments difficult to sell. The market price of certain investments may fall dramatically if there is no liquid trading market. The lack of liquidity in an ETF can result in its value being more volatile than its underlying portfolio securities. Loss of Money. Loss of money is a risk of investing in an ETF. Market Risk. Due to market conditions, an ETF’s investments may fluctuate significantly from day to day. This volatility may cause the value of your investment in the Fund to decrease. Strategy Risk. ETFs use different strategies, all of which are associated with different risks. For example, an equities-based ETF may use a large-capitalization, mid-capitalization, small-capitalization or other type of strategy. Tracking Error Risk. Although many ETFs may seek to match the returns of an index, an ETF’s return may not match or achieve a high degree of correlation with the return of its applicable index. Trading Risks. An ETF faces numerous market trading risks, including the potential lack of an active market for its shares, losses from trading in secondary markets, and disruption in the creation/redemption process of the ETF. Any of these factors may lead to the ETF’s shares trading at a premium or discount to net asset value (“NAV”), which may be material. In certain markets, ETF prices have dropped precipitously and experienced greater volatility than prices of other stocks.

Exchange Traded Funds – ETFs
Legal Entities Disclosures U.S.: JPMS is a member of NYSE, FINRA and SIPC. J.P. Morgan Futures Inc. is a member of the NFA. JPMorgan Chase Bank, N.A. is a member of FDIC and is authorized and regulated in the UK by the Financial Services Authority. U.K.: J.P. Morgan Securities Ltd. (JPMSL) is a member of the London Stock Exchange and is authorized and regulated by the Financial Services Authority. Registered in England & Wales No. 2711006. Registered Office 125 London Wall, London EC2Y 5AJ. South Africa: J.P. Morgan Equities Limited is a member of the Johannesburg Securities Exchange and is regulated by the FSB. Hong Kong: J.P. Morgan Securities (Asia Pacific) Limited (CE number AAJ321) is regulated by the Hong Kong Monetary Authority and the Securities and Futures Commission in Hong Kong. Korea: J.P. Morgan Securities (Far East) Ltd, Seoul Branch, is regulated by the Korea Financial Supervisory Service. Australia: J.P. Morgan Australia Limited (ABN 52 002 888 011/AFS Licence No: 238188) is regulated by ASIC and J.P. Morgan Securities Australia Limited (ABN 61 003 245 234/AFS Licence No: 238066) is a Market Participant with the ASX and regulated by ASIC. Taiwan: J.P.Morgan Securities (Taiwan) Limited is a participant of the Taiwan Stock Exchange (company-type) and regulated by the Taiwan Securities and Futures Bureau. India: J.P. Morgan India Private Limited, having its registered office at J.P. Morgan Tower, Off. C.S.T. Road, Kalina, Santacruz East, Mumbai - 400098, is a member of the National Stock Exchange of India Limited (SEBI Registration Number - INB 230675231/INF 230675231/INE 230675231) and Bombay Stock Exchange Limited (SEBI Registration Number - INB010675237/INB010675237) and is regulated by Securities and Exchange Board of India. Thailand: JPMorgan Securities (Thailand) Limited is a member of the Stock Exchange of Thailand and is regulated by the Ministry of Finance and the Securities and Exchange Commission. Indonesia: PT J.P. Morgan Securities Indonesia is a member of the Indonesia Stock Exchange and is regulated by the BAPEPAM LK. Philippines: J.P. Morgan Securities Philippines Inc. is a member of the Philippine Stock Exchange and is regulated by the Securities and Exchange Commission. Brazil: Banco J.P. Morgan S.A. is regulated by the Comissao de Valores Mobiliarios (CVM) and by the Central Bank of Brazil. Mexico: J.P. Morgan Casa de Bolsa, S.A. de C.V., J.P. Morgan Grupo Financiero is a member of the Mexican Stock Exchange and authorized to act as a broker dealer by the National Banking and Securities Exchange Commission. Singapore: This material is issued and distributed in Singapore by J.P. Morgan Securities Singapore Private Limited (JPMSS) [MICA (P) 025/01/2011 and Co. Reg. No.: 199405335R] which is a member of the Singapore Exchange Securities Trading Limited and is regulated by the Monetary Authority of Singapore (MAS) and/or JPMorgan Chase Bank, N.A., Singapore branch (JPMCB Singapore) which is regulated by the MAS. Malaysia: This material is issued and distributed in Malaysia by JPMorgan Securities (Malaysia) Sdn Bhd (18146-X) which is a Participating Organization of Bursa Malaysia Berhad and a holder of Capital Markets Services License issued by the Securities Commission in Malaysia. Pakistan: J. P. Morgan Pakistan Broking (Pvt.) Ltd is a member of the Karachi Stock Exchange and regulated by the Securities and Exchange Commission of Pakistan. Saudi Arabia: J.P. Morgan Saudi Arabia Ltd. is authorized by the Capital Market Authority of the Kingdom of Saudi Arabia (CMA) to carry out dealing as an agent, arranging, advising and custody, with respect to securities business under licence number 35-07079 and its registered address is at 8th Floor, Al-Faisaliyah Tower, King Fahad Road, P.O. Box 51907, Riyadh 11553, Kingdom of Saudi Arabia. Dubai: JPMorgan Chase Bank, N.A., Dubai Branch is regulated by the Dubai Financial Services Authority (DFSA) and its registered address is Dubai International Financial Centre - Building 3, Level 7, PO Box 506551, Dubai, UAE. Country and Region Specific Disclosures U.K. and European Economic Area (EEA): Unless specified to the contrary, issued and approved for distribution in the U.K. and the EEA by JPMSL. Investment research issued by JPMSL has been prepared in accordance with JPMSL's policies for managing conflicts of interest arising as a result of publication and distribution of investment research. Many European regulators require a firm to establish, implement and maintain such a policy. This report has been issued in the U.K. only to persons of a kind described in Article 19 (5), 38, 47 and 49 of the Financial Services and Markets Act 2000 (Financial Promotion) Order 2005 (all such persons being referred to as "relevant persons"). This document must not be acted on or relied on by persons who are not relevant persons. Any investment or investment activity to which this document relates is only available to relevant persons and will be engaged in only with relevant persons. In other EEA countries, the report has been issued to persons regarded as professional investors (or equivalent) in their home jurisdiction. Australia: This material is issued and distributed by JPMSAL in Australia to “wholesale clients” only. JPMSAL does not issue or distribute this material to “retail clients.” The recipient of this material must not distribute it to any third party or outside Australia without the prior written consent of JPMSAL. For the purposes of this paragraph the terms “wholesale client” and “retail client” have the meanings given to them in section 761G of the Corporations Act 2001. Germany: This material is distributed in Germany by J.P. Morgan Securities Ltd., Frankfurt Branch and J.P.Morgan Chase Bank, N.A., Frankfurt Branch which are regulated by the Bundesanstalt für Finanzdienstleistungsaufsicht. Hong Kong: The 1% ownership disclosure as of the previous month end satisfies the requirements under Paragraph 16.5(a) of the Hong Kong Code of Conduct for Persons Licensed by or Registered with the Securities and Futures Commission. (For research published within the first ten days of the month, the disclosure may be based on the month end data from two months’ prior.) J.P. Morgan Broking (Hong Kong) Limited is the liquidity provider/market maker for derivative warrants, callable bull bear contracts and stock options listed on the Stock Exchange of Hong Kong Limited. An updated list can be found on HKEx website: http://www.hkex.com.hk. Japan: There is a risk that a loss may occur due to a change in the price of the shares in the case of share trading, and that a loss may occur due to the exchange rate in the case of foreign share trading. In the case of share trading, JPMorgan Securities Japan Co., Ltd., will be receiving a brokerage fee and consumption tax (shouhizei) calculated by multiplying the executed price by the commission rate which was individually agreed between JPMorgan Securities Japan Co., Ltd., and the customer in advance. Financial Instruments Firms: JPMorgan Securities Japan Co., Ltd., Kanto Local Finance Bureau (kinsho) No. 82 Participating Association / Japan Securities Dealers Association, The Financial Futures Association of Japan. Korea: This report may have been edited or contributed to from time to time by affiliates of J.P. Morgan Securities (Far East) Ltd, Seoul Branch. Singapore: JPMSS and/or its affiliates may have a holding in any of the securities discussed in this report; for securities where the holding is 1% or greater, the specific holding is disclosed in the Important Disclosures section above. India: For private circulation only, not for sale. Pakistan: For private circulation only, not for sale. New Zealand: This material is issued and distributed by JPMSAL in New Zealand only to persons whose principal business is the investment of money or who, in the course of and for the purposes of their business, habitually invest money. JPMSAL does not issue or distribute this material to members of "the public" as determined in accordance with section 3 of the Securities Act 1978. The recipient of this material must not distribute it to any third party or outside New Zealand without the prior written consent of JPMSAL. Canada: The information contained herein is not, and under no circumstances is to be construed as, a prospectus, an advertisement, a public offering, an offer to sell securities described herein, or solicitation of an offer to buy securities described herein, in Canada or any province or territory thereof. Any offer or sale of the securities described herein in Canada will be made only under an exemption from the requirements to file a prospectus with the relevant Canadian securities regulators and only by a dealer properly registered under applicable securities laws or, alternatively, pursuant to an exemption from the dealer registration requirement in the relevant province or territory of Canada in which such offer or sale is made. The information contained herein is under no circumstances to be construed as investment advice in any province or territory of Canada and is not tailored to the needs of the recipient. To the extent that the information contained herein references securities of an issuer incorporated, formed or created under the laws of Canada or a province or territory of Canada, any trades in such securities must be conducted through a dealer registered in Canada. No securities commission or similar regulatory authority in Canada has reviewed or in any way passed judgment upon these materials, the information contained herein or the merits of the securities described herein, and any representation to the contrary is an offence. Dubai: This report has been issued to persons regarded as professional clients as defined under the DFSA rules. General: Additional information is available upon request. Information has been obtained from sources believed to be reliable but JPMorgan Chase & Co. or its affiliates and/or subsidiaries (collectively J.P. Morgan) do not warrant its completeness or accuracy except with respect to any disclosures relative to JPMS and/or its affiliates and the analyst’s involvement with the issuer that is the subject of the research. All pricing is as of the close of market for the securities discussed, unless otherwise stated. Opinions and estimates constitute our judgment as of the date of this material and are subject to change without notice. Past performance is not indicative of future results. This material is not intended as an offer or solicitation for the purchase or sale of any financial instrument. The opinions and recommendations herein do not take into account individual client circumstances, objectives, or needs and are not intended as recommendations of particular securities, financial instruments or strategies to particular clients. The recipient of this report must make its own independent decisions regarding any securities or financial instruments mentioned herein. JPMS distributes in the U.S. research published by non-U.S. affiliates and accepts responsibility for its contents. Periodic updates may be provided on companies/industries based on company specific developments or announcements, market conditions or any other publicly available information. Clients should contact analysts and execute transactions through a J.P. Morgan subsidiary or affiliate in their home jurisdiction unless governing law permits otherwise. Copyright 2011 JPMorgan Chase & Co. All rights reserved. This report or any portion hereof may not be reprinted, sold or redistributed without the written consent of J.P. Morgan.
Global Equity Derivatives & Delta One Strategy
Global Head Marko Kolanovic
Americas J.P. Morgan Securities LLC Europe J.P. Morgan Securities Ltd.
Marko Kolanovic [email protected] + 1 (212) 272-1438 Davide Silvestrini [email protected] + 44 (20) 7777-1018 Min Moon [email protected] + 1 (212) 272-8456 Trista Rose [email protected] + 44 (20) 7325-4402 Kapil Dhingra [email protected] + 1 (212) 272-7823 Bram Kaplan [email protected] + 44 (20) 7325-8183 Adam Rudd [email protected] + 1 (212) 272-1215 Peng Cheng [email protected] + 44 (20) 7325-6935 Amyn Bharwani [email protected] + 1 (212) 622-8030
Asia Pacific J.P. Morgan Securities (Asia Pacific) Limited India J.P. Morgan India Private Limited Tony Lee [email protected] + (852) 2800-8857 Pankaj Gupta [email protected] + (91-22) 61573296 Clara Law [email protected] + (852) 2800-7736 Sahil Manocha [email protected] + (91-22) 61573268 Sue Lee [email protected] + (852) 2800-7898 Nikhil Narayana [email protected] + (91-22) 61573351 Rishabh Khandelwal [email protected] + (91-22) 61573326
J.P. Morgan Securities Japan Co., Ltd. Michiro Naito [email protected] + 81 (3) 6736-1352 Hayato Ono [email protected] + 81 (3) 6736-1347