exchange-traded funds chief investment office americas ... · exchange-traded funds etf tax swaps |...
TRANSCRIPT

Exchange-traded fundsETF tax swaps | 1 November 2018Chief Investment Office Americas, Wealth ManagementDavid Perlman, ETF Strategist Americas, [email protected]
• Tax-loss strategies can help to improve the overall tax efficiencyof a portfolio.
• When executing tax swaps, be mindful of the wash sale rules.
• On pages 3-5, there are examples of ETF tax swaps. Whileexamples only include ETFs, investors can swap between singlesecurities, ETFs, mutual funds, closed-end funds and otherinvestment vehicles when executing tax swaps.
• To help with tax swaps, this report also includes our most recentHighlighted ETFs list as well as a list of ETFs that are eligible forWealth Management Americas clients.
Unlike in previous years, we see ample opportunities for tax swapsgiven the weakness in both the equity and fixed income marketsthis year (Fig. 1 and 2). Similar to in years past, there are generallymore opportunities for tax swaps in the international markets astheir returns lagged behind the US. YTD US equities are back toflat while international developed and emerging markets are down11% and 18%, respectively. For fixed income, most segments aredown YTD as rising rates has pressured the asset class.
For US equities, most sectors have negative returns YTD and someone-year returns have moved into negative territory as well (Fig.3). There are even more opportunities at the industry level such aswith homebuilders, banks, oil equipment & services. From a sizeand style perspective, US mid-cap and value ETFs have generallyposted negative returns YTD. Within international equities, taxswap opportunities are wide spread. For instance, for internationalequity ETFs with one-year returns, over 96% of the ETFs havenegative returns. Within fixed income, many segments have postednegative returns as rising rates have been a headwind. Of the 300fixed income ETFs with one-year returns, 65% have posted negativereturns. The opportunities for tax swaps are greater in investmentgrade corporate bonds and emerging market debt.
Tax-loss harvesting involves selling securities to recognize unrealizedlosses that can be used to offset against realized gains. Thesestrategies help to improve the overall tax efficiency of a portfolio.While proceeds from the sale can be reinvested into another security
Please be aware that UBS Financial ServicesInc. does not provide tax advice. This reportis for informational purposes only. The belowexamples may or may not be appropriate forall investors depending on a number of factorssuch investment objectives, risk tolerance, andcost basis. Each investor should consult hisor her own tax advisor concerning the taxconsequences of any investment strategy theymake or are contemplating.
Fig. 1: Equity market total returnsIn %
(20.0)
(15.0)
(10.0)
(5.0)
0.0
5.0
10.0
15.0
YTD 1-year 3-year 5-yearUS International DM International EM
Source: Morningstar Direct, UBS. Data as of 29 October
2018. US is the S&P 1500 Index. International developed
markets is the MSCI World ex USA Index and emerging
markets is the MSCI EM Index.
Fig. 2: Fixed income total returnsIn %
YTD 1-year 3-year 5-yearBroad investment grade -2.0 -1.4 1.2 1.9
US government -1.7 -1.2 0.4 1.2
High yield corporate 0.9 1.0 6.6 4.7
Investment grade corporate -4.5 -3.2 2.6 3.2
USD denom EM debt -5.4 -4.8 3.9 3.7
Local currency EM debt -9.2 -5.6 3.5 -2.7
Municipal bonds -1.0 -0.4 1.9 3.2
Source: Morningstar Direct, UBS. Data as of 29 October
2018. Broad investment grade is the Bloomberg Barclays
US Aggregate Total Return Index. US government is the
Bloomberg Barclays US Government Total Return Index.
High yield is the Bloomberg Barclays US Corporate High
Yield Total Return Index. Investment grade is the Markit
IBoxx USD Liquid Investment Grade Total Return Index.
USD denominated EM debt is the JPM EMBI Global Total
Return Index. Local currency EM debt is the JPM GBI-EM
Global Diversified Total Return Index. Municipal bonds is
the S&P National AMT Free Municipal Bond Total Return
Index.
This report has been prepared by UBS Financial Services Inc. (UBS FS). Analyst certification and required disclosuresbegin on page 32.

to maintain similar exposure, they can also be used to tactically re-position a portfolio to capitalize on the current market environment.For instance, within investment grade corporate bonds, we see val-ue in short maturities given their attractive yield and short duration.Therefore, investors holding more broadly focused investment gradecorporate funds, can consider harvesting a loss and re-allocating theproceeds into a fund focusing on shorter maturities.
When executing tax swaps, you must be mindful of the wash salesrule. According to the IRS, a wash sale occurs when you sell or tradea stock or securities at a loss and within 30 days before or after thesale you: buy substantially identical stock or securities, acquire sub-stantially identical stock or securities in a fully taxable trade, acquirea contract or option to buy substantially identical stock or securities,or acquire substantially identical stock for your individual retirementaccount or Roth IRA.1 Violation of the wash sales rule disallows theuse of the realized loss to offset a gain. A more in-depth discussion ontax loss harvesting and the benefits is discussed in the report, Invest-ment planning: Loss harvesting: reap alpha year-round, published on24 February 2016.
In terms of how the wash sale rule applies to ETFs, there is no set def-inition of "substantially identical." However, in our view, ETFs track-ing the same underlying index would likely be considered substan-tially identical. More conservative approaches try to avoid reinvestinginto ETFs that are "substantially similar." The methods for determiningthe similarity between two ETFs vary across the industry. We recom-mend consulting with tax accountants for guidance on swaps that aredebatable with respect to their compliance with the wash sales rule.
The benefits of ETFs make them attractive products for implement-ing tax swaps. ETFs generally offer low-cost, diversified exposure andtrading flexibility, as they can be traded on major exchanges through-out the day. ETFs are also more tax-efficient than other investmentproducts, which lowers the risk of receiving a capital gains distribu-tion. Additionally, the breadth of the ETF market has continued toevolve and more markets and strategies are now available throughETFs, enhancing the opportunity set for executing tax swaps.
Fig 4. attempts to help identify potential tax loss opportunities. Fromthe universe of ETFs eligible for solicitation at UBS with over USD500mn in assets, it shows the 25 ETFs trading at the largest discountrelative to their 52-week high. On pages 3-5, we highlight examplesof tax swaps between ETFs. For most of the examples, we are draw-ing on ETFs that have experienced losses over the past year. Althoughthese examples focus on ETF-to-ETF swaps, investors can also swapfrom individual stocks, bonds or from mutual funds into ETFs, and viceversa. To help with tax swaps, our most recent Highlighted ETFs listfrom 22 October 2018, which includes ETF implementation ideas, anda list of ETFs that are listed in the US and eligible for sale to WealthManagement Americas clients, are included in this report beginningon pages 6 and 10, respectively.
1http://www.irs.gov/publications/p550/ch04.html#en_US_2013_publink100010601
Fig. 3: US S&P 500 sector total returnsIn %
YTD 1-year 3-year 5-yearCommunication services -9.3 0.7 3.7 2.6
Consumer discretionary 4.0 11.4 9.7 11.6
Consumer staples -2.2 5.6 5.6 7.8
Energy -7.4 -0.4 1.9 -2.6
Financials -7.5 -3.1 10.9 10.6
Health care 7.4 8.5 8.8 12.3
Industrials -9.1 -4.9 8.9 8.5
Information technology 7.2 9.3 18.3 18.3
Materials -15.0 -12.7 6.0 4.8
Real estate -0.3 3.0 4.8 8.2
Utilities 5.6 1.9 11.4 10.6
Source: Morningstar Direct, UBS. Data as of 29 October 2018.
Sector returns based on the S&P 500 sector indices.
Fig. 4: 25 ETFs trading at largest discount relativeto 52-week highsIn %
Below 52-weekTicker Name high (%)KWEB KraneShares CSI China Internet ETF 42.1
ASHR Xtrackers Harvest CSI 300 China A ETF 36.2
ITB iShares US Home Construction ETF 35.9
MCHI iShares MSCI China ETF 33.5
GXC SPDR® S&P China ETF 33.3
BOTZ Global X Robotics & Artfcl Intllgnc ETF 32.8
XHB SPDR® S&P Homebuilders ETF 31.8
OIH VanEck Vectors Oil Services ETF 31.5
DGS WisdomTree Emerging Markets SmCp Div ETF 29.7
EUFN iShares MSCI Europe Financials ETF 29.5
LIT Global X Lithium & Battery Tech ETF 29.2
FXI iShares China Large-Cap ETF 29.1
EWY iShares MSCI South Korea Capped ETF 28.1
VWO Vanguard FTSE Emerging Markets ETF 28.1
EEM iShares MSCI Emerging Markets ETF 27.0
IEMG iShares Core MSCI Emerging Markets ETF 26.9
AAXJ iShares MSCI All Country Asia ex Jpn ETF 26.8
GEM Goldman Sachs ActiveBeta® EMkts Eq ETF 26.6
AIA iShares Asia 50 ETF 26.5
SPEM SPDR® Portfolio Emerging Markets ETF 26.3
IFV First Trust Dorsey Wright Intl Foc 5 26.2
SCHE Schwab Emerging Markets Equity ETF™ 25.8
EPI WisdomTree India Earnings ETF 25.3
ROBO Robo Global® Robotics&Automation ETF 25.1
EWG iShares MSCI Germany ETF 25.0
Source: Morningstar Direct, UBS. Data as of 29 October 2018.
Note: Draws from universe of ETFs approved at UBS and with
over USD 500mn in assets.
Exchange-traded funds
UBS Chief Investment Office Americas, Wealth Management 1 November 2018 2

Examples of ETF tax swaps
Ticker Name Ticker Name Comments
US equitiesIVW iShares S&P 500 Growth ETF MGK Vanguard Mega Cap Growth Index ETF 1. Maintaining exposure to US growth companiesIWF iShares Russell 1000 Growth ETF
IVE iShares S&P 500 Value ETF MGV Vanguard Mega Cap Value Index ETF 1. Maintaining exposure to US value companiesIWD iShares Russell 1000 Value ETF
RPV Invesco S&P 500 Pure Value ETF VLUE iShares Edge MSCI USA Value Factor ETF 1. Maintaining more targeted exposure to US value companies
RSP Invesco S&P 500 Equal Weight ETF CFA VictoryShares US 500 Volatility Wtd ETF 1. Maintaining overweight to smaller companies within US large-cap segment
IJH iShares Core S&P Mid-Cap ETF VO Vanguard Mid Cap ETF 1. Maintaining exposure to US mid-cap companies
IJH iShares Core S&P Mid-Cap ETF EZM WisdomTree MidCap Earnings Fund 1. Maintaining exposure to US mid-cap companiesMDY SPDR S&P MidCap 400 ETF JHMM John Hancock Multifactor Mid Cap ETF 2. EZM and JHMM track indices that seek to outperform traditional benchmarksVO Vanguard Mid Cap ETFIWR iShares Russell Mid-Cap ETF
IWS iShares Russell Mid-Cap Value ETF IJJ iShares S&P Mid-Cap 400 Value ETF 1. Maintaining exposure to US mid-cap value companies
IWS iShares Russell Mid-Cap Value ETF EZM WisdomTree MidCap Earnings Fund 1. Maintaining exposure to US mid-cap value companiesIJJ iShares S&P Mid-Cap 400 Value ETF 2. EZM's index value tilt is from its weighting methodology not security selection
XLC Communication Services Select Sector SPDR VOX Vanguard Communication Services ETF 1. Maintaining exposure to communication services sector
XLI Industrial Select Sector SPDR Fund VIS Vanguard Industrials ETF 1. Maintaining exposure to industrials sector
XLI Industrial Select Sector SPDR Fund XLF Financial Select Sector SPDR Fund 1. We are underweight the industrials and consumer staples sectors andVIS Vanguard Industrials ETF VFH Vanguard Financials ETF overweight the financials and energy sectorsXLP Consumer Staples Select Sector SPDR Fund XLE Energy Select Sector SPDR FundVDC Vanguard Consumer Staples ETF VDE Vanguard Energy ETF
XLB Materials Select Sector SPDR Fund VAW Vanguard Materials ETF 1. Maintaining exposure to materials sector
OIH VanEck Vectors Oil Services ETF XES SPDR S&P Oil & Gas Equipment & Services ETF 1. Maintaining exposure to equipment and services companiesIEZ iShares U.S. Oil Equipment & Services ETF
KBE SPDR S&P Bank ETF KBWB Invesco KBW Bank ETF 1. Maintaining exposure to US banks2. KBWB's index is more balanced between global and regional banks thanKBE's index
XHB SPDR S&P Homebuilders ETF ITB iShares U.S. Home Construction ETF 1. Maintain exposure to homebuilders, home improvement retailers, and relatedindustries
International developed equitiesEFA iShares MSCI EAFE ETF VEA Vanguard FTSE Developed Markets ETF 1. Maintain broad exposure to international developed market equities
EFA iShares MSCI EAFE ETF GSIE Goldman Sachs ActiveBeta International Equity ETF 1. Maintain broad exposure to international developed market equitiesINTF iShares Edge MSCI Multifactor Intl ETF 2. GSIE, INTF, and RODM track indices that seek to outperform traditionalRODM Hartford Multifactor Developed Markets (ex-US) ETF benchmarks
Please be aware that UBS Financial Services Inc. does not provide tax advice. This report is for informational purposes only. The below examples may or may not be appropriate for all investors depending on a number of factors such investment objectives, risk tolerance, and cost basis. Each investor should consult his or her own tax advisor concerning the tax consequences of any investment strategy they make or are contemplating. A right arrow indicates a move to an ETF that is directionally in line with WMR's recommendations on the underlying markets while a "double-sided" arrow indicates both ETFs target similar underlying markets.
Source: UBS.
Exchange-traded funds
UBS Chief Investment Office Americas, Wealth Management 1 November 2018 3

Examples of ETF tax swaps
Ticker Name Ticker Name Comments
Please be aware that UBS Financial Services Inc. does not provide tax advice. This report is for informational purposes only. The below examples may or may not be appropriate for all investors depending on a number of factors such investment objectives, risk tolerance, and cost basis. Each investor should consult his or her own tax advisor concerning the tax consequences of any investment strategy they make or are contemplating. A right arrow indicates a move to an ETF that is directionally in line with WMR's recommendations on the underlying markets while a "double-sided" arrow indicates both ETFs target similar underlying markets.
EFA iShares MSCI EAFE ETF ESGDIEFA iShares Core MSCI EAFE ETF
1. Maintain broad exposure but focus on sustainable investing2. ESGD's index targets a tracking error of just 0.5% vs. EFA's index
VEA Vanguard FTSE Developed Markets ETF
EFV iShares MSCI EAFE Value ETF FNDF 1. Maintain broad exposure to international developed market value2. FNDF's index value tilt is from its weighting methodology not security selection
ESGD iShares MSCI EAFE ESG Optimized ETF NUDM 1. Maintaining exposure to sustainable investing within int'l developed equities
GSIE Goldman Sachs ActiveBeta International Equity ETF RODM 1. Maintaining exposure to int'l developed equities while targeting diversified mixof factors in an attempt to outperform traditional benchmarks
INTF iShares Edge MSCI Multifactor Intl ETF RODM 1. Maintaining exposure to int'l developed equities while targeting diversified mixof factors in an attempt to outperform traditional benchmarks
EFAV iShares Edge MSCI Min Vol EAFE ETF IDLV 1. Maintain more defensive equity positioning by targeting low volatility factor
SCZ iShares MSCI EAFE Small-Cap ETF SCHC 1. Maintain exposure to international developed small-cap companies
FEZ SPDR EURO STOXX 50 EZU 1. Maintain exposure to Eurozone companies
HEZU iShares Currency Hedged MSCI EMU ETF HEDJ 1. Maintain currency hedged exposure to the Eurozone
EWA iShares MSCI Australia ETF EWC 1. We are underweight Australia and overweight Canada
EWA iShares MSCI Australia ETF VT
iShares MSCI EAFE ESG Optimized ETF
Schwab Fundamental Int'l Large Company ETF
NuShares ESG International Developed Markets ETF
Hartford Multifactor Developed Markets (ex-US) ETF
Hartford Multifactor Developed Markets (ex-US) ETF
Invesco S&P Int'l Developed Low Volatility ETF
Schwab International Small-Cap Equity ETF™
iShares MSCI EMU Index Fund
WisdomTree Europe Hedged Equity Fund
iShares MSCI Canada ETF
Vanguard Total World Stock Index ETF 1. We are underweight Australia and overweight global equities
Emerging market equitiesIEMG iShares Core MSCI Emerging Market ETF VWO Vanguard FTSE Emerging Markets ETF 1. Maintain broad exposure to EM equities
EEM iShares MSCI Emerging Markets ETF ESGE iShares MSCI EM ESG Optimized ETF 1. Maintain broad exposure to EM equities but focus on sustainable investingIEMG iShares Core MSCI Emerging Market ETF 2. ESGE's index targets a tracking error of just 1.0% vs. EEM's indexVWO Vanguard FTSE Emerging Markets ETF
EEM iShares MSCI Emerging Markets ETF GEM Goldman Sachs ActiveBeta EM Equity ETF 1. Maintain broad exposure to EM equitiesIEMG iShares Core MSCI Emerging Market ETF EMGF iShares Edge MSCI Multifactor Emerging Markets ETF 2. GEM and EMGF track indices that seek to outperform traditional benchmarksVWO Vanguard FTSE Emerging Markets ETF
GEM Goldman Sachs ActiveBeta EM Equity ETF EMGF iShares Edge MSCI Multifactor Emerging Markets ETF 1. Maintaining exposure to EM equities while targeting diversified mix of factors
ESGE iShares MSCI EM ESG Optimized ETF NUEM NuShares ESG Emerging Markets Equity ETF 1. Maintaining exposure to sustainable investing within EM equities
EDIV SPDR S&P Emerging Markets Dividend DEM WisdomTree Emerging Markets High Dividend Fund 1. Maintaining exposure to EM dividend paying stocks
EWM iShares MSCI Malaysia ETF MCHI iShares MSCI China ETF 1. We are underweight Malaysia, Philippines, and Taiwan and overweight ChinaEPHE iShares MSCI Philippines ETF GXC SPDR S&P China ETF South Korea, and ThailandEWT iShares MSCI Taiwan ETF EWY iShares MSCI South Korea Capped ETF
THD iShares MSCI Thailand Capped ETF
Source: UBS.
Exchange-traded funds
UBS Chief Investment Office Americas, Wealth Management 1 November 2018 4

Examples of ETF tax swaps
Ticker Name Ticker Name Comments
Please be aware that UBS Financial Services Inc. does not provide tax advice. This report is for informational purposes only. The below examples may or may not be appropriate for all investors depending on a number of factors such investment objectives, risk tolerance, and cost basis. Each investor should consult his or her own tax advisor concerning the tax consequences of any investment strategy they make or are contemplating. A right arrow indicates a move to an ETF that is directionally in line with WMR's recommendations on the underlying markets while a "double-sided" arrow indicates both ETFs target similar underlying markets.
EWM iShares MSCI Malaysia ETF IEMG iShares Core MSCI Emerging Market ETF 1. We are underweight Malaysia, Philippines, and TaiwanEPHE iShares MSCI Philippines ETF VWO Vanguard FTSE Emerging Markets ETF 2. Broadening out EM exposureEWT iShares MSCI Taiwan ETF
INDA iShares MSCI India ETF EPI WisdomTree India Earnings Fund 1. Maintaining exposure to Indian equities
Fixed incomeLQD iShares iBoxx $ Investment Grade Corp Bond ETF SPSB SPDR Portfolio Short Term Corporate Bond ETF 1. Maintaining exposure to investment grade rated corporate bonds
2. SPSB's index targets short-term investment grade corporates, which we favor
HYG iShares iBoxx $ High Yield Corporate Bond ETF HYLS First Trust Tactical High Yield ETF 1. Maintaining exposure to below investment grade rated creditJNK SPDR Barclays High Yield Bond ETF 2. HYLS is an actively managed ETF
SJNK SPDR Barclays Capital Short Term HY Bond ETF HYG iShares iBoxx $ High Yield Corporate Bond ETF 1. Maintaining exposure to below investment grade rated creditHYS PIMCO 0-5 Year HY Corporate Bond Index ETF JNK SPDR Barclays High Yield Bond ETF 2. HYLS is an actively managed ETF
HYLS First Trust Tactical High Yield ETF
BKLN Invesco Senior Loan ETF SRLN SPDR Blackstone/GSO Senior Loan ETF 1. Maintaining exposure to senior loansFTSL First Trust Senior Loan Fund 2. SRLN and FTSL are actively managed ETFs
MUB iShares National Muni Bond ETF TFI SPDR Nuveen Barclays Capital Municipal Bond ETF 1. Maintaining exposure to investment grade rated municipal bondsVTEB Vanguard Tax-Exempt Bond Index ETF 2. MUB's and VTEB's index includes all investment grade ratings while TFI's index
is just AAA & AA-rated municipal bonds
ITM VanEck Vectors Intermediate Municipal Index ETF FMB First Trust Managed Municipal ETF 1. Maintaining focus on intermediate-term municipal bonds2. FMB is an actively managed ETF
BWX SPDR Barclays International Treasury Bond ETF IGOV iShares International Treasury Bond ETF 1. Maintaining exposure to international government bonds
EMB iShares J.P. Morgan USD EM Bond ETF PCY Invesco Emerging Markets Sovereign Debt ETF 1. Maintaining exposure to USD denominated EM bonds2. PCY tracks an index that seeks to outperform traditional benchmarks
Source: UBS.
Exchange-traded funds
UBS Chief Investment Office Americas, Wealth Management 1 November 2018 5

Highlighted ETFs
The following pages list ETFs that are included in our Highlighted ETFs report, published 22 October 2018. In our opinion, these ETFs provide broad representation to or best target UBS CIO's global research recommendations. The list includes traditional ETFs, which track indices that select and weight securities based on market cap. These include ETFs tracking indices such as the S&P 500 Index, MSCI EAFE Index, and Bloomberg Barclays US Aggregate Bond Index. The report also includes ETFs that seek to outperform traditional benchmark indices as well as ETFs focused on investment themes favored by CIO.
The ETFs included in the Highlighted ETFs are part of UBS's coverage of ETFs, which is a subset of the broader universe of ETFs eligible for sale at UBS (Fig 5). The Highlighted ETFs report can serve as a resource for discussing and analyzing ETFs. It includes information on the underlying index methodologies and investment strategy guidelines. It will also include risk-return statistics to help evaluate the performance of the investment. This list is only one potential input that can be used in selecting ETFs. It is not a comprehensive list and there can be other ETFs not included that also meet an investor's objective. Additionally, how the ETF's fit within the broader portfolio should be considered.
For additional information on the ETFs included in this report, see our most recent ETF Quarterly report, published 27 August 2018. Standardized performance as of the most recent quarter end begins on p. 28 and links to the prospectus are available within this report on pages 30-31.
For additional information on UBS CIO's market outlook and recommendations, refer to the UBS House View: November 2018 report.
Fig. 5: ETF coverage universe
Coverage universe includes 333 ETFs, which account for 84% of US-listed ETF assets
Source: UBS.
Exchange-traded funds
UBS Chief Investment Office Americas, Wealth Management 1 November 2018 6

29 October 2018135 Assets ADTV # of Expense Actively Smart Market Price Total Returns (%) Volatility (%)
Ticker (USD Mil) (1,000/shrs) Securities Ratio (%) Managed Beta 1-Yr 3-Yr* 5-Yr* 10-Yr* 1-Yr 3-Yr* 5-Yr* 10-Yr*US equity: all capVanguard Total Stock Market ETF VTI 96,693 2,954 3,686 0.04 No No 3.6 10.2 10.0 13.7 8.7 9.3 9.6 14.9Schwab Fundamental U.S. Broad Market Index ETF FNDB 253 21 1,561 0.25 No Yes 4.0 9.6 9.0 - 8.7 9.4 9.7 -US equity: large capVanguard Mega Cap ETF MGC 1,444 45 265 0.07 No No 5.3 10.9 10.8 13.4 9.5 9.3 9.6 14.2Vanguard S&P 500 ETF VOO 96,509 2,856 516 0.04 No No 4.3 10.4 10.5 - 9.1 9.2 9.6 14.4iShares Edge MSCI Multifactor USA ETF LRGF 1,155 267 152 0.20 No Yes -0.7 9.0 - - 8.3 9.2 - -JPMorgan Diversified Return U.S. Equity ETF JPUS 547 33 484 0.19 No Yes 2.1 9.5 - - 7.8 8.0 - -ProShares Large Cap Core Plus CSM 787 30 326 0.45 No Yes 3.3 10.7 10.8 - 8.0 9.0 9.6 -VictoryShares US 500 Volatility Wtd ETF CFA 609 49 503 0.35 No Yes 0.6 9.7 - - 8.3 9.0 - -US equity: large cap growthiShares S&P 500 Growth ETF IVW 20,439 845 303 0.18 No No 7.7 11.6 12.5 15.1 10.2 10.2 10.3 13.9Invesco S&P 500 Pure Growth ETF RPG 2,225 156 121 0.35 No Yes 0.8 8.3 9.8 16.8 10.6 10.5 10.7 16.7Vanguard Mega Cap Growth Index ETF MGK 3,738 153 122 0.07 No No 6.6 11.3 11.9 14.9 10.5 10.7 10.8 14.6US equity: large cap valueiShares S&P 500 Value ETF IVE 14,429 1,328 385 0.18 No No 0.4 8.4 7.9 11.3 9.2 9.5 9.8 15.6Vanguard Mega Cap Value Index ETF MGV 2,015 84 152 0.07 No No 3.8 10.4 9.8 11.9 9.6 9.2 9.4 14.6Invesco S&P 500 Pure Value ETF RPV 895 95 110 0.35 No Yes 2.5 9.1 8.1 16.0 9.5 12.1 12.2 23.0iShares Edge MSCI USA Value Factor ETF VLUE 3,435 394 154 0.15 No Yes 3.7 10.2 9.6 - 8.9 10.6 10.5 -US equity: mid capiShares Core S&P Mid-Cap ETF IJH 44,558 1,484 404 0.07 No No -1.3 9.0 8.2 14.6 8.3 10.4 10.6 17.0Vanguard Mid Cap ETF VO 21,973 410 372 0.05 No No -0.9 7.2 8.1 14.6 7.5 9.6 9.9 16.6John Hancock Multifactor Mid Cap ETF JHMM 658 181 695 0.45 No Yes -1.0 8.4 - - 7.8 9.6 - -WisdomTree MidCap Earnings Fund EZM 1,066 87 559 0.38 No Yes -2.2 8.0 7.3 15.6 9.1 11.1 11.4 18.2US equity: smid capVanguard Extended Market Index ETF VXF 6,011 304 3,316 0.08 No No -0.1 9.0 7.6 14.5 8.5 11.3 11.6 18.1Schwab Fundamental U.S. Small Company Index ETF FNDA 3,087 264 888 0.25 No Yes -0.2 9.1 7.5 - 8.6 12.0 12.1 -US equity: small capiShares Core S&P Small-Cap ETF IJR 41,120 3,945 606 0.07 No No 2.9 11.9 9.2 14.9 10.3 13.3 13.3 19.0Vanguard Small Cap ETF VB 21,870 608 1,418 0.05 No No 0.7 9.2 7.6 14.6 8.7 11.3 11.7 18.9WisdomTree SmallCap Earnings Fund EES 690 58 816 0.38 No Yes 0.7 11.8 7.6 15.8 9.4 14.7 14.6 21.4US equity: ESGiShares MSCI USA ESG Select ETF SUSA 730 19 121 0.25 No No 1.4 9.7 9.4 12.0 8.2 9.4 9.7 14.6iShares MSCI KLD 400 Social ETF DSI 1,135 44 397 0.25 No No 1.8 8.9 9.1 12.5 9.0 9.6 9.7 14.3US equity: dividend growthProShares S&P 500 Dividend Aristocrats ETF NOBL 3,448 412 54 0.35 No Yes 3.9 9.6 9.7 - 9.4 9.0 - -SPDR S&P Dividend ETF SDY 15,292 435 112 0.35 No Yes 3.8 10.8 9.7 12.6 8.0 8.9 9.2 14.0Vanguard Dividend Appreciation ETF VIG 28,283 675 187 0.08 No Yes 5.7 10.8 9.0 12.4 9.3 8.2 9.3 12.7WisdomTree U.S. Quality Dividend Growth Fund DGRW 2,289 192 279 0.28 No Yes 5.3 11.5 11.1 - 10.3 9.8 10.2 -US equity: dividend yieldALPS Sector Dividend Dogs ETF SDOG 2,128 129 50 0.40 No Yes 0.4 9.1 8.5 - 9.6 11.0 10.6 -Vanguard High Dividend Yield ETF VYM 21,023 770 409 0.08 No Yes 1.4 9.6 9.4 12.4 8.8 8.6 9.1 14.1US equity: quality yieldSchwab U.S. Dividend Equity ETF™ SCHD 7,719 717 103 0.07 No Yes 3.3 10.9 9.7 - 10.6 9.1 9.4 -FlexShares Quality Dividend Index Fund QDF 1,725 96 143 0.37 No Yes 4.3 9.6 9.3 - 9.0 9.4 9.5 -US sectors: communication servicesCommunication Services Select Sector SPDR XLC 3,666 2,433 27 0.13 No No - - - - - - - -Vanguard Communication Services ETF VOX 1,248 190 80 0.10 No No -11.0 0.2 1.5 9.9 9.9 11.7 11.2 14.2US sectors: consumer discretionaryConsumer Discretionary Select Sector SPDR Fund XLY 12,954 6,823 66 0.13 No No 12.3 9.8 11.6 18.7 11.7 11.2 11.9 17.4Vanguard Consumer Discretionary ETF VCR 2,717 104 328 0.10 No No 9.0 9.0 10.4 18.6 11.2 10.9 11.6 18.1US sectors: consumer staplesConsumer Staples Select Sector SPDR Fund XLP 9,152 15,195 33 0.13 No No 5.4 5.3 7.6 11.9 13.0 10.3 10.6 11.4Vanguard Consumer Staples ETF VDC 4,180 131 95 0.10 No No 5.9 5.5 7.7 12.3 12.4 9.9 10.3 11.4US sectors: energyEnergy Select Sector SPDR Fund XLE 15,249 13,869 31 0.13 No No -0.4 1.7 -3.1 5.4 17.0 18.2 17.9 20.6Vanguard Energy ETF VDE 3,651 235 140 0.10 No No 0.5 1.4 -3.8 4.9 17.0 19.2 18.8 21.1US sectors: financialsFinancial Select Sector SPDR Fund XLF 27,872 58,685 68 0.13 No No -3.2 10.7 10.5 10.2 11.7 14.7 13.5 23.5Vanguard Financials ETF VFH 7,315 613 412 0.10 No No -3.8 10.8 10.3 10.6 10.5 14.2 12.9 21.7US sectors: healthcareHealth Care Select Sector SPDR Fund XLV 17,887 9,026 64 0.13 No No 8.3 8.5 12.1 14.9 12.0 11.8 11.7 13.6Vanguard Health Care ETF VHT 8,302 250 370 0.10 No No 9.0 9.1 12.6 15.8 11.5 12.2 12.2 14.1US sectors: industrials
Source: Morningstar Direct, UBS CIO WMR. Note: Number of securities only includes long positions.
Exchange-traded funds
UBS Chief Investment Office Americas, Wealth Management 1 November 2018 7

29 October 2018135 Assets ADTV # of Expense Actively Smart Market Price Total Returns (%) Volatility (%)
Ticker (USD Mil) (1,000/shrs) Securities Ratio (%) Managed Beta 1-Yr 3-Yr* 5-Yr* 10-Yr* 1-Yr 3-Yr* 5-Yr* 10-Yr*Industrial Select Sector SPDR Fund XLI 10,895 13,370 73 0.13 No No -4.3 9.9 9.0 13.6 12.7 11.8 11.6 18.4Vanguard Industrials ETF VIS 3,442 142 354 0.10 No No -5.1 9.2 8.3 13.4 11.7 12.0 11.8 19.0US sectors: information technologyVanguard Information Technology ETF VGT 19,729 627 335 0.10 No No 11.5 18.6 17.8 18.3 14.0 13.8 13.1 17.3US sectors: materialsMaterials Select Sector SPDR Fund XLB 3,173 7,251 25 0.13 No No -12.6 6.0 4.9 9.9 10.2 14.6 14.4 20.7Vanguard Materials ETF VAW 2,391 110 122 0.10 No No -13.8 6.8 4.8 11.0 10.0 14.6 14.5 21.1US sectors: real estateReal Estate Select Sector SPDR XLRE 2,482 2,979 33 0.13 No No 3.1 4.7 - - 10.9 - - -Vanguard Real Estate ETF VNQ 30,122 5,321 187 0.12 No No -0.3 3.6 6.7 12.5 12.5 12.6 13.5 24.8US sectors: utilitiesUtilities Select Sector SPDR Fund XLU 7,887 16,989 30 0.13 No No 1.8 11.2 10.4 10.9 11.2 12.0 12.6 13.1Vanguard Utilities ETF VPU 2,966 154 72 0.10 No No 2.4 12.0 10.7 11.4 11.3 11.7 12.4 13.0US industryiShares North American Tech-Software ETF IGV 1,935 511 66 0.47 No No 12.9 19.7 18.5 18.2 13.2 13.9 13.8 18.3Invesco KBW Bank ETF KBWB 791 357 24 0.35 No No -4.2 11.1 10.0 - 13.5 19.6 17.6 -iShares U.S. Financial Services ETF IYG 1,530 94 123 0.43 No No -0.6 11.4 10.9 9.7 11.5 16.5 15.5 23.8iShares U.S. Oil Equipment & Services ETF IEZ 256 62 41 0.43 No No -9.2 -8.5 -13.9 0.3 24.9 27.9 27.2 31.2VanEck Vectors Oil Services ETF OIH 1,040 6,730 27 0.35 No No -11.1 -10.2 -14.6 - 24.8 27.5 26.9 -iShares U.S. Oil & Gas Exploration & Production ETF IEO 445 99 70 0.43 No No 7.7 1.3 -4.8 5.7 17.9 24.9 23.2 26.1MLPsAlerian MLP ETF AMLP 8,804 13,242 27 0.85 No No -1.2 -2.5 -4.5 - 19.7 18.3 16.7 -First Trust North American Energy Infrastructure Fund EMLP 2,123 461 60 0.95 Yes No -4.5 3.3 2.8 - 10.3 11.2 11.5 -Global X MLP ETF MLPA 877 511 21 0.45 No No -2.8 -1.7 -5.3 - 20.2 18.8 17.4 -International developed marketsiShares Core MSCI EAFE ETF IEFA 54,413 7,883 2,502 0.08 No No -8.6 3.6 1.9 - 9.0 10.8 11.0 -Vanguard FTSE Developed Markets ETF VEA 64,590 10,352 3,979 0.07 No No -9.1 3.5 1.7 7.1 9.0 10.1 10.6 18.0Goldman Sachs ActiveBeta International Equity ETF GSIE 1,075 196 832 0.25 No Yes -7.6 - - - 8.2 - - -Hartford Multifactor Developed Markets (ex-US) ETF RODM 859 345 509 0.29 No Yes -5.9 5.5 - - 6.9 9.3 - -iShares Edge MSCI Multifactor Intl ETF INTF 939 279 235 0.30 No Yes -9.6 3.6 - - 9.5 10.4 - -Schwab Fundamental International Large Company Index ETF FNDF 3,837 662 887 0.25 No Yes -7.6 4.4 1.6 - 9.9 11.1 11.5 -International developed markets: ESGiShares MSCI EAFE ESG Optimized ETF ESGD 412 41 458 0.20 No No -8.6 - - - 9.0 - - -Emerging marketsiShares Core MSCI Emerging Market ETF IEMG 43,788 14,963 1,920 0.14 No No -15.5 5.1 0.0 - 13.1 14.0 14.4 -Vanguard FTSE Emerging Markets ETF VWO 52,101 15,929 4,075 0.14 No No -16.0 4.2 -0.2 7.8 13.6 13.9 14.6 21.8Goldman Sachs ActiveBeta Emerging Markets Equity ETF GEM 1,520 168 423 0.45 No Yes -14.4 4.7 - - 12.9 13.7 - -iShares Edge MSCI Multifactor Emerging Markets ETF EMGF 228 76 199 0.45 No Yes -18.0 - - - 12.0 - - -Emerging markets: ESGiShares MSCI EM ESG Optimized ETF ESGE 330 80 316 0.25 No No -14.8 - - - 13.6 - - -Emerging markets: countriesiShares MSCI China ETF MCHI 3,309 5,339 299 0.62 No No -20.3 4.3 3.8 - 17.5 17.9 19.2 -SPDR S&P China ETF GXC 878 78 371 0.59 No No -20.1 4.7 4.1 11.0 17.4 18.1 19.1 22.6iShares MSCI South Korea Capped ETF EWY 3,330 3,009 119 0.62 No No -20.4 4.1 -0.9 10.2 15.5 16.7 15.8 25.9iShares MSCI Thailand Capped ETF THD 429 244 121 0.62 No No -2.6 11.7 3.5 18.1 18.4 13.8 15.3 24.4Broad fixed incomeiShares Core Total USD Bond Market ETF IUSB 2,334 134 6,754 0.06 No No -1.7 1.6 - - 2.0 2.6 - -Vanguard Total Bond Market ETF BND 35,902 2,248 17,421 0.05 No No -1.6 1.1 1.8 3.8 2.2 2.8 2.8 3.3Fidelity Total Bond ETF FBND 430 53 862 0.36 Yes No -1.2 2.3 - - 1.8 3.0 - -PIMCO Total Return Active ETF BOND 1,887 98 713 0.61 Yes No -0.8 1.9 2.5 - 2.0 2.6 2.9 -SPDR DoubleLine Total Return Tactical ETF TOTL 2,848 410 730 0.55 Yes No -0.9 1.5 - - 1.7 2.0 - -Broad fixed income: ultra short durationiShares Short Maturity Bond Fund NEAR 4,932 829 416 0.25 Yes No 1.7 1.6 1.2 - 0.2 0.2 0.2 -PIMCO Enhanced Short Maturity Active Exchange-Traded Fund MINT 11,107 913 878 0.35 Yes No 1.8 1.9 1.3 - 0.2 0.3 0.3 -US governmentiShares Core US Treasury Bond ETF GOVT 6,662 1,039 114 0.15 No No -1.4 0.2 1.1 - 2.6 3.2 3.1 -Mortgage backed securitiesVanguard Mortgage-Backed Securities ETF VMBS 7,142 571 2,829 0.07 No No -1.2 0.8 1.6 - 1.9 1.9 2.0 -Investment grade creditiShares iBoxx $ Investment Grade Corporate Bond ETF LQD 31,460 6,721 1,966 0.15 No No -3.5 2.4 2.9 6.6 3.5 4.3 4.4 6.6SPDR Portfolio Intermediate Term Corporate Bond ETF SPIB 3,754 935 3,838 0.07 No No -1.1 1.9 2.2 - 1.7 2.3 2.3 -SPDR Portfolio Short Term Corporate Bond ETF SPSB 4,497 927 1,125 0.07 No No 0.5 1.4 1.3 - 0.7 0.9 0.8 -High yield creditiShares iBoxx $ High Yield Corporate Bond ETF HYG 14,421 15,101 997 0.49 No No 0.1 4.9 3.2 9.0 2.1 4.6 4.9 10.1
Source: Morningstar Direct, UBS CIO WMR. Note: Number of securities only includes long positions.
Exchange-traded funds
UBS Chief Investment Office Americas, Wealth Management 1 November 2018 8

29 October 2018135 Assets ADTV # of Expense Actively Smart Market Price Total Returns (%) Volatility (%)
Ticker (USD Mil) (1,000/shrs) Securities Ratio (%) Managed Beta 1-Yr 3-Yr* 5-Yr* 10-Yr* 1-Yr 3-Yr* 5-Yr* 10-Yr*Xtrackers USD High Yield Corporate Bond ETF HYLB 1,920 328 1,058 0.20 No No 0.1 - - - 2.1 - - -First Trust Tactical High Yield ETF HYLS 1,253 140 295 1.10 Yes No 1.4 4.2 3.7 - 1.8 3.2 3.7 -Senior loansFirst Trust Senior Loan Fund FTSL 1,881 204 279 0.88 Yes No 3.1 3.6 3.1 - 1.1 2.1 2.0 -Invesco Senior Loan ETF BKLN 6,730 4,977 151 0.65 No No 3.4 4.1 2.5 - 1.2 2.6 2.5 -SPDR Blackstone/GSO Senior Loan ETF SRLN 3,429 557 325 0.70 Yes No 3.5 3.8 2.8 - 1.1 1.9 2.2 -PreferredsiShares U.S. Preferred Stock ETF PFF 15,203 3,196 309 0.46 No No -0.9 3.0 5.0 9.5 3.2 4.1 4.0 15.6First Trust Preferred Securities and Income ETF FPE 3,379 760 243 0.85 Yes No -1.7 5.3 6.4 - 2.1 3.7 3.4 -Invesco Variable Rate Preferred ETF VRP 2,082 327 208 0.50 No No -1.5 5.0 - - 1.7 4.4 - -Emerging market debtiShares J.P. Morgan USD Emerging Markets Bond ETF EMB 14,782 3,378 417 0.40 No No -5.2 3.6 3.5 10.0 5.4 5.9 5.8 9.0Invesco Emerging Markets Sovereign Debt ETF PCY 3,752 1,551 112 0.50 No Yes -7.0 2.7 3.8 11.3 5.8 6.8 6.6 10.6VanEck Vectors J.P. Morgan EM Local Currency Bond ETF EMLC 4,494 2,000 289 0.30 No No -7.8 2.2 -3.2 - 11.6 11.3 10.8 -Municipal bondsVanguard Tax-Exempt Bond Index ETF VTEB 3,493 745 4,270 0.09 No No -0.5 1.9 - - 2.2 3.2 - -First Trust Managed Municipal ETF FMB 456 50 529 0.50 Yes No 0.0 2.9 - - 2.2 3.5 - -VanEck Vectors Intermediate Municipal Index ETF ITM 1,593 122 2,663 0.24 No No -1.7 1.5 3.0 4.6 3.0 4.2 3.9 4.9Invesco National AMT-Free Municipal Bond ETF PZA 1,558 243 398 0.28 No No -0.5 2.5 4.8 5.7 2.9 3.6 3.5 5.3VanEck Vectors High-Yield Municipal Index ETF HYD 2,412 357 1,807 0.35 No No 2.7 4.2 6.0 - 2.2 4.5 4.1 -Broad commoditiesInvesco DB Commodity Index Tracking Fund DBC 2,579 1,919 22 0.85 No Yes 8.5 4.7 -7.8 -3.9 8.5 12.0 14.5 18.3United States Commodity Index Fund, LP USCI 581 68 43 1.04 No Yes 1.6 -0.2 -5.8 - 8.2 7.8 9.5 -Longer-term investment themesRobo-Stox Global Robotics and Automation Index ETF ROBO 1,514 356 91 0.95 No No -13.8 13.4 6.8 - 14.9 14.5 - -First Trust Cloud Computing ETF SKYY 1,743 320 30 0.60 No No 14.3 18.6 15.0 - 9.3 12.3 12.5 -Invesco NASDAQ Internet ETF PNQI 519 44 95 0.60 No No -0.3 13.2 12.3 23.7 14.5 16.1 15.7 20.6ETFMG Prime Cyber Security ETF HACK 1,535 364 55 0.64 No No 12.5 9.6 - - 11.4 15.2 - -Global X FinTech Thematic ETF FINX 332 229 40 0.68 No No 10.7 - - - 15.9 - - -VanEck Vectors Agribusiness Index ETF MOO 833 60 61 0.54 No No 1.6 9.7 5.0 11.5 6.9 8.6 10.7 19.4iShares MSCI ACWI Low Carbon Target ETF CRBN 505 13 1,239 0.20 No No -3.6 6.4 - - 8.5 9.3 - -VanEck Vectors Global Alternative Energy ETF GEX 78 4 32 0.63 No No -14.3 0.9 0.1 -0.3 11.8 12.3 15.8 27.4Invesco Cleantech™ ETF PZD 150 11 52 0.67 No No -11.6 10.0 5.4 9.1 10.7 12.6 13.6 21.7Invesco S&P Global Water Index ETF CGW 531 36 55 0.61 No No -7.7 6.1 5.4 10.3 9.1 9.8 10.3 15.7iShares U.S. Medical Devices ETF IHI 2,623 164 60 0.43 No No 16.1 19.8 18.3 17.4 12.6 12.4 12.5 17.5SPDR S&P Health Care Equipment ETF XHE 668 130 75 0.35 No Yes 18.6 22.1 18.0 - 14.1 14.1 14.3 -Shorter-term investment themesiShares MSCI EM ESG Optimized ETF ESGE 330 80 316 0.25 No No -14.8 - - - 13.6 - - -Invesco Dynamic Leisure and Entertainment ETF PEJ 117 23 31 0.63 No Yes -2.5 2.2 4.8 17.1 7.7 11.9 12.2 20.0SPDR SSGA Gender Diversity Index ETF SHE 341 11 170 0.20 No No 4.5 - - - 7.8 - - -Fidelity Total Bond ETF FBND 430 53 862 0.36 Yes No -1.2 2.3 - - 1.8 3.0 - -PIMCO Total Return Active ETF BOND 1,887 98 713 0.61 Yes No -0.8 1.9 2.5 - 2.0 2.6 2.9 -SPDR DoubleLine Total Return Tactical ETF TOTL 2,848 410 730 0.55 Yes No -0.9 1.5 - - 1.7 2.0 - -First Trust Senior Loan Fund FTSL 1,881 204 279 0.88 Yes No 3.1 3.6 3.1 - 1.1 2.1 2.0 -Invesco Senior Loan ETF BKLN 6,730 4,977 151 0.65 No No 3.4 4.1 2.5 - 1.2 2.6 2.5 -SPDR Blackstone/GSO Senior Loan ETF SRLN 3,429 557 325 0.70 Yes No 3.5 3.8 2.8 - 1.1 1.9 2.2 -SPDR Portfolio Short Term Corporate Bond ETF SPSB 4,497 927 1,125 0.07 No No 0.5 1.4 1.3 - 0.7 0.9 0.8 -VanEck Vectors Natural Resources ETF HAP 86 7 298 0.50 No No -2.1 7.7 0.3 5.9 9.4 12.0 13.6 19.7FlexShares Morningstar Global Upstream Natural Resources Index Fund GUNR 5,312 323 154 0.46 No No 0.0 10.2 0.4 - 10.5 14.5 15.5 -
Source: Morningstar Direct, UBS CIO WMR. Note: Number of securities only includes long positions.
Exchange-traded funds
UBS Chief Investment Office Americas, Wealth Management 1 November 2018 9

As of 29 October 2018 Intraday1,069 NAV Price Assets ADTV # of Expense Actively
Ticker Ticker ($/share) (USD Mil) (1,000/shrs) Securities Ratio (%) ManagedU.S. Broad Market
Broad MarketTraditional cap-weighted
iShares Core S&P Total U.S. Stock Market ETF ITOT ITOTIV 60.13 14,728 1,107 3,433 0.03 NoVanguard Total Stock Market ETF VTI VTIIV 135.02 96,693 2,954 3,686 0.04 NoiShares Russell 3000 ETF IWV IWVIV 155.47 8,081 229 3,014 0.20 NoVanguard Russell 3000 Index ETF VTHR VTHRIV 120.48 370 9 2,933 0.15 NoSPDR Portfolio Total Stock Market ETF SPTM SPTMIV 32.72 2,496 556 2,674 0.03 NoFidelity NASDAQ Composite Index Tracking Stock Fund ONEQ ONEQI 276.92 1,631 43 972 0.21 NoSchwab U.S. Broad Market ETF™ SCHB SCHBIV 63.48 12,456 899 2,453 0.03 NoiShares Dow Jones U.S. ETF IYY IYYIV 131.14 1,125 23 1,233 0.20 No
Fundamentally weightedSchwab Fundamental U.S. Broad Market Index ETF FNDB FNDBIV 36.24 253 21 1,561 0.25 NoWisdomTree Total Earnings Fund EXT EXTIV 30.81 84 19 1,241 0.28 NoWisdomTree Total Dividend Fund DTD DTDIV 89.59 591 16 865 0.28 No
MultifactorFlexShares Morningstar US Market Factors Tilt Index Fund TILT TILTIV 106.27 1,353 37 1,910 0.25 NoVanguard U.S. Multifactor ETF VFMF VFMFIV 74.05 74 12 628 0.18 YesFirst Trust Total US Market AlphaDEX ETF TUSA TUSAIV 31.31 14 4 1,202 0.70 NoBarron's 400 ETF BFOR BFORIV 38.84 165 10 398 0.66 NoInvesco Dynamic Market ETF PWC PWCIV 95.38 157 3 101 0.60 No
Single factorInvesco DWA NASDAQ Momentum ETF DWAQ DWAQIV 93.64 47 3 102 0.60 No
ESG relatediShares MSCI KLD 400 Social ETF DSI DSIIV 95.81 1,135 44 397 0.25 No
OtherInvesco Raymond James SB-1 Equity ETF RYJ RYJIV 42.04 168 6 164 0.75 NoFirst Trust US Equity Opportunities ETF FPX FPXIV 65.72 1,052 67 102 0.59 NoDirexion All Cap Insider Sentiment Shares KNOW KNOWIV 37.16 201 19 104 0.59 NoInvesco Insider Sentiment ETF NFO NFAIV 60.71 66 2 102 0.60 NoFirst Trust Value Line 100 ETF FVL FVLIV 19.70 41 5 98 0.70 NoInvesco S&P Spin-Off ETF CSD CSDIV 47.96 181 7 49 0.64 NoInsightShares Patriotic Employers ETF HONR HONRIV 24.07 26 0 105 0.65 NoGlobal X Guru™ Index ETF GURU GURUIV 28.81 55 5 69 0.75 NoGoldman Sachs Hedge Industry VIP ETF GVIP GVIPIV 51.08 108 21 49 0.45 No
U.S. Market CapLarge-Cap
Traditional cap-weightedVanguard Russell 1000 Index ETF VONE VONEIV 120.67 872 27 989 0.12 NoiShares Russell 1000 ETF IWB IWBIV 146.27 16,694 1,120 987 0.15 NoSPDR Portfolio Large Cap ETF SPLG SPLGIV 30.84 1,593 796 757 0.03 NoSchwab U.S. Large-Cap ETF™ SCHX SCHXIV 62.98 13,810 1,312 765 0.03 NoVanguard Large Cap ETF VV VVIV 120.98 12,481 260 618 0.05 NoiShares Core S&P 500 ETF IVV IVVIV 265.61 153,896 3,986 509 0.04 NoSPDR S&P 500 ETF SPY SPYIV 263.86 244,952 83,197 507 0.09 NoVanguard S&P 500 ETF VOO VOOIV 242.50 96,509 2,856 516 0.04 NoVanguard Mega Cap ETF MGC MGCIV 91.50 1,444 45 265 0.07 NoiShares Russell Top 200 ETF IWL IWLIV 61.46 157 24 198 0.15 NoiShares S&P 100 ETF OEF OEFIV 118.14 4,563 641 106 0.20 NoiShares Morningstar Large-Cap ETF JKD JKDIV 154.27 910 22 91 0.20 NoInvesco S&P 500 Top 50 ETF XLG XLGIV 190.47 753 25 53 0.20 No
Equal weightedInvesco Russell 1000 Equal Weight ETF EQAL EQALIV 29.71 432 40 972 0.20 NoiShares MSCI USA Equal Weighted ETF EUSA EUSAIV 53.05 185 21 626 0.15 NoInvesco S&P 500 Equal Weight ETF RSP RSPIV 96.63 14,407 838 509 0.20 NoInvesco Russell Top 200 Equal Weight ETF EQWL EQWLIV 51.57 59 2 195 0.25 NoDirexion NASDAQ-100 Equal Weighted Index Shares QQQE QQQEIV 41.83 173 27 107 0.35 NoFirst Trust NASDAQ-100 Equal Weight Index Fund QQEW QQEWIV 56.02 491 35 104 0.60 No
Fundamentally weightedInvesco FTSE RAFI US 1000 ETF PRF PRFIV 109.23 4,984 129 991 0.39 NoSchwab Fundamental U.S. Large Company Index ETF FNDX FNDXIV 36.45 4,409 353 676 0.25 NoOppenheimer Large Cap Revenue ETF RWL RWLIV 49.88 962 57 507 0.39 NoWisdomTree Earnings 500 Fund EPS EPSIV 30.09 207 28 498 0.28 NoWisdomTree LargeCap Dividend Fund DLN DLNIV 89.05 1,886 48 295 0.28 No
MultifactorXtrackers Russell 1000 Enhanced Beta ETF DEUS DEUSIV 30.39 155 27 832 0.17 NoJohn Hancock Multifactor Large Cap ETF JHML JHMLIV 33.96 720 164 782 0.35 NoJPMorgan Diversified Return U.S. Equity ETF JPUS JPUSIV 68.34 547 33 484 0.19 NoGlobal X Scientific Beta US ETF SCIU SCIUIV 30.15 124 27 374 0.19 NoGoldman Sachs ActiveBeta US Large Cap Equity ETF GSLC GSLCIV 53.05 3,799 298 460 0.09 NoFirst Trust Large Cap Core AlphaDEX Fund FEX FEXIV 55.44 1,383 97 376 0.61 NoProShares Large Cap Core Plus CSM CSMIV 65.13 787 30 326 0.45 NoHartford Multifactor US Equity ETF ROUS ROUSIV 29.44 165 29 353 0.19 NoiShares Edge MSCI Multifactor USA ETF LRGF LRGFIV 30.23 1,155 267 152 0.20 NoFirst Trust Mega Cap AlphaDEX Fund FMK FMKIV 34.32 17 2 51 0.70 NoFirst Trust Capital Strength ETF FTCS FTCSIV 50.26 1,180 142 51 0.61 No
Single factoriShares Edge MSCI USA Size Factor ETF SIZE SIZEIV 80.10 186 15 628 0.15 NoVictoryShares US 500 Volatility Wtd ETF CFA CFAIV 46.48 609 49 503 0.35 NoiShares Edge MSCI Min Vol USA ETF USMV USMVIV 53.86 16,469 2,225 210 0.15 NoSPDR SSGA US Large Cap Low Volatility Index ETF LGLV LGLVIV 90.98 123 8 148 0.12 NoInvesco S&P 500 Low Volatility ETF SPLV SPLVIV 47.61 7,239 2,291 102 0.25 NoInvesco S&P 500 ex-Rate Sensitive Low Volatility ETF XRLV XRLVIV 33.34 133 43 102 0.25 No
Source: Morningstar Direct, UBS. Note: No. of securities only includes long positions.
Exchange-traded funds
UBS Chief Investment Office Americas, Wealth Management 1 November 2018 10

As of 29 October 2018 Intraday1,069 NAV Price Assets ADTV # of Expense Actively
Ticker Ticker ($/share) (USD Mil) (1,000/shrs) Securities Ratio (%) ManagedInvesco S&P 500 Quality ETF SPHQ SPHQIV 29.65 1,258 202 101 0.15 NoiShares Edge MSCI USA Quality Factor ETF QUAL QUALIV 81.47 6,721 603 128 0.15 NoVanEck Vectors Wide Moat ETF MOAT MOATIV 43.38 1,523 155 55 0.48 NoiShares Edge MSCI USA Momentum Factor ETF MTUM MTUMIV 103.41 9,121 1,138 126 0.15 NoInvesco DWA Momentum ETF PDP PDPIV 51.09 1,395 107 103 0.63 NoInvesco S&P 500 High Beta ETF SPHB SPHBIV 37.39 123 96 102 0.25 No
ESG relatediShares MSCI USA ESG Optimized ETF ESGU ESGUIV 57.68 101 11 297 0.15 NoiShares MSCI USA ESG Select ETF SUSA SUSAIV 107.71 730 19 121 0.25 NoOppenheimer ESG Revenue ETF ESGL ESGLIV 30.04 22 2 238 0.40 NoSPDR S&P 500 Fossil Fuel Reserves Free ETF SPYX SPYXIV 64.21 278 12 462 0.20 NoGoldman Sachs JUST U.S. Large Cap Equity ETF JUST JUSTIV 37.96 248 23 427 0.20 NoInsightShares LGBT Employment Equality ETF PRID PRIDIV 24.47 27 0 297 0.65 NoSPDR SSGA Gender Diversity Index ETF SHE SHEIV 69.68 341 11 170 0.20 No
Faith basedGlobal X S&P 500 Catholic Values ETF CATH CATHIV 32.89 144 16 464 0.29 No
Covered callHorizons S&P 500 Covered Call ETF HSPX HSPXIV 46.78 76 18 507 0.65 NoInvesco S&P 500 BuyWrite ETF PBP MNV 20.89 322 82 506 0.49 NoHorizons Nasdaq 100 Covered Call ETF QYLD QYLDIV 22.72 382 170 105 0.60 No
Dynamic allocationPacer Trendpilot 750 ETF PTLC PTLCIV 28.51 1,287 218 506 0.60 NoInvesco S&P 500 Downside Hedged ETF PHDG PHDGIV 27.69 26 5 393 0.39 YesVictoryShares US 500 Enhanced Volatility Wtd ETF CFO CFOIV 46.47 1,042 91 503 0.35 NoPacer Trendpilot 100 ETF PTNQ PTNQIV 31.83 313 63 104 0.65 No
ActiveDavis Select US Equity ETF DUSA DUSAIV 22.08 128 19 24 0.65 Yes
OtherALPS Equal Sector Weight ETF EQL EQLIV 66.78 148 4 12 0.48 NoInvesco BuyBack Achievers™ ETF PKW PKWIV 56.01 1,170 63 131 0.63 NoInvesco QQQ Trust QQQ QXV 163.23 64,971 47,249 104 0.20 NoInvesco Defensive Equity ETF DEF DEFIV 46.02 182 19 101 0.60 NoPacer US Cash Cows 100 ETF COWZ COWZIV 27.53 164 71 101 0.49 NoFirst Trust NASDAQ-100 Ex-Technology Sector Index Fund QQXT QQXTIV 46.90 80 8 68 0.60 NoSPDR Dow Jones Industrial Average ETF DIA DIAIV 244.47 20,885 4,668 31 0.17 No
Mid-CapTraditional cap-weighted
iShares Russell Mid-Cap ETF IWR IWRIV 49.13 16,519 755 792 0.20 NoSchwab U.S. Mid-Cap ETF™ SCHM SCHMIV 51.22 4,789 346 508 0.05 NoiShares Core S&P Mid-Cap ETF IJH IJHIV 178.27 44,558 1,484 404 0.07 NoVanguard S&P Mid-Cap 400 Index ETF IVOO IVOOIV 120.37 849 28 402 0.15 NoSPDR S&P MidCap 400 ETF MDY MDYIV 325.28 18,461 1,026 400 0.24 NoVanguard Mid Cap ETF VO VOIV 145.69 21,973 410 372 0.05 NoiShares Morningstar Mid-Cap ETF JKG JKGIV 169.78 672 8 195 0.25 No
Equal weightedInvesco Russell MidCap Equal Weight ETF EQWM EQWMIV 45.06 23 1 778 0.25 NoInvesco S&P MidCap 400 Equal Weight ETF EWMC EWMCIV 61.55 97 4 400 0.40 No
Fundamentally weightedWisdomTree MidCap Earnings Fund EZM EZMIV 36.77 1,066 87 559 0.38 NoWisdomTree MidCap Dividend Fund DON DONIV 33.70 3,136 322 389 0.38 NoOppenheimer Mid Cap Revenue ETF RWK RWKIV 55.71 344 14 400 0.39 No
MultifactorJohn Hancock Multifactor Mid Cap ETF JHMM JHMMIV 32.36 658 181 695 0.45 NoFirst Trust Mid Cap Core AlphaDEX Fund FNX FNXIV 62.51 831 46 452 0.63 NoInvesco Zacks Mid-Cap ETF CZA CZAIV 61.98 233 10 101 0.68 No
Single factorInvesco S&P MidCap Low Volatility ETF XMLV XMLVIV 46.05 1,423 163 78 0.25 No
OtherPacer Trendpilot 450 ETF PTMC PTMCIV 31.05 622 98 402 0.62 No
SMID-CapVanguard Extended Market Index ETF VXF VXFIV 107.09 6,011 304 3,316 0.08 NoSPDR Portfolio Mid Cap ETF SPMD SPMDIV 31.91 1,008 296 1,004 0.05 No
Fundamentally weightedInvesco FTSE RAFI US 1500 Small-Mid ETF PRFZ PRFZIV 125.27 1,924 55 1,457 0.39 NoSchwab Fundamental U.S. Small Company Index ETF FNDA FNDAIV 36.15 3,087 264 888 0.25 No
Small-CapTraditional cap-weighted
Vanguard Russell 2000 Index ETF VTWO VTWOIV 117.82 1,438 69 2,058 0.15 NoiShares Russell 2000 ETF IWM IWMIV 146.67 44,196 22,537 2,033 0.19 NoSPDR Portfolio Small Cap ETF SPSM SPSMIV 29.01 1,310 470 1,996 0.05 NoSchwab U.S. Small-Cap ETF™ SCHA SCHAIV 66.34 7,369 458 1,755 0.05 NoVanguard Small Cap ETF VB VBIV 142.45 21,870 608 1,418 0.05 NoiShares Core S&P Small-Cap ETF IJR IJRIV 76.35 41,120 3,945 606 0.07 NoSPDR S&P 600 Small Cap ETF SLY SLYIV 66.12 1,067 85 603 0.15 NoVanguard S&P Small-Cap 600 Index ETF VIOO VIOOIV 139.77 954 41 604 0.15 NoiShares Morningstar Small-Cap ETF JKJ JKJIV 160.45 225 4 260 0.25 No
Equal weightedInvesco Russell 2000 Equal Weight ETF EQWS EQWSIV 41.53 21 1 1,985 0.25 NoInvesco S&P SmallCap 600 Equal Weight ETF EWSC EWSCIV 53.49 38 3 604 0.40 No
Fundamentally weightedWisdomTree SmallCap Earnings Fund EES EESIV 35.35 690 58 816 0.38 NoWisdomTree SmallCap Dividend Fund DES DESIV 26.95 2,002 186 713 0.38 NoOppenheimer Small Cap Revenue ETF RWJ RWJIV 66.84 474 21 596 0.39 No
Source: Morningstar Direct, UBS. Note: No. of securities only includes long positions.
Exchange-traded funds
UBS Chief Investment Office Americas, Wealth Management 1 November 2018 11

As of 29 October 2018 Intraday1,069 NAV Price Assets ADTV # of Expense Actively
Ticker Ticker ($/share) (USD Mil) (1,000/shrs) Securities Ratio (%) ManagedMultifactor
iShares Edge MSCI Multifactor USA Small-Cap ETF SMLF SMLFIV 38.91 173 33 535 0.30 NoFirst Trust Small Cap Core AlphaDEX Fund FYX FYXIV 59.49 640 58 526 0.63 NoJohn Hancock Multifactor Small Cap ETF JHSC JHSCIV 24.69 318 205 499 0.50 No
Single factorSPDR SSGA US Small Cap Low Volatility Index ETF SMLV SMLVIV 89.01 178 7 404 0.12 NoInvesco DWA SmallCap Momentum ETF DWAS DWASIV 47.59 341 66 202 0.60 NoInvesco S&P SmallCap Low Volatility ETF XSLV XSLVIV 45.63 1,294 128 122 0.25 No
ESG relatedNuShares ESG Small-Cap ETF NUSC NUSCIV 27.53 76 16 665 0.40 No
Micro-CapiShares Micro-Cap ETF IWC IWCIV 92.24 939 50 1,455 0.60 NoInvesco Zacks Micro Cap ETF PZI PZIIV 18.23 18 1 403 1.13 NoFirst Trust Dow Jones Select MicroCap Index Fund FDM FDMIV 45.66 136 17 243 0.60 No
U.S. StyleBroad Market Growth
iShares Core US Growth ETF IUSG IUSGIV 55.29 4,919 404 552 0.04 NoFirst Trust Multi Cap Growth AlphaDEX Fund FAD FADIV 65.30 179 16 676 0.70 NoClearBridge All Cap Growth ETF CACG CACGIV 28.09 64 17 87 0.53 Yes
Broad Market ValueiShares Core US Value ETF IUSV IUSVIV 52.19 4,425 456 678 0.04 NoFirst Trust Multi Cap Value AlphaDEX Fund FAB FABIV 51.78 83 4 675 0.66 NoCambria Shareholder Yield ETF SYLD SYLDIV 35.40 122 13 102 0.59 No
Large-Cap GrowthVanguard Russell 1000 Growth Index ETF VONG VONGIV 140.87 1,960 79 547 0.12 NoiShares Russell 1000 Growth ETF IWF IWFIV 137.48 39,245 1,548 547 0.20 NoSchwab U.S. Large-Cap Growth ETF™ SCHG SCHGIV 72.62 6,151 428 416 0.04 NoVanguard Growth ETF VUG VUGIV 141.77 33,635 690 326 0.05 NoSPDR Portfolio S&P 500 Growth ETF SPYG SPYGIV 34.07 3,417 1,428 301 0.04 NoiShares S&P 500 Growth ETF IVW IVWIV 157.85 20,439 845 303 0.18 NoVanguard S&P 500 Growth Index ETF VOOG VOOGIV 141.49 2,131 76 301 0.15 NoFirst Trust Large Cap Growth Opportunities AlphaDEX Fund FTC FTCIV 60.07 868 57 188 0.62 NoVanguard Mega Cap Growth Index ETF MGK MGKIV 113.22 3,738 153 122 0.07 NoiShares Russell Top 200 Growth ETF IWY IWYIV 75.62 1,183 81 130 0.20 NoNuShares ESG Large-Cap Growth ETF NULG NULGIV 32.79 57 9 113 0.35 NoInvesco S&P 500 Pure Growth ETF RPG RPGIV 103.78 2,225 156 121 0.35 NoiShares Morningstar Large-Cap Growth ETF JKE JKEIV 163.22 947 16 84 0.25 NoInvesco Russell Top 200 Pure Growth ETF PXLG PXLGIV 47.37 230 28 62 0.39 NoInvesco Dynamic Large Cap Growth ETF PWB PWBIV 43.21 618 43 52 0.57 NoSPDR MFS Systematic Growth Equity ETF SYG SYGIV 75.74 35 2 49 0.60 Yes
Large-Cap ValueVanguard Russell 1000 Value Index ETF VONV VONVIV 102.84 1,565 80 730 0.12 NoiShares Russell 1000 Value ETF IWD IWDIV 117.54 35,503 1,954 729 0.20 NoSchwab U.S. Large-Cap Value ETF™ SCHV SCHVIV 52.13 4,516 405 352 0.04 NoSPDR Portfolio S&P 500 Value ETF SPYV SPYVIV 28.87 1,872 664 383 0.04 NoiShares S&P 500 Value ETF IVE IVEIV 107.47 14,429 1,328 385 0.18 NoVanguard S&P 500 Value Index ETF VOOV VOOVIV 103.45 829 22 386 0.15 NoVanguard Value ETF VTV VTVIV 102.95 41,530 1,546 348 0.05 NoFirst Trust Large Cap Value AlphaDEX Fund FTA FTAIV 49.81 1,095 73 188 0.62 NoiShares Edge MSCI USA Value Factor ETF VLUE VLUEIV 80.61 3,435 394 154 0.15 NoVanguard Mega Cap Value Index ETF MGV MGVIV 74.70 2,015 84 152 0.07 NoiShares Russell Top 200 Value ETF IWX IWXIV 50.23 364 33 138 0.20 NoInvesco S&P 500 Pure Value ETF RPV RPVIV 63.00 895 95 110 0.35 NoNuShares ESG Large-Cap Value ETF NULV NULVIV 28.24 45 6 160 0.35 NoInvesco S&P 500 Enhanced Value ETF SPVU SPVUIV 33.05 23 3 99 0.13 NoiShares Morningstar Large-Cap Value ETF JKF JKFIV 100.83 380 7 77 0.25 NoInvesco Russell Top 200 Pure Value ETF PXLV PXLVIV 36.33 99 14 67 0.39 NoInvesco Dynamic Large Cap Value ETF PWV PWVIV 34.63 1,258 116 52 0.56 No
Mid-Cap GrowthiShares Russell Mid-Cap Growth ETF IWP IWPIV 117.36 8,169 245 420 0.25 NoiShares S&P MidCap 400 Growth ETF IJK IJKIV 204.22 7,102 89 253 0.25 NoVanguard S&P Mid-Cap 400 Growth Index ETF IVOG IVOGIV 126.84 733 24 252 0.20 NoSPDR S&P 400 Mid Cap Growth ETF MDYG MDYGIV 49.07 1,190 125 250 0.15 NoFirst Trust Mid Cap Growth AlphaDEX FNY FNYIV 38.93 219 47 226 0.70 NoiShares Morningstar Mid-Cap Growth ETF JKH JKHIV 201.13 292 7 201 0.30 NoVanguard Mid-Cap Growth ETF VOT VOTIV 123.80 5,275 125 185 0.07 NoInvesco Russell MidCap Pure Growth ETF PXMG PXMGIV 45.53 246 77 99 0.39 NoInvesco S&P MidCap 400 Pure Growth ETF RFG RFGIV 141.85 533 6 105 0.35 NoNuShares ESG Mid-Cap Growth ETF NUMG NUMGIV 28.63 47 4 84 0.40 No
Mid-Cap ValueiShares Russell Mid-Cap Value ETF IWS IWSIV 81.97 10,313 548 596 0.25 NoiShares S&P Mid-Cap 400 Value ETF IJJ IJJIV 149.74 5,610 87 294 0.25 NoSPDR S&P 400 Mid Cap Value ETF MDYV MDYVIV 48.14 887 107 292 0.15 NoVanguard S&P Mid-Cap 400 Value Index ETF IVOV IVOVIV 115.26 657 12 294 0.20 NoFirst Trust Mid Cap Value AlphaDEX FNK FNKIV 32.80 48 5 226 0.70 NoVanguard Mid-Cap Value ETF VOE VOEIV 102.48 8,400 285 211 0.07 NoiShares Morningstar Mid-Cap Value ETF JKI JKIIV 149.13 425 9 183 0.30 NoInvesco Russell MidCap Pure Value ETF PXMV PXMVIV 29.31 44 3 186 0.39 NoInvesco S&P MidCap 400 Pure Value ETF RFV RFVIV 63.90 100 5 88 0.35 NoNuShares ESG Mid-Cap Value ETF NUMV NUMVIV 26.28 46 4 77 0.40 No
Small-Cap GrowthVanguard Russell 2000 Growth Index ETF VTWG VTWGIV 131.98 271 15 1,317 0.20 NoiShares Russell 2000 Growth ETF IWO IWOIV 182.17 8,816 1,249 1,249 0.24 No
Source: Morningstar Direct, UBS. Note: No. of securities only includes long positions.
Exchange-traded funds
UBS Chief Investment Office Americas, Wealth Management 1 November 2018 12

As of 29 October 2018 Intraday1,069 NAV Price Assets ADTV # of Expense Actively
Ticker Ticker ($/share) (USD Mil) (1,000/shrs) Securities Ratio (%) ManagedVanguard Small Cap Growth ETF VBK VBKIV 160.48 7,731 144 658 0.07 NoInvesco Russell 2000 Pure Growth ETF PXSG PXSGIV 33.49 79 31 314 0.39 NoSPDR S&P 600 Small Cap Growth ETF SLYG SLYGIV 58.23 1,851 321 339 0.15 NoiShares S&P Small-Cap 600 Growth ETF IJT IJTIV 174.43 5,966 187 341 0.25 NoVanguard S&P Small-Cap 600 Growth Index ETF VIOG VIOGIV 149.59 445 26 337 0.20 NoiShares Morningstar Small-Cap Growth ETF JKK JKKIV 176.64 188 6 252 0.30 NoFirst Trust Small Cap Growth AlphaDEX FYC FYCIV 43.85 386 106 263 0.70 NoInvesco S&P SmallCap 600 Pure Growth ETF RZG RZGIV 113.02 289 16 139 0.35 No
Small-Cap ValueVanguard Russell 2000 Value Index ETF VTWV VTWVIV 103.21 199 7 1,406 0.20 NoiShares Russell 2000 Value ETF IWN IWNIV 119.25 8,995 1,042 1,379 0.24 NoVanguard Small Cap Value ETF VBR VBRIV 124.34 12,437 278 870 0.07 NoInvesco Russell 2000 Pure Value ETF PXSV PXSVIV 29.91 69 3 331 0.39 NoVanguard S&P Small-Cap 600 Value Index ETF VIOV VIOVIV 127.72 354 12 463 0.20 NoSPDR S&P 600 Small Cap Value ETF SLYV SLYVIV 60.48 1,632 296 462 0.15 NoiShares S&P SmallCap 600 Value Index Fund IJS IJSIV 147.98 5,902 192 465 0.25 NoFirst Trust Small Cap Value AlphaDEX FYT FYTIV 34.14 58 14 263 0.70 NoiShares Morningstar Small-Cap Value ETF JKL JKLIV 136.30 392 6 237 0.30 NoInvesco S&P SmallCap 600 Pure Value ETF RZV RZVIV 69.38 162 14 161 0.35 No
U.S. Sector & IndustryCommunication Services Sector
Vanguard Communication Services ETF VOX VOXIV 77.87 1,248 190 80 0.10 NoCommunication Services Select Sector SPDR XLC XLCIV 43.91 3,666 2,433 27 0.13 No
Consumer Discretionary SectorVanguard Consumer Discretionary ETF VCR VCRIV 157.28 2,717 104 328 0.10 NoFidelity MSCI Consumer Discretionary Index ETF FDIS FDISIV 40.05 771 201 351 0.08 NoiShares U.S. Consumer Services ETF IYC IYCIV 189.13 889 42 170 0.43 NoJohn Hancock Multifactor Consumer Discretionary ETF JHMC JHMCIV 29.75 45 8 145 0.50 NoFirst Trust Consumer Discretionary AlphaDEX Fund FXD FXDIV 39.20 363 84 111 0.63 NoConsumer Discretionary Select Sector SPDR Fund XLY XLYIV 102.50 12,954 6,823 66 0.13 NoInvesco S&P 500 Equal Weight Consumer Discretionary ETF RCD RCDIV 94.89 91 11 65 0.40 NoInvesco DWA Consumer Cyclicals Momentum ETF PEZ PEZIV 49.11 62 6 40 0.60 NoInvesco S&P SmallCap Consumer Discretionary ETF PSCD PSCDIV 60.45 82 13 99 0.29 No
Consumer Discretionary IndustryHomebuilding
iShares U.S. Home Construction ETF ITB ITBIV 29.83 982 3,241 49 0.43 NoSPDR S&P Homebuilders ETF XHB XHBIV 32.18 623 3,010 36 0.35 NoInvesco Dynamic Building & Construction ETF PKB PKBIV 24.83 146 42 32 0.58 No
Leisure & EntertainmentInvesco Dynamic Leisure and Entertainment ETF PEJ PEJIV 40.39 117 23 31 0.63 No
MediaInvesco Dynamic Media ETF PBS PBSIV 29.60 55 23 32 0.63 No
RetailSPDR S&P Retail ETF XRT XRTIV 46.49 391 6,607 96 0.35 NoInvesco Dynamic Retail ETF PMR PMRIV 37.47 9 2 32 0.63 No
Consumer Staples SectoriShares U.S. Consumer Goods ETF IYK IYKIV 114.48 475 41 111 0.43 NoVanguard Consumer Staples ETF VDC VDCIV 140.96 4,180 131 95 0.10 NoFidelity MSCI Consumer Staples Index ETF FSTA FSTAIV 32.89 358 136 91 0.08 NoJohn Hancock Multifactor Consumer Staples ETF JHMS JHMSIV 26.93 24 11 50 0.50 NoFirst Trust Consumer Staples AlphaDEX Fund FXG FXGIV 46.14 320 74 35 0.62 NoInvesco DWA Consumer Staples Momentum ETF PSL PSLIV 69.46 153 13 38 0.60 NoConsumer Staples Select Sector SPDR Fund XLP XLPIV 54.45 9,152 15,195 33 0.13 NoInvesco S&P 500 Equal Weight Consumer Staples ETF RHS RHSIV 126.66 494 34 33 0.40 NoInvesco S&P SmallCap Consumer Staples ETF PSCC PSCCIV 80.62 97 17 22 0.29 No
Consumer Staples IndustryFood & Beverage
Invesco Dynamic Food & Beverage ETF PBJ PBJIV 31.78 71 6 30 0.63 NoEnergy Sector
Fidelity MSCI Energy Index ETF FENY FENYIV 18.17 496 289 137 0.08 NoVanguard Energy ETF VDE VDEIV 89.88 3,651 235 140 0.10 NoiShares U.S. Energy ETF IYE IYEIV 35.94 885 567 71 0.43 NoJohn Hancock Multifactor Energy ETF JHME JHMEIV 27.14 29 9 51 0.50 NoFirst Trust Energy AlphaDEX Fund FXN FXNIV 14.46 378 447 45 0.63 NoInvesco DWA Energy Momentum ETF PXI PXIIV 35.58 83 42 39 0.60 NoEnergy Select Sector SPDR Fund XLE XLEIV 65.24 15,249 13,869 31 0.13 NoInvesco S&P 500 Equal Weight Energy ETF RYE RYEIV 51.65 264 97 30 0.40 NoInvesco S&P SmallCap Energy ETF PSCE PSCEIV 12.71 44 31 36 0.29 No
Energy IndustryOil & Gas Equipment & Services
iShares U.S. Oil Equipment & Services ETF IEZ IEZIV 28.86 256 62 41 0.43 NoSPDR S&P Oil & Gas Equipment & Services ETF XES XESIV 13.29 317 1,322 42 0.35 NoInvesco Dynamic Oil & Gas Services ETF PXJ PXJIV 8.24 28 32 33 0.63 No
Oil & Gas Exploration & ProductionSPDR S&P Oil & Gas Exploration & Production ETF XOP XOPIV 34.61 2,723 14,749 73 0.35 NoiShares U.S. Oil & Gas Exploration & Production ETF IEO IEOIV 62.28 445 99 70 0.43 NoInvesco Dynamic Energy Exploration & Production ETF PXE PXEIV 22.03 95 37 31 0.65 No
Natural GasFirst Trust Natural Gas ETF FCG FCGIV 18.78 117 157 38 0.60 No
Financials SectorVanguard Financials ETF VFH VFHIV 63.83 7,315 613 412 0.10 NoFidelity MSCI Financials Index ETF FNCL FNCLIV 37.12 1,243 255 408 0.08 NoiShares U.S. Financials ETF IYF IYFIV 112.63 1,711 203 288 0.43 No
Source: Morningstar Direct, UBS. Note: No. of securities only includes long positions.
Exchange-traded funds
UBS Chief Investment Office Americas, Wealth Management 1 November 2018 13

As of 29 October 2018 Intraday1,069 NAV Price Assets ADTV # of Expense Actively
Ticker Ticker ($/share) (USD Mil) (1,000/shrs) Securities Ratio (%) ManagedFirst Trust Financials AlphaDEX Fund FXO FXOIV 29.09 1,028 233 186 0.63 NoJohn Hancock Multifactor Financials ETF JHMF JHMFIV 33.77 54 11 161 0.50 NoOppenheimer Financials Sector Revenue ETF RWW RWWIV 61.87 50 3 69 0.45 NoFinancial Select Sector SPDR Fund XLF XLFIV 25.48 27,872 58,685 68 0.13 NoInvesco S&P 500 Equal Weight Financials ETF RYF RYFIV 39.19 347 59 67 0.40 NoInvesco DWA Financial Momentum ETF PFI PFIIV 30.79 31 7 50 0.60 NoInvesco KBW High Dividend Yield Financial ETF KBWD KBWDIV 21.50 296 72 38 2.40 NoInvesco S&P SmallCap Financials ETF PSCF PSCFIV 52.89 167 35 137 0.29 No
Financials IndustryBanks
SPDR S&P Bank ETF KBE KBEIV 41.81 2,956 2,159 86 0.35 NoFirst Trust Nasdaq Bank ETF FTXO FTXOIV 25.54 241 961 31 0.60 NoInvesco KBW Bank ETF KBWB KBWBIV 49.58 791 357 24 0.35 NoSPDR S&P Regional Banking ETF KRE KREIV 52.96 4,145 7,187 128 0.35 NoiShares U.S. Regional Banks ETF IAT IATIV 44.93 679 206 61 0.43 NoFirst Trust NASDAQ ABA Community Bank Index Fund QABA QABAIV 47.88 324 69 167 0.60 NoInvesco KBW Regional Banking ETF KBWR KBWRIV 49.95 128 22 51 0.35 No
Capital MarketsSPDR S&P Capital Markets ETF KCE KCEIV 50.23 101 10 55 0.35 No
Diversified Financial ServicesiShares U.S. Financial Services ETF IYG IYGIV 121.90 1,530 94 123 0.43 NoiShares U.S. Broker-Dealers & Securities Exchanges ETF IAI IAIIV 58.59 226 80 29 0.43 No
InsuranceSPDR S&P Insurance ETF KIE KIEIV 29.42 732 227 50 0.35 NoiShares U.S. Insurance ETF IAK IAKIV 59.56 102 6 63 0.43 NoInvesco KBW Property & Casualty Insurance ETF KBWP KBWPIV 59.08 62 5 25 0.35 No
Mortgage REITsiShares Mortgage Real Estate Capped ETF REM REMIV 42.25 1,160 228 38 0.48 NoVanEck Vectors Mortgage REIT ETF MORT MORTIV 22.70 142 30 26 0.41 No
Business Development CompaniesVanEck Vectors BDC Income ETF BIZD BIZDIV 15.58 198 79 25 9.41 No
Health Care SectorFidelity MSCI Health Care Index ETF FHLC FHLCIV 42.62 1,466 249 349 0.08 NoVanguard Health Care ETF VHT VHTIV 164.25 8,302 250 370 0.10 NoiShares U.S. Healthcare ETF IYH IYHIV 185.62 2,330 84 133 0.43 NoJohn Hancock Multifactor Healthcare ETF JHMH JHMHIV 32.86 57 8 107 0.50 NoFirst Trust Health Care AlphaDEX Fund FXH FXHIV 74.25 1,258 141 78 0.62 NoInvesco S&P 500 Equal Weight Health Care ETF RYH RYHIV 183.98 681 27 64 0.40 NoHealth Care Select Sector SPDR Fund XLV XLVIV 87.64 17,887 9,026 64 0.13 NoInvesco DWA Healthcare Momentum ETF PTH PTHIV 78.23 267 39 48 0.60 NoInvesco S&P SmallCap Health Care ETF PSCH PSCHIV 120.84 1,101 164 70 0.29 No
Health Care IndustryBiotechnology
iShares Nasdaq Biotechnology ETF IBB IBBIV 102.61 8,187 1,997 192 0.47 NoFirst Trust NYSE Arca Biotechnology Index Fund FBT FBTIV 131.17 2,637 351 31 0.56 NoSPDR S&P Biotech ETF XBI XBIIV 77.92 4,541 4,780 126 0.35 NoInvesco Dynamic Biotechnology & Genome ETF PBE PBEIV 50.20 256 35 32 0.59 NoALPS Medical Breakthroughs ETF SBIO SBIOIV 33.05 232 77 112 0.50 No
Equipment & SuppliesiShares U.S. Medical Devices ETF IHI IHIIV 201.11 2,623 164 60 0.43 NoSPDR S&P Health Care Equipment ETF XHE XHEIV 75.59 668 130 75 0.35 No
Providers & ServicesiShares U.S. Healthcare Providers ETF IHF IHFIV 185.94 967 116 49 0.43 NoSPDR S&P Health Care Services ETF XHS XHSIV 70.22 113 9 49 0.35 No
PharmaceuticalsInvesco Dynamic Pharmaceuticals ETF PJP PJPIV 65.91 518 37 32 0.57 NoSPDR S&P Pharmaceuticals ETF XPH XPHIV 42.74 289 120 45 0.35 NoiShares U.S. Pharmaceuticals ETF IHE IHEIV 151.29 417 20 48 0.43 No
Industrials SectorFidelity MSCI Industrials Index ETF FIDU FIDUIV 34.67 408 125 349 0.08 NoVanguard Industrials ETF VIS VISIV 127.45 3,442 142 354 0.10 NoiShares U.S. Industrials ETF IYJ IYJIV 134.99 892 54 218 0.43 NoJohn Hancock Multifactor Industrials ETF JHMI JHMIIV 31.67 23 7 191 0.50 NoFirst Trust Industrials/Producer Durables AlphaDEX Fund FXR FXRIV 35.74 1,443 258 97 0.63 NoInvesco S&P 500 Equal Weight Industrials ETF RGI RGIIV 108.02 244 17 73 0.40 NoIndustrial Select Sector SPDR Fund XLI XLIIV 67.95 10,895 13,370 73 0.13 NoFirst Trust RBA American Industrial Renaissance(TM) ETF AIRR AIRRIV 24.09 165 21 54 0.70 NoInvesco DWA Industrials Momentum ETF PRN PRNIV 53.69 100 5 43 0.60 NoInvesco S&P SmallCap Industrials ETF PSCI PSCIIV 61.16 113 17 100 0.29 No
Industrials IndustryAerospace & Defense
iShares U.S. Aerospace & Defense ETF ITA ITAIV 184.83 5,270 243 39 0.43 NoInvesco Aerospace & Defense ETF PPA PPAIV 52.89 895 69 55 0.60 NoSPDR S&P Aerospace & Defense ETF XAR XARIV 84.69 1,383 151 36 0.35 No
TransportationiShares Transportation Average ETF IYT IYTIV 177.99 720 224 21 0.43 NoSPDR S&P Transportation ETF XTN XTNIV 57.39 181 33 44 0.35 No
Information Technology SectorFidelity MSCI Information Technology Index ETF FTEC FTECIV 52.79 2,253 545 344 0.08 NoVanguard Information Technology ETF VGT VGTIV 178.68 19,729 627 335 0.10 NoiShares North American Tech ETF IGM IGMIV 180.32 1,577 95 293 0.47 NoiShares U.S. Technology ETF IYW IYWIV 170.41 3,832 188 153 0.43 NoJohn Hancock Multifactor Technology ETF JHMT JHMTIV 40.72 61 11 139 0.50 No
Source: Morningstar Direct, UBS. Note: No. of securities only includes long positions.
Exchange-traded funds
UBS Chief Investment Office Americas, Wealth Management 1 November 2018 14

As of 29 October 2018 Intraday1,069 NAV Price Assets ADTV # of Expense Actively
Ticker Ticker ($/share) (USD Mil) (1,000/shrs) Securities Ratio (%) ManagedFirst Trust Technology AlphaDEX Fund FXL FXLIV 52.40 1,876 275 92 0.63 NoFirst Trust NASDAQ Technology Dividend Index Fund TDIV TDIVIV 34.33 866 62 99 0.50 NoTechnology Select Sector SPDR Fund XLK XLKIV 66.94 19,181 16,541 67 0.13 NoInvesco S&P 500 Equal Weight Technology ETF RYT RYTIV 146.63 1,503 90 66 0.40 NoInvesco DWA Technology Momentum ETF PTF PTFIV 53.40 123 12 43 0.60 NoFirst Trust NASDAQ-100-Technology Index Fund QTEC QTECIV 68.44 2,161 232 38 0.58 NoSPDR NYSE Technology ETF XNTK XNTKIV 80.44 817 29 36 0.35 NoInvesco S&P SmallCap Information Technology ETF PSCT PSCTIV 72.18 361 23 92 0.29 No
Information Technology IndustryCommunications Equipment
iShares North American Tech-Multimedia Networking ETF IGN IGNIV 47.75 48 7 24 0.47 NoInvesco Dynamic Networking ETF PXQ PXQIV 50.20 68 6 32 0.63 No
InternetFirst Trust Dow Jones Internet Index Fund FDN FDNIV 119.50 7,591 785 42 0.53 NoInvesco NASDAQ Internet ETF PNQI PNQIIV 112.88 519 44 95 0.60 No
SemiconductorsiShares PHLX Semiconductor ETF SOXX SOXXIV 154.50 1,135 970 31 0.47 NoSPDR S&P Semiconductor ETF XSD XSDIV 63.25 244 127 36 0.35 NoInvesco Dynamic Semiconductors ETF PSI PSIIV 44.15 186 57 31 0.61 No
SoftwareiShares North American Tech-Software ETF IGV IGVIV 175.99 1,935 511 66 0.47 NoInvesco Dynamic Software ETF PSJ PSJIV 73.22 238 41 31 0.63 NoSPDR S&P Software & Services ETF XSW XSWIV 76.05 123 19 159 0.35 No
Materials SectorVanguard Materials ETF VAW VAWIV 113.36 2,391 110 122 0.10 NoFidelity MSCI Materials Index ETF FMAT FMATIV 29.04 176 85 122 0.08 NoiShares U.S. Basic Materials ETF IYM IYMIV 86.06 443 95 51 0.43 NoFirst Trust Materials AlphaDEX Fund FXZ FXZIV 34.73 165 91 52 0.65 NoInvesco DWA Basic Materials Momentum ETF PYZ PYZIV 57.76 84 5 49 0.60 NoJohn Hancock Multifactor Materials ETF JHMA JHMAIV 29.96 18 4 40 0.50 NoInvesco S&P 500 Equal Weight Materials ETF RTM RTMIV 95.07 124 9 24 0.40 NoMaterials Select Sector SPDR Fund XLB XLBIV 50.74 3,173 7,251 25 0.13 NoInvesco S&P SmallCap Materials ETF PSCM PSCMIV 45.09 25 2 35 0.29 No
Materials IndustryMetals & Mining
SPDR S&P Metals & Mining ETF XME XMEIV 29.80 580 2,420 30 0.35 NoReal estate
Fidelity MSCI Real Estate ETF FREL FRELIV 23.36 552 241 183 0.08 NoFirst Trust S&P REIT Index Fund FRI FRIIV 22.84 102 59 159 0.48 NoVanguard Real Estate ETF VNQ VNQIV 78.18 30,122 5,321 187 0.12 NoiShares U.S. Real Estate ETF IYR IYRIV 77.76 3,367 8,583 119 0.43 NoSchwab US REIT ETF™ SCHH SCHHIV 40.82 4,643 736 101 0.07 NoSPDR Dow Jones REIT ETF RWR RWRIV 91.22 2,580 188 99 0.25 NoReal Estate Select Sector SPDR XLRE XLREIV 32.00 2,482 2,979 33 0.13 NoInvesco S&P 500 Equal Weight Real Estate ETF EWRE EWREIV 26.75 16 3 32 0.40 NoHartford Multifactor REIT ETF RORE ROREIV 14.82 27 2 60 0.45 NoIQ U.S. Real Estate Small Cap ETF ROOF ROOFIV 24.64 77 10 76 0.70 NoiShares Core U.S. REIT ETF USRT USRTIV 47.14 771 146 166 0.08 NoiShares Cohen & Steers REIT ETF ICF ICFIV 98.88 1,884 223 34 0.34 NoInvesco KBW Premium Yield Equity REIT ETF KBWY KBWYIV 31.59 390 87 31 0.35 NoiShares Residential Real Estate Capped ETF REZ REZIV 63.28 322 28 47 0.48 No
TelecommunicationsSPDR S&P Telecom ETF XTL XTLIV 67.30 111 38 47 0.35 NoFidelity MSCI Telecommunication Services Index ETF FCOM FCOMIV 29.51 176 65 24 0.08 NoiShares U.S. Telecommunications ETF IYZ IYZIV 27.19 463 495 47 0.43 No
Utilities SectorFidelity MSCI Utilities Index ETF FUTY FUTYIV 35.54 401 136 72 0.08 NoVanguard Utilities ETF VPU VPUIV 120.30 2,966 154 72 0.10 NoiShares U.S. Utilities ETF IDU IDUIV 136.79 622 63 52 0.43 NoJohn Hancock Multifactor Utilities ETF JHMU JHMUIV 29.01 29 10 39 0.50 NoInvesco DWA Utilities Momentum ETF PUI PUIIV 28.64 45 6 34 0.60 NoFirst Trust Utilities AlphaDEX Fund FXU FXUIV 27.54 301 161 36 0.62 NoInvesco S&P 500 Equal Weight Utilities ETF RYU RYUIV 89.38 148 8 29 0.40 NoUtilities Select Sector SPDR Fund XLU XLUIV 54.12 7,887 16,989 30 0.13 NoInvesco S&P SmallCap Utilities ETF PSCU PSCUIV 54.30 68 9 25 0.29 No
Other Sector & IndustryMLPs ("C" corps, deferred tax expenses not included in expense ratio)
Alerian MLP ETF AMLP AMLPIV 9.74 8,804 13,242 27 0.85 NoGlobal X MLP ETF MLPA MLPAIV 8.72 877 511 21 0.45 NoDirexion Zacks MLP High Income Shares ZMLP ZMLPIV 14.23 52 23 27 0.65 No
Energy Infrastructure (RICs)ALPS Alerian Energy Infrastructure ETF ENFR ENFRIV 20.00 39 11 41 0.65 NoFirst Trust North American Energy Infrastructure Fund EMLP EMLPIV 22.44 2,123 461 60 0.95 YesGlobal X MLP & Energy Infrastructure ETF MLPX MLPXIV 12.03 533 196 39 0.45 No
InfrastructureGlobal X U.S. Infrastructure Development ETF PAVE PAVEIV 14.57 100 44 94 0.47 No
Clean EnergyFirst Trust NASDAQ Clean Edge Green Energy Index Fund QCLN QCLNIV 17.84 83 12 41 0.60 NoInvesco WilderHill Clean Energy ETF PBW PBWIV 22.13 100 14 41 0.70 No
WaterInvesco Water Resources ETF PHO PHOIV 28.53 775 57 37 0.62 NoFirst Trust Water ETF FIW FIWIV 45.13 316 30 38 0.56 No
Sector Rotation
Source: Morningstar Direct, UBS. Note: No. of securities only includes long positions.
Exchange-traded funds
UBS Chief Investment Office Americas, Wealth Management 1 November 2018 15

As of 29 October 2018 Intraday1,069 NAV Price Assets ADTV # of Expense Actively
Ticker Ticker ($/share) (USD Mil) (1,000/shrs) Securities Ratio (%) ManagedFirst Trust Dorsey Wright Focus 5 ETF FV FVIV 25.99 2,359 259 6 0.89 NoFirst Trust Dorsey Wright Dynamic Focus 5 ETF FVC FVCIV 24.20 511 100 6 0.89 NoInvesco DWA Tactical Sector Rotation ETF DWTR DWTRIV 25.95 65 16 6 0.75 No
U.S. DividendWisdomTree High Dividend Fund DHS DHSIV 68.86 912 29 438 0.38 NoVanguard High Dividend Yield ETF VYM VYMIV 81.71 21,023 770 409 0.08 NoiShares Core Dividend Growth ETF DGRO DGROIV 34.30 4,384 743 452 0.08 NoWisdomTree U.S. Quality Dividend Growth Fund DGRW DGRWIV 40.60 2,289 192 279 0.28 NoInvesco Dividend Achievers™ ETF PFM PFMIV 25.57 280 14 264 0.55 NoFlexShares Quality Dividend Dynamic Index Fund QDYN QDYNIV 41.45 43 1 139 0.37 NoFlexShares Quality Dividend Index Fund QDF QDFIV 43.58 1,725 96 143 0.37 NoFlexShares Quality Dividend Defensive Index Fund QDEF QDEFIV 43.52 311 16 166 0.37 NoFirst Trust Value Line Dividend Index Fund FVD FVDIV 30.22 4,295 484 196 0.70 NoVanguard Dividend Appreciation ETF VIG VIGIV 101.16 28,283 675 187 0.08 NoO'Shares FTSE US Quality Dividend ETF OUSA OUSAIV 31.05 382 41 139 0.48 NoFidelity Dividend ETF for Rising Rates FDRR FDRRIV 30.15 368 73 117 0.29 NoSPDR S&P Dividend ETF SDY SDYIV 91.96 15,292 435 112 0.35 NoiShares Select Dividend ETF DVY DVYIV 94.75 16,389 465 102 0.39 NoSchwab U.S. Dividend Equity ETF™ SCHD SCHDIV 49.10 7,719 717 103 0.07 NoVictoryShares US Large Cap High Div Volatility Wtd ETF CDL CDLIV 43.36 147 13 103 0.35 NoVictoryShares US EQ Income Enhanced Volatility Wtd ETF CDC CDCIV 44.55 808 63 103 0.35 NoFirst Trust Morningstar Dividend Leaders Index Fund FDL FDLIV 28.65 1,410 131 101 0.45 NoWisdomTree Dividend ex-Financials Fund DTN DTNIV 83.39 775 12 83 0.38 NoSPDR Portfolio S&P 500 High Dividend ETF SPYD SPYDIV 36.16 723 257 80 0.07 NoiShares Core High Dividend ETF HDV HDVIV 87.11 6,036 436 79 0.08 NoOppenheimer Ultra Dividend Revenue ETF RDIV RDIVIV 36.75 1,046 254 59 0.39 NoProShares S&P 500 Dividend Aristocrats ETF NOBL NOBLIV 61.88 3,448 412 54 0.35 NoInvesco High Yield Equity Dividend Achievers™ ETF PEY PEYIV 17.20 746 149 53 0.54 NoALPS Sector Dividend Dogs ETF SDOG SDOGIV 42.91 2,128 129 50 0.40 NoFirst Trust Rising Dividend Achievers ETF RDVY RDVYIV 28.36 642 132 51 0.50 NoGlobal X SuperDividend™ U.S. ETF DIV DIVIV 24.47 409 74 48 0.45 NoInvesco S&P 500 High Dividend Low Volatility ETF SPHD SPHDIV 39.85 2,544 358 51 0.30 NoLegg Mason Low Volatility High Dividend ETF LVHD LVHDIV 30.02 575 36 80 0.27 NoProShares S&P MidCap 400 Dividend Aristocrats ETF REGL REGLIV 53.34 385 27 50 0.40 NoO'Shares FTSE Russell Small Cap Quality Dividend ETF OUSM OUSMIV 25.24 126 29 224 0.48 NoWisdomTree U.S. SmallCap Quality Dividend Growth Fund DGRS DGRSIV 33.99 107 9 274 0.38 NoProShares Russell 2000 Dividend Growers ETF SMDV SMDVIV 55.61 427 29 62 0.40 NoVictoryShares US Small Cap High Div Volatility Wtd ETF CSB CSBIV 42.96 47 4 104 0.35 No
International Developed & Emerging Market EquityBroad Market
Traditional cap-weightedVanguard Total International Stock ETF VXUS VXUSIV 48.39 10,149 857 6,344 0.11 NoiShares Core MSCI Total International Stock ETF IXUS IXUSIV 54.02 11,295 962 3,476 0.10 No
Single factorAdvisorShares WCM/BNY Mellon Focused Growth ADR ETF AADR AADRIV 45.23 151 35 39 0.89 Yes
OtherInvesco International BuyBack Achievers™ ETF IPKW IPKWIV 30.19 243 51 39 0.55 No
Large-capTraditional cap-weighted
Vanguard FTSE All-World ex-US ETF VEU VEUIV 46.65 20,862 2,602 2,760 0.11 NoiShares MSCI ACWI ex U.S. ETF ACWX ACWXIV 42.94 2,736 821 1,306 0.32 NoXtrackers MSCI All World ex US Hedged Equity ETF DBAW DBAWIV 25.32 110 33 1,822 0.40 NoSPDR MSCI ACWI (ex-US) ETF CWI CWIIV 33.60 1,374 198 1,063 0.30 No
MultifactorVanEck Vectors International Moat ETF MOTI MOTIIV 29.34 76 13 86 0.56 No
Small-CapVanguard FTSE All-World ex-US Small-Cap ETF VSS VSSIV 98.46 4,885 217 3,626 0.13 No
Sector & IndustryVanguard Global ex-US Real Estate ETF VNQI VNQIIV 52.72 5,380 533 645 0.14 NoWisdomTree Global ex-US Real Estate Fund DRW DRWIV 27.24 98 21 238 0.58 NoSPDR Dow Jones International Real Estate ETF RWX RWXIV 36.57 2,780 446 131 0.59 No
DividendVanguard International High Dividend Yield ETF VYMI VYMIIV 57.72 873 117 903 0.32 NoWisdomTree Global ex-U.S. Quality Dividend Growth Fund DNL DNLIV 50.72 67 7 276 0.58 NoFlexShares International Quality Dividend Dynamic Index Fund IQDY IQDYIV 22.69 62 9 203 0.47 NoFlexShares International Quality Dividend Defensive Index Fund IQDE IQDEIV 20.72 86 18 227 0.47 NoFlexShares International Quality Dividend Index Fund IQDF IQDFIV 21.77 752 138 227 0.47 NoVanguard International Dividend Appreciation ETF VIGI VIGIIV 57.30 820 63 313 0.25 NoSPDR S&P International Dividend ETF DWX DWXIV 35.18 784 95 115 0.45 NoInvesco International Dividend Achievers™ ETF PID PIDIV 14.53 700 142 64 0.55 No
International Developed Markets EquityBroad Market
Traditional cap-weightedVanguard FTSE Developed Markets ETF VEA VEAIV 38.75 64,590 10,352 3,979 0.07 NoiShares Core MSCI International Developed Markets ETF IDEV IDEVIV 50.87 837 52 1,313 0.05 NoiShares Core MSCI EAFE ETF IEFA IEFAIV 57.56 54,413 7,883 2,502 0.08 NoSPDR Portfolio World ex-US ETF SPDW SPDWIV 27.59 3,183 879 1,712 0.04 No
MultifactorFlexShares Morningstar Developed Markets ex-US Factor Tilt Index Fund TLTD TLTDIV 58.34 951 31 2,928 0.39 No
Fundamentally weightedWisdomTree International Equity Fund DWM DWMIV 48.39 819 41 851 0.48 No
Dynamic currency hedgedWisdomTree Dynamic Currency Hedged International Equity Fund DDWM DDWMIV 27.24 227 47 845 0.35 No
Source: Morningstar Direct, UBS. Note: No. of securities only includes long positions.
Exchange-traded funds
UBS Chief Investment Office Americas, Wealth Management 1 November 2018 16

As of 29 October 2018 Intraday1,069 NAV Price Assets ADTV # of Expense Actively
Ticker Ticker ($/share) (USD Mil) (1,000/shrs) Securities Ratio (%) ManagedOther
First Trust RiverFront Dynamic Developed International ETF RFDI RFDIIV 53.95 486 85 257 0.83 YesLarge-Cap
Traditional cap-weightedSchwab International Equity ETF™ SCHF SCHFIV 30.10 15,222 3,411 1,474 0.06 NoiShares MSCI EAFE ETF EFA EFAIV 61.26 63,397 28,994 945 0.32 No
Currency hedgedXtrackers MSCI EAFE Hedged Equity ETF DBEF DBEFIV 29.57 5,415 860 972 0.35 NoiShares Currency Hedged MSCI EAFE ETF HEFA HEFAIV 27.41 3,160 495 8 0.35 NoIQ 50 Percent Hedged FTSE International ETF HFXI HFXIIV 19.13 477 51 825 0.20 No
Fundamentally weightedInvesco FTSE RAFI Developed Markets ex-U.S. ETF PXF PXFIV 39.20 1,257 255 1,043 0.45 NoSchwab Fundamental International Large Company Index ETF FNDF FNDFIV 27.17 3,837 662 887 0.25 NoWisdomTree International LargeCap Dividend Fund DOL DOLIV 44.23 378 34 264 0.48 No
MultifactorXtrackers FTSE Developed ex US Enhanced Beta ETF DEEF DEEFIV 25.88 56 17 1,255 0.35 NoGoldman Sachs ActiveBeta International Equity ETF GSIE GSIEIV 26.37 1,075 196 832 0.25 NoJohn Hancock Multifactor Developed International ETF JHMD JHMDIV 26.31 82 45 773 0.45 NoHartford Multifactor Developed Markets (ex-US) ETF RODM RODMIV 26.29 859 345 509 0.29 NoJPMorgan Diversified Return International Equity ETF JPIN JPINIV 52.02 1,418 194 469 0.38 NoFirst Trust Dev Markets Ex-US AlphaDEX FDT FDTIV 51.04 1,035 144 309 0.80 NoiShares Edge MSCI Multifactor Intl ETF INTF INTFIV 24.94 939 279 235 0.30 No
Single factoriShares Edge MSCI Intl Quality Factor ETF IQLT IQLTIV 26.56 104 31 306 0.30 NoInvesco S&P International Developed Low Volatility ETF IDLV IDLVIV 30.43 532 70 208 0.25 NoiShares Edge MSCI Min Vol EAFE ETF EFAV EFAVIV 67.39 8,561 606 289 0.20 NoiShares Edge MSCI Intl Momentum Factor ETF IMTM IMTMIV 26.82 137 36 280 0.30 NoInvesco DWA Developed Markets Momentum ETF PIZ PIZIV 23.81 218 44 105 0.81 No
Dynamic allocationVictoryShares Developed Enhanced Volatility Wtd ETF CIZ CIZIV 30.47 149 24 505 0.47 No
ESG relatediShares MSCI EAFE ESG Optimized ETF ESGD ESGDIV 59.58 412 41 458 0.20 NoNuShares ESG International Developed Markets Equity ETF NUDM NUDMIV 23.62 43 3 328 0.40 No
OtherFirst Trust Dorsey Wright International Focus 5 ETF IFV IFVIV 17.88 628 218 6 1.06 NoInvesco BLDRS Developed Markets 100 ADR Index Fund ADRD ADRDI 20.56 48 13 87 0.27 No
Mid-CapWisdomTree International MidCap Dividend Fund DIM DIMIV 59.11 250 13 630 0.58 No
Small-CapTraditional cap-weighted
SPDR S&P International Small Cap ETF GWX GWXIV 29.74 750 82 2,364 0.40 NoiShares MSCI EAFE Small-Cap ETF SCZ SCZIV 54.95 8,928 1,230 1,661 0.40 NoSchwab International Small-Cap Equity ETF™ SCHC SCHCIV 31.27 1,996 318 2,130 0.12 No
Fundamentally weightedInvesco FTSE RAFI Developed Markets ex-U.S. Small-Mid ETF PDN PDNIV 28.73 286 114 1,512 0.49 NoSchwab Fundamental International Small Company Index ETF FNDC FNDCIV 30.51 1,749 243 1,527 0.39 NoWisdomTree International SmallCap Dividend Fund DLS DLSIV 63.58 1,660 62 951 0.58 No
GrowthiShares MSCI EAFE Growth ETF EFG EFGIV 71.01 3,424 190 580 0.40 No
ValueiShares MSCI EAFE Value ETF EFV EFVIV 47.67 5,536 647 478 0.39 NoiShares Edge MSCI Intl Value Factor ETF IVLU IVLUIV 23.26 257 75 311 0.30 NoCambria Foreign Shareholder Yield ETF FYLD FYLDIV 22.78 26 15 109 0.59 No
Sector & IndustryFirst Trust FTSE EPRA/NAREIT Developed Markets Real Estate Index Fund FFR FFRIV 43.40 44 3 351 0.60 NoiShares International Developed Real Estate ETF IFGL IFGLIV 27.19 454 100 224 0.48 NoiShares International Developed Property ETF WPS WPSIV 35.05 137 17 358 0.48 No
DividendWisdomTree International High Dividend Fund DTH DTHIV 38.51 276 19 482 0.58 NoWisdomTree International Hedged Quality Dividend Growth Fund IHDG IHDGIV 29.29 463 70 269 0.58 NoLegg Mason International Low Volatility High Dividend ETF LVHI LVHIIV 25.95 49 2 131 0.40 NoiShares International Select Dividend ETF IDV IDVIV 30.25 4,167 507 117 0.50 NoWisdomTree International Dividend ex-Financials Fund DOO DOOIV 38.93 166 12 91 0.58 NoProShares MSCI EAFE Dividend Growers ETF EFAD EFADIV 34.71 110 14 55 0.50 NoALPS International Sector Dividend Dogs ETF IDOG IDOGIV 24.61 282 46 52 0.50 No
International Emerging Markets EquityBroad Market
Traditional cap-weightedVanguard FTSE Emerging Markets ETF VWO VWOIV 36.68 52,101 15,929 4,075 0.14 NoiShares Core MSCI Emerging Market ETF IEMG IEMGIV 45.85 43,788 14,963 1,920 0.14 NoSPDR Portfolio Emerging Markets ETF SPEM SPEMIV 31.29 1,436 580 1,419 0.11 No
MultifactorFlexShares Morningstar Emerging Markets Factor Tilt Index Fund TLTE TLTEIV 46.27 481 67 2,331 0.59 No
Large-CapTraditional cap-weighted
iShares MSCI Emerging Markets ETF EEM EEMIV 38.00 27,632 75,028 1,003 0.69 NoSchwab Emerging Markets Equity ETF™ SCHE SCHEIV 23.06 4,435 1,370 970 0.13 NoInvesco BLDRS Emerging Markets 50 ADR Index Fund ADRE ADREI 36.11 123 11 51 0.18 No
Currency hedgediShares Currency Hedged MSCI Emerging Markets ETF HEEM HEEMIV 22.75 313 97 10 0.69 NoXtrackers MSCI Emerging Markets Hedged Equity ETF DBEM DBEMIV 20.60 116 26 1,180 0.65 No
MultifactorSPDR MSCI Emerging Markets StrategicFactors ETF QEMM QEMMIV 52.90 241 18 965 0.30 No
Source: Morningstar Direct, UBS. Note: No. of securities only includes long positions.
Exchange-traded funds
UBS Chief Investment Office Americas, Wealth Management 1 November 2018 17

As of 29 October 2018 Intraday1,069 NAV Price Assets ADTV # of Expense Actively
Ticker Ticker ($/share) (USD Mil) (1,000/shrs) Securities Ratio (%) ManagedJPMorgan Diversified Return Emerging Markets Equity ETF JPEM JPEMIV 49.44 208 30 638 0.47 NoGoldman Sachs ActiveBeta Emerging Markets Equity ETF GEM GEMIV 28.94 1,520 168 423 0.45 NoHartford Multifactor Emerging Markets ETF ROAM ROAMIV 21.59 58 13 340 0.49 NoiShares Edge MSCI Multifactor Emerging Markets ETF EMGF EMGFIV 38.26 228 76 199 0.45 NoFirst Trust Emerging Markets AlphaDEX FEM FEMIV 22.45 455 195 162 0.80 No
Single factoriShares Edge MSCI Min Vol Emerging Markets ETF EEMV EEMVIV 53.54 4,477 632 325 0.25 NoInvesco S&P Emerging Markets Low Volatility ETF EELV EELVIV 22.61 244 326 213 0.29 NoInvesco DWA Emerging Markets Momentum ETF PIE PIEIV 15.55 191 108 109 0.90 No
Fundamentally weightedInvesco FTSE RAFI Emerging Markets ETF PXH PXHIV 19.47 1,059 332 347 0.50 NoSchwab Fundamental Emerging Markets Large Company Index ETF FNDE FNDEIV 26.26 2,097 325 351 0.39 No
ESG relatedNuShares ESG Emerging Markets Equity ETF NUEM NUEMIV 23.23 35 3 395 0.45 NoiShares MSCI EM ESG Optimized ETF ESGE ESGEIV 29.80 330 80 316 0.25 No
OtherInvesco MSCI Emerging Markets Equal Country Weight ETF EWEM EWEMIV 29.52 12 1 775 0.70 NoWisdomTree Emerging Markets ex-State-Owned Enterprises Fund XSOE XSOEIV 24.50 138 78 548 0.32 NoColumbia Beyond BRICs ETF BBRC BBRCIV 16.45 49 14 94 0.60 NoGlobal X Next Emerging & Frontier ETF EMFM EMFMIV 19.95 13 2 215 0.56 No
Small-CapTraditional cap-weighted
SPDR S&P Emerging Markets Small Cap ETF EWX EWXIV 40.12 425 61 1,250 0.65 NoiShares MSCI Emerging Markets Small-Cap ETF EEMS EEMSIV 39.95 211 37 1,270 0.69 No
Fundamentally weightedWisdomTree Emerging Markets Small Cap Dividend Fund DGS DGSIV 40.12 1,208 114 882 0.63 No
MultifactorFirst Trust Emerging Markets Small Cap AlphaDEX Fund FEMS FEMSIV 31.69 160 62 213 0.80 No
Sector & IndustryColumbia Emerging Markets Consumer ETF ECON ECONIV 19.79 369 196 30 0.59 NoEmerging Markets Internet & Ecommerce ETF EMQQ EMQQIV 26.22 289 134 60 0.86 NoiShares Emerging Markets Infrastructure ETF EMIF EMIFIV 27.03 31 3 40 0.75 NoInvesco Emerging Markets Infrastructure ETF PXR PXRIV 30.62 17 2 90 0.75 No
DividendWisdomTree Emerging Markets High Dividend Fund DEM DEMIV 39.27 1,762 247 496 0.63 NoSPDR S&P Emerging Markets Dividend EDIV EDIVIV 28.06 372 46 134 0.49 NoiShares Emerging Markets Dividend ETF DVYE DVYEIV 36.59 403 87 114 0.49 NoALPS Emerging Sector Dividend Dogs ETF EDOG EDOGIV 20.15 34 11 52 0.60 No
FrontieriShares MSCI Frontier 100 ETF FM FMIV 26.61 488 146 127 0.79 NoInvesco Frontier Markets ETF FRN FRNIV 12.65 51 30 72 0.70 No
BRICiShares MSCI BRIC ETF BKF BKFIV 36.50 172 32 427 0.70 NoInvesco BRIC ETF EEB EED 32.53 61 11 142 0.64 No
BICKFirst Trust BICK Index Fund BICK BICKIV 24.13 163 13 92 0.64 No
International Region & Country EquityAsia Pacific
Broad MarketVanguard FTSE Pacific ETF VPL VPLIV 62.51 3,814 389 2,344 0.10 NoiShares Core MSCI Pacific ETF IPAC IPACIV 52.42 804 64 855 0.10 NoiShares MSCI Emerging Markets Asia ETF EEMA EEMAIV 58.61 356 47 730 0.49 NoSPDR S&P Emerging Asia Pacific ETF GMF GMFIV 84.71 385 28 772 0.49 NoiShares Asia 50 ETF AIA AIAIV 53.63 883 68 56 0.50 NoInvesco BLDRS Asia 50 ADR Index Fund ADRA ADRAI 29.11 17 1 51 0.30 No
Asia Pacific ex-JapaniShares MSCI All Country Asia ex Japan ETF AAXJ AAXJIV 61.12 3,372 1,171 794 0.69 NoWisdomTree Asia-Pacific ex-Japan Fund AXJL AXJLIV 60.75 34 4 215 0.48 NoInvesco FTSE RAFI Asia Pacific ex-Japan ETF PAF PAFIV 48.56 19 1 202 0.49 NoiShares MSCI Pacific ex-Japan Fund EPP EPPIV 40.71 2,101 409 159 0.49 NoFirst Trust Asia Pac Ex-Jap AlphaDEX FPA FPAIV 26.70 31 9 105 0.80 NoiShares Edge MSCI Min Vol Asia ex Japan ETF AXJV AXJVIV 32.82 13 4 237 0.35 NoGlobal X Southeast Asia ETF ASEA ASEAIV 14.66 17 27 45 0.65 NoFirst Trust Chindia ETF FNI FNIIV 30.18 277 42 50 0.60 No
DividendiShares Asia/Pacific Dividend ETF DVYA DVYAIV 40.79 31 4 36 0.49 No
AustraliaiShares MSCI Australia ETF EWA EWAIV 19.91 1,164 2,052 73 0.49 NoWisdomTree Australia Dividend Fund AUSE AUSEIV 48.80 30 4 77 0.58 No
ChinaSPDR S&P China ETF GXC GXCIV 82.62 878 78 371 0.59 NoInvesco China All-Cap ETF YAO YAOIV 27.83 20 3 305 0.70 NoiShares MSCI China ETF MCHI MCHIIV 51.05 3,309 5,339 299 0.62 NoWisdomTree China ex-State-Owned Enterprises Fund CXSE CXSEIV 60.26 139 23 148 0.32 NoInvesco Golden Dragon China ETF PGJ PGJIV 31.95 168 30 74 0.70 NoiShares China Large-Cap ETF FXI FXIIV 38.26 4,875 31,312 55 0.74 NoInvesco China Small Cap ETF HAO HAOIV 22.51 59 15 329 0.75 NoiShares MSCI China Small-Cap ETF ECNS ECNSIV 39.93 18 8 299 0.62 No
China A-SharesXtrackers Harvest CSI 300 China A-Shares ETF ASHR ASHRIV 22.25 922 2,184 309 0.66 NoKraneShares Bosera MSCI China A Share ETF KBA KBAIV 25.09 300 200 243 0.60 NoVanEck Vectors ChinaAMC CSI 300 ETF PEK PEKIV 34.35 51 8 304 0.78 No
China Sector & Industry
Source: Morningstar Direct, UBS. Note: No. of securities only includes long positions.
Exchange-traded funds
UBS Chief Investment Office Americas, Wealth Management 1 November 2018 18

As of 29 October 2018 Intraday1,069 NAV Price Assets ADTV # of Expense Actively
Ticker Ticker ($/share) (USD Mil) (1,000/shrs) Securities Ratio (%) ManagedGlobal X China Consumer ETF CHIQ CHIQIV 12.88 116 289 43 0.65 NoGlobal X China Financials ETF CHIX CHIXIV 15.08 31 20 43 0.65 NoInvesco China Real Estate ETF TAO TAOIV 23.72 38 22 72 0.70 NoKraneShares MSCI All China Health Care Index ETF KURE KUREIV 18.74 35 16 61 0.82 NoInvesco China Technology ETF CQQQ CQQQIV 38.20 385 221 80 0.70 NoGlobal X NASDAQ China Technology ETF QQQC QQQCIV 21.08 23 10 48 0.65 NoKraneShares CSI China Internet ETF KWEB KWEBIV 39.59 1,333 1,744 47 0.70 No
Hong KongiShares MSCI Hong Kong ETF EWH EWHIV 21.26 2,285 5,349 51 0.49 No
IndiaWisdomTree India Earnings Fund EPI EPIIV 22.05 1,367 2,056 338 0.84 NoiShares MSCI India ETF INDA INDAIV 29.59 4,210 5,308 82 0.68 NoInvesco India ETF PIN PINIV 21.68 200 94 52 0.79 NoiShares India 50 ETF INDY INDYIV 31.42 711 367 55 0.92 NoiShares MSCI India Small-Cap ETF SMIN SMINIV 34.24 228 53 290 0.75 NoVanEck Vectors India Small-Cap Index ETF SCIF SCIFIV 38.00 165 65 212 0.72 No
India Sector & IndustryColumbia India Infrastructure ETF INXX INXXIV 10.93 30 9 27 0.76 NoColumbia India Consumer ETF INCO INCOIV 37.93 121 17 28 0.76 No
IndonesiaiShares MSCI Indonesia ETF EIDO EIDOIV 21.24 339 1,251 82 0.62 NoVanEck Vectors Indonesia Index ETF IDX IDXIV 19.01 41 15 47 0.57 No
JapaniShares JPX-Nikkei 400 ETF JPXN JPXNIV 57.38 112 7 393 0.48 NoWisdomTree Japan Hedged Equity Fund DXJ DXJIV 50.93 4,895 2,233 455 0.48 NoiShares MSCI Japan ETF EWJ EWJIV 53.47 16,436 8,796 329 0.49 NoXtrackers MSCI Japan Hedged Equity ETF DBJP DBJPIV 39.13 902 238 333 0.46 NoiShares Currency Hedged MSCI Japan ETF HEWJ HEWJIV 30.13 1,042 805 5 0.49 NoGoldman Sachs ActiveBeta Japan Equity ETF GSJY GSJYIV 30.71 18 3 314 0.25 NoFirst Trust Japan AlphaDEX FJP FJPIV 50.00 160 21 102 0.80 NoiShares Edge MSCI Min Vol Japan ETF JPMV JPMVIV 63.56 19 3 185 0.30 NoiShares MSCI Japan Small-Cap ETF SCJ SCJIV 68.18 307 103 937 0.49 NoWisdomTree Japan Hedged SmallCap Equity Fund DXJS DXJSIV 39.42 123 17 828 0.58 NoWisdomTree Japan SmallCap Dividend Fund DFJ DFJIV 68.19 948 63 821 0.58 No
Japan Sector & IndustryWisdomTree Japan Hedged Financials Fund DXJF DXJFIV 23.20 28 25 84 0.48 No
MalaysiaiShares MSCI Malaysia ETF EWM EWMIV 29.68 519 934 50 0.49 No
New ZealandiShares MSCI New Zealand Capped ETF ENZL ENZLIV 44.19 147 46 30 0.49 No
PhilippinesiShares MSCI Philippines ETF EPHE EPHEIV 29.45 133 283 45 0.62 No
SingaporeiShares MSCI Singapore ETF EWS EWSIV 21.75 497 610 29 0.49 No
South KoreaiShares MSCI South Korea Capped ETF EWY EWYIV 56.85 3,330 3,009 119 0.62 NoXtrackers MSCI South Korea Hedged Equity ETF DBKO DBKOIV 25.28 10 2 122 0.58 No
TaiwaniShares MSCI Taiwan ETF EWT EWTIV 31.87 3,362 5,656 96 0.62 No
ThailandiShares MSCI Thailand Capped ETF THD THDIV 84.01 429 244 121 0.62 No
VietnamVanEck Vectors Vietnam ETF VNM VNMIV 14.49 316 214 29 0.66 No
EuropeBroad Market
iShares Core MSCI Europe ETF IEUR IEURIV 43.40 2,475 348 1,006 0.10 NoVanguard FTSE Europe ETF VGK VGKIV 50.90 14,578 3,856 1,350 0.10 NoXtrackers MSCI Europe Hedged Equity ETF DBEU DBEUIV 26.53 932 593 475 0.45 NoGoldman Sachs ActiveBeta Europe Equity ETF GSEU GSEUIV 27.53 33 12 408 0.25 NoiShares Europe ETF IEV IEVIV 40.91 2,143 458 377 0.60 NoFirst Trust Europe AlphaDEX FEP FEPIV 33.22 725 159 204 0.80 NoO'Shares FTSE European Quality Dividend ETF OEUR OEURIV 22.24 29 8 195 0.48 NoiShares Edge MSCI Min Vol Europe ETF EUMV EUMVIV 23.36 23 6 178 0.25 NoInvesco BLDRS Europe Select ADR Index Fund ADRU ADRUI 19.89 13 2 75 0.30 NoSPDR STOXX Europe 50 FEU FEUIV 31.04 175 32 56 0.29 NoFirst Trust STOXX European Select Dividend Index Fund FDD FDDIV 12.37 392 193 33 0.60 NoiShares MSCI Europe Small-Cap ETF IEUS IEUSIV 48.89 202 27 1,011 0.40 NoWisdomTree Europe SmallCap Dividend Fund DFE DFEIV 56.97 831 81 442 0.58 No
EurozoneDeutsche X-Tracks MSCI EMU Hedged Equity ETF DBEZ DBEZIV 27.88 38 3 739 0.45 NoiShares MSCI EMU Index Fund EZU EZUIV 36.91 7,752 6,716 254 0.49 NoiShares Currency Hedged MSCI EMU ETF HEZU HEZUIV 27.38 1,460 778 2 0.52 NoFirst Trust Eurozone AlphaDex ETF FEUZ FEUZIV 36.84 72 39 151 0.80 NoWisdomTree Europe Hedged Equity Fund HEDJ HEDJIV 58.51 4,556 804 135 0.58 NoSPDR EURO STOXX 50 FEZ FEZIV 34.69 2,800 3,579 53 0.29 NoPacer Trendpilot European Index ETF PTEU PTEUIV 25.43 159 41 4 0.66 NoWisdomTree Europe Hedged SmallCap Equity Fund EUSC EUSCIV 27.64 164 14 276 0.58 No
RegionGlobal X FTSE Nordic Region ETF GXF GXFIV 20.29 25 8 31 0.55 No
Sector & IndustryiShares MSCI Europe Financials ETF EUFN EUFNIV 18.22 997 1,538 89 0.48 NoiShares Europe Developed Real Estate ETF IFEU IFEUIV 36.20 35 5 114 0.48 No
Austria
Source: Morningstar Direct, UBS. Note: No. of securities only includes long positions.
Exchange-traded funds
UBS Chief Investment Office Americas, Wealth Management 1 November 2018 19

As of 29 October 2018 Intraday1,069 NAV Price Assets ADTV # of Expense Actively
Ticker Ticker ($/share) (USD Mil) (1,000/shrs) Securities Ratio (%) ManagediShares MSCI Austria Capped ETF EWO EWOIV 20.60 121 152 28 0.49 No
BelgiumiShares MSCI Belgium Capped ETF EWK EWKIV 17.32 49 18 48 0.49 No
DenmarkiShares MSCI Denmark Capped ETF EDEN EDENIV 57.65 38 8 45 0.53 No
FinlandiShares MSCI Finland Capped ETF EFNL EFNLIV 36.76 37 7 42 0.55 No
FranceiShares MSCI France ETF EWQ EWQIV 27.96 754 842 82 0.49 No
GermanyWisdomTree Germany Hedged Equity Fund DXGE DXGEIV 27.91 65 12 88 0.48 NoiShares MSCI Germany ETF EWG EWGIV 26.89 2,713 3,796 71 0.49 NoiShares Currency Hedged MSCI Germany ETF HEWG HEWGIV 25.24 282 190 2 0.53 NoFirst Trust Germany AlphaDEX Fund FGM FGMIV 40.44 173 8 40 0.80 NoiShares MSCI Germany Small-Cap ETF EWGS EWGSIV 52.33 45 6 123 0.59 No
GreeceGlobal X MSCI Greece ETF GREK GREKIV 7.60 259 494 36 0.59 No
IrelandiShares MSCI Ireland Capped ETF EIRL EIRLIV 40.56 59 12 31 0.49 No
ItalyiShares MSCI Italy Capped ETF EWI EWIIV 25.04 222 1,098 28 0.49 No
NetherlandsiShares MSCI Netherlands ETF EWN EWNIV 27.31 140 251 61 0.49 No
NorwayiShares MSCI Norway Capped ETF ENOR ENORIV 26.23 32 9 63 0.53 NoGlobal X MSCI Norway ETF NORW NORWIV 13.67 162 74 63 0.50 No
PolandiShares MSCI Poland Capped ETF EPOL EPOLIV 21.09 235 396 41 0.63 NoVanEck Vectors Poland ETF PLND PLNDIV 15.23 12 3 28 0.66 No
PortugalGlobal X FTSE Portugal 20 ETF PGAL PGALIV 11.00 26 34 23 0.58 No
RussiaVanEck Vectors Russia Index ETF RSX RSXIV 20.23 1,436 9,785 31 0.67 NoiShares MSCI Russia Capped ETF ERUS ERUSIV 32.80 472 343 31 0.62 No
SpainiShares MSCI Spain Capped ETF EWP EWPIV 27.51 835 637 27 0.49 NoiShares Currency Hedged MSCI Spain ETF HEWP HEWPIV 20.10 15 3 3 0.52 No
SwedeniShares MSCI Sweden ETF EWD EWDIV 28.61 229 215 37 0.49 No
SwitzerlandiShares MSCI Switzerland Capped Index Fund EWL EWLIV 32.25 1,063 891 43 0.49 NoFirst Trust Switzerland AlphaDEX Fund FSZ FSZIV 45.05 184 10 40 0.80 No
TurkeyiShares MSCI Turkey ETF TUR TURIV 23.55 482 1,691 64 0.62 No
United KingdomiShares MSCI United Kingdom ETF EWU EWUIV 31.22 1,730 1,950 107 0.49 NoiShares Currency Hedged MSCI United Kingdom ETF HEWU HEWUIV 22.79 17 14 4 0.49 NoFirst Trust United Kingdom AlphaDEX Fund FKU FKUIV 34.67 9 4 78 0.80 NoiShares MSCI United Kingdom Small-Cap ETF EWUS EWUSIV 36.97 50 4 269 0.59 No
Latin AmericaBroad Market
First Trust Latin America AlphaDEX FLN FLNIV 18.28 18 18 54 0.80 NoiShares Latin America 40 ETF ILF ILFIV 31.97 1,264 2,079 46 0.48 No
BraziliShares MSCI Brazil Capped ETF EWZ EWZIV 38.63 6,707 34,822 58 0.62 NoiShares MSCI Brazil Small-Cap ETF EWZS EWZSIV 14.06 57 64 65 0.62 NoVanEck Vectors Brazil Small-Cap ETF BRF BRFIV 20.12 85 34 68 0.60 No
ChileiShares MSCI Chile Capped ETF ECH ECHIV 41.15 371 431 38 0.62 No
ColombiaGlobal X MSCI Colombia GXG GXGIV 8.69 83 98 27 0.61 No
MexicoiShares MSCI Mexico Capped ETF EWW EWWIV 42.60 845 3,935 60 0.49 No
PeruiShares MSCI All Peru Capped ETF EPU EPUIV 34.49 141 71 30 0.62 No
Middle East & AfricaRegion
VanEck Vectors Africa Index ETF AFK AFKIV 19.87 58 8 82 0.84 NoWisdomTree Middle East Dividend Fund GULF GULFIV 18.55 17 10 95 0.88 No
EgyptVanEck Vectors Egypt Index ETF EGPT EGPTIV 27.05 36 12 30 0.94 No
IsraelVanEck Vectors Israel ETF ISRA ISRAIV 30.10 47 7 135 0.59 NoiShares MSCI Israel Capped ETF EIS EISIV 51.26 113 20 70 0.62 NoARK Israel Innovative Technology ETF IZRL IZRLIV 20.33 20 5 43 0.49 No
Saudi ArabiaiShares MSCI Saudi Arabia Capped ETF KSA KSAIV 29.23 216 147 74 0.74 No
South AfricaiShares MSCI South Africa ETF EZA EZAIV 47.44 359 660 54 0.62 No
North AmericaCanada
iShares MSCI Canada ETF EWC EWCIV 25.95 2,655 2,799 96 0.49 NoInvesco Canadian Energy Income ETF ENY ENYIV 7.00 18 4 32 0.66 No
Source: Morningstar Direct, UBS. Note: No. of securities only includes long positions.
Exchange-traded funds
UBS Chief Investment Office Americas, Wealth Management 1 November 2018 20

As of 29 October 2018 Intraday1,069 NAV Price Assets ADTV # of Expense Actively
Ticker Ticker ($/share) (USD Mil) (1,000/shrs) Securities Ratio (%) ManagedGlobal Equity
Traditional cap-weightedVanguard Total World Stock Index ETF VT VTIV 68.27 11,088 1,843 8,114 0.10 NoSPDR MSCI ACWI IMI ETF ACIM ACIMIV 73.18 103 4 946 0.25 NoiShares MSCI ACWI ETF ACWI ACWIIV 67.03 8,678 2,829 1,413 0.32 NoiShares MSCI Kokusai ETF TOK TOKIV 61.26 142 4 1,330 0.25 NoSPDR Global Dow ETF DGT DGTIV 79.09 87 2 175 0.50 NoiShares Global 100 ETF IOO IOOIV 44.76 1,822 60 111 0.40 NoiShares MSCI World ETF URTH URTHIV 83.06 491 46 1,210 0.24 No
MultifactorJPMorgan Diversified Return Global Equity ETF JPGE JPGEIV 55.45 200 14 580 0.38 No
Single factoriShares Edge MSCI Min Vol Global ETF ACWV ACWVIV 82.52 3,215 214 445 0.20 NoCambria Global Value ETF GVAL GVALIV 22.04 144 25 149 0.68 No
ESG relatedOppenheimer Global ESG Revenue ETF ESGF ESGFIV 28.34 22 0 1,288 0.45 NoFlexshares STOXX Global ESG Impact Index Fund ESGG ESGGIV 90.54 72 2 655 0.42 NoSPDR MSCI ACWI Low Carbon Target ETF LOWC LOWCIV 82.59 150 3 1,366 0.20 NoiShares MSCI ACWI Low Carbon Target ETF CRBN CRBNIV 108.03 505 13 1,239 0.20 NoiShares MSCI Global Impact ETF SDG MPCTIV 52.64 37 3 125 0.49 NoALPS Workplace Equality Portfolio EQLT EQLTIV 34.55 21 1 275 0.75 No
ActiveDavis Select Worldwide ETF DWLD DWLDIV 21.67 214 43 35 0.65 Yes
Dynamic AllocationInnovator IBD 50 Fund FFTY FFTYIV 30.49 434 263 51 0.80 No
Sector & IndustryConsumer Discretionary
iShares Global Consumer Discretionary ETF RXI RXIIV 104.99 274 20 157 0.47 NoFirst Trust NASDAQ Global Auto Index Fund CARZ CARZIV 32.76 16 4 37 0.70 NoVanEck Vectors Gaming Index ETF BJK BJKIV 34.27 22 9 50 0.65 NoVanEck Vectors Retail ETF RTH RTHIV 101.20 114 23 26 0.35 NoProShares Long Online/Short Stores ETF CLIX CLIXIV 39.59 48 14 26 0.65 No
Consumer StaplesiShares Global Consumer Staples ETF KXI KXIIV 49.13 605 106 99 0.47 No
EnergyiShares Global Energy ETF IXC IXCIV 33.26 1,377 403 79 0.47 NoInvesco WilderHill Progressive Energy ETF PUW PUWIV 24.08 15 1 42 0.70 NoVanEck Vectors Oil Services ETF OIH OIHIV 20.47 1,040 6,730 27 0.35 NoVanEck Vectors Unconventional Oil & Gas ETF FRAK FRAKIV 13.75 69 19 48 0.54 NoVanEck Vectors Coal Index ETF KOL KOLIV 14.37 67 39 28 0.60 No
FinancialsiShares Global Financials ETF IXG IXGIV 60.25 413 39 205 0.47 NoDavis Select Financial ETF DFNL DFNLIV 22.32 146 19 29 0.65 YesInvesco Global Listed Private Equity ETF PSP PSPIV 10.70 222 123 70 2.03 No
Financials - REITsiShares Global REIT ETF REET REETIV 24.44 1,253 206 313 0.14 NoSPDR Dow Jones Global Real Estate ETF RWO RWOIV 46.10 2,188 140 229 0.50 NoFlexShares Global Quality Real Estate Index Fund GQRE GQREIV 57.76 277 10 168 0.45 NoCohen & Steers Global Realty Majors ETF GRI GRIIV 42.08 55 4 77 0.55 No
Health CareiShares Global Healthcare ETF IXJ IXJIV 58.07 1,649 148 114 0.47 NoARK Genomic Revolution Multi-Sector ETF ARKG ARKGIV 26.10 264 166 37 0.75 YesVanEck Vectors Biotech ETF BBH BBHIV 117.13 410 13 26 0.35 NoVanEck Vectors Pharmaceutical ETF PPH PPHIV 59.34 272 41 26 0.35 No
IndustrialsiShares Global Industrials ETF EXI EXIIV 81.53 205 25 211 0.47 NoFirst Trust Global Engineering & Construction ETF FLM FLMIV 49.38 12 10 63 0.70 NoU.S. Global Jets ETF JETS JETSIV 28.67 89 21 35 0.60 No
Information TechnologyiShares Global Tech ETF IXN IXNIV 154.37 2,490 123 122 0.47 NoFirst Trust Cloud Computing ETF SKYY SKYYIV 49.88 1,743 320 30 0.60 NoFirst Trust NASDAQ CEA Smartphone Index FONE FONEIV 42.94 13 8 56 0.70 NoETFMG Prime Cyber Security ETF HACK HACKIV 34.44 1,535 364 55 0.64 NoFirst Trust Nasdaq CEA Cybersecurity ETF CIBR CIBRIV 23.96 707 206 40 0.60 NoETFMG Prime Mobile Payments ETF IPAY IPAYIV 37.51 461 133 42 0.80 NoGlobal X Social Media Index ETF SOCL SOCLIV 27.36 124 46 38 0.65 NoVanEck Vectors Semiconductor ETF SMH SMHIV 88.65 1,251 6,489 26 0.35 No
MaterialsiShares Global Materials ETF MXI MXIIV 59.24 233 33 120 0.47 NoiShares MSCI Global Metals & Mining Producers ETF PICK PICKIV 28.47 310 172 229 0.39 NoInvesco Global Gold and Precious Metals ETF PSAU PSAUIV 15.73 23 27 59 0.75 NoiShares MSCI Global Gold Miners ETF RING RINGIV 14.79 176 356 42 0.39 NoVanEck Vectors Gold Miners Index ETF GDX GMI 19.01 8,626 48,593 49 0.53 NoSprott Gold Miners ETF SGDM SGDMIV 15.73 129 46 26 0.57 NoVanEck Vectors Junior Gold Miners ETF GDXJ GDXJIV 27.89 4,374 14,532 74 0.54 NoSprott Junior Gold Miners ETF SGDJ SGDJIV 23.74 41 76 38 0.57 NoiShares MSCI Global Silver Miners ETF SLVP SLVPIV 8.02 48 35 38 0.39 NoGlobal X Silver Miners ETF SIL SILIV 23.57 311 125 27 0.65 NoGlobal X Lithium & Battery Tech ETF LIT LITIV 29.16 729 227 49 0.75 NoVanEck Vectors Rare Earth/Strategic Metals ETF REMX REMXIV 16.82 110 64 19 0.61 NoGlobal X Copper Miners ETF COPX COPXIV 18.33 69 47 39 0.65 NoVanEck Vectors Steel Index ETF SLX KLX 40.95 90 27 27 0.56 No
Telecommuncation Services
Source: Morningstar Direct, UBS. Note: No. of securities only includes long positions.
Exchange-traded funds
UBS Chief Investment Office Americas, Wealth Management 1 November 2018 21

As of 29 October 2018 Intraday1,069 NAV Price Assets ADTV # of Expense Actively
Ticker Ticker ($/share) (USD Mil) (1,000/shrs) Securities Ratio (%) ManagediShares Global Telecom ETF IXP IXPIV 51.91 253 82 80 0.47 No
UtilitiesiShares Global Utilities ETF JXI JXIIV 49.51 156 35 73 0.47 No
Other Sector & IndustyAgriculture
iShares MSCI Global Agriculture Producers ETF VEGI VEGIIV 26.94 31 2 165 0.39 NoVanEck Vectors Agribusiness Index ETF MOO MOOIV 60.23 833 60 61 0.54 NoInvesco Global Agriculture ETF PAGG PAGGIV 25.19 19 1 56 0.77 No
Clean EnergyInvesco Global Clean Energy ETF PBD PBDIV 10.50 48 7 112 0.75 NoVanEck Vectors Global Alternative Energy ETF GEX GEXIV 52.72 78 4 32 0.63 NoiShares Global Clean Energy ETF ICLN ICLNIV 7.91 152 97 34 0.47 NoInvesco Solar ETF TAN TANIV 17.70 244 85 26 0.70 NoFirst Trust Global Wind Energy ETF FAN FANIV 11.13 70 19 44 0.60 NoFirst Trust NASDAQ Clean Edge Smart Grid Infrastructure Index Fund GRID GRIDIV 41.18 29 4 53 0.70 No
InfrastructureFlexShares STOXX Global Broad Infrastructure Index Fund NFRA NFRAIV 44.28 762 31 177 0.47 NoProShares DJ Brookfield Global Infrastructure ETF TOLZ TOLZIV 39.44 45 11 137 0.46 NoiShares Global Infrastructure ETF IGF IGFIV 40.28 2,551 266 85 0.47 NoSPDR S&P Global Infrastructure ETF GII GIIIV 46.30 251 29 86 0.40 No
Natural ResourcesVanEck Vectors Natural Resources ETF HAP HAPIV 34.18 86 7 298 0.50 NoFlexShares Morningstar Global Upstream Natural Resources Index Fund GUNR GUNRIV 30.72 5,312 323 154 0.46 NoiShares North American Natural Resources ETF IGE IGEIV 30.71 814 122 139 0.47 NoSPDR S&P North American Natural Resources ETF NANR NANRIV 30.49 637 33 54 0.35 NoSPDR S&P Global Natural Resources ETF GNR GNRIV 44.70 1,384 122 104 0.40 No
Timber & ForestryiShares Global Timber & Forestry ETF WOOD WOODIV 64.91 332 42 35 0.47 NoInvesco MSCI Global Timber ETF CUT CUTIV 27.18 167 26 89 0.55 No
WaterInvesco S&P Global Water Index ETF CGW CGWIV 31.98 531 36 55 0.61 NoInvesco Global Water ETF PIO PIOIV 23.14 162 11 49 0.75 No
OtherInvesco Shipping ETF SEA SEAIV 9.02 59 39 27 0.65 NoRobo-Stox Global Robotics and Automation Index ETF ROBO ROBOIV 34.61 1,514 356 91 0.95 NoGlobal X Robotics & Artifical Intelligence Thematic ETF BOTZ BOTZIV 18.42 1,639 798 38 0.68 NoALPS Disruptive Technologies ETF DTEC DTECIV 24.63 46 19 102 0.50 NoiShares Exponential Technologies ETF XT XTIV 34.22 2,210 176 210 0.47 NoKraneShares Electric Vehicles & Future Mobility ETF KARS KARSIV 18.67 29 3 60 0.70 NoThe 3D Printing ETF PRNT PRNTIV 21.19 41 7 48 0.66 NoGlobal X FinTech Thematic ETF FINX FINXIV 23.90 332 229 40 0.68 NoGlobal X Internet of Things Thematic ETF SNSR SNSRIV 17.13 79 29 52 0.68 NoVanEck Vectors Uranium+Nuclear Energy Index ETF NLR NLRIV 51.83 27 1 26 0.61 NoGlobal X Uranium ETF URA URAIV 11.60 298 246 41 0.69 NoInvesco Cleantech™ ETF PZD PZDIV 37.70 150 11 52 0.67 NoVanEck Vectors Environmental Services ETF EVX HVX 88.70 22 1 23 0.55 No
DividendWisdomTree Global High Dividend Fund DEW DEWIV 43.61 92 9 732 0.58 NoSPDR S&P Global Dividend ETF WDIV WDIVIV 63.99 196 15 119 0.40 NoGlobal X SuperDividend™ ETF SDIV SDIVIV 18.94 910 256 112 0.58 NoFranklin LibertyQ Global Dividend ETF FLQD FLQDIV 26.66 16 1 121 0.45 NoFirst Trust Dow Jones Global Select Dividend Index Fund FGD FGDIV 23.23 446 87 106 0.58 NoInvesco S&P Global Dividend Opportunities Index ETF LVL LVLIV 10.46 30 8 107 0.64 NoPacer Global Cash Cows Dividend ETF GCOW GCOWIV 28.96 187 30 107 0.60 No
U.S. Fixed IncomeBroad Market
Traditional cap-weightediShares Core Total USD Bond Market ETF IUSB IUSBIV 48.70 2,334 134 6,754 0.06 NoVanguard Total Bond Market ETF BND BNDIV 78.11 35,902 2,248 17,421 0.05 NoiShares Core U.S. Aggregate Bond ETF AGG AGGIV 104.79 52,986 3,864 6,888 0.05 NoSchwab U.S. Aggregate Bond ETF™ SCHZ SCHZIV 49.91 5,255 400 3,956 0.04 NoSPDR Portfolio Aggregate Bond ETF SPAB SPABIV 27.50 3,052 465 4,620 0.04 No
Smart beta approachIQ Enhanced Core Plus Bond U.S. ETF AGGP AGGPIV 18.93 177 133 23 0.38 NoWisdomTree Barclays Yield Enhanced U.S. Aggregate Bond Fund AGGY AGGYIV 47.69 411 62 2,145 0.12 NoNuShares Enhanced Yield U.S. Aggregate Bond ETF NUAG NUAGIV 23.16 72 67 333 0.20 No
ActivePIMCO Total Return Active ETF BOND BONDIV 101.72 1,887 98 713 0.61 YesFidelity Total Bond ETF FBND FBNDIV 48.13 430 53 862 0.36 YesSPDR DoubleLine Total Return Tactical ETF TOTL TOTLIV 47.03 2,848 410 730 0.55 YesFirst Trust TCW Opportunistic Fixed Income ETF FIXD FIXDIV 48.70 324 75 565 0.55 Yes
ESG relatedNuShares ESG U.S. Aggregate Bond ETF NUBD NUBDIV 23.95 45 7 174 0.20 No
Short-Term Traditional cap-weighted
iShares Core Short-Term USD Bond ETF ISTB ISTBIV 48.84 2,209 190 3,499 0.06 No Active
PIMCO Enhanced Short Maturity Active Exchange-Traded Fund MINT MINTIV 101.58 11,107 913 878 0.35 YesFirst Trust Enhanced Short Maturity ETF FTSM FTSMIV 59.99 3,055 559 775 0.35 YesJPMorgan Ultra-Short Income ETF JPST JPSTIV 50.25 3,269 1,011 571 0.18 YesiShares Short Maturity Bond Fund NEAR NEARIV 50.12 4,932 829 416 0.25 YesInvesco Ultra Short Duration ETF GSY GSYIV 50.22 1,587 327 228 0.25 YesSPDR SSgA Ultra Short Term Bond ETF ULST ULSTIV 40.29 109 37 155 0.21 Yes
Source: Morningstar Direct, UBS. Note: No. of securities only includes long positions.
Exchange-traded funds
UBS Chief Investment Office Americas, Wealth Management 1 November 2018 22

As of 29 October 2018 Intraday1,069 NAV Price Assets ADTV # of Expense Actively
Ticker Ticker ($/share) (USD Mil) (1,000/shrs) Securities Ratio (%) ManagedFranklin Short Duration U.S. Government ETF FTSD FTSDIV 94.56 192 10 357 0.25 YesPIMCO Low Duration Active Exchange-Traded Fund LDUR LDURIV 99.75 203 14 447 0.60 YesFidelity Limited Term Bond ETF FLTB FLTBIV 49.25 184 23 272 0.36 YesSPDR DoubleLine Short Duration Total Return Tactical ETF STOT STOTIV 48.59 87 7 223 0.45 YesFlexShares Ready Access Variable Income Fund RAVI RAVIIV 75.51 211 21 195 0.25 Yes
Long-TermiShares Core Long-Term USD Bond ETF ILTB ILTBIV 57.89 197 17 1,668 0.06 No
Interest Rate HedgedWisdomTree Barclays Interest Rate Hedged U.S. Aggregate Bond Fund AGZD AGZDIV 47.61 57 7 1,020 0.23 No
U.S. TreasuryBroad Market
iShares Core US Treasury Bond ETF GOVT GOVTIV 24.29 6,662 1,039 114 0.15 NoInvesco 1-30 Laddered Treasury ETF PLW PLWIV 30.77 149 12 27 0.25 No
Short-TermSPDR Barclays 1-3 Month T-Bill ETF BIL BILIV 91.58 4,670 1,150 10 0.14 NoiShares Short Treasury Bond ETF SHV SHVIV 110.43 15,403 1,196 40 0.15 NoGoldman Sachs TreasuryAccess 0-1 Year ETF GBIL GBILIV 100.17 2,459 245 14 0.12 NoiShares 1-3 Year Treasury Bond ETF SHY SHYIV 83.16 14,330 1,859 71 0.15 NoSchwab Short-Term U.S. Treasury ETF™ SCHO SCHOIV 49.63 3,004 441 87 0.06 NoPIMCO 1-3 Year U.S. Treasury Index ETF TUZ TUZIV 49.88 55 14 26 0.15 NoSPDR Portfolio Short Term Treasury Bond ETF SPTS SPTSIV 29.45 604 225 98 0.06 No
Intermediate-TermSPDR Barclays Intermediate Term Treasury ETF ITE ITEIV 58.24 600 42 114 0.10 NoSchwab Intermediate-Term U.S. Treasury ETF™ SCHR SCHRIV 51.88 2,946 298 112 0.06 NoiShares 3-7 Year Treasury Bond ETF IEI IEIIV 119.27 7,201 465 65 0.15 NoiShares 7-10 Year Treasury Bond ETF IEF IEFIV 101.13 8,904 3,274 13 0.15 No
Long-TermSPDR Portfolio Long Term Treasury ETF SPTL SPTLIV 33.11 1,125 330 50 0.06 NoiShares 10-20 Year Treasury Bond ETF TLH TLHIV 127.76 664 47 13 0.15 NoiShares 20+ Year Treasury Bond ETF TLT TLTIV 114.73 7,894 8,597 32 0.15 NoVanguard Extended Duration Treasury Index ETF EDV EDVIV 105.08 551 73 81 0.07 NoPIMCO 25+ Year Zero Coupon U.S. Treasury Index ETF ZROZ ZROZIV 103.90 153 16 21 0.15 No
Treasury Inflation Protected SecuritiesiShares TIPS Bond ETF TIP TIPIV 109.38 22,548 1,568 40 0.20 NoSPDR Barclays TIPS ETF IPE IPEIV 53.82 1,454 152 40 0.15 NoPIMCO Broad U.S. TIPS Index ETF TIPZ TIPZIV 55.95 52 4 23 0.20 NoSchwab U.S. TIPS ETF™ SCHP SCHPIV 53.32 5,877 605 40 0.05 NoVanguard Short-Term Inflation-Protected Securities Index Fund ETF Shares VTIP VTIPIV 48.27 5,834 626 16 0.06 NoiShares 0-5 Year TIPS Bond ETF STIP STIPIV 98.45 2,200 135 15 0.06 NoPIMCO 1-5 Year US TIPS Index ETF STPZ STPZIV 51.17 812 39 13 0.20 NoFlexShares iBoxx 3-Year Target Duration TIPS Index Fund TDTT TDTTIV 23.87 1,657 209 20 0.18 NoFlexShares iBoxx 5-Year Target Duration TIPS Index Fund TDTF TDTFIV 24.07 910 106 22 0.18 NoPIMCO 15+ Year US TIPS Index ETF LTPZ LTPZIV 62.28 215 17 10 0.20 No
Floating-RateiShares Treasury Floating Rate Bond ETF TFLO TFLOIV 50.31 302 85 9 0.15 No
U.S. Treasury/AgencyVanguard Short-Term Government Bond ETF VGSH VGSHIV 59.77 3,500 462 93 0.07 NoVanguard Intermediate-Term Government Bond ETF VGIT VGITIV 62.17 2,746 198 116 0.07 NoVanguard Long-Term Government Bond ETF VGLT VGLTIV 70.68 692 97 50 0.07 No
U.S. Treasury/CreditiShares Government/Credit Bond ETF GBF GBFIV 109.22 104 6 1,474 0.20 NoVanguard Short-Term Bond ETF BSV BSVIV 78.01 25,328 1,687 2,543 0.07 NoVanguard Intermediate-Term Bond ETF BIV BIVIV 80.14 12,559 578 1,856 0.07 NoiShares Intermediate Government/Credit Bond ETF GVI GVIIV 107.16 2,074 87 3,053 0.20 NoVanguard Long-Term Bond ETF BLV BLVIV 85.00 2,161 98 2,141 0.07 No
Mortgage-Backed SecuritiesVanguard Mortgage-Backed Securities ETF VMBS VMBSIV 50.68 7,142 571 2,829 0.07 NoiShares MBS ETF MBB MBBIV 102.72 11,773 581 711 0.09 NoFirst Trust Low Duration Opportunities ETF LMBS LMBSIV 50.89 1,728 235 1,535 0.68 YesSPDR Barclays Mortgage Backed Bond ETF MBG MBGIV 25.01 213 68 531 0.06 NoiShares GNMA Bond ETF GNMA GNMAIV 47.76 103 9 76 0.15 NoiShares CMBS ETF CMBS CMBSIV 49.52 312 17 473 0.25 No
AgencyiShares Agency Bond ETF AGZ AGZIV 110.69 382 17 62 0.20 No
Investment Grade CreditBroad Market
iShares Broad USD Investment Grade Corporate Bond ETF USIG USIGIIV 52.91 2,204 328 4,179 0.06 NoVanguard Total Corporate Bond ETF VTC VTCIV 80.03 76 8 4 0.07 NoiShares iBoxx $ Investment Grade Corporate Bond ETF LQD LQDIV 112.80 31,460 6,721 1,966 0.15 NoPIMCO Investment Grade Corporate Bond Index ETF CORP CORPIV 99.05 792 49 482 0.20 NoFidelity Corporate Bond ETF FCOR FCORIV 47.67 55 6 231 0.36 Yes
Sector/Credit QualityiShares Aaa - A Rated Corporate Bond ETF QLTA QLTAIV 49.93 159 10 1,213 0.15 No
Short-TermiShares Short-Term Corporate Bond ETF IGSB IGSBIV 51.70 10,204 1,016 1,344 0.06 NoSPDR Portfolio Short Term Corporate Bond ETF SPSB SPSBIV 30.13 4,497 927 1,125 0.07 NoiShares 0-5 Year Investment Grade Corporate Bond ETF SLQD SLQDIV 49.57 1,421 153 1,289 0.06 NoVanguard Short-Term Corporate Bond ETF VCSH VCSHIV 77.96 20,916 1,474 2,219 0.07 NoiShares ESG 1-5 Year USD Corporate Bond ETF SUSB SUSBIV 24.52 49 14 334 0.12 No
Intermediate-TermVanguard Intermediate-Term Corporate Bond ETF VCIT VCITIV 82.78 18,788 1,270 1,746 0.07 NoSPDR Portfolio Intermediate Term Corporate Bond ETF SPIB SPIBIV 33.10 3,754 935 3,838 0.07 NoiShares Intermediate-Term Corporate Bond ETF IGIB IGIBIV 52.59 5,687 643 1,740 0.06 No
Source: Morningstar Direct, UBS. Note: No. of securities only includes long positions.
Exchange-traded funds
UBS Chief Investment Office Americas, Wealth Management 1 November 2018 23

As of 29 October 2018 Intraday1,069 NAV Price Assets ADTV # of Expense Actively
Ticker Ticker ($/share) (USD Mil) (1,000/shrs) Securities Ratio (%) ManagedLong-Term
Vanguard Long-Term Corporate Bond ETF VCLT VCLTIV 85.05 2,447 276 1,863 0.07 NoSPDR Portfolio Long Term Corporate Bond ETF SPLB SPLBIV 25.39 365 149 1,674 0.07 NoiShares Long-Term Corporate Bond ETF IGLB IGLBIV 56.29 569 82 1,675 0.06 No
Floating-RateiShares Floating Rate Bond ETF FLOT FLOTIV 50.96 11,832 1,820 714 0.20 NoSPDR Barclays Capital Investment Grade Floating Rate ETF FLRN FLRNIV 30.74 4,486 1,273 705 0.15 NoVanEck Vectors Investment Grade Floating Rate ETF FLTR FLTRIV 25.27 621 240 391 0.14 No
Interest Rate HedgedProShares Investment Grade-Interest Rate Hedged IGHG IGHGIV 74.16 475 45 301 0.30 NoiShares Interest Rate Hedged Corporate Bond ETF LQDH LQDHIV 95.64 215 41 3 0.24 Yes
Target MaturityInvesco BulletShares 2019 Corporate Bond ETF BSCJ BSCJIV 21.05 1,217 316 357 0.10 NoInvesco BulletShares 2020 Corporate Bond ETF BSCK BSCKIV 21.04 1,332 318 347 0.10 NoInvesco BulletShares 2021 Corporate Bond ETF BSCL BSCLIV 20.68 1,056 239 372 0.10 NoInvesco BulletShares 2022 Corporate Bond ETF BSCM BSCMIV 20.58 866 219 345 0.10 NoInvesco BulletShares 2023 Corporate Bond ETF BSCN BSCNIV 20.14 422 136 248 0.10 NoInvesco BulletShares 2024 Corporate Bond ETF BSCO BSCOIV 19.96 317 68 228 0.10 NoInvesco BulletShares 2025 Corporate Bond ETF BSCP BSCPIV 19.61 124 34 210 0.10 NoInvesco BulletShares 2026 Corporate Bond ETF BSCQ BSCQIV 18.52 58 12 231 0.10 NoInvesco BulletShares 2027 Corporate Bond ETF BSCR BSCRIV 18.82 34 14 149 0.10 NoiShares iBonds Mar 2020 Term Corporate ETF IBDC IBDCIV 25.93 126 13 363 0.10 NoiShares iBonds Dec 2019 Term Corporate ETF IBDK IBDKIV 24.78 689 130 473 0.10 NoiShares iBonds Dec 2020 Term Corporate ETF IBDL IBDLIV 25.00 803 147 506 0.10 NoiShares iBonds Dec 2021 Term Corporate ETF IBDM IBDMIV 24.29 828 154 550 0.10 NoiShares iBonds Dec 2022 Term Corporate ETF IBDN IBDNIV 24.25 529 107 500 0.10 NoiShares iBonds Dec 2023 Term Corporate ETF IBDO IBDOIV 24.16 478 99 417 0.10 NoiShares iBonds Mar 2023 Term Corporate ETF IBDD IBDDIV 25.63 60 5 301 0.10 NoiShares iBonds Dec 2024 Term Corporate ETF IBDP IBDPIV 23.95 290 44 325 0.10 NoiShares iBonds Dec 2025 Term Corporate ETF IBDQ IBDQIV 23.72 332 54 349 0.10 NoiShares iBonds Dec 2026 Term Corporate ETF IBDR IBDRIV 23.10 153 23 315 0.10 NoiShares iBonds Dec 2027 Term Corporate ETF IBDS IBDSIV 23.37 137 24 298 0.10 NoiShares iBonds Mar 2020 Term Corporate ex-Financials ETF IBCD IBCDIV 24.37 88 4 217 0.10 NoiShares iBonds Mar 2023 Term Corporate ex-Financials ETF IBCE IBCEIV 23.49 45 2 207 0.10 No
Investment Grade Corporate/High YieldSPDR BofA Merrill Lynch Crossover Corporate Bond ETF CJNK CJNKIV 25.17 70 24 1,185 0.30 No
High Yield CorporateBroad Market
Xtrackers USD High Yield Corporate Bond ETF HYLB HYLBIV 48.58 1,920 328 1,058 0.20 NoiShares iBoxx $ High Yield Corporate Bond ETF HYG HYGIV 84.15 14,421 15,101 997 0.49 NoSPDR Barclays High Yield Bond ETF JNK JNKIV 35.09 7,602 12,228 893 0.40 NoFirst Trust Tactical High Yield ETF HYLS HYLSIV 46.91 1,253 140 295 1.10 YesInvesco Fundamental High Yield Corporate Bond ETF PHB PHBIV 18.18 941 366 240 0.50 NoVanEck Vectors Fallen Angel High Yield Bond ETF ANGL ANGLIV 28.23 1,098 247 228 0.35 No
Short-TermSPDR Barclays Capital Short Term High Yield Bond ETF SJNK SJNKIV 27.03 3,218 1,719 726 0.40 NoiShares 0-5 Year High Yield Corporate Bond ETF SHYG SHYGIV 46.14 3,113 637 661 0.30 NoPIMCO 0-5 Year High Yield Corporate Bond Index ETF HYS HYSIV 98.63 1,462 352 390 0.55 No
Interest Rate HedgedProShares High Yield-Interest Rate Hedged HYHG HYHGIV 66.18 185 17 164 0.50 NoiShares Interest Rate Hedged High Yield Bond ETF HYGH HYGHIV 90.36 414 34 3 0.54 YesWisdomTree Interest Rate Hedged High Yield Bond Fund HYZD HYZDIV 23.67 295 100 737 0.43 No
Target MaturityInvesco BulletShares 2019 High Yield Corporate Bond ETF BSJJ BSJJIV 24.03 1,140 205 132 0.42 NoInvesco BulletShares 2020 High Yield Corporate Bond ETF BSJK BSJKIV 23.96 953 161 129 0.42 NoInvesco BulletShares 2021 High Yield Corporate Bond ETF BSJL BSJLIV 24.37 498 123 160 0.42 NoInvesco BulletShares 2022 High Yield Corporate Bond ETF BSJM BSJMIV 24.15 261 63 188 0.42 NoInvesco BulletShares 2023 High Yield Corporate Bond ETF BSJN BSJNIV 25.60 126 28 166 0.42 NoInvesco BulletShares 2024 High Yield Corporate Bond ETF BSJO BSJOIV 24.29 56 11 137 0.42 NoInvesco BulletShares 2025 High Yield Corporate Bond ETF BSJP BSJPIV 23.57 26 9 118 0.42 No
Senior LoanFirst Trust Senior Loan Fund FTSL FTSLIV 47.87 1,881 204 279 0.88 YesSPDR Blackstone/GSO Senior Loan ETF SRLN SRLNIV 47.04 3,429 557 325 0.70 YesInvesco Senior Loan ETF BKLN BKLNIV 23.01 6,730 4,977 151 0.65 No
Preferred StockiShares U.S. Preferred Stock ETF PFF PFFIV 36.13 15,203 3,196 309 0.46 NoInvesco Preferred ETF PGX PGXIV 14.02 4,834 1,998 264 0.51 NoGlobal X U.S. Preferred ETF PFFD PFFDIV 23.52 158 56 228 0.23 NoSPDR Wells Fargo Preferred Stock ETF PSK PSKIV 41.62 634 93 142 0.45 NoFirst Trust Preferred Securities and Income ETF FPE FPEIV 18.72 3,379 760 243 0.85 YesInvesco Variable Rate Preferred ETF VRP VRPIV 24.41 2,082 327 208 0.50 NoVanEck Vectors Preferred Securities ex Financials ETF PFXF PFXFIV 18.71 523 132 99 0.41 NoInvesco Financial Preferred ETF PGF PGFIV 17.87 1,457 325 92 0.63 NoFirst Trust Institutional Preferred Securities and Income ETF FPEI FPEIIV 18.79 94 30 99 0.85 YesInfraCap REIT Preferred ETF PFFR PFFRIV 23.54 22 4 88 0.45 No
Convertible BondSPDR Barclays Capital Convertible Securities ETF CWB CWBIV 49.18 4,175 1,104 171 0.40 No
Taxable municipal bondInvesco Taxable Municipal Bond ETF BAB BABIV 28.82 867 100 291 0.28 No
National Municipal BondiShares National Muni Bond ETF MUB MUBIV 107.40 9,647 803 3,455 0.07 NoVanguard Tax-Exempt Bond Index ETF VTEB VTEBIV 50.28 3,493 745 4,270 0.09 NoSPDR Nuveen Barclays Capital Municipal Bond ETF TFI TFIIV 47.11 2,882 831 3,854 0.23 No
Source: Morningstar Direct, UBS. Note: No. of securities only includes long positions.
Exchange-traded funds
UBS Chief Investment Office Americas, Wealth Management 1 November 2018 24

As of 29 October 2018 Intraday1,069 NAV Price Assets ADTV # of Expense Actively
Ticker Ticker ($/share) (USD Mil) (1,000/shrs) Securities Ratio (%) ManagedFirst Trust Managed Municipal ETF FMB FMBIV 51.87 456 50 529 0.50 Yes
Short-Term Municipal BondiShares Short-Term National Muni Bond ETF SUB SUBIV 104.60 1,761 84 899 0.07 NoSPDR Nuveen Barclays Capital Short Term Municipal Bond ETF SHM SHMIV 47.60 3,690 368 1,422 0.20 NoVanEck Vectors Short Municipal Index ETF SMB SMBIV 17.13 198 38 595 0.20 NoPIMCO Short Term Municipal Bond Active Exchange-Traded Fund SMMU SMMUIV 49.60 77 8 97 0.35 YesInvesco VRDO Tax-Free Weekly ETF PVI PVIIV 24.92 61 6 35 0.25 No
Intermediate-Term Municipal BondVanEck Vectors Intermediate Municipal Index ETF ITM ITMIV 46.27 1,593 122 2,663 0.24 NoPIMCO Intermediate Municipal Bond Active Exchange-Traded Fund MUNI MUNIIV 52.17 275 21 157 0.35 Yes
Long-Term Municipal BondInvesco National AMT-Free Municipal Bond ETF PZA PZAIV 24.58 1,558 243 398 0.28 NoVanEck Vectors Long Municipal Index ETF MLN MLNIV 19.17 140 37 498 0.24 No
SectorVanEck Vectors Pre-Refunded Municipal Index ETF PRB PRBIV 24.11 15 1 60 0.24 No
High Yield Municipal BondVanEck Vectors High-Yield Municipal Index ETF HYD HYDIV 61.13 2,412 357 1,807 0.35 NoSPDR Nuveen S&P High Yield Municipal Bond ETF HYMB HYMBIV 55.71 530 53 1,102 0.35 NoVanEck Vectors Short High-Yield Municipal Index ETF SHYD SHYDIV 24.06 168 39 499 0.35 No
Target MaturityiShares iBonds Sep 2019 Term Muni Bond ETF IBMH IBMHIV 25.32 285 42 1,056 0.18 NoiShares iBonds Sep 2020 Term Muni Bond ETF IBMI IBMIIV 25.22 307 50 1,067 0.18 NoiShares iBonds Dec 2021 Term Muni Bond ETF IBMJ IBMJIV 25.24 230 36 1,258 0.18 NoiShares iBonds Dec 2022 Term Muni Bond ETF IBMK IBMKIV 25.32 233 34 1,224 0.18 NoiShares iBonds Dec 2023 Term Muni Bond ETF IBML IBMLIV 24.73 116 33 837 0.18 No
CaliforniaiShares California Muni Bond ETF CMF CMFIV 57.38 1,072 131 865 0.25 NoInvesco California AMT-Free Municipal Bond ETF PWZ PWZIV 25.31 274 133 128 0.28 No
New YorkiShares New York Muni Bond ETF NYF NYFIV 53.91 309 19 523 0.25 NoInvesco New York AMT-Free Municipal Bond ETF PZT PZTIV 23.42 62 9 47 0.28 No
International Fixed IncomeBroad Market
Vanguard Total International Bond ETF BNDX BNDXIV 54.69 12,108 1,023 5,262 0.11 NoiShares Core International Aggregate Bond ETF IAGG IAGGIV 52.29 873 89 2,186 0.09 NoSPDR Barclays International Treasury Bond ETF BWX BWXIV 27.03 1,022 283 933 0.35 NoSPDR Barclays Short Term International Treasury Bond ETF BWZ BWZIV 30.67 289 51 214 0.35 No
Developed MarketsiShares International Treasury Bond ETF IGOV IGOVIV 47.66 858 87 670 0.35 NoiShares 1-3 Year International Treasury Bond ETF ISHG ISHGIV 80.58 76 6 108 0.35 No
Inflation ProtectedSPDR Citi International Government Inflation-Protected Bond ETF WIP WIPIV 52.75 449 76 191 0.50 No
Region & CountryWisdomTree Asia Local Debt Fund ALD ALDIV 42.10 17 1 51 0.55 YesInvesco Chinese Yuan Dim Sum Bond ETF DSUM DSUMIV 21.34 76 34 40 0.45 No
Investment Grade CorporateSPDR Barclays International Corporate Bond ETF IBND IBNDIV 32.77 187 27 611 0.50 NoInvesco International Corporate Bond ETF PICB PICBIV 25.34 120 12 409 0.50 No
High Yield CorporateiShares International High Yield Bond ETF HYXU HYXUIV 50.85 76 12 340 0.40 NoVanEck Vectors Intl High Yield Bond ETF IHY IHYIV 23.79 129 31 610 0.40 No
Preferred StockiShares International Preferred Stock ETF IPFF IPFFIV 16.62 58 17 107 0.55 No
Emerging MarketsBroad Market
SPDR DoubleLine Emerging Markets Fixed Income ETF EMTL EMTLIV 48.31 55 5 106 0.65 YesU.S. Dollar Sovereign Debt
Vanguard Emerging Markets Government Bond Index Fund ETF Shares VWOB VWOBIV 74.51 1,037 107 1,048 0.32 NoiShares J.P. Morgan USD Emerging Markets Bond ETF EMB EMBIV 104.99 14,782 3,378 417 0.40 NoInvesco Emerging Markets Sovereign Debt ETF PCY PCYIV 26.23 3,752 1,551 112 0.50 NoiShares Emerging Markets High Yield Bond ETF EMHY EMHYIV 45.49 404 73 450 0.50 No
Local Currency Sovereign DebtSPDR Barclays Capital Emerging Markets Local Bond ETF EBND EBNDIV 26.07 563 268 360 0.40 NoVanEck Vectors J.P. Morgan EM Local Currency Bond ETF EMLC EMLCIV 32.40 4,494 2,000 289 0.30 NoiShares J.P. Morgan EM Local Currency Bond ETF LEMB LEMBIV 43.39 427 127 189 0.30 NoWisdomTree Emerging Markets Local Debt Fund ELD ELDIV 32.59 167 71 124 0.55 Yes
CorporateVanEck Vectors Emerging Markets High Yield Bond ETF HYEM HYEMIV 22.78 273 109 454 0.40 NoiShares J.P. Morgan EM Corporate Bond ETF CEMB CEMBIV 47.81 72 15 346 0.50 NoWisdomTree Emerging Markets Corporate Bond Fund EMCB EMCBIV 67.96 41 2 109 0.60 Yes
Global Fixed IncomeBroad Market
ALPS RiverFront Strategic Income RIGS RIGSIV 24.22 120 91 99 0.47 YesSPDR Dorsey Wright Fixed Income Allocation ETF DWFI DWFIIV 22.93 136 24 5 0.60 No
High Yield CorporateiShares Global High Yield Corporate Bond ETF GHYG GHYGIV 48.06 211 22 1,335 0.40 No
Preferred StockGlobal X SuperIncome Preferred ETF SPFF SPFFIV 11.50 186 67 49 0.58 No
CommodityBroad Market
Invesco DB Commodity Index Tracking Fund DBC DBCIIV 17.28 2,579 1,919 22 0.85 NoInvesco Optimum Yield Diversified Commodity Strategy No K-1 ETF PDBC PDBCIV 18.07 2,548 1,864 8 0.59 YesiShares S&P GSCI Commodity-Indexed Trust GSG GSGIV 17.28 1,367 400 5 0.75 No
Source: Morningstar Direct, UBS. Note: No. of securities only includes long positions.
Exchange-traded funds
UBS Chief Investment Office Americas, Wealth Management 1 November 2018 25

As of 29 October 2018 Intraday1,069 NAV Price Assets ADTV # of Expense Actively
Ticker Ticker ($/share) (USD Mil) (1,000/shrs) Securities Ratio (%) ManagedWisdomTree Continuous Commodity Index Fund GCC GCCIV 18.38 162 39 60 0.75 NoUnited States Commodity Index Fund, LP USCI USCIIV 41.48 581 68 43 1.04 NoFirst Trust Global Tactical Commodity Strategy Fund FTGC FTGCIV 19.61 216 101 12 0.95 Yes
AgricultureInvesco DB Agriculture Fund DBA DBAIV 17.51 561 515 18 0.85 No
EnergyInvesco DB Energy Fund DBE DBEIV 16.86 234 150 14 0.75 NoInvesco DB Oil Fund DBO DBOIV 12.45 391 930 9 0.75 NoUnited States 12 Month Oil Fund, LP USL USLIV 25.31 75 23 41 0.86 NoUnited States Brent Oil Fund, LP BNO BNOIV 21.73 113 199 31 0.90 NoUnited States Oil Fund, LP USO UOI 14.11 1,717 19,482 31 0.77 NoUnited States Natural Gas Fund, LP UNG UNGIV 25.92 317 2,681 26 1.30 NoUnited States Gasoline Fund, LP UGA UGAIV 31.36 38 18 30 0.75 No
Industrial MetalsInvesco DB Base Metals Fund DBB DBBIV 16.28 204 228 10 0.75 No
Precious MetalsETFS Physical Precious Metals Basket Shares GLTR GLTRIV 59.68 343 37 4 0.60 NoInvesco DB Precious Metals Fund DBP DBPIV 35.15 105 23 7 0.75 NoSPDR Gold Shares Trust GLD GLDIV 116.31 29,865 7,157 2 0.40 NoiShares Gold Trust IAU IAUIV 11.78 10,784 12,947 1 0.25 NoETFS Physical Swiss Gold Shares SGOL SGOLIV 118.62 778 38 1 0.39 NoInvesco DB Gold Fund DGL DGLIV 38.58 92 41 6 0.75 NoiShares Silver Trust SLV SLVIV 13.59 4,811 8,517 1 0.50 NoETFS Physical Silver Shares SIVR SIVRIV 14.06 326 124 1 0.30 NoInvesco DB Silver Fund DBS DBSIV 22.22 18 1 6 0.75 NoETFS Physical Palladium Shares PALL PALLIV 103.36 148 14 2 0.60 NoETFS Physical Platinum Shares PPLT PPLTIV 79.08 504 59 1 0.60 No
CurrencyInvesco DB G10 Currency Harvest Fund DBV FBV 24.38 24 2 7 0.75 NoWisdomTree Emerging Currency Strategy Fund CEW CEWIV 18.01 24 9 4 0.55 YesInvesco DB US Dollar Index Bearish Fund UDN UDNIV 21.17 30 52 5 0.75 NoInvesco DB US Dollar Index Bullish Fund UUP UUPIV 25.72 545 902 7 0.75 NoWisdomTree Bloomberg U.S. Dollar Bullish Fund USDU USDUIV 27.32 83 27 3 0.50 YesInvesco CurrencyShares Australian Dollar Trust FXA - 70.69 120 17 2 0.40 NoInvesco CurrencyShares British Pound Sterling Trust FXB - 124.20 143 47 2 0.40 NoInvesco CurrencyShares Canadian Dollar Trust FXC - 75.09 158 37 1 0.40 NoWisdomTree Chinese Yuan Strategy Fund CYB CYBIV 25.12 30 4 4 0.45 YesInvesco CurrencyShares Euro Currency Trust FXE - 108.97 250 176 1 0.40 NoInvesco CurrencyShares Japanese Yen Trust FXY - 85.01 129 86 1 0.40 NoInvesco CurrencyShares Swedish Krona Trust FXS - 102.70 15 1 1 0.40 NoInvesco CurrencyShares Swiss Franc Trust FXF - 93.24 178 15 1 0.40 No
Asset AllocationiShares Conservative Allocation ETF AOK AOKIV 32.93 453 54 8 0.25 NoiShares Moderate Allocation ETF AOM AOMIV 36.06 871 94 8 0.25 NoiShares Aggressive Allocation ETF AOA AOAIV 50.09 814 58 8 0.25 NoiShares Growth Allocation ETF AOR AORIV 42.10 1,026 82 8 0.25 NoSPDR SSgA Global Allocation ETF GAL GALIV 35.65 240 21 22 0.35 YesInvesco Zacks Multi-Asset Income ETF CVY CYM 20.59 253 27 151 0.88 NoiShares Morningstar Multi-Asset Income ETF IYLD IYLDIV 23.83 300 37 12 0.59 NoInvesco DWA Tactical Multi-Asset Income ETF DWIN DWINIV 24.41 52 18 6 0.58 NoFirst Trust Strategic Income ETF FDIV FDIVIV 47.52 83 11 198 0.88 YesFirst Trust Multi-Asset Diversified Income Index Fund MDIV MDIVIV 17.87 650 84 125 0.79 NoArrow Dow Jones Global Yield ETF GYLD GYLDIV 16.61 65 9 150 0.75 NoInvesco CEF Income Composite ETF PCEF PCEFIV 21.25 690 108 140 2.07 NoFirst Trust CEF Income Opportunity ETF FCEF FCEFIV 20.11 41 9 48 2.78 YesSPDR SSgA Income Allocation ETF INKM INKMIV 31.64 90 4 15 0.50 YesSPDR SSgA Multi-Asset Real Return ETF RLY RLYIV 24.80 138 17 12 0.50 YesiShares Commodities Select Strategy ETF COMT COMTIV 37.12 733 64 267 0.48 Yes
AlternativesIQ Hedge Multi-Strategy Tracker ETF QAI QAIIV 29.66 1,145 137 250 0.79 NoJPMorgan Diversified Alternatives ETF JPHF JPHFIV 24.05 188 29 698 0.85 YesWisdomTree Managed Futures Strategy Fund WTMF WTMFIV 40.35 182 25 10 0.65 YesAdvisorShares Ranger Equity Bear ETF HDGE HDGEIV 8.23 150 335 4 2.86 YesWisdomTree CBOE S&P PutWrite Strategy Fund PUTW PUTWIV 28.26 219 27 1 0.38 No
Source: Morningstar Direct, UBS. Note: No. of securities only includes long positions.
Exchange-traded funds
UBS Chief Investment Office Americas, Wealth Management 1 November 2018 26

As of 29 October 2018 Intraday38 NAV Price Assets ADTV # of Expense Actively
Ticker Ticker ($/share) (USD Mil) (1,000/shrs) Securities Ratio (%) ManagedSustainable Investing
U.S. EquityBroad ESG
iShares MSCI KLD 400 Social ETF DSI DSIIV 95.81 1,135 44 397 0.25 NoiShares MSCI USA ESG Optimized ETF ESGU ESGUIV 57.68 101 11 297 0.15 NoiShares MSCI USA ESG Select ETF SUSA SUSAIV 107.71 730 19 121 0.25 NoOppenheimer ESG Revenue ETF ESGL ESGLIV 30.04 22 2 238 0.40 NoGoldman Sachs JUST U.S. Large Cap Equity ETF JUST JUSTIV 37.96 248 23 427 0.20 NoNuShares ESG Large-Cap Growth ETF NULG NULGIV 32.79 57 9 113 0.35 NoNuShares ESG Large-Cap Value ETF NULV NULVIV 28.24 45 6 160 0.35 NoNuShares ESG Mid-Cap Value ETF NUMV NUMVIV 26.28 46 4 77 0.40 NoNuShares ESG Mid-Cap Growth ETF NUMG NUMGIV 28.63 47 4 84 0.40 NoNuShares ESG Small-Cap ETF NUSC NUSCIV 27.53 76 16 665 0.40 No
EnvironmentalFirst Trust NASDAQ Clean Edge Green Energy Index Fund QCLN QCLNIV 17.84 83 12 41 0.60 NoInvesco WilderHill Clean Energy ETF PBW PBWIV 22.13 100 14 41 0.70 NoSPDR S&P 500 Fossil Fuel Reserves Free ETF SPYX SPYXIV 64.21 278 12 462 0.20 No
WaterInvesco Water Resources ETF PHO PHOIV 28.53 775 57 37 0.62 NoFirst Trust Water ETF FIW FIWIV 45.13 316 30 38 0.56 No
GovernanceSPDR SSGA Gender Diversity Index ETF SHE SHEIV 69.68 341 11 170 0.20 NoInsightShares LGBT Employment Equality ETF PRID PRIDIV 24.47 27 0 297 0.65 No
Faith basedGlobal X S&P 500 Catholic Values ETF CATH CATHIV 32.89 144 16 464 0.29 No
International EquityBroad ESG
iShares MSCI EAFE ESG Optimized ETF ESGD ESGDIV 59.58 412 41 458 0.20 NoNuShares ESG International Developed Markets Equity ETF NUDM NUDMIV 23.62 43 3 328 0.40 NoNuShares ESG Emerging Markets Equity ETF NUEM NUEMIV 23.23 35 3 395 0.45 NoiShares MSCI EM ESG Optimized ETF ESGE ESGEIV 29.80 330 80 316 0.25 No
Global EquityBroad ESG
Oppenheimer Global ESG Revenue ETF ESGF ESGFIV 28.34 22 0 1,288 0.45 NoFlexshares STOXX Global ESG Impact Index Fund ESGG ESGGIV 90.54 72 2 655 0.42 NoiShares MSCI Global Impact ETF SDG MPCTIV 52.64 37 3 125 0.49 No
Clean/Alternative EnergyInvesco Global Clean Energy ETF PBD PBDIV 10.50 48 7 112 0.75 NoiShares Global Clean Energy ETF ICLN ICLNIV 7.91 152 97 34 0.47 NoVanEck Vectors Global Alternative Energy ETF GEX GEXIV 52.72 78 4 32 0.63 NoInvesco WilderHill Progressive Energy ETF PUW PUWIV 24.08 15 1 42 0.70 NoInvesco Solar ETF TAN TANIV 17.70 244 85 26 0.70 NoFirst Trust Global Wind Energy ETF FAN FANIV 11.13 70 19 44 0.60 NoFirst Trust NASDAQ Clean Edge Smart Grid Infrastructure Index Fund GRID GRIDIV 41.18 29 4 53 0.70 No
WaterInvesco S&P Global Water Index ETF CGW CGWIV 31.98 531 36 55 0.61 NoInvesco Global Water ETF PIO PIOIV 23.14 162 11 49 0.75 No
EnvironmentalSPDR MSCI ACWI Low Carbon Target ETF LOWC LOWCIV 82.59 150 3 1,366 0.20 NoiShares MSCI ACWI Low Carbon Target ETF CRBN CRBNIV 108.03 505 13 1,239 0.20 NoInvesco Cleantech™ ETF PZD PZDIV 37.70 150 11 52 0.67 NoVanEck Vectors Environmental Services ETF EVX HVX 88.70 22 1 23 0.55 No
GovernanceALPS Workplace Equality Portfolio EQLT EQLTIV 34.55 21 1 275 0.75 No
Fixed IncomeNuShares ESG U.S. Aggregate Bond ETF NUBD NUBDIV 23.95 45 7 174 0.20 NoiShares ESG 1-5 Year USD Corporate Bond ETF SUSB SUSBIV 24.52 49 14 334 0.12 No
Source: Morningstar Direct, UBS. Note: No. of securities only includes long positions.
Exchange-traded funds
UBS Chief Investment Office Americas, Wealth Management 1 November 2018 27

Standardized performance as of 30 September 20181-year 3-year 5-year 10-year Since inception
Issuer Ticker Price NAV Price NAV Price NAV Price NAV Price NAVALPS AMLP 2.82 2.50 3.09 3.09 -2.36 -2.38 - - 2.82 2.80Invesco BKLN 3.96 4.18 4.32 4.28 2.77 2.80 - - 3.14 3.26Invesco BKLN 3.96 4.18 4.32 4.28 2.77 2.80 - - 3.14 3.26Vanguard BND -1.33 -1.27 1.25 1.26 2.10 2.09 3.59 3.69 3.74 3.75PIMCO BOND -0.91 -0.59 2.28 2.23 2.75 2.76 - - 3.67 3.70PIMCO BOND -0.91 -0.59 2.28 2.23 2.75 2.76 - - 3.67 3.70SSgA BWX -1.53 -1.75 2.07 2.04 -0.56 -0.57 1.83 1.83 1.99 1.97Victory Capital CFA 14.88 14.91 16.12 16.09 - - - - 11.09 11.08Invesco CGW 3.09 3.48 11.57 11.65 8.11 8.13 8.49 8.35 5.32 5.30BlackRock CRBN 9.08 9.55 13.23 13.17 - - - - 8.26 8.17ProShares CSM 16.96 16.80 17.81 17.64 14.40 14.38 - - 16.25 16.30Invesco DBC 16.69 16.60 5.85 5.89 -6.95 -7.01 -6.00 -5.93 -1.91 -1.79WisdomTree DEM 5.96 7.09 13.74 14.01 0.83 0.93 4.66 4.92 2.60 2.91WisdomTree DGRW 18.58 18.54 18.17 18.12 14.21 14.20 - - 13.66 13.68BlackRock DSI 16.67 16.57 16.31 16.31 12.74 12.72 10.65 11.32 8.11 8.11SSgA EDIV 4.30 5.24 11.33 11.42 -1.40 -1.32 - - -1.86 -1.75BlackRock EEM -2.12 -1.35 11.64 11.73 3.06 3.02 4.32 4.45 11.00 10.91BlackRock EEM -2.12 -1.35 11.64 11.73 3.06 3.02 4.32 4.45 11.00 10.91BlackRock EEM -2.12 -1.35 11.64 11.73 3.06 3.02 4.32 4.45 11.00 10.91WisdomTree EES 15.46 15.41 19.04 18.93 11.36 11.36 13.70 13.68 9.11 9.13BlackRock EFA 2.35 2.69 8.93 9.17 4.26 4.33 5.00 5.30 5.39 5.41BlackRock EFA 2.35 2.69 8.93 9.17 4.26 4.33 5.00 5.30 5.39 5.41BlackRock EFA 2.35 2.69 8.93 9.17 4.26 4.33 5.00 5.30 5.39 5.41BlackRock EFAV 5.12 5.39 8.62 8.78 6.88 6.97 - - 8.28 8.63BlackRock EFV -0.88 -0.51 7.73 7.94 2.84 2.94 4.08 4.31 3.71 3.72BlackRock EMB -3.21 -2.99 5.25 5.40 4.46 4.56 6.66 6.79 5.59 5.70BlackRock EMGF -5.53 -4.44 - - - - - - 11.38 11.29VanEck EMLC -9.11 -9.25 3.84 3.79 -2.28 -2.31 - - -0.21 -0.01First Trust EMLP -1.54 -1.58 6.54 6.53 4.40 4.41 - - 6.48 6.33BlackRock EPHE -18.34 -17.54 -3.83 -3.67 -1.10 -1.11 - - 3.17 3.33BlackRock EPHE -18.34 -17.54 -3.83 -3.67 -1.10 -1.11 - - 3.17 3.33WisdomTree EPI -3.14 -2.84 7.68 7.96 10.65 10.70 5.19 5.31 0.50 0.56BlackRock ESGD 2.62 3.02 - - - - - - 12.64 14.59BlackRock ESGE -2.05 -0.99 - - - - - - 10.55 14.89BlackRock EWA 2.98 4.05 12.15 12.45 1.95 2.05 5.81 6.25 7.70 7.74BlackRock EWA 2.98 4.05 12.15 12.45 1.95 2.05 5.81 6.25 7.70 7.74BlackRock EWC 1.52 1.70 9.94 10.07 2.41 2.32 3.00 3.04 7.97 7.97BlackRock EWM 6.65 7.25 8.34 8.65 -2.18 -2.28 6.10 6.26 2.10 2.15BlackRock EWM 6.65 7.25 8.34 8.65 -2.18 -2.28 6.10 6.26 2.10 2.15BlackRock EWT 7.45 8.12 15.86 15.80 8.84 8.84 8.93 9.13 2.07 2.10BlackRock EWT 7.45 8.12 15.86 15.80 8.84 8.84 8.93 9.13 2.07 2.10BlackRock EWY 1.81 2.03 14.30 13.98 3.99 3.89 6.98 7.20 7.87 7.87WisdomTree EZM 12.48 12.49 14.62 14.55 10.95 10.93 13.94 13.73 9.60 9.61BlackRock EZU -2.59 -2.35 8.87 9.07 4.24 4.32 3.33 3.56 2.56 2.57Fidelity FBND -0.63 -0.71 3.02 2.82 - - - - 2.01 2.12Fidelity FBND -0.63 -0.71 3.02 2.82 - - - - 2.01 2.12SSgA FEZ -4.53 -4.44 7.35 7.52 2.99 3.08 2.39 2.59 6.11 6.30Global X FINX 38.64 38.91 - - - - - - 37.74 37.11First Trust FMB 0.66 0.87 3.42 3.44 - - - - 3.76 3.83Charles Schwab FNDA 13.69 13.88 15.87 15.89 11.26 11.28 - - 11.72 11.80Charles Schwab FNDB 15.11 15.15 15.77 15.70 12.01 12.02 - - 11.94 11.97Charles Schwab FNDF 2.61 3.07 10.53 10.74 4.57 4.75 - - 5.34 5.54First Trust FPE 0.53 0.56 6.51 6.57 7.07 7.00 - - 4.83 4.90First Trust FTSL 3.77 3.67 3.69 3.70 3.29 3.34 - - 3.06 3.07First Trust FTSL 3.77 3.67 3.69 3.70 3.29 3.34 - - 3.06 3.07Goldman Sachs GEM -0.06 0.35 11.47 11.28 - - - - 12.30 11.38VanEck GEX -1.91 -1.83 6.86 6.92 2.98 2.96 -5.44 -5.47 -5.18 -5.10BlackRock GOVT -1.76 -1.76 0.12 0.12 1.22 1.24 - - 0.98 0.92Goldman Sachs GSIE 4.31 4.65 - - - - - - 8.64 8.55Northern Trust GUNR 11.44 11.73 17.00 17.15 3.19 3.23 - - 2.75 1.90SSgA GXC -3.67 -2.61 14.38 14.70 7.62 7.68 8.58 8.79 7.34 7.47ETF Managers Group HACK 33.34 33.14 17.18 17.09 - - - - 13.20 13.29VanEck HAP 8.72 9.06 14.58 14.70 3.22 3.16 3.49 3.58 1.32 1.32WisdomTree HEDJ 0.40 0.61 10.31 10.38 8.27 8.39 - - 7.51 7.57BlackRock HEZU 1.49 1.60 9.27 9.28 - - - - 7.64 6.92VanEck HYD 3.82 4.02 5.09 5.15 6.20 6.20 - - 7.40 7.70BlackRock HYG 2.46 2.55 6.74 6.84 4.30 4.29 7.59 7.34 5.31 5.47DWS HYLB 2.57 2.56 - - - - - - 4.89 5.39First Trust HYLS 3.04 3.03 5.39 5.39 4.65 4.72 - - 4.93 4.98PIMCO HYS 3.86 3.80 7.23 7.17 4.24 4.34 - - 5.25 5.30
Source: Morningstar Direct, UBS.
Exchange-traded funds
UBS Chief Investment Office Americas, Wealth Management 1 November 2018 28
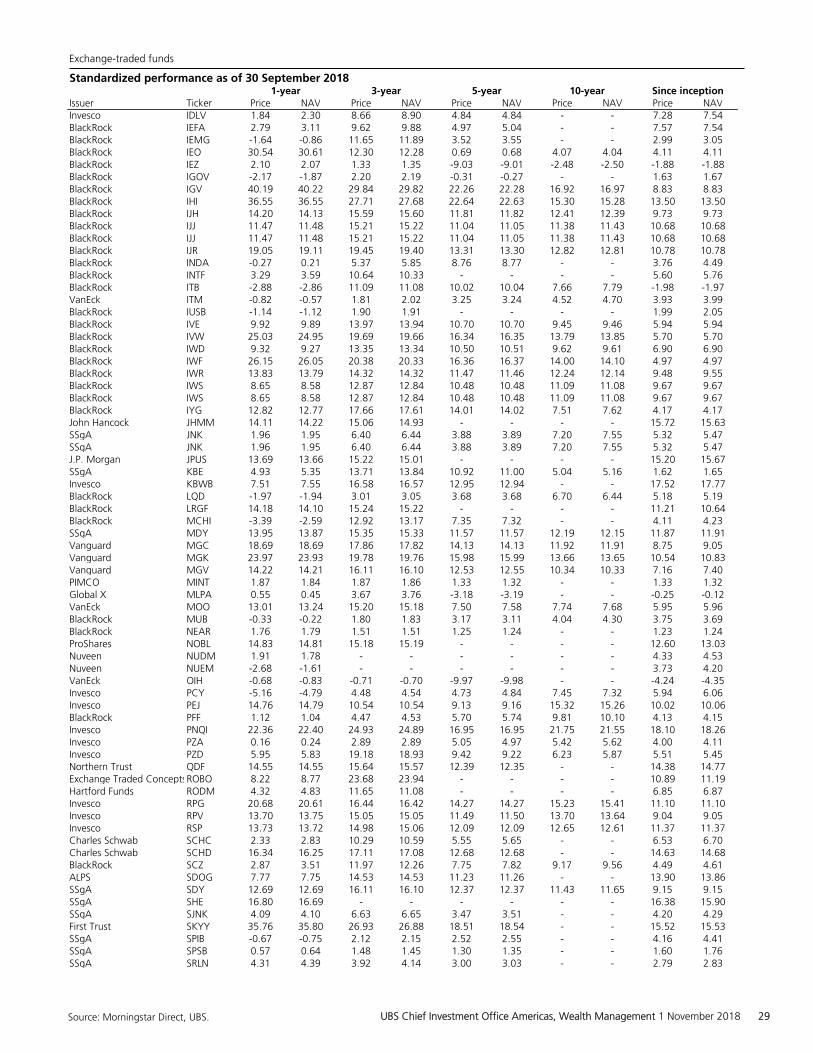
Standardized performance as of 30 September 20181-year 3-year 5-year 10-year Since inception
Issuer Ticker Price NAV Price NAV Price NAV Price NAV Price NAVInvesco IDLV 1.84 2.30 8.66 8.90 4.84 4.84 - - 7.28 7.54BlackRock IEFA 2.79 3.11 9.62 9.88 4.97 5.04 - - 7.57 7.54BlackRock IEMG -1.64 -0.86 11.65 11.89 3.52 3.55 - - 2.99 3.05BlackRock IEO 30.54 30.61 12.30 12.28 0.69 0.68 4.07 4.04 4.11 4.11BlackRock IEZ 2.10 2.07 1.33 1.35 -9.03 -9.01 -2.48 -2.50 -1.88 -1.88BlackRock IGOV -2.17 -1.87 2.20 2.19 -0.31 -0.27 - - 1.63 1.67BlackRock IGV 40.19 40.22 29.84 29.82 22.26 22.28 16.92 16.97 8.83 8.83BlackRock IHI 36.55 36.55 27.71 27.68 22.64 22.63 15.30 15.28 13.50 13.50BlackRock IJH 14.20 14.13 15.59 15.60 11.81 11.82 12.41 12.39 9.73 9.73BlackRock IJJ 11.47 11.48 15.21 15.22 11.04 11.05 11.38 11.43 10.68 10.68BlackRock IJJ 11.47 11.48 15.21 15.22 11.04 11.05 11.38 11.43 10.68 10.68BlackRock IJR 19.05 19.11 19.45 19.40 13.31 13.30 12.82 12.81 10.78 10.78BlackRock INDA -0.27 0.21 5.37 5.85 8.76 8.77 - - 3.76 4.49BlackRock INTF 3.29 3.59 10.64 10.33 - - - - 5.60 5.76BlackRock ITB -2.88 -2.86 11.09 11.08 10.02 10.04 7.66 7.79 -1.98 -1.97VanEck ITM -0.82 -0.57 1.81 2.02 3.25 3.24 4.52 4.70 3.93 3.99BlackRock IUSB -1.14 -1.12 1.90 1.91 - - - - 1.99 2.05BlackRock IVE 9.92 9.89 13.97 13.94 10.70 10.70 9.45 9.46 5.94 5.94BlackRock IVW 25.03 24.95 19.69 19.66 16.34 16.35 13.79 13.85 5.70 5.70BlackRock IWD 9.32 9.27 13.35 13.34 10.50 10.51 9.62 9.61 6.90 6.90BlackRock IWF 26.15 26.05 20.38 20.33 16.36 16.37 14.00 14.10 4.97 4.97BlackRock IWR 13.83 13.79 14.32 14.32 11.47 11.46 12.24 12.14 9.48 9.55BlackRock IWS 8.65 8.58 12.87 12.84 10.48 10.48 11.09 11.08 9.67 9.67BlackRock IWS 8.65 8.58 12.87 12.84 10.48 10.48 11.09 11.08 9.67 9.67BlackRock IYG 12.82 12.77 17.66 17.61 14.01 14.02 7.51 7.62 4.17 4.17John Hancock JHMM 14.11 14.22 15.06 14.93 - - - - 15.72 15.63SSgA JNK 1.96 1.95 6.40 6.44 3.88 3.89 7.20 7.55 5.32 5.47SSgA JNK 1.96 1.95 6.40 6.44 3.88 3.89 7.20 7.55 5.32 5.47J.P. Morgan JPUS 13.69 13.66 15.22 15.01 - - - - 15.20 15.67SSgA KBE 4.93 5.35 13.71 13.84 10.92 11.00 5.04 5.16 1.62 1.65Invesco KBWB 7.51 7.55 16.58 16.57 12.95 12.94 - - 17.52 17.77BlackRock LQD -1.97 -1.94 3.01 3.05 3.68 3.68 6.70 6.44 5.18 5.19BlackRock LRGF 14.18 14.10 15.24 15.22 - - - - 11.21 10.64BlackRock MCHI -3.39 -2.59 12.92 13.17 7.35 7.32 - - 4.11 4.23SSgA MDY 13.95 13.87 15.35 15.33 11.57 11.57 12.19 12.15 11.87 11.91Vanguard MGC 18.69 18.69 17.86 17.82 14.13 14.13 11.92 11.91 8.75 9.05Vanguard MGK 23.97 23.93 19.78 19.76 15.98 15.99 13.66 13.65 10.54 10.83Vanguard MGV 14.22 14.21 16.11 16.10 12.53 12.55 10.34 10.33 7.16 7.40PIMCO MINT 1.87 1.84 1.87 1.86 1.33 1.32 - - 1.33 1.32Global X MLPA 0.55 0.45 3.67 3.76 -3.18 -3.19 - - -0.25 -0.12VanEck MOO 13.01 13.24 15.20 15.18 7.50 7.58 7.74 7.68 5.95 5.96BlackRock MUB -0.33 -0.22 1.80 1.83 3.17 3.11 4.04 4.30 3.75 3.69BlackRock NEAR 1.76 1.79 1.51 1.51 1.25 1.24 - - 1.23 1.24ProShares NOBL 14.83 14.81 15.18 15.19 - - - - 12.60 13.03Nuveen NUDM 1.91 1.78 - - - - - - 4.33 4.53Nuveen NUEM -2.68 -1.61 - - - - - - 3.73 4.20VanEck OIH -0.68 -0.83 -0.71 -0.70 -9.97 -9.98 - - -4.24 -4.35Invesco PCY -5.16 -4.79 4.48 4.54 4.73 4.84 7.45 7.32 5.94 6.06Invesco PEJ 14.76 14.79 10.54 10.54 9.13 9.16 15.32 15.26 10.02 10.06BlackRock PFF 1.12 1.04 4.47 4.53 5.70 5.74 9.81 10.10 4.13 4.15Invesco PNQI 22.36 22.40 24.93 24.89 16.95 16.95 21.75 21.55 18.10 18.26Invesco PZA 0.16 0.24 2.89 2.89 5.05 4.97 5.42 5.62 4.00 4.11Invesco PZD 5.95 5.83 19.18 18.93 9.42 9.22 6.23 5.87 5.51 5.45Northern Trust QDF 14.55 14.55 15.64 15.57 12.39 12.35 - - 14.38 14.77Exchange Traded ConceptsROBO 8.22 8.77 23.68 23.94 - - - - 10.89 11.19Hartford Funds RODM 4.32 4.83 11.65 11.08 - - - - 6.85 6.87Invesco RPG 20.68 20.61 16.44 16.42 14.27 14.27 15.23 15.41 11.10 11.10Invesco RPV 13.70 13.75 15.05 15.05 11.49 11.50 13.70 13.64 9.04 9.05Invesco RSP 13.73 13.72 14.98 15.06 12.09 12.09 12.65 12.61 11.37 11.37Charles Schwab SCHC 2.33 2.83 10.29 10.59 5.55 5.65 - - 6.53 6.70Charles Schwab SCHD 16.34 16.25 17.11 17.08 12.68 12.68 - - 14.63 14.68BlackRock SCZ 2.87 3.51 11.97 12.26 7.75 7.82 9.17 9.56 4.49 4.61ALPS SDOG 7.77 7.75 14.53 14.53 11.23 11.26 - - 13.90 13.86SSgA SDY 12.69 12.69 16.11 16.10 12.37 12.37 11.43 11.65 9.15 9.15SSgA SHE 16.80 16.69 - - - - - - 16.38 15.90SSgA SJNK 4.09 4.10 6.63 6.65 3.47 3.51 - - 4.20 4.29First Trust SKYY 35.76 35.80 26.93 26.88 18.51 18.54 - - 15.52 15.53SSgA SPIB -0.67 -0.75 2.12 2.15 2.52 2.55 - - 4.16 4.41SSgA SPSB 0.57 0.64 1.48 1.45 1.30 1.35 - - 1.60 1.76SSgA SRLN 4.31 4.39 3.92 4.14 3.00 3.03 - - 2.79 2.83
Source: Morningstar Direct, UBS.
Exchange-traded funds
UBS Chief Investment Office Americas, Wealth Management 1 November 2018 29

Standardized performance as of 30 September 20181-year 3-year 5-year 10-year Since inception
Issuer Ticker Price NAV Price NAV Price NAV Price NAV Price NAVSSgA SRLN 4.31 4.39 3.92 4.14 3.00 3.03 - - 2.79 2.83BlackRock SUSA 15.97 16.10 16.64 16.70 12.67 12.68 10.68 10.70 8.26 8.27SSgA TFI -0.75 -0.55 1.78 1.87 3.29 3.27 4.71 4.56 3.83 3.87BlackRock THD 11.81 12.65 17.89 17.73 7.57 7.37 13.75 13.83 9.07 9.08SSgA TOTL -1.06 -0.59 1.56 1.67 - - - - 1.46 1.51SSgA TOTL -1.06 -0.59 1.56 1.67 - - - - 1.46 1.51US Commodity Funds USCI 6.07 5.96 0.52 0.46 -5.37 -5.44 - - -2.01 -1.92Vanguard VAW 3.70 3.68 16.58 16.59 8.94 8.94 9.11 9.09 8.94 8.94Vanguard VB 16.75 16.70 16.37 16.33 11.47 11.48 12.22 12.37 9.81 9.81Vanguard VCR 27.41 27.38 16.88 16.89 14.45 14.46 16.82 16.78 10.42 10.42Vanguard VDC 3.80 3.82 7.60 7.61 9.14 9.16 10.34 10.36 9.54 9.54Vanguard VDE 15.20 15.22 10.46 10.44 0.33 0.32 3.50 3.41 7.51 7.51Vanguard VEA 2.64 2.74 9.79 9.83 4.83 4.85 5.40 5.53 1.72 1.77Vanguard VFH 8.14 8.15 16.62 16.58 13.33 13.33 7.99 7.99 4.35 4.35Vanguard VGT 34.70 34.59 28.07 28.00 21.86 21.86 17.14 17.13 10.83 10.83Vanguard VHT 20.05 19.99 15.32 15.30 15.78 15.76 14.73 14.76 10.55 10.54Vanguard VIG 19.06 19.05 16.89 16.89 12.05 12.06 11.14 11.16 8.84 8.84Vanguard VIS 11.80 11.83 17.96 17.98 12.69 12.70 11.87 11.90 9.97 9.99BlackRock VLUE 16.15 16.12 16.27 16.34 12.58 12.59 - - 13.57 13.19Vanguard VMBS -0.94 -1.02 0.83 0.86 1.90 1.88 - - 2.38 2.39Vanguard VNQ 1.91 1.94 7.00 7.01 8.67 8.68 7.47 7.50 8.43 8.43Vanguard VO 13.45 13.42 13.78 13.78 11.66 11.66 12.43 12.42 9.90 9.90Vanguard VOO 17.88 17.85 17.28 17.26 13.88 13.90 - - 15.13 15.30Vanguard VOX -2.55 -2.57 6.65 6.64 5.39 5.39 8.66 8.63 7.29 7.24Vanguard VPU 4.20 4.26 11.77 11.77 11.28 11.28 9.45 9.45 9.72 9.73Invesco VRP 0.05 0.21 5.86 6.08 - - - - 4.87 4.97Vanguard VT 9.64 9.76 13.68 13.63 8.94 8.97 8.20 8.50 6.49 6.46Vanguard VTEB -0.12 -0.07 2.07 2.11 - - - - 2.12 2.18Vanguard VTI 17.64 17.63 17.09 17.07 13.43 13.44 12.09 12.09 7.66 7.46Vanguard VWO -3.57 -3.10 10.10 10.08 3.11 2.98 4.60 4.71 6.28 6.23Vanguard VXF 16.15 16.10 16.18 16.16 11.40 11.41 12.42 12.41 10.05 10.05Vanguard VYM 10.70 10.67 15.07 15.07 12.03 12.04 10.97 10.98 8.03 8.03SSgA XES 1.66 1.59 -0.83 -0.84 -15.75 -15.76 -5.52 -5.57 -3.09 -3.26SSgA XHB -2.59 -2.70 4.74 4.71 5.35 5.35 8.03 8.02 -0.57 -0.58SSgA XHE 40.94 41.12 30.05 29.91 23.05 22.97 - - 19.61 19.60SSgA XLB 3.87 3.84 15.47 15.44 8.77 8.77 8.10 8.20 7.75 7.78SSgA XLC - - - - - - - - -6.65 -6.78SSgA XLE 13.66 13.70 10.53 10.51 0.86 0.87 4.11 4.02 8.16 8.09SSgA XLF 8.49 8.58 16.56 16.56 13.30 13.29 7.45 7.34 3.92 4.22SSgA XLI 12.46 12.43 18.62 18.59 13.29 13.29 12.18 12.22 8.27 8.42SSgA XLP 2.71 2.68 7.35 7.32 9.08 9.08 9.90 9.96 5.98 6.07SSgA XLRE 4.87 4.85 - - - - - - 6.45 6.72SSgA XLU 2.78 2.83 10.44 10.45 10.88 10.90 8.78 8.83 6.68 6.82SSgA XLV 18.18 18.08 14.59 14.54 15.18 15.17 14.20 14.05 8.71 8.71SSgA XLY 31.69 31.63 18.11 18.10 15.73 15.74 17.22 17.15 9.31 9.52
Issuer Web-siteALPS http://www.alpsfunds.com/BlackRock https://www.ishares.com/us/indexCharles Schwab http://www.schwab.com/public/schwab/investing/accounts_products/investment/etfs/schwab_etfsDWS https://dws.com/US/EN/Product-FinderETF Managers Group http://www.etfmg.com/partners/Exchange Traded Conceptshttps://www.exchangetradedconcepts.com/funds/Fidelity https://www.fidelity.com/etfs/overviewFirst Trust https://www.ftportfolios.com/Global X http://www.globalxfunds.com/Goldman Sachs https://www.gsam.com/content/gsam/us/en/individual/products/etf-fund-finder.htmlGuggenheim http://guggenheiminvestments.com/products/etf/Hartford Funds https://www.hartfordfunds.com/products/ETFhub.htmlInvesco https://www.invesco.com/portal/site/us/financial-professional/etfs/J.P. Morgan https://am.jpmorgan.com/us/en/asset-management/gim/adv/products/etfsJohn Hancock https://etf.jhinvestments.com/etf/our-etfs.htmlNorthern Trust https://www.flexshares.com/exchange-traded-fundsNuveen https://www.nuveen.com/exchange-traded-funds
All performance figures were obtained from Morningstar Direct, and are current as of the most recent month end. You may obtain a prospectus and performance data for the ETFs current to the most recent month end by clicking on the llinks below. Performance quoted represents past performance, which is no guarantee of future results. Investment return and principal value will fluctuate, so you may have a gain or loss when shares are sold. Current performance may be higher or lower than that quoted.
Source: Morningstar Direct, UBS.
Exchange-traded funds
UBS Chief Investment Office Americas, Wealth Management 1 November 2018 30

Standardized performance as of 30 September 20181-year 3-year 5-year 10-year Since inception
Issuer Ticker Price NAV Price NAV Price NAV Price NAV Price NAVPIMCO http://www.pimcoetfs.com/Funds/Pages/default.aspx?WT.svl=navProShares http://www.proshares.com/SSgA https://www.spdrs.com/US Commodity Funds http://www.unitedstatescommodityfunds.com/VanEck http://www.vaneck.com/Vanguard https://investor.vanguard.com/corporate-portal/Victory Capital https://www.vcm.com/investment-professionals/victoryshares-etfsWisdomTree https://www.wisdomtree.com/etfs
Source: Morningstar Direct, UBS.
Exchange-traded funds
UBS Chief Investment Office Americas, Wealth Management 1 November 2018 31

Appendix
Statement of Risk
Exchange Traded Funds (ETFs) - For purposes of this report, ETFs include index-linked funds regulated under the InvestmentCompany Act of 1940 that trade on US securities exchanges under exemptive relief from the Securities and ExchangeCommission. The shares of all of the ETF issuers discussed in this Report are listed on U.S. securities exchanges. TheETFs are either open-end, registered investment companies (including UITs) operating under an exemptive order fromthe SEC, or collective investment vehicles, formed as grantor trusts, limited partnerships or similar structures that offerpass-through tax treatment to investors. The different structures provide different rights for investors. For example, ETFsregistered under the Investment Company Act of 1940 must stand ready at all times to redeem shares (albeit only increation unit size) whereas those ETFs that are not subject to registration under the Investment Company Act of 1940may suspend redemptions at any time. We refer to ETFs registered with the SEC under the Investment Company Act of1940 as “’40 Act ETFs” and to nonregistered ETFs as “33 Act ETFs.” Most of the ETFs discussed in this Report track anindex of financial instruments or provide exposure to a single commodity type. ETFs are subject to the same risks as theunderlying securities and commissions may be charged on every trade, if applicable. This definition does not imply thatETFs are endorsed by the Securities and Exchange Commission.Any discussion contained herein regarding future performance is not intended to guarantee future performance or tosuggest that past performance will reoccur. Moreover, target returns are not intended to be projections but to provide arange within which price levels may move assuming current market conditions as well as the other assumptions mentionedin the Report are met. Performance of an index is not illustrative of any particular investment. It is not possible to investdirectly in an index.ETFs are sold by prospectus, which contains details about ETFs, including investment objectives, risks, charges andexpenses. Clients should read the prospectus and consider this information carefully before investing.US-registered, open-ended index-linked funds are redeemable only in Creation Unit size aggregations through anAuthorized Participant, and may not be individually redeemed. Many ETFs are redeemable only on an "in-kind" basis. Thepublic trading price of a redeemable lot of ETFs may be different from their net asset value, and ETFs could trade at apremium or discount to the net asset value. UBS AG or its affiliates act as authorized participant for many of the ETFSdiscussed in this Report. In addition, UBS is a regular issuer of traded financial instruments and privately-issued financialproducts that may be linked to the ETFs mentioned in this Report. UBS regularly trades in ETFs. Through these and otheractivities, UBS may engage in transactions involving ETFs that are inconsistent with the strategies in this Report.Clients may obtain more information about the ETFs cited in this report, including copies of prospectuses or summary,from their UBS FS financial advisor or by referencing the corresponding link following each ETF ticker in each fact sheet.Commodities Disclosure: An allocation to commodities may not be appropriate for all investors. The information presentedhere is provided for general informational purposes only and is not intended to suggest a particular course of action forinvestors. Prior to considering an investment, investors should be mindful of the different types of risks associated withthe different investment types of commodities listed and also that the risks of investing indirectly may be different thanthe risks of a direct investment.
Required Disclosures
Analyst Certification
Each research analyst primarily responsible for the content of this research report, in whole or in part, certifies that withrespect to each security or issuer that the analyst covered in this report: (1) all of the views expressed accurately reflecthis or her personal views about those securities or issuers; and (2) no part of his or her compensation was, is, or will be,directly or indirectly, related to the specific recommendations or views expressed by that research analyst in the researchreport.
For a complete set of required disclosures relating to the companies that are the subject of this report, please mail arequest to UBS CIO Americas, Wealth Management Business Management, 1285 Avenue of the Americas, 20th Floor,Avenue of the Americas, New York, NY 10019.
Disclosures (1 November 2018)
Exchange-traded funds
UBS Chief Investment Office Americas, Wealth Management 1 November 2018 32

Appendix
AdvisorShares Ranger Equity Bear ETF 1, ALPS Equal Sector Weight ETF 1, ALPS International Sector Dividend DogsETF 1, ALPS Sector Dividend Dogs ETF 1, Barron's 400 ETF 1, BLDRS Asia 50 ADR Index 1, BLDRS Developed Markets100 ADR Index 1, BLDRS Emerging Markets 50 ADR Index 1, BLDRS Europe 100 ADR Index 1, Cambria ShareholderYield ETF 1, Cohen & Steers Global Realty Majors ETF 1, Consumer Discretionary Select Sector SPDR. Fund 1, ConsumerStaples Select Sector SPDR. Fund 1, CurrencyShares Australian Dollar Trust 1, CurrencyShares British Pound SterlingTrust 1, CurrencyShares Canadian Dollar Trust 1, CurrencyShares Euro Trust 1, 5, CurrencyShares Japanese Yen Trust 1,CurrencyShares Swedish Krona Trust 1, CurrencyShares Swiss Franc Trust 1, Direxion All Cap Insider Sentiment Shares1, Direxion NASDAQ-100 Equal Weighted Index Shares 1, EGShares Beyond BRICs ETF 1, EG Shares India ConsumerETF 1, Energy Select Sector SPDR. Fund 1, 3, 5, ETFS Physical Palladium Shares 1, ETFS Physical Platinum Shares 1, ETFSPhysical Precious Metals Basket Shares 1, ETFS Physical Silver Shares 1, ETFS Physical Swiss Gold Shares 1, Fidelity. NASDAQComposite Index. Tracking Stock Fund 1, Financial Select Sector SPDR. Fund 1, 3, First Trust Asia Pac Ex-Jap AlphaDEX1, First Trust BICK Index Fund 1, First Trust Brazil AlphaDEX 1, First Trust Canada AlphaDEX Fund 1, First Trust CapitalStrength ETF 1, First Trust Consumer Discretionary AlphaDEX Fund 1, First Trust Consumer Staples AlphaDEX Fund 1,First Trust Dev Markets Ex-US AlphaDEX 1, First Trust Dow Jones Internet Index Fund 1, First Trust Dow Jones SelectMicroCap Index Fund 1, First Trust Emerging Markets AlphaDEX 1, First Trust Emerging Markets Small Cap AlphaDEXFund 1, First Trust Energy AlphaDEX Fund 1, First Trust Europe AlphaDEX 1, First Trust FTSE EPRA/NAREIT DevelopedMarkets Real Estate Index Fund 1, First Trust Germany AlphaDEX Fund 1, First Trust Health Care AlphaDEX Fund 1, FirstTrust Hong Kong AlphaDEX Fund 1, First Trust Industrials/Producer Durables AlphaDEX Fund 1, First Trust ISE ChindiaIndex Fund 1, First Trust ISE Cloud Computing Index Fund 1, First Trust ISE-Revere Natural Gas Index Fund 1, First TrustISE Water Index Fund 1, First Trust Japan AlphaDEX 1, First Trust Large Cap Core AlphaDEX Fund 1, First Trust LargeCap Growth Opportunities AlphaDEX Fund 1, First Trust Large Cap Value AlphaDEX(R) Fund 1, First Trust Latin AmericaAlphaDEX 1, First Trust Materials AlphaDEX Fund 1, First Trust Mega Cap Alphadex Fund 1, First Trust Mid Cap CoreAlphaDEX Fund 1, First Trust Mid Cap Growth AlphaDEX 1, First Trust Mid Cap Value AlphaDEX 1, First Trust MorningstarDividend Leaders Index Fund 1, First Trust Multi-Asset Diversified Income Index Fund 1, First Trust Multi Cap GrowthAlphaDEX Fund 1, First Trust Multi Cap Value AlphaDEX Fund 1, First Trust NASDAQ-100 Equal Weight Index Fund 1,First Trust NASDAQ-100 Ex-Technology Sector Index Fund 1, First Trust NASDAQ-100-Technology Index Fund 1, First TrustNASDAQ ABA Community Bank Index Fund 1, First Trust NASDAQ CEA Smartphone Index 1, First Trust NASDAQ CleanEdge Green Energy Index Fund 1, First Trust NASDAQ Clean Edge Smart Grid Infrastructure Index Fund 1, First TrustNASDAQ Global Auto Index Fund 1, First Trust NASDAQ Technology Dividend Index Fund 1, First Trust North AmericanEnergy Infrastructure Fund 1, First Trust NYSE Arca Biotechnology Index Fund 1, First Trust Preferred Securities and IncomeETF 1, First Trust S&P REIT Index Fund 1, First Trust Small Cap Core AlphaDEX Fund 1, First Trust Small Cap GrowthAlphaDEX 1, First Trust Small Cap Value AlphaDEX 1, First Trust STOXX European Select Dividend Index Fund 1, First TrustSwitzerland AlphaDEX Fund 1, First Trust Technology AlphaDEX Fund 1, First Trust United Kingdom AlphaDEX Fund 1,First Trust US IPO Index Fund 1, First Trust Utilities AlphaDEX Fund 1, First Trust Value Line 100 ETF 1, First Trust ValueLine Dividend Index Fund 1, FlexShares iBoxx 3-Year Target Duration TIPS Index Fund 1, FlexShares iBoxx 5-Year TargetDuration TIPS Index Fund 1, FlexShares International Quality Dividend Defensive Index Fund 1, FlexShares InternationalQuality Dividend Dynamic Index Fund 1, FlexShares International Quality Dividend Index Fund 1, FlexShares MorningstarDeveloped Markets ex-US Factor Tilt Index Fund 1, 2, FlexShares Morningstar Emerging Markets Factor Tilt Index Fund1, 2, FlexShares Morningstar US Market Factors Tilt Index Fund 1, 2, FlexShares Quality Dividend Defensive Index Fund1, FlexShares Quality Dividend Dynamic Index Fund 1, FlexShares Quality Dividend Index Fund 1, FlexShares Ready AccessVariable Income Fund 1, Global X China Consumer ETF 1, Global X China Financials ETF 1, Global X Copper Miners ETF 1,Global X FTSE Greece 20 ETF 1, Global X FTSE Nordic Region ETF 1, Global X Guru. Index ETF 1, Global X Lithium ETF 1,Global X MLP ETF 1, Global X MSCI Colombia 1, Global X MSCI Norway ETF 1, Global X NASDAQ China Technology ETF1, Global X Silver Miners ETF 1, Global X Social Media Index ETF 1, Global X SuperDividend. ETF 1, Global X SuperIncome.Preferred ETF 1, Global X Uranium ETF 1, GreenHaven Continuous Commodity Index Trust 1, Guggenheim BRIC ETF1, Guggenheim BulletShares 2018 Corporate Bond ETF 1, Guggenheim BulletShares 2018 High Yield Corporate BondETF 1, Guggenheim BulletShares 2019 Corporate Bond ETF 1, Guggenheim BulletShares 2020 Corporate Bond ETF 1,Guggenheim BulletShares 2022 Corporate Bond ETF 1, Guggenheim Canadian Energy Income ETF 1, Guggenheim ChinaAll-Cap ETF 1, Guggenheim China Real Estate ETF 1, Guggenheim China Small Cap ETF 1, Guggenheim China TechnologyETF 1, Guggenheim Defensive Equity ETF 1, Guggenheim Enhanced Short Duration ETF 1, Guggenheim Frontier MarketsETF 1, Guggenheim Insider Sentiment ETF 1, Guggenheim International Multi-Asset Income ETF 1, Guggenheim Mid-Cap Core ETF 1, Guggenheim MSCI Emerging Markets Equal Weight ETF 1, Guggenheim Multi-Asset Income ETF 1,Guggenheim Raymond James SB-1 Equity ETF 1, Guggenheim Russell Top 50.Mega Cap ETF 1, Guggenheim S&P 500.
Exchange-traded funds
UBS Chief Investment Office Americas, Wealth Management 1 November 2018 33

Appendix
Equal Weight Consumer Discretionary ETF 1, Guggenheim S&P 500. Equal Weight Consumer Staples ETF 1, GuggenheimS&P 500. Equal Weight Energy ETF 1, Guggenheim S&P 500. Equal Weight ETF 1, Guggenheim S&P 500. Equal WeightFinancials ETF 1, Guggenheim S&P 500. Equal Weight Healthcare ETF 1, Guggenheim S&P 500. Equal Weight IndustrialsETF 1, Guggenheim S&P 500. Equal Weight Materials ETF 1, Guggenheim S&P 500. Equal Weight Technology ETF 1,Guggenheim S&P 500. Equal Weight Utilities ETF 1, Guggenheim S&P 500.Pure Growth ETF 1, Guggenheim S&P 500.PureValue ETF 1, Guggenheim S&P Global Dividend Opportunities Index ETF 1, Guggenheim S&P MidCap 400.Pure GrowthETF 1, Guggenheim S&P MidCap 400.Pure Value ETF 1, Guggenheim S&P SmallCap 600.Pure Growth ETF 1, GuggenheimS&P SmallCap 600.Pure Value ETF 1, Guggenheim Shipping ETF 1, Guggenheim Solar ETF 1, Guggenheim Spin-Off ETF1, Guggenheim Timber ETF 1, Health Care Select Sector SPDR. Fund 1, Horizons S&P 500. Covered Call ETF 1, IndustrialSelect Sector SPDR. Fund 1, IQ U.S. Real Estate Small Cap ETF 1, iShares 0-5 Year TIPS Bond ETF 1, iShares 10+ Year CreditBond ETF 1, iShares 10-20 Year Treasury Bond ETF 1, iShares 1-3 Year Credit Bond ETF 1, iShares 1-3 Year InternationalTreasury Bond ETF 1, iShares 1-3 Year Treasury Bond ETF 1, 3, iShares 20+ Year Treasury Bond ETF 1, 3, 5, iShares 3-7Year Treasury Bond ETF 1, iShares 7-10 Year Treasury Bond ETF 1, 3, iShares Aaa - A Rated Corporate Bond ETF 1, iSharesAgency Bond ETF 1, iShares Asia/Pacific Dividend ETF 1, iShares Asia 50 ETF 1, iShares California AMT-Free Muni BondETF 1, iShares China Large-Cap ETF 1, 2, 3, 5, iShares CMBS ETF 1, iShares Core GNMA Bond ETF 1, iShares Core HighDividend ETF 1, 2, iShares Core MSCI EAFE ETF 2, iShares Core MSCI Emerging Market ETF 1, 2, iShares Core MSCI TotalInternational Stock ETF 1, 2, 9, iShares Core S&P 500 ETF 1, iShares Core S&P Mid-Cap ETF 1, 2, iShares Core S&P Small-Cap ETF 1, iShares Core S&P Total U.S. Stock Market ETF 1, 8, iShares Core U.S. Aggregate Bond ETF 1, iShares CoreUS Growth ETF 1, iShares Core US Value ETF 1, iShares Dow Jones U.S. ETF 1, iShares Emerging Markets Dividend ETF1, iShares Emerging Markets Infrastructure ETF 1, iShares Emerging Markets Local Currency Bond ETF 1, iShares EuropeDeveloped Real Estate ETF 1, 2, iShares Europe ETF 1, 2, iShares Global 100 ETF 1, 2, iShares Global Clean Energy ETF1, iShares Global Consumer Discretionary ETF 1, iShares Global Consumer Staples ETF 1, iShares Global Energy ETF 1,2, iShares Global Financials ETF 1, iShares Global Healthcare ETF 1, 2, iShares Global Industrials ETF 1, iShares GlobalInfrastructure ETF 1, 2, iShares Global Materials ETF 1, iShares Global Tech ETF 1, 2, iShares Global Telecom ETF 1, 2,iShares Global Timber & Forestry ETF 1, iShares Global Utilities ETF 1, iShares Gold Trust 1, iShares Government/CreditBond ETF 1, iShares iBoxx $ High Yield Corporate Bond ETF 1, 3, iShares iBoxx $ Investment Grade Corporate Bond ETF1, iShares India 50 ETF 1, iShares Intermediate Credit Bond ETF 1, iShares International Developed Property ETF 1, iSharesInternational Developed Real Estate ETF 1, iShares International Select Dividend ETF 2, iShares International Treasury BondETF 1, iShares J.P. Morgan USD Emerging Markets Bond ETF 1, 2, 3, iShares Latin America 40 ETF 1, iShares MBS ETF1, iShares Micro-Cap ETF 1, iShares Morningstar Large-Cap ETF 1, iShares Morningstar Large-Cap Growth ETF 1, iSharesMorningstar Large-Cap Value ETF 1, iShares Morningstar Mid-Cap ETF 1, iShares Morningstar Mid-Cap Growth ETF 1,iShares Morningstar Mid-Cap Value ETF 1, iShares Morningstar Small-Cap ETF 1, iShares Morningstar Small-Cap GrowthETF 1, iShares Morningstar Small-Cap Value ETF 1, iShares MSCI ACWI ETF 1, 3, iShares MSCI ACWI ex U.S. ETF 1, iSharesMSCI All Country Asia ex Japan ETF 1, iShares MSCI All Country World Minimum Volatility ETF 2, iShares MSCI All PeruCapped ETF 1, iShares MSCI Australia ETF 1, 2, iShares MSCI Austria Capped ETF 1, 2, iShares MSCI Belgium CappedETF 1, iShares MSCI Brazil Capped ETF 1, 5, iShares MSCI Brazil Small-Cap ETF 1, iShares MSCI BRIC ETF 1, iShares MSCICanada ETF 1, 2, iShares MSCI China ETF 1, 2, iShares MSCI China Small-Cap ETF 1, iShares MSCI EAFE ETF 1, iSharesMSCI EAFE Growth ETF 2, iShares MSCI EAFE Small-Cap ETF 1, iShares MSCI EAFE Value ETF 2, iShares MSCI EmergingMarkets Asia ETF 1, iShares MSCI Emerging Markets ETF 1, 5, iShares MSCI Emerging Markets Small-Cap ETF 1, iSharesMSCI Europe Financials ETF 1, 2, iShares MSCI France ETF 1, iShares MSCI Frontier 100 ETF 1, 2, iShares MSCI GermanyETF 1, 2, iShares MSCI Global Agriculture Producers ETF 1, iShares MSCI Global Gold Miners ETF 1, 2, iShares MSCIGlobal Silver Miners ETF 2, iShares MSCI Hong Kong ETF 1, 2, iShares MSCI Indonesia ETF 1, iShares MSCI Ireland CappedETF 1, iShares MSCI Israel Capped ETF 1, iShares MSCI Italy Capped ETF 1, iShares MSCI Japan ETF 1, 3, iShares MSCIJapan Small-Cap ETF 1, iShares MSCI KLD 400 Social ETF 1, iShares MSCI Kokusai ETF 1, iShares MSCI Malaysia ETF 1,iShares MSCI Mexico Capped ETF 1, iShares MSCI Netherlands ETF 1, iShares MSCI New Zealand Capped ETF 1, iSharesMSCI Pacific ex-Japan Fund 1, 2, iShares MSCI Philippines ETF 1, iShares MSCI Poland Capped ETF 1, iShares MSCI RussiaCapped ETF 1, iShares MSCI Singapore ETF 1, 2, iShares MSCI South Africa ETF 1, iShares MSCI South Korea Capped ETF1, iShares MSCI Spain Capped ETF 1, 2, iShares MSCI Sweden ETF 1, iShares MSCI Switzerland Capped Index Fund 2,iShares MSCI Taiwan ETF 1, iShares MSCI Thailand Capped ETF 1, iShares MSCI United Kingdom ETF 1, iShares MSCI USASize Factor ETF 1, iShares MSCI World ETF 1, 2, iShares Nasdaq Biotechnology ETF 1, iShares National AMT-Free MuniBond ETF 1, iShares New York AMT-Free Muni Bond ETF 1, iShares North American Tech ETF 1, iShares North AmericanTech-Multimedia Networking ETF 1, iShares PHLX Semiconductor ETF 1, iShares Residential Real Estate Capped ETF 1,iShares Russell 1000 ETF 1, 2, iShares Russell 1000 Growth ETF 1, iShares Russell 1000 Value ETF 1, iShares Russell 2000
Exchange-traded funds
UBS Chief Investment Office Americas, Wealth Management 1 November 2018 34

Appendix
ETF 1, 3, 5, iShares Russell 2000 Growth ETF 1, iShares Russell 2000 Value ETF 1, iShares Russell 3000 ETF 1, iSharesRussell Mid-Cap ETF 1, iShares Russell Mid-Cap Growth ETF 1, iShares Russell Mid-Cap Value ETF 1, iShares Russell Top200 ETF 1, iShares Russell Top 200 Growth ETF 1, iShares Russell Top 200 Value ETF 1, iShares S&P 100 ETF 1, iShares S&P500 Growth ETF 1, iShares S&P 500 Value ETF 1, iShares S&P GSCI Commodity-Indexed Trust 1, iShares S&P MidCap 400Growth ETF 1, iShares S&P Mid-Cap 400 Value ETF 1, iShares S&P Small-Cap 600 Growth ETF 1, iShares S&P SmallCap600 Value Index Fund 1, iShares Select Dividend ETF 1, 2, iShares Short-Term National AMT-Free Muni Bond ETF 1, iSharesShort Treasury Bond ETF 1, iShares Silver Trust 1, 5, iShares TIPS Bond ETF 1, iShares U.S. Basic Materials ETF 1, iSharesU.S. Broker-Dealers ETF 1, iShares U.S. Consumer Goods ETF 1, iShares U.S. Consumer Services ETF 1, iShares U.S. EnergyETF 1, iShares U.S. Financial Services ETF 1, iShares U.S. Financials ETF 1, iShares U.S. Healthcare ETF 1, iShares U.S.Healthcare Providers ETF 1, iShares U.S. Insurance ETF 1, iShares U.S. Medical Devices ETF 1, iShares U.S. Oil Equipment& Services ETF 1, iShares U.S. Pharmaceuticals ETF 1, iShares U.S. Preferred Stock ETF 1, iShares U.S. Real Estate ETF 1,5, iShares U.S. Regional Banks ETF 1, iShares U.S. Technology ETF 1, iShares U.S. Utilities ETF 1, Market Vectors AfricaIndex ETF 1, Market Vectors Agribusiness Index ETF 1, Market Vectors BDC Income ETF 1, Market Vectors Brazil Small-Cap ETF 1, Market Vectors ChinaAMC A-Share ETF 1, Market Vectors Coal Index ETF 1, Market Vectors Egypt Index ETF 1,Market Vectors Environmental Services ETF 1, Market Vectors Fallen Angel High Yield Bond ETF 1, Market Vectors GamingIndex ETF 1, Market Vectors Global Alternative Energy ETF 1, Market Vectors Gold Miners Index ETF 1, 5, Market VectorsIndia Small-Cap Index ETF 1, Market Vectors Indonesia Index ETF 1, Market Vectors Intl High Yield Bond ETF 1, MarketVectors Israel ETF 1, Market Vectors Junior Gold Miners ETF 1, Market Vectors Long Municipal Index ETF 1, Market VectorsMortgage REIT ETF 1, Market Vectors Natural Resources ETF 1, Market Vectors Poland ETF 1, Market Vectors PreferredSecurities ex Financials ETF 1, Market Vectors Pre-Refunded Municipal Index ETF 1, Market Vectors Rare Earth/StrategicMetals ETF 1, Market Vectors Retail ETF 1, Market Vectors Russia Index ETF 1, Market Vectors Steel Index ETF 1, MarketVectors Unconventional Oil & Gas ETF 1, Market Vectors Uranium+Nuclear Energy Index ETF 1, Market Vectors VietnamETF 1, Materials Select Sector SPDR. Fund 1, PIMCO 0-5 Year High Yield Corporate Bond Index ETF 1, 2, PIMCO 1-3Year U.S. Treasury Index ETF 1, 2, PIMCO 15+ Year US TIPS Index ETF 1, PIMCO 1-5 Year US TIPS Index ETF 1, 2, PIMCO25+ Year Zero Coupon U.S. Treasury Index ETF 1, PIMCO Broad U.S. TIPS Index ETF 1, PIMCO Enhanced Short MaturityExchange-Traded Fund 1, 2, PIMCO Intermediate Municipal Bond Exchange-Traded Fund 1, PIMCO Investment GradeCorporate Bond Index ETF 1, 2, PIMCO Short Term Municipal Bond Exchange-Traded Fund 1, PIMCO Total Return ETF1, 2, PowerShares 1-30 Laddered Treasury Portfolio 1, PowerShares Aerospace & Defense Portfolio 1, PowerShares BuildAmerica Bond Portfolio 1, PowerShares Buyback Achievers Portfolio 1, PowerShares California AMT-Free Municipal BondPortfolio 1, PowerShares CEF Income Composite Portfolio 1, PowerShares Chinese Yuan Dim Sum Bond 1, PowerSharesCleantech Portfolio 1, PowerShares DB Agriculture Trust 1, PowerShares DB Base Metals Trust 1, PowerShares DBCommodity Index Tracking Trust 1, PowerShares DB Energy Trust 1, PowerShares DB G10 Currency Harvest Trust 1,PowerShares DB Gold Trust 1, PowerShares DB Oil Trust 1, PowerShares DB Precious Metals Trust 1, PowerShares DB SilverTrust 1, PowerShares DB US Dollar Index Bearish Trust 1, PowerShares DB US Dollar Index Bullish Trust 1, PowerSharesDividend Achievers. Portfolio 1, PowerShares DWA Basic Materials Momentum Portfolio 1, PowerShares DWA ConsumerCyclicals Momentum Portfolio 1, PowerShares DWA Consumer Staples Momentum Portfolio 1, PowerShares DWAEmerging Markets Momentum Portfolio 1, PowerShares DWA Energy Momentum Portfolio 1, PowerShares DWA FinancialMomentum Portfolio 1, PowerShares DWA Healthcare Momentum Portfolio 1, PowerShares DWA Momentum Portfolio 1,PowerShares DWA NASDAQ Momentum Portfolio 1, PowerShares DWA SmallCap Momentum Portfolio 1, PowerSharesDWA Technology Momentum Portfolio 1, PowerShares DWA Utilities Momentum Portfolio 1, PowerShares DynamicBiotech & Genome Portfolio 1, PowerShares Dynamic Building & Construction Portfolio 1, PowerShares Dynamic EnergyExploration & Production Portfolio 1, PowerShares Dynamic Food & Beverage Portfolio 1, PowerShares Dynamic Large CapGrowth Portfolio 1, PowerShares Dynamic Large Cap Value Portfolio 1, PowerShares Dynamic Leisure & EntertainmentPortfolio 1, PowerShares Dynamic Market Portfolio 1, PowerShares Dynamic Media Portfolio 1, PowerShares DynamicNetworking Portfolio 1, PowerShares Dynamic Oil & Gas Services Portfolio 1, PowerShares Dynamic PharmaceuticalsPortfolio 1, PowerShares Dynamic Retail Portfolio 1, PowerShares Dynamic Semiconductors Portfolio 1, PowerSharesDynamic Software Portfolio 1, PowerShares Emerging Markets Infrastructure Portfolio 1, PowerShares Emerging MarketsSovereign Debt Portfolio 1, PowerShares Financial Preferred Portfolio 1, PowerShares FTSE RAFI Asia Pacific ex-JapanPortfolio 1, PowerShares FTSE RAFI Developed Markets ex-US Portfolio 1, PowerShares FTSE RAFI Developed Marketsex-US Small-Mid Portfolio 1, PowerShares FTSE RAFI Emerging Markets Portfolio 1, PowerShares FTSE RAFI US 1000Portfolio 1, PowerShares FTSE RAFI US 1500 Small-Mid Portfolio 1, PowerShares Fundamental High Yield CorporateBond Portfolio 1, PowerShares Global Agriculture Portfolio 1, PowerShares Global Clean Energy Portfolio 1, PowerSharesGlobal Gold & Precious Metals Portfolio 1, PowerShares Global Listed Private Equity Portfolio 1, PowerShares Global Water
Exchange-traded funds
UBS Chief Investment Office Americas, Wealth Management 1 November 2018 35

Appendix
Portfolio 1, PowerShares Golden Dragon China Portfolio 1, PowerShares High Yield Equity Dividend Achievers. Portfolio 1,PowerShares India Portfolio 1, PowerShares International Corporate Bond Portfolio 1, PowerShares International DividendAchievers Portfolio 1, PowerShares KBW Bank Portfolio 1, PowerShares KBW High Dividend Yield Financial Portfolio 1,PowerShares KBW Premium Yield Equity REIT Portfolio 1, PowerShares KBW Property & Casuality Insurance Portfolio 1,PowerShares KBW Regional Banking Porfolio 1, PowerShares NASDAQ Internet Portfolio 1, PowerShares National AMT-Free Municipal Bond Portfolio 1, PowerShares New York AMT_Free Municipal Bond Portfolio 1, PowerShares PreferredPortfolio 1, PowerShares QQQ Trust, Series 1 1, 3, PowerShares S&P 500. High Beta Portfolio 1, PowerShares S&P 500. LowVolatility 1, PowerShares S&P 500 BuyWrite Portfolio 1, PowerShares S&P 500 Downside Hedged Portfolio 1, PowerSharesS&P 500 High Quality Portfolio 1, PowerShares S&P Emerging Markets Low Volatility Portfolio 1, PowerShares S&PInternational Developed Low Volatility Portfolio 1, PowerShares S&P MidCap Low Volatility Portfolio 1, PowerShares S&PSmallCap Consumer Discretionary Portfolio 1, PowerShares S&P SmallCap Consumer Staples Portfolio 1, PowerShares S&PSmallCap Energy Portfolio 1, PowerShares S&P SmallCap Financials Portfolio 1, PowerShares S&P SmallCap Health CarePortfolio 1, PowerShares S&P SmallCap Information Technology Portfolio 1, PowerShares S&P SmallCap Low Volatility1, PowerShares S&P SmallCap Materials Portfolio 1, PowerShares S&P SmallCap Utilities Portfolio 1, PowerShares SeniorLoan Portfolio 1, PowerShares VRDO Tax-Free Weekly Portfolio 1, PowerShares Water Resources Portfolio 1, PowerSharesWilderHill Clean Energy Portfolio 1, PowerShares WilderHill Progressive Energy Portfolio 1, PowerShares Zacks Micro CapPortfolio 1, RevenueShares Financials Sector Fund 1, RevenueShares Large Cap Fund 1, RevenueShares Mid Cap Fund 1,RevenueShares Small Cap Fund 1, Schwab Emerging Markets Equity ETF. 1, Schwab Intermediate-Term U.S. Treasury ETF.1, Schwab International Equity ETF. 1, Schwab International Small-Cap Equity ETF. 1, Schwab Short-Term U.S. Treasury ETF.1, Schwab U.S. Aggregate Bond ETF. 1, Schwab U.S. Broad Market ETF. 1, Schwab U.S. Dividend Equity ETF. 1, SchwabU.S. Large-Cap Growth ETF. 1, Schwab U.S. Large-Cap Value ETF. 1, Schwab U.S. Mid-Cap ETF. 1, Schwab U.S. Small-Cap ETF. 1, Schwab U.S. TIPS ETF. 1, Schwab US REIT ETF. 1, SPDR. Blackstone/GSO Senior Loan ETF 1, SPDR Barclays1-3 Month T-Bill ETF 1, SPDR Barclays High Yield Bond ETF 1, SPDR Barclays Intermediate Term Treasury ETF 1, SPDRBarclays International Corporate Bond ETF 1, SPDR Barclays International Treasury Bond ETF 1, 2, SPDR Barclays MortgageBacked Bond ETF 1, SPDR Barclays TIPS ETF 1, 3, SPDR BofA Merrill Lynch Crossover Corporate Bond ETF 1, SPDR DBInternational Government Inflation-Protected Bond ETF 1, 2, SPDR Dow Jones Global Real Estate ETF 1, 2, SPDR DowJones Industrial Average ETF 1, 2, 3, SPDR Dow Jones International Real Estate ETF 1, 2, SPDR Dow Jones REIT ETF 1,SPDR EURO STOXX 50 1, SPDR Global Dow ETF 1, 2, SPDR MSCI ACWI (ex-US) ETF 1, 2, 3, SPDR MSCI ACWI IMI ETF1, 2, SPDR Nuveen Barclays Capital Municipal Bond ETF 1, SPDR Nuveen S&P High Yield Municipal Bond ETF 1, SPDRPortfolio Intermediate Term Corporate Bond ETF 1, SPDR Portfolio Short Term Corporate Bond ETF 1, SPDR Russell 1000Low Volatility ETF 1, SPDR Russell 2000 Low Volatility ETF 1, SPDR S&P 400 Mid Cap Growth ETF 1, SPDR S&P 400 MidCap Value ETF 1, SPDR S&P 500 ETF 1, 3, SPDR S&P 500 Growth ETF 1, SPDR S&P 500 Value ETF 1, SPDR S&P 600 SmallCap ETF 1, SPDR S&P 600 Small Cap Growth ETF 1, SPDR S&P 600 Small Cap Value ETF 1, SPDR S&P Aerospace & DefenseETF 1, SPDR S&P Bank ETF 1, SPDR S&P Biotech ETF 1, SPDR S&P Capital Markets ETF 1, SPDR S&P China ETF 1, 2, 3,SPDR S&P Dividend ETF 1, 3, SPDR S&P Emerging Asia Pacific ETF 1, 3, SPDR S&P Emerging Markets Dividend 1, 2, SPDRS&P Emerging Markets Small Cap ETF 1, SPDR S&P Global Dividend ETF 1, 2, SPDR S&P Global Infrastructure ETF 1, 2,SPDR S&P Global Natural Resources ETF 1, 2, SPDR S&P Health Care Equipment ETF 1, SPDR S&P Health Care ServicesETF 1, SPDR S&P Homebuilders ETF 1, SPDR S&P Insurance ETF 1, SPDR S&P International Dividend ETF 1, 2, 3, SPDR S&PInternational Small Cap ETF 1, 2, 3, SPDR S&P Metals & Mining ETF 1, 3, SPDR S&P MidCap 400 ETF 1, SPDR S&P Oil &Gas Equipment & Services ETF 1, 3, SPDR S&P Oil & Gas Exploration & Production ETF 1, 3, 5, SPDR S&P PharmaceuticalsETF 1, 3, SPDR S&P Regional Banking ETF 1, SPDR S&P Retail ETF 1, 3, 5, SPDR S&P Semiconductor ETF 1, SPDR S&PSoftware & Services ETF 1, SPDR S&P Telecom ETF 1, SPDR S&P Transportation ETF 1, SPDR SSGA Gender Diversity IndexETF 1, SPDR SSgA Global Allocation ETF 1, SPDR SSgA Income Allocation ETF 1, SPDR SSgA Multi-Asset Real Return ETF1, SPDR STOXX Europe 50 1, 2, SPDR Wells Fargo Preferred Stock ETF 1, Technology Select Sector SPDR. Fund 1, TeucriumCorn Fund 1, United States 12 Month Natural Gas Fund, LP 1, United States 12 Month Oil Fund, LP 1, United StatesBrent Oil Fund, LP 1, United States Commodity Index Fund, LP 1, United States Gasoline Fund, LP 1, Utilities Select SectorSPDR. Fund 1, 5, Vanguard Consumer Discretionary ETF 1, Vanguard Consumer Staples ETF 1, Vanguard Energy ETF 1,Vanguard Extended Duration Treasury Index ETF 1, Vanguard Extended Market Index ETF 1, Vanguard Financials ETF 1,Vanguard FTSE All-World ex-US ETF 1, Vanguard FTSE Developed Markets ETF 1, Vanguard FTSE Emerging Markets ETF1, Vanguard FTSE Europe ETF 1, Vanguard FTSE Pacific ETF 1, 2, Vanguard Growth ETF 1, Vanguard Health Care ETF 1,Vanguard High Dividend Yield Index ETF 1, Vanguard Industrials ETF 1, Vanguard Information Technology ETF 1, VanguardIntermediate-Term Corporate Bond ETF 1, Vanguard Intermediate-Term Government Bond ETF 1, Vanguard Long-TermCorporate Bond ETF 1, Vanguard Long-Term Government Bond ETF 1, Vanguard Materials ETF 1, Vanguard Mega Cap
Exchange-traded funds
UBS Chief Investment Office Americas, Wealth Management 1 November 2018 36

Appendix
ETF 1, Vanguard Mid-Cap Growth ETF 1, Vanguard Mid-Cap Value ETF 1, Vanguard Mortgage-Backed Securities ETF 1,Vanguard S&P 500 ETF 1, 2, Vanguard Short-Term Bond ETF 1, Vanguard Short-Term Corporate Bond ETF 1, VanguardShort-Term Government Bond ETF 1, Vanguard Telecommunication Services ETF 1, Vanguard Total International Bond ETF1, Vanguard Total International Stock ETF 1, Vanguard Total Stock Market ETF 1, 4, 11; Vanguard Total World Stock IndexETF 1, 2, 4, 10, Vanguard Utilities ETF 1, Vanguard Value ETF 1, WisdomTree Asia Local Debt Fund 1, 2, WisdomTreeAsia-Pacific ex-Japan Fund 1, 2, WisdomTree Australia Dividend Fund 1, 2, WisdomTree Brazilian Real Strategy Fund 1,2, WisdomTree Chinese Yuan Strategy Fund 1, 2, WisdomTree Dividend ex-Financials Fund 1, WisdomTree Earnings 500Fund 1, WisdomTree Emerging Currency Strategy Fund 1, 2, WisdomTree Emerging Markets Corporate Bond Fund 1,WisdomTree Emerging Markets Equity Income Fund 1, 2, 4, 7, WisdomTree Emerging Markets Local Debt Fund 1, 2,WisdomTree Emerging Markets Small Cap Dividend Fund 1, WisdomTree Europe Hedged Equity Fund 1, 2, WisdomTreeEurope SmallCap Dividend Fund 1, 2, WisdomTree Global ex-US Real Estate Fund 1, 2, WisdomTree India Earnings Fund1, WisdomTree International Dividend ex-Financials Fund 1, WisdomTree International LargeCap Dividend Fund 1, 2,WisdomTree International MidCap Dividend Fund 1, WisdomTree International SmallCap Dividend Fund 1, WisdomTreeJapan Hedged Equity Fund 1, 2, WisdomTree Japan SmallCap Dividend Fund 1, WisdomTree LargeCap Dividend Fund 1,WisdomTree LargeCap Value Fund 1, WisdomTree Managed Futures Strategy Fund 1, 2, WisdomTree MidCap DividendFund 1, WisdomTree MidCap Earnings Fund 1, WisdomTree Middle East Dividend Fund 1, WisdomTree SmallCap DividendFund 1, WisdomTree SmallCap Earnings Fund 1, WisdomTree Total Dividend Fund 1, WisdomTree Total Earnings Fund 1,
1. UBS Securities LLC makes a market in the securities and/or ADRs of this company.2. Within the past 12 months, UBS Securities LLC and/or its affiliates have received compensation for products andservices other than investment banking services from this company/entity.3. UBS AG, its affiliates or subsidiaries held other significant financial interests in this company/entity as of last month'send (or the prior month's end if this report is dated less than 10 working days after the most recent month's end).4. The equity analyst covering this company, a member of his or her team, or one of their household members has along common stock position in this company.5. UBS AG, its affiliates or subsidiaries beneficially owned 1% or more of a class of this company's common equitysecurities as of last month's end (or the prior month's end if this report is dated less than 10 days after the most recentmonth's end).6. UBS Limited acts as broker to this company.7. David Perlman, or one of his/her household members has a long common stock position in WisdomTree EmergingMarkets Equity Income Fund.8. David Perlman, or one of his/her household members has a long common stock position in iShares Core S&P TotalU.S. Stock Market ETF.9. David Perlman, or one of his/her household members has a long common stock position in iShares Core MSCI TotalInternational Stock ETF.10. David Perlman, or one of his/her household members has a long common stock position in Vanguard Total WorldStock Index ETF.11. David Perlman, or one of his/her household members has a long common stock position in Vanguard Total StockMarket ETF.
Exchange-traded funds
UBS Chief Investment Office Americas, Wealth Management 1 November 2018 37

Appendix
Disclaimer
In certain countries UBS AG is referred to as UBS SA. This publication is for our clients’ information only and is notintended as an offer, or a solicitation of an offer, to buy or sell any investment or other specific product. It does notconstitute a personal recommendation or take into account the particular investment objectives, financial situation andneeds of any specific recipient. We recommend that recipients take financial and/or tax advice as to the implicationsof investing in any of the products mentioned herein. We do not provide tax advice. The analysis contained herein isbased on numerous assumptions. Different assumptions could result in materially different results. Other than disclosuresrelating to UBS AG, its subsidiaries and affiliates, all information expressed in this document were obtained from sourcesbelieved to be reliable and in good faith, but no representation or warranty, express or implied, is made as to its accuracyor completeness. All information and opinions are current only as of the date of this report, and are subject to changewithout notice. This publication is not intended to be a complete statement or summary of the securities, markets ordevelopments referred to in the report. Opinions may differ or be contrary to those expressed by other business areasor groups of UBS AG, its subsidiaries and affiliates. Research publications from Chief Investment Office Global WealthManagement (CIO GWM), formerly known as CIO Americas, Wealth Management, are written by UBS Global WealthManagement, a Business Division of UBS AG (UBS) or an affiliate thereof (collectively, UBS). UBS Investment Researchis written by UBS Investment Bank. Except for economic forecasts, the research process of CIO GWM is independentof UBS Investment Research. As a consequence research methodologies applied and assumptions made by CIO GWMand UBS Investment Research may differ, for example, in terms of investment horizon, model assumptions, and valuationmethods. Therefore investment recommendations independently provided by the two UBS research organizations canbe different. The analyst(s) responsible for the preparation of this report may interact with trading desk personnel, salespersonnel and other constituencies for the purpose of gathering, synthesizing and interpreting market information. Thecompensation of the analyst(s) who prepared this report is determined exclusively by research management and seniormanagement (not including investment banking). Analyst compensation is not based on investment banking, sales andtrading or principal trading revenues, however, compensation may relate to the revenues of UBS as a whole, of whichinvestment banking, sales and trading and principal trading are a part.UBS AG, its affiliates, subsidiaries and employees may trade as principal and buy and sell securities identified herein. Atany time, investment decisions (including whether to buy, sell or hold securities) made by UBS and its employees maydiffer from or be contrary to the opinions expressed in UBS research publications. Some investments may not be readilyrealizable since the market in the securities is illiquid and therefore valuing the investment and identifying the risk towhich you are exposed may be difficult to quantify. UBS relies on information barriers to control the flow of informationcontained in one or more areas within UBS, into other areas, units, groups or affiliates of UBS. Some investments maybe subject to sudden and large falls in value and on realization you may receive back less than you invested or maybe required to pay more. Changes in foreign currency exchange rates may have an adverse effect on the price, valueor income of an investment. Past performance of an investment is not a guide to its future performance. Additionalinformation will be made available upon request. This report is for distribution only under such circumstances as maybe permitted by applicable law. The securities described herein may not be eligible for sale in all jurisdictions or to allcategories of investors. Distributed to US persons by UBS Financial Services Inc. or UBS Securities LLC, subsidiaries of UBSAG. UBS Switzerland AG, UBS Deutschland AG, UBS Bank, S.A., UBS Brasil Administradora de Valores Mobiliarios Ltda,UBS Asesores Mexico, S.A. de C.V., UBS Securities Japan Co., Ltd, UBS Wealth Management Israel Ltd and UBS MenkulDegerler AS are affiliates of UBS AG. UBS Financial Services Incorporated of PuertoRico is a subsidiary of UBS FinancialServices Inc. UBS Financial Services Inc. accepts responsibility for the content of a report prepared by a non-US affiliatewhen it distributes reports to US persons. All transactions by a US person in the securities mentioned in this report shouldbe effected through a US-registered broker dealer affiliated with UBS, and not through a non-US affiliate. The contentsof this report have not been and will not be approved by any securities or investment authority in the United States orelsewhere. UBS Financial Services Inc. is not acting as a municipal advisor to any municipal entity or obligated personwithin the meaning of Section 15B of the Securities Exchange Act (the "Municipal Advisor Rule") and the opinions orviews contained herein are not intended to be, and do not constitute, advice within the meaning of the Municipal AdvisorRule. Version as per April 2018.
UBS specifically prohibits the redistribution or reproduction of this material in whole or in part without the prior writtenpermission of UBS. UBS accepts no liability whatsoever for any redistribution of this document or its contents by thirdparties.
© UBS 2018. The key symbol and UBS are among the registered and unregistered trademarks of UBS. All rights reserved.
Exchange-traded funds
UBS Chief Investment Office Americas, Wealth Management 1 November 2018 38