exchange rates and business cycles building blocks
TRANSCRIPT

Exchange Rates and Business Cycles
Building Blocks

Exchange Rates and Long Run
In long-run, relative PPP holds for countries at similar levels of development.
Long run exchange rate, eLR, given by long-run real exchange rate, ε, and money fundamentals.
Long run real exchange rate is given by level of economic development and competition in non-traded goods sector.
Exchange Rates in the Short-run
Real exchange rates are volatile in the short run and closely correlated with nominal exchange rates.
Under flexible exchange rates, nominal exchange rates tend to be more volatile than relative prices.
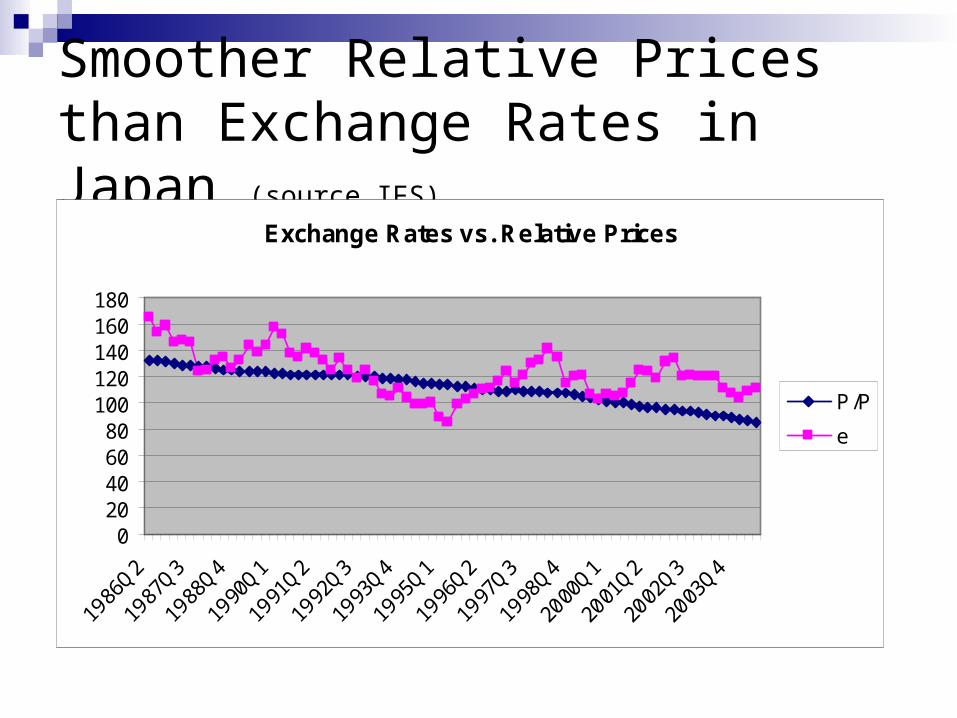
Smoother Relative Prices than Exchange Rates in Japan (source IFS)
Exchange Rates vs. Relative Prices
020406080
100120140160180
P/P
e
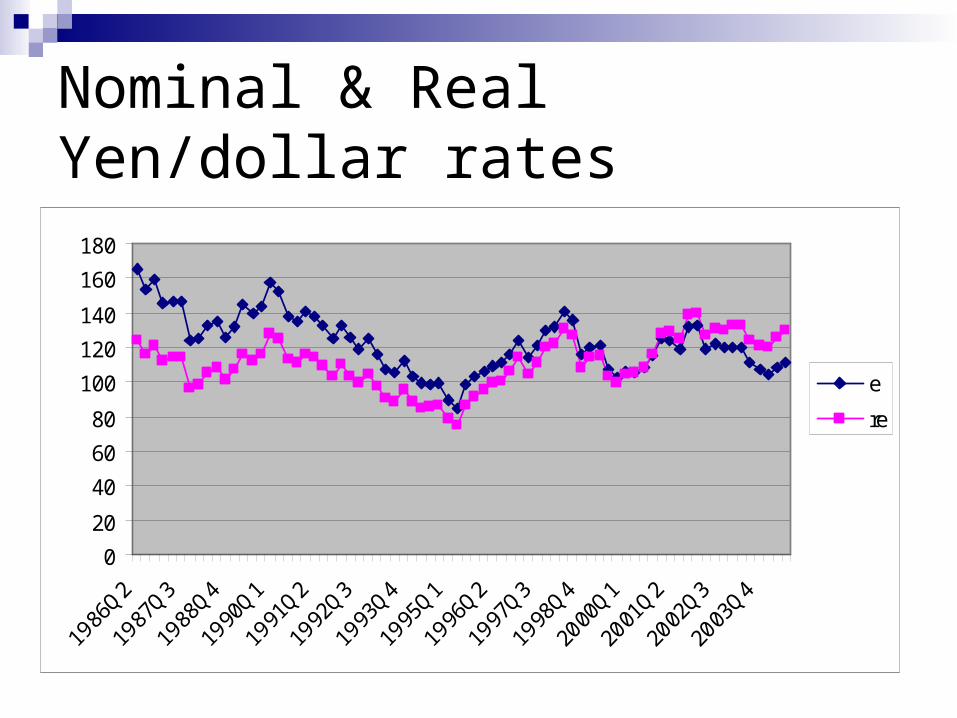
Nominal & Real Yen/dollar rates
0
20
40
60
80
100
120
140
160
180
e
re

Building Block 1:
Sticky Prices

Keynesian Explanation
Under the neo-classical dichotomy, goods markets works like an auction. Firms produce a fixed number of goods and demand will determine the price.
Under Keynesian theories, goods markets work like McDonalds. Firms post a certain price and produce as many goods as are demanded at that price.
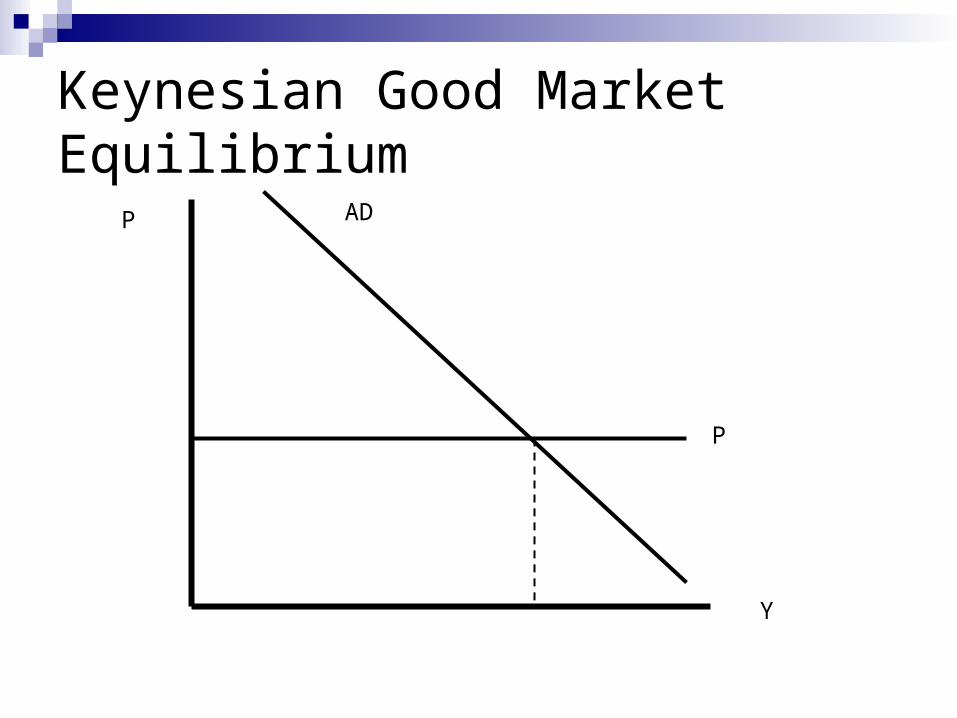
Keynesian Good Market Equilibrium
P
Y
P AD

Sticky Prices and Exchange Rates
Because prices are sticky in the short-run, changes in nominal exchange rates will necessarily change the relative prices of domestic and foreign goods.
Changes in money supply or velocity can translate into changes in both the nominal and real exchange rate.
Building Block 2:
Real Exchange Rates and the Current Account

Trade Balance At any point in time, there may be a gap in the
value of goods exported and the value of goods imported.
Measure the trade balance in domestic currency. Assume imported goods are invoiced in US dollars Value of exports, P∙ EX Value of imports, e∙ P∙ IM Value of trade balance or net exports, P∙ EX- e∙ P∙ IM
US USP EX e P IM e PNX EX IM EX re IM
P P
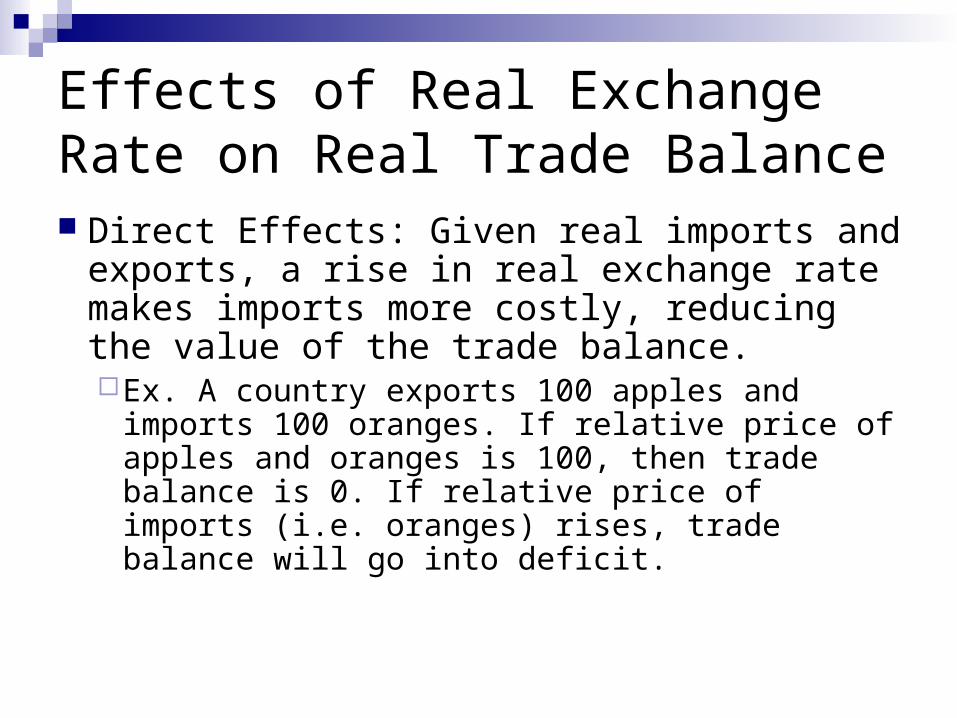
Effects of Real Exchange Rate on Real Trade Balance Direct Effects: Given real imports and
exports, a rise in real exchange rate makes imports more costly, reducing the value of the trade balance.Ex. A country exports 100 apples and imports
100 oranges. If relative price of apples and oranges is 100, then trade balance is 0. If relative price of imports (i.e. oranges) rises, trade balance will go into deficit.
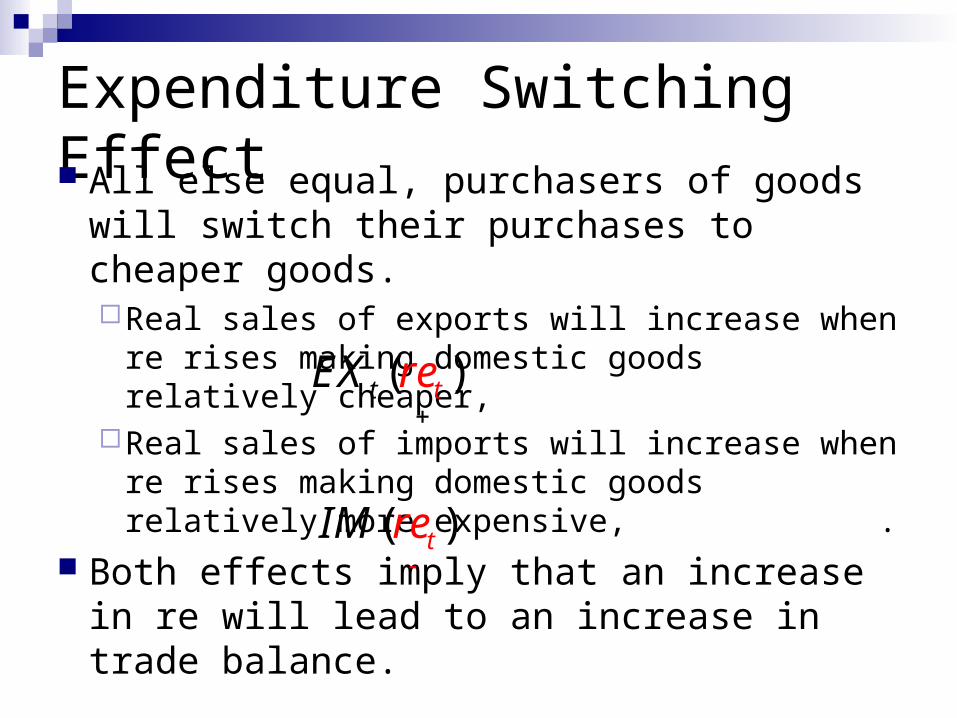
Expenditure Switching Effect All else equal, purchasers of goods will
switch their purchases to cheaper goods. Real sales of exports will increase when re
rises making domestic goods relatively cheaper,
Real sales of imports will increase when re rises making domestic goods relatively more expensive, .
Both effects imply that an increase in re will lead to an increase in trade balance.
( )tt reEX
( )tIM re
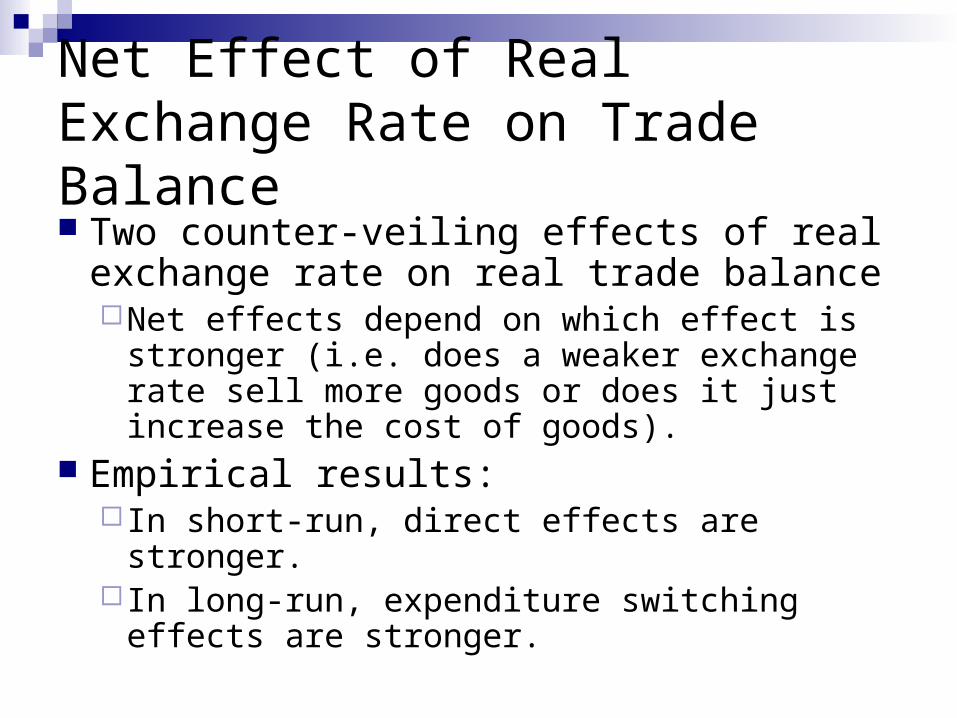
Net Effect of Real Exchange Rate on Trade Balance Two counter-veiling effects of real
exchange rate on real trade balanceNet effects depend on which effect is stronger
(i.e. does a weaker exchange rate sell more goods or does it just increase the cost of goods).
Empirical results: In short-run, direct effects are stronger. In long-run, expenditure switching effects are
stronger.

J Curve Dynamics: Effects of a once and for all real depreciation
time
re
NX
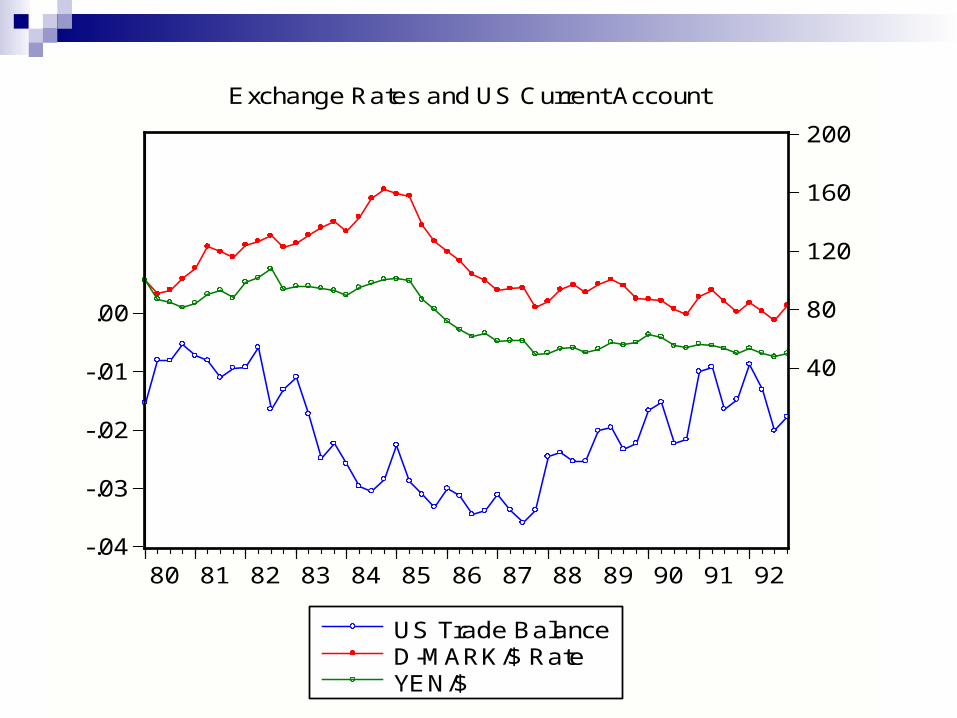
-.04
-.03
-.02
-.01
.00
40
80
120
160
200
80 81 82 83 84 85 86 87 88 89 90 91 92
US Trade BalanceD-MARK/$ RateYEN/$
Exchange Rates and US Current Account
Building Block 2:
International Interest Parity
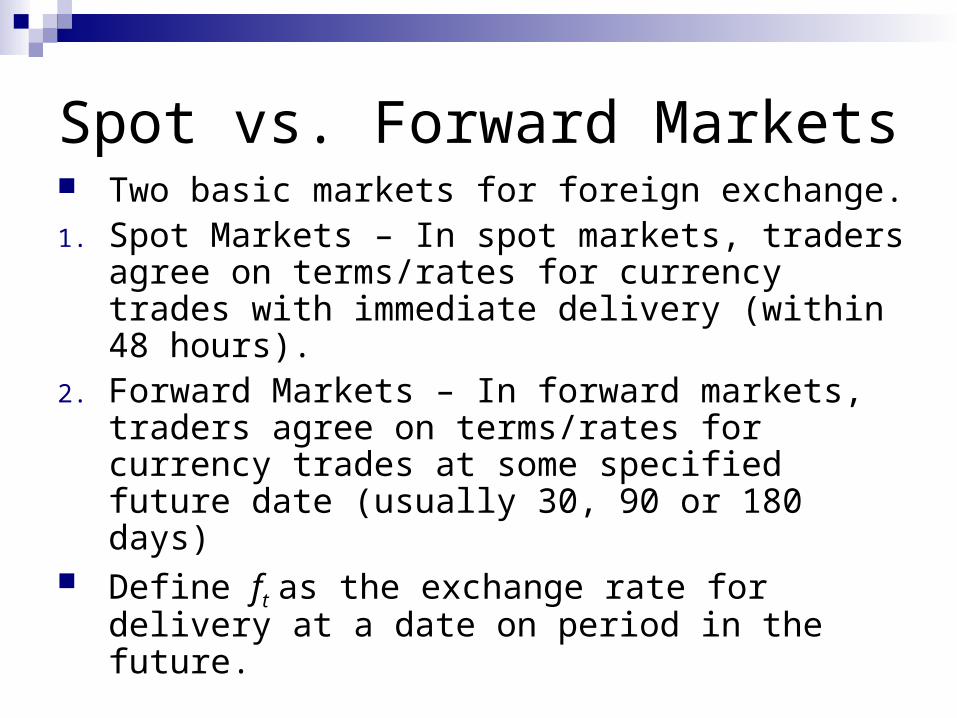
Spot vs. Forward Markets Two basic markets for foreign exchange.1. Spot Markets – In spot markets, traders
agree on terms/rates for currency trades with immediate delivery (within 48 hours).
2. Forward Markets – In forward markets, traders agree on terms/rates for currency trades at some specified future date (usually 30, 90 or 180 days)
Define ft as the exchange rate for delivery at a date on period in the future.
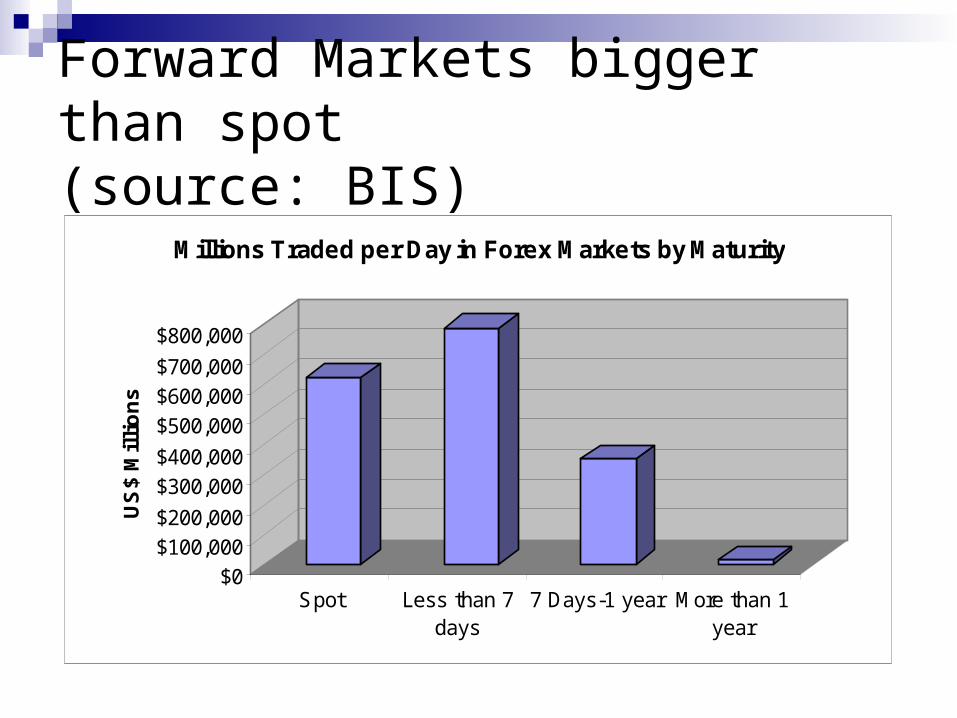
Forward Markets bigger than spot(source: BIS)
$0$100,000$200,000
$300,000$400,000
$500,000$600,000$700,000
$800,000
US
$ M
illi
on
s
Spot Less than 7days
7 Days-1 year More than 1year
Millions Traded per Day in Forex Markets by Maturity
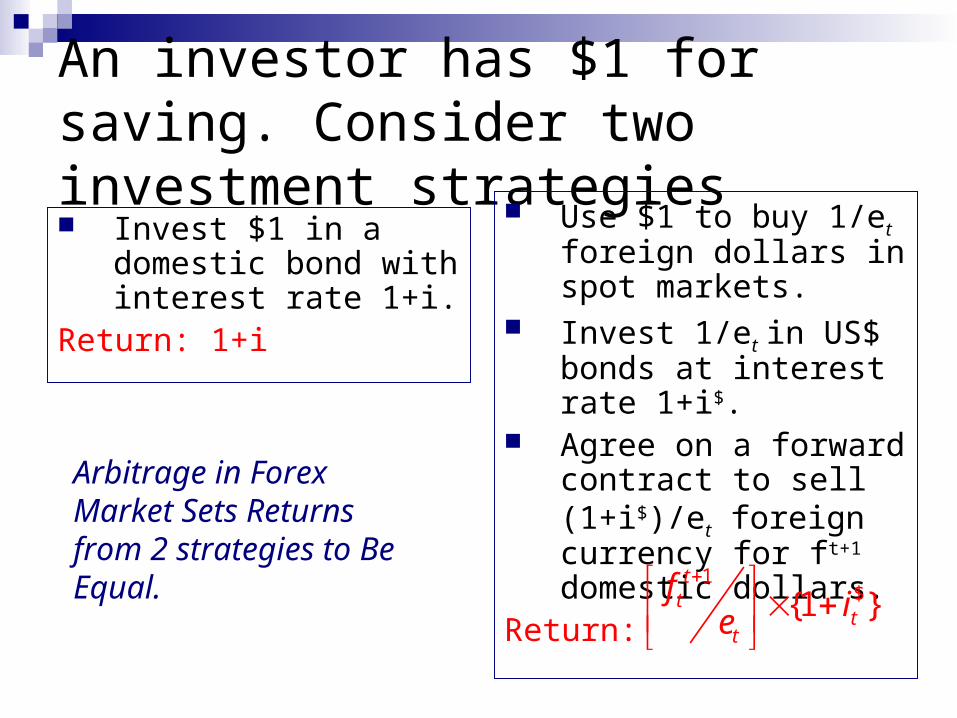
An investor has $1 for saving. Consider two investment strategies Invest $1 in a domestic
bond with interest rate 1+i.
Return: 1+i
Use $1 to buy 1/et foreign dollars in spot markets.
Invest 1/et in US$ bonds at interest rate 1+i$.
Agree on a forward contract to sell (1+i$)/et foreign currency for ft+1 domestic dollars.
Return: 1${1 }
tt
tt
f ie
Arbitrage in Forex Market Sets Returns from 2 strategies to Be Equal.
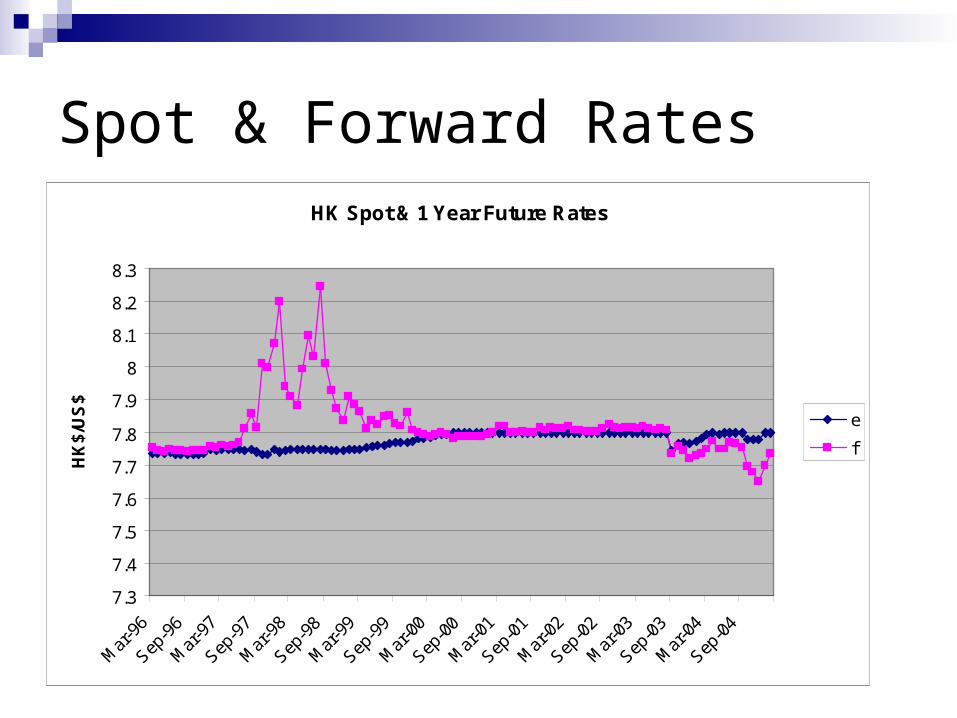
Spot & Forward RatesHK Spot & 1 Year Future Rates
7.3
7.4
7.5
7.6
7.7
7.8
7.9
8
8.1
8.2
8.3
Mar
-96
Sep-9
6
Mar
-97
Sep-9
7
Mar
-98
Sep-9
8
Mar
-99
Sep-9
9
Mar
-00
Sep-0
0
Mar
-01
Sep-0
1
Mar
-02
Sep-0
2
Mar
-03
Sep-0
3
Mar
-04
Sep-0
4
HK
$/U
S$
e
f
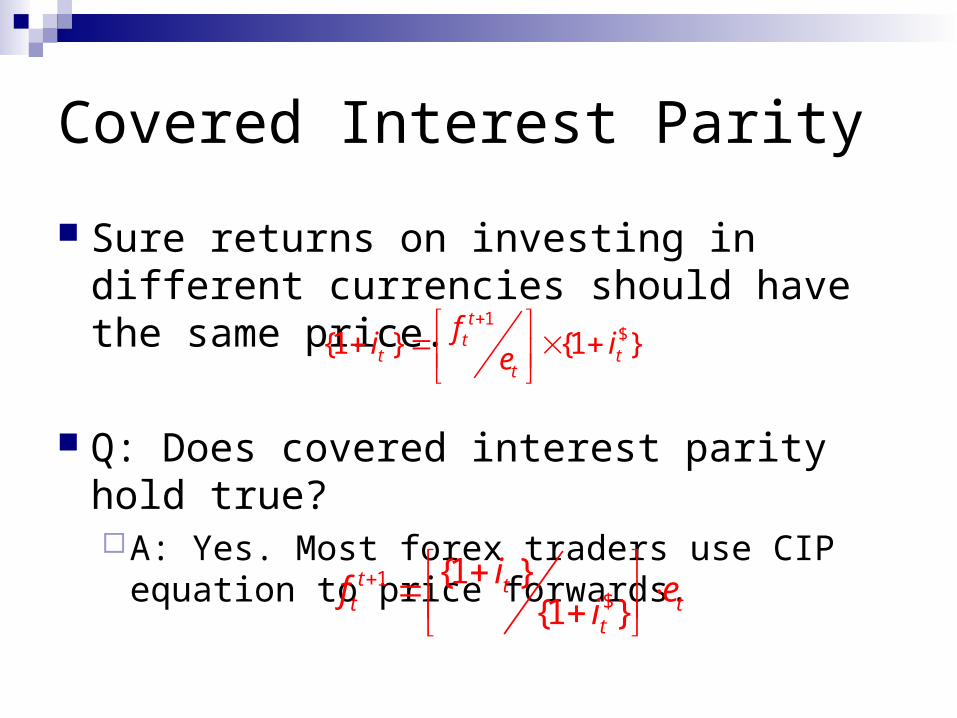
Covered Interest Parity
Sure returns on investing in different currencies should have the same price.
Q: Does covered interest parity hold true?A: Yes. Most forex traders use CIP equation
to price forwards.
1${1 } {1 }
tt
t tt
fi ie
1$
{1 }{1 }
t tt t
t
if ei

US$ and HK$ Government Bills
Interest Differentials
-2
0
2
4
6
8
10
12
14
Mar
-96
Sep
-96
Mar
-97
Sep
-97
Mar
-98
Sep
-98
Mar
-99
Sep
-99
Mar
-00
Sep
-00
Mar
-01
Sep
-01
Mar
-02
Sep
-02
Mar
-03
Sep
-03
Mar
-04
Sep
-04
%
i(US$)
i(HK$)
i(US$)+(f/e)

Uncovered Interest Parity Forward prices should equal the market’s
expectation of future spot rate. If traders think the future spot price of foreign
currency, et+1 > ftt+1, then why agree to deliver
it at that price. If traders think the spot price of foreign currency et+1 < ft
t+1, why agree to pay that price.
This should imply a term for exchange rate parity 1
$11
1E t tt t t
t
ie f ei
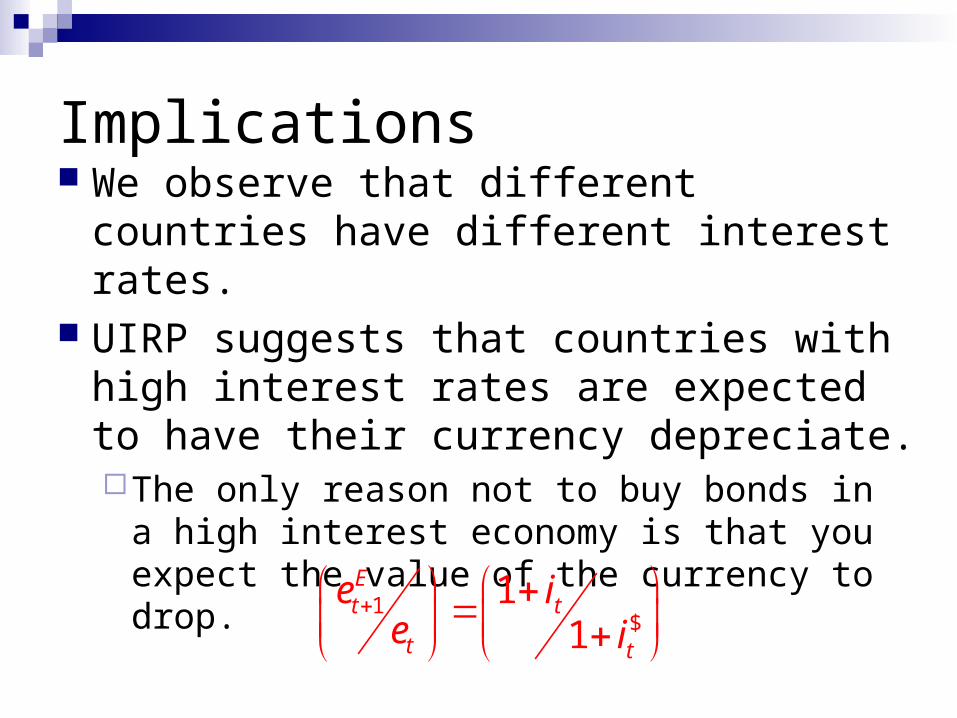
Implications We observe that different countries have
different interest rates. UIRP suggests that countries with high
interest rates are expected to have their currency depreciate.The only reason not to buy bonds in a high
interest economy is that you expect the value of the currency to drop.
1$
11
Et t
t t
e ie i
Exchange Rate Determination
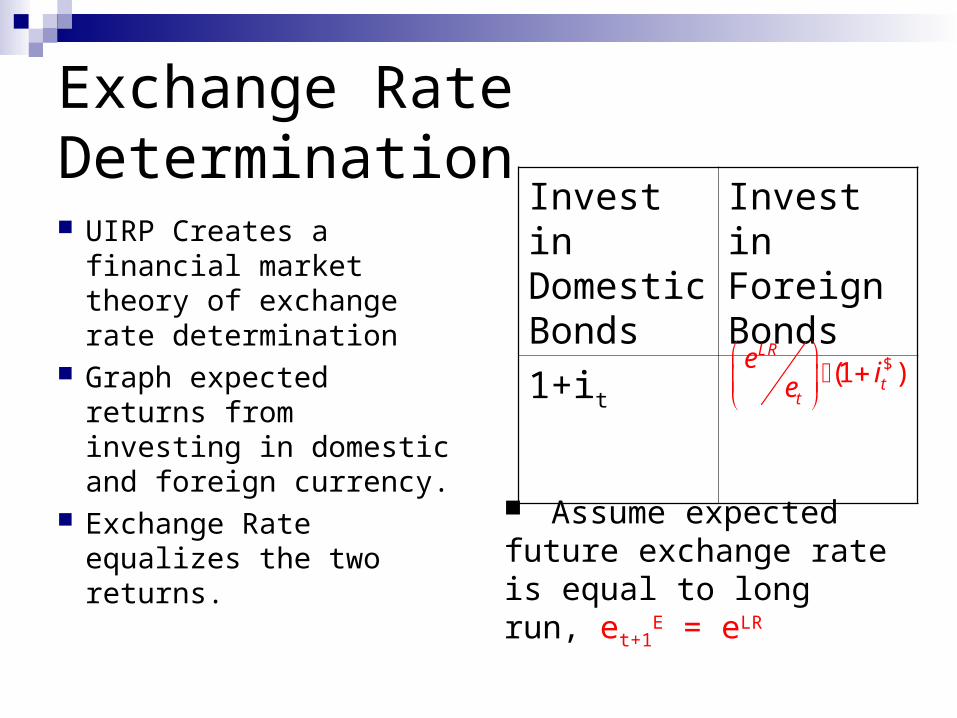
UIRP Creates a financial market theory of exchange rate determination
Graph expected returns from investing in domestic and foreign currency.
Exchange Rate equalizes the two returns.
Invest in Domestic Bonds
Invest in Foreign Bonds
1+it $(1 )LR
tt
e ie
Assume expected future exchange rate is equal to long run, et+1
E = eLR

Equilibrium Exchange Rate1+i
Return
et
e* $(1 )LR
tt
e ie

Exchange Rate Determination1. Given future exchange
rates, a rise in domestic interest rates or a fall in interest rates will lead to an appreciation.
• A temporary increase in domestic interest rates will lead to appreciation.
2. A rise in the future value of the currency will increase the current value.
• Current exchange rate depends on whole path of future interest rates.
Event Exchange Rate
Temporary
i↑
et ↓
Temporary
i$ ↑
et ↑
eLR ↑ et ↑
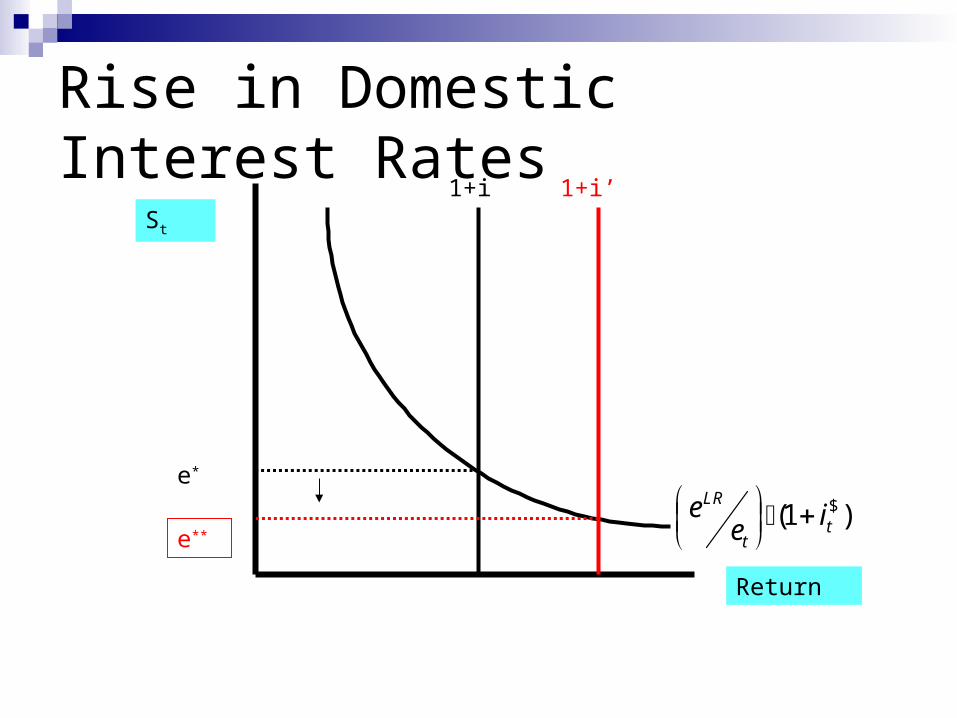
Rise in Domestic Interest Rates1+i
Return
St
e*
$(1 )LR
tt
e ie
1+i’
e**

Contradiction and Dynamics
If domestic bond yields are higher than foreign yields, we should expect a depreciation of domestic currency over the life of bond.
A temporary increase in domestic yields leads to a domestic currency appreciation.
Is this a contradiction?
No, the domestic currency will immediately appreciate and subsequently depreciate back to the original position.
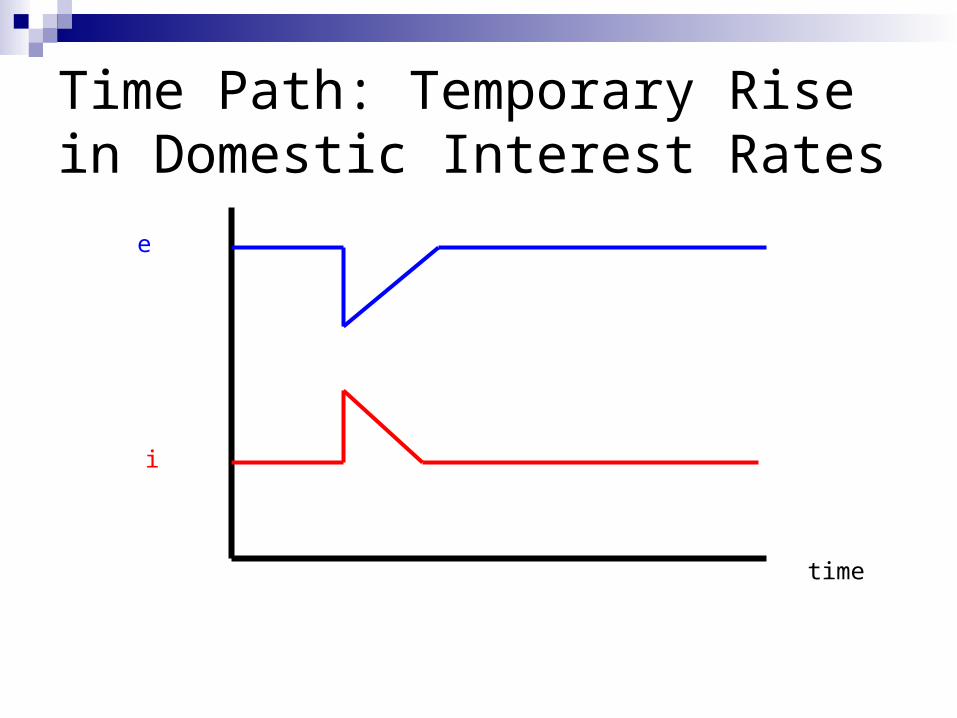
Time Path: Temporary Rise in Domestic Interest Rates
e
i
time

Rise in Foreign Interest Rates or Future Depreciation
1+i
Return
et
e*
$(1 )LR
tt
e ie
e***
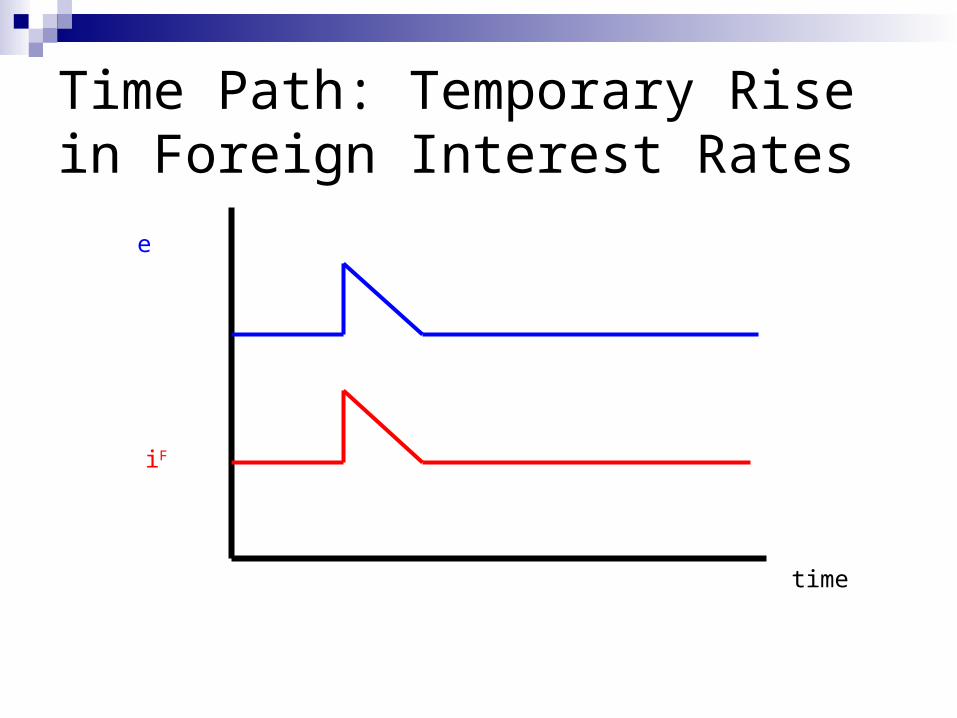
Time Path: Temporary Rise in Foreign Interest Rates
e
iF
time

Is UIRP true? UIRP does not hold especially for developed
world countries. High interest rate countries do not systematically
see their countries currencies deteriorate. Buying bonds in high interest rate countries
generates high average returns. Why don’t investors take advantage of these
opportunities? Investors perceive these countries as having
some risk of an exchange rate depreciation and investors are risk averse.
Risk Adjusted UIRP
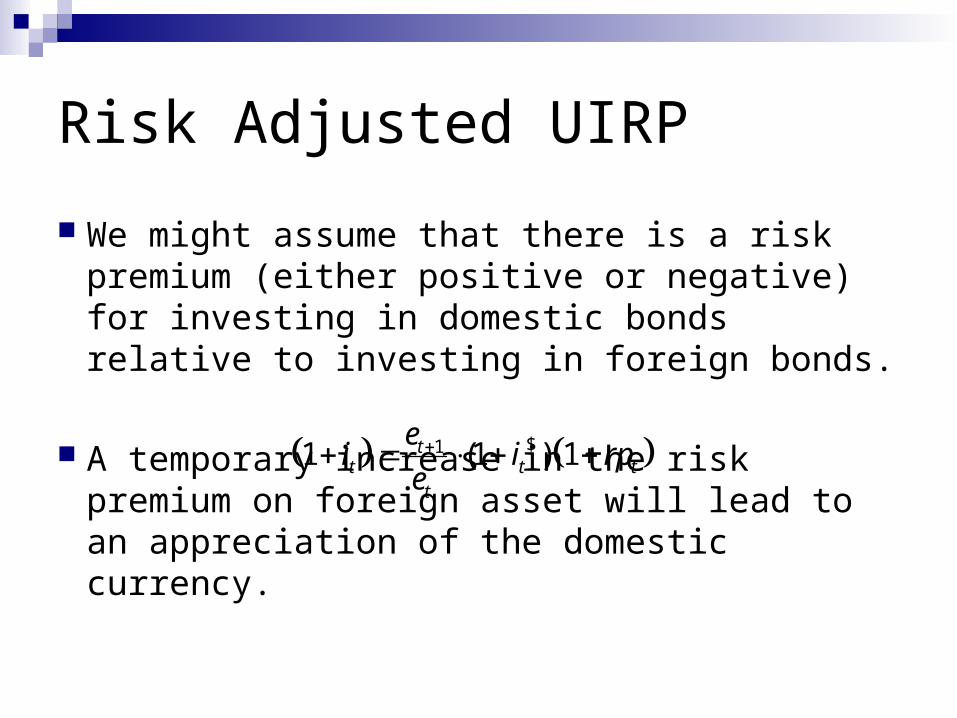
We might assume that there is a risk premium (either positive or negative) for investing in domestic bonds relative to investing in foreign bonds.
A temporary increase in the risk premium on foreign asset will lead to an appreciation of the domestic currency.
$11 (1 ) 1tt t t
t
ei i rp
e
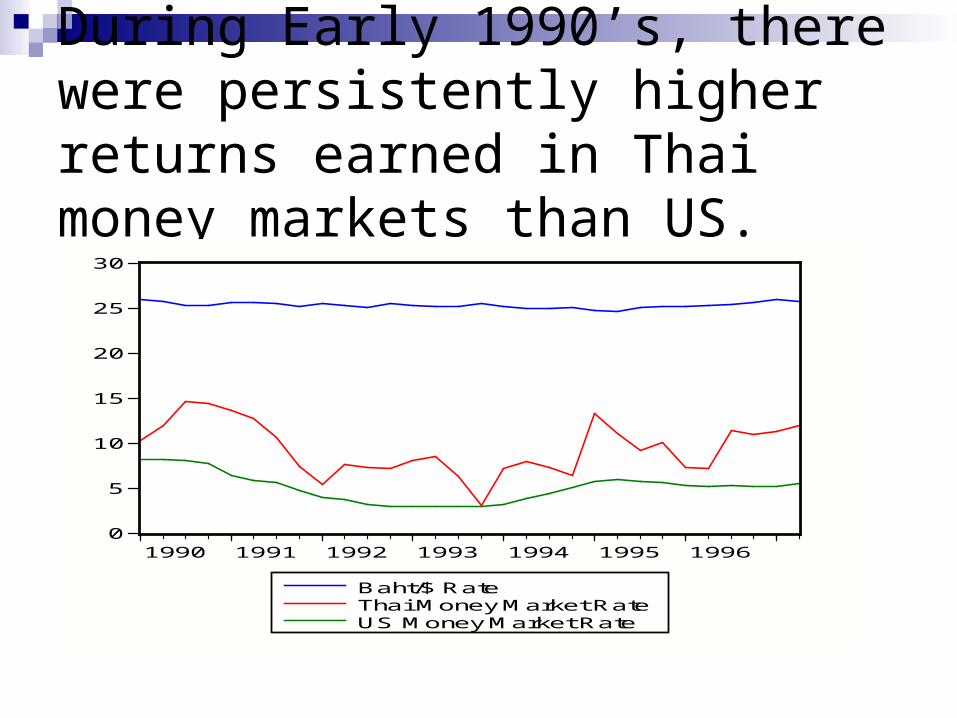
During Early 1990’s, there were persistently higher returns earned in Thai money markets than US.
0
5
10
15
20
25
30
1990 1991 1992 1993 1994 1995 1996
Baht/$ RateThai Money Market RateUS Money Market Rate

But in July, 1997, owners of Thai bonds lost 50% of their investment in US dollar terms.
0
10
20
30
40
50
97Q1 97Q3 98Q1 98Q3 99Q1 99Q3 00Q1
Baht/$ RateThai Money Market Interest RateUS Money Market Interest Rate

Costs of Exchange Rate Volatility Volatile exchange rates generate income risk
for firms that export goods. This may eliminate some benefits of international trade.
Volatile exchange rates generate liability risk for firms that borrow foreign currency to finance investment projects. This is especially significant for firms in emerging markets.
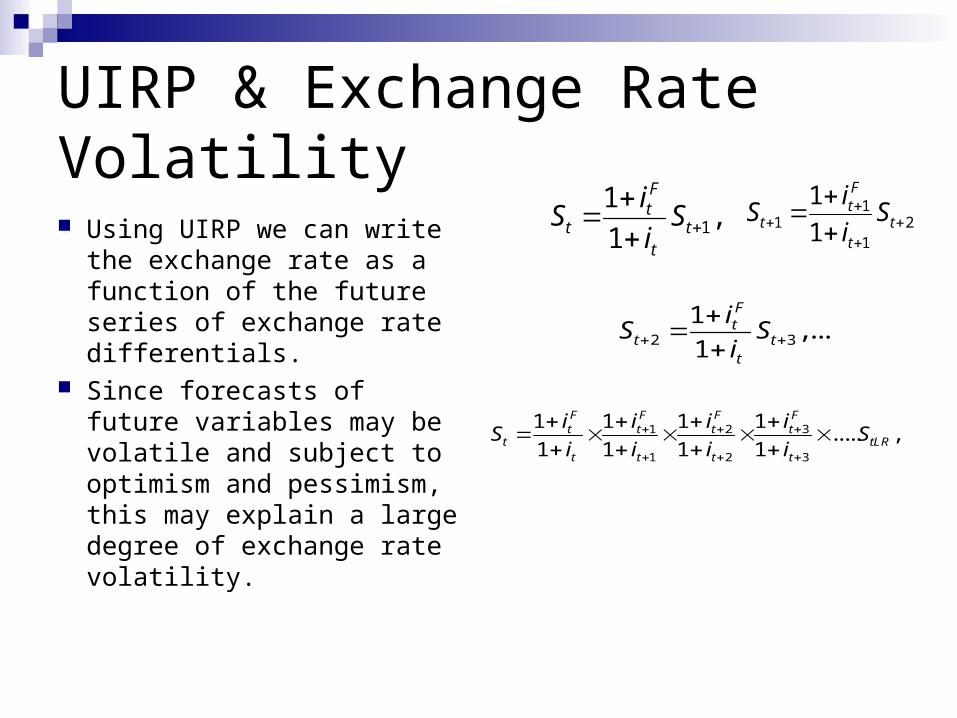
UIRP & Exchange Rate Volatility Using UIRP we can write
the exchange rate as a function of the future series of exchange rate differentials.
Since forecasts of future variables may be volatile and subject to optimism and pessimism, this may explain a large degree of exchange rate volatility.
2 3
1,...
1
Ft
t tt
iS S
i
1
1,
1
Ft
t tt
iS S
i
11 2
1
1
1
Ft
t tt
iS S
i
1 2 3
1 2 3
1 1 1 1..... ,
1 1 1 1
F F F Ft t t t
t tLRt t t t
i i i iS S
i i i i