exchange rate pass-through in bangladesh’s export prices
TRANSCRIPT

The Bangladesh Development Studies Vol. XXX, March-June 2004, Nos.1 & 2
Exchange Rate Pass-Through in Bangladesh’s Export Prices: An Empirical Investigation
by
MOHAMMAD MAINUL HOQUE* ABDUR RAZZAQUE**
This paper makes an attempt to unearth the relationship between the exchange rate and traded goods’ prices, known as the exchange rate pass-through (ERPT) relationship, utilizing a panel data of some disaggregated export items of Bangladesh. Findings of this study suggest that, while although for primary exports there is the evidence of one-to-one correspondence between the changes in the exchange rate and export prices, such relationship does not hold for readymade garment (RMG) exports. Market specific results from econometric estimates reveal exporters’ pass-through behavior to be guided by their perception about destination markets’ demand pattern and, consequently the pricing-to-market (PTM) turns out to be the prominent strategy, defying the prediction of the so-called “law of one price” hypothesis. The striking finding of RMG exports being insensitive to changes in the exchange rate is to be attributable to the Multi-fiber Arrangement (MFA) regime, which constrained competitive behavior of different suppliers in many restricted items that are of export interest to Bangladesh.
I. INTRODUCTION
The management of the exchange rate has long been a major component of trade policy reforms in developing countries. Trade reforms particularly try to overcome the problem of overvaluation of the exchange rate so that resource allocation in the domestic economy is free from the policy-induced anti-export bias on the one hand and exporters can improve their competitiveness in international markets through the adjustment of the domestic currency on the other. Despite its known consequences, there is a general consensus that currency depreciation allows exporters cutting their product prices (in foreign currencies) in overseas markets, which either helps expand or protect their export market share. However, * Research Associate, Bangladesh Institute of Development Studies (BIDS), Dhaka, Bangladesh. ** Assistant Professor, Department of Economics, University of Dhaka, Dhaka, Bangladesh.

The Bangladesh Development Studies 36
it is the magnitude of the adjustment in foreign currency prices in response to changes in the relative prices of the domestic currency, known as the exchange rate pass-through (ERPT) that has become a subject matter of great interest among the international trade economists.
Changes in the exchange rate are to be reflected in export prices in different ways. First, there may be a one-to-one correspondence between changes in the exchange rate and prices (complete pass-through), that is, export prices will fall by the full extent of domestic currency depreciation. Second, devaluation may affect prices only partially, allowing the exporters to absorb a portion of the change in the exchange rate (partial pass-through). Finally, exchange rate changes may not have any impact on export prices in foreign currency. In fact, if a country is to be considered as a “small” country, and hence a price taker in the international market, ERPT in export prices is to be zero. In that case, any real depreciation of its currency will only be translated into profits for the exporters. By contrast, if export markets are actually governed by the features of imperfect competition one might observe a significant ERPT.
The phenomenon of partial pass-through is also consistent with a different kind of pricing strategy known as the “pricing to market” (PTM) – first coined and analyzed by Krugman (1987) which is an active policy designed by firms to protect export market shares by reflecting minimum price changes in the foreign market in the face of exchange rate movement. 1 Under this pricing strategy a wedge is created between the domestic currency price of exports and the price of goods sold in the domestic market. Appreciation of the currency will be transformed into lower prices for exports, in terms of home currency, in foreign markets relative to the price in the domestic market.2
The sustained deterioration in the US current account balance in sharp contrast to an increasing trade surplus of its rival during the 1980s, led to the proliferation of the literature on the relationship between exchange rates and prices, popularly 1 The idea of PTM emerged from the violation of the law of one price. The law of one price is believed to hold due to arbitrage, although price differentials across countries are observed to be quite widespread. These price differentials usually cannot be explained by transportation costs or trade taxes and this phenomenon has been attributed to the PTM behavior of firms. 2 The crucial difference, therefore, between the orthodox imperfectly competitive framework in which firms do not act as price takers and PTM is that in the case of the former the domestic currency price will be the same in both the home and foreign markets (adjusted for the transport cost and trade taxes) while in case of the latter a wedge will be created between these two markets. Dornbusch (1987), Baldwin (1988), Froot and Klemper (1989) Fisher (1989), Kasa (1992), Knetter (1989, 1993), Goldberg and Knetter (1995, 1997), Salvador Gil-Pareja (2000), Takagi and Yoshida (1999) are recent studies that focus on different underlying motives of firms’ PTM behavior.
36

Hoque & Razzaque: Exchange Rate Pass-through in Bangladesh 37
known as the exchange rate pass-through (ERPT) relationship.3 Among the empirical studies, Giovannini (1988) first showed that Japanese exporters actually discriminated between the domestic and export markets, while Marston (1991) provided the evidence of both US and Japanese firms pursuing PTM strategies. In one of the earliest attempts, Hooper and Mann (1989) offered estimates of the degree of exchange rate pass-through (ERPT) ranging from 20 to 60 percent.4 In other studies, the pass-through magnitudes turned out to be much bigger (e.g. Gagnon and Knetter 1995, Gaukin 1997, Knetter 1989, and Tange 1997). The pass-through estimation exercises had also been carried out to verify whether exporters were price taker in international markets (Webber 1997, Swift 1998) and whether the response to currency appreciation was different from that of depreciation (Han and Suh 1996).5
The basic aim of this paper is to uncover the relationship between the exchange rate and export prices for Bangladesh. During the past twenty years of trade policy reforms, Bangladesh had strived to protect its international competitiveness by frequent downward adjustments of taka, before adopting a freely-floating exchange rate regime in 2003 since when taka had depreciated further. One of the main drivers of this paper is that, although the issue of currency depreciation and export competitiveness always attracts a lot of attention in Bangladesh, the discussion surrounding it is uninformed in nature, mainly because of lack of empirical evidence. The paper, therefore, contributes more effectively by carrying out an empirical investigation to find out how exporters incorporate
3 During the 1980s despite a large appreciation of the Japanese yen, prices of US imports from Japan barely rose to match the extent of the appreciation, which resulted in much attention in pricing strategy by firms in response to the changing exchange rate. 4 There had been a debate in the literature whether some countries were more prone to relying on PTM strategy. For example, Hooper and Mann (1989) suggest that the Japanese firms absorbed a higher proportion of exchange rate fluctuations in their profit margins compared to other countries, and Ohno (1989) showed that ERPT coefficients were higher for US exporters than Japanese firms. On the other hand, despite the pervasive phenomenon of incomplete pass-thorough in Japanese exports, Athukorala and Menon (1994) could reject the widely held view of their relying more heavily on PTM strategies. Similarly, Kikuchi and Sumner (1997) revealed an incomplete pass-through in the Japanese export prices “only in the shortest of the short runs”(p.1) while in the long-run the pass-though was found to be complete. A comparison between the German and Japanese exporters by Tange (1997) revealed the pass-through coefficient for the former was very close to one (0.98) vis-à-vis the latter’s in the range 0.44 – 0.90. 5 Webber (1997) found Australia to be a price taker in the export of coal, copper, wool and zinc but not in wheat, iron ore and sugar. Swift’s (1998) estimate of 0.6 as the ERPT coefficient for the same country’s aggregate exports rejected the small country assumption for Australia. In the case of Republic of Korea, Han and Suh (1996) found that the pass-through elasticity differed dramatically between the period of depreciation and appreciation. During the period of depreciation the elasticity was found to be only 0.10 while during the appreciation period it was as high as 0.95.
37

The Bangladesh Development Studies 38
exchange rate changes in their pricing decision. The methodology used in this paper utilizes a panel data framework, having incorporated both microeconomic and industrial organizational aspects of exporting firms. One interesting feature of this methodology is that, it controls for various types of heterogeneity and omitted variable biases while providing an unbiased estimate of the impact of changes in the exchange rate on export prices. Another important contribution of this article is to provide insights about the demand patterns and market structures of Bangladesh’s exports in different destinations.
The rest of this paper is organized as follows: Section II introduces the analytical framework used in the paper. Section III describes the data followed by the empirical results in Section IV-Section V contains some general observations and concludes.
II. THEORETICAL BACKGROUND AND THE PANEL DATA FRAMEWORK
The theoretical framework by Knetter (1989) is used here to guide the empirical work where the multi-market model of third degree price discrimination and the panel data framework are the integrated components of the methodology. Under this framework, the analysis is partial equilibrium in nature and changes in the exchange rate are assumed to be exogenous.
In a world of imperfect competition, the exporter of a particular industry can sell the same commodity at different prices in different markets. How much of a change in the exchange rate is passed through to the local currency import prices (price in terms of importer’s currency) of a given commodity in a given destination market reflects the conscious price-setting behavior of the exporting industry. Specifying firm’s problem more concretely is necessary and will be useful to conceptualize the model since PTM involves exporting firm’s behavior in multiple markets. Let us consider an exporting firm which sells in N separate destination markets, indexed here by i.
Demand in each destination in general form:
),( itit
itiit V
EP
fQ = (1a)
Exporters cost is given by: titt WqCC )(∑= (1b)
In equation (1a), is the quantity demanded by exporting firm in destination market i in period t, p is the price in terms of exporter’s currency, E is the
itQ
38

Hoque & Razzaque: Exchange Rate Pass-through in Bangladesh 39
exchange rate (price of exporter’s currency in terms of destination market
currency) and, therefore,it
it
EP
denotes exporters’ price in terms of importers’
currency and v is a random demand shifter in market i. In the cost equation, c measures costs in domestic currency units at period t depending on total exports to various destinations ( ) and a random variable , which may shift cost function in period t, such as, input prices.
t
∑ itQ tW
The exporter’s objective is to maximize profit:
nPPPMax
....21
)( .............2,1 nPPPπ =nPPP
Max....21
[ ]∑ ∑− )( , tititit wqCQP (1c)
Solving the above objective function with respect to prices charged in each
market in each period yields a set of first order conditions. These would imply that the firm equates the marginal revenue from sales in each market to the common marginal cost:
)1
11(−
+=ε it
tit McP (1d)
where, i = 1,2…N; t = 1,2…T; = ; and tMc tC δ/ ε it = Elasticity of demand with respect to local currency price in destination market i. Equation (1d) states that price in export market i is a fixed mark-up over marginal cost where the mark-up for destination i is assumed to depend on elasticity of i’s demand with respect to its local currency price at period t. The above systems of equation given by equation (1d) imply that exporting firm’s optimal price depends on two factors: (i) common marginal cost and (ii) the mark-up over marginal cost (mark-up may be common or destination specific) where mark-up depends on the convexity of the demand curve, which determines how the demand elasticity changes with a change in local price.
Knetter (1989) exploits the idea of close relationship between export prices and demand conditions in destination markets to isolate changes in mark-up from changes in marginal cost induced by exchange rate variations. Exchange rate induced changes in marginal cost of producing an export category will affect its prices to all destination markets, assuming that the quality of the product remains the same across all destinations. The mark-up may be common or destination
39
The Bangladesh Development Studies 40
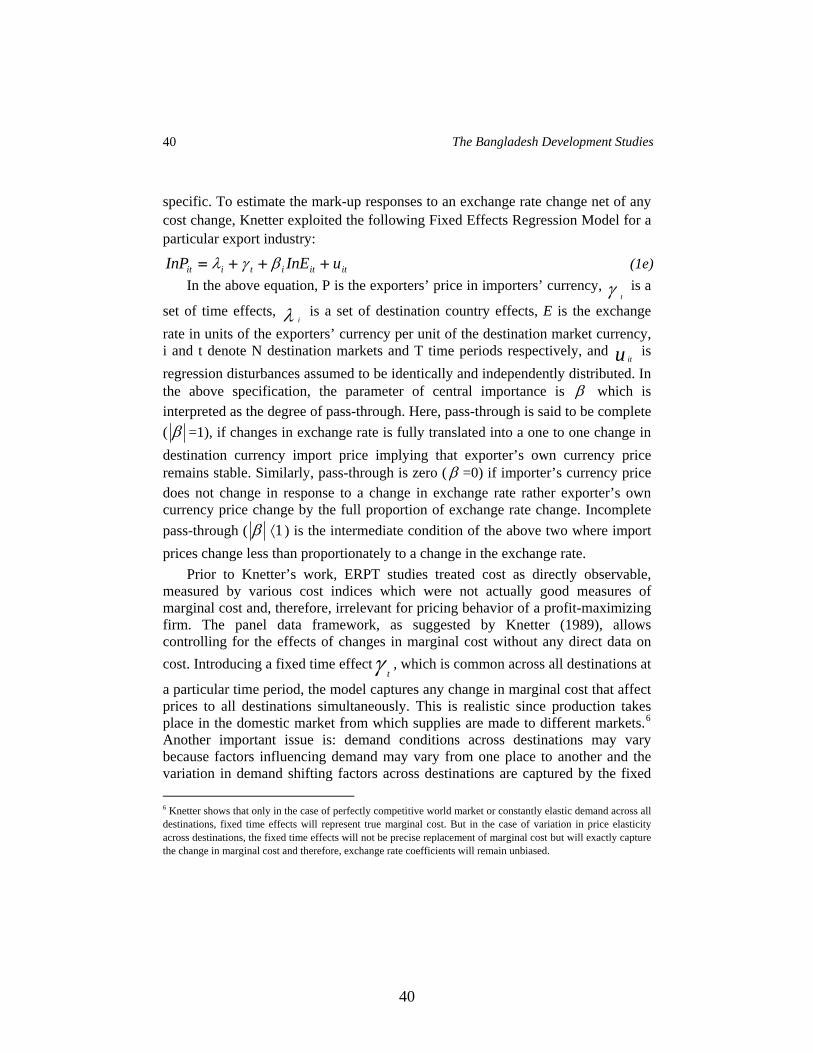
specific. To estimate the mark-up responses to an exchange rate change net of any cost change, Knetter exploited the following Fixed Effects Regression Model for a particular export industry:
itititiit uInEInP +++= βγλ (1e) In the above equation, P is the exporters’ price in importers’ currency, γ t
is a
set of time effects, λ i is a set of destination country effects, E is the exchange
rate in units of the exporters’ currency per unit of the destination market currency, i and t denote N destination markets and T time periods respectively, and u is regression disturbances assumed to be identically and independently distributed. In the above specification, the parameter of central importance is
it
β which is interpreted as the degree of pass-through. Here, pass-through is said to be complete ( β =1), if changes in exchange rate is fully translated into a one to one change in destination currency import price implying that exporter’s own currency price remains stable. Similarly, pass-through is zero ( β =0) if importer’s currency price does not change in response to a change in exchange rate rather exporter’s own currency price change by the full proportion of exchange rate change. Incomplete pass-through ( β 1⟨ ) is the intermediate condition of the above two where import prices change less than proportionately to a change in the exchange rate.
Prior to Knetter’s work, ERPT studies treated cost as directly observable, measured by various cost indices which were not actually good measures of marginal cost and, therefore, irrelevant for pricing behavior of a profit-maximizing firm. The panel data framework, as suggested by Knetter (1989), allows controlling for the effects of changes in marginal cost without any direct data on cost. Introducing a fixed time effectγ t
, which is common across all destinations at
a particular time period, the model captures any change in marginal cost that affect prices to all destinations simultaneously. This is realistic since production takes place in the domestic market from which supplies are made to different markets.6 Another important issue is: demand conditions across destinations may vary because factors influencing demand may vary from one place to another and the variation in demand shifting factors across destinations are captured by the fixed 6 Knetter shows that only in the case of perfectly competitive world market or constantly elastic demand across all destinations, fixed time effects will represent true marginal cost. But in the case of variation in price elasticity across destinations, the fixed time effects will not be precise replacement of marginal cost but will exactly capture the change in marginal cost and therefore, exchange rate coefficients will remain unbiased.
40
Hoque & Razzaque: Exchange Rate Pass-through in Bangladesh 41
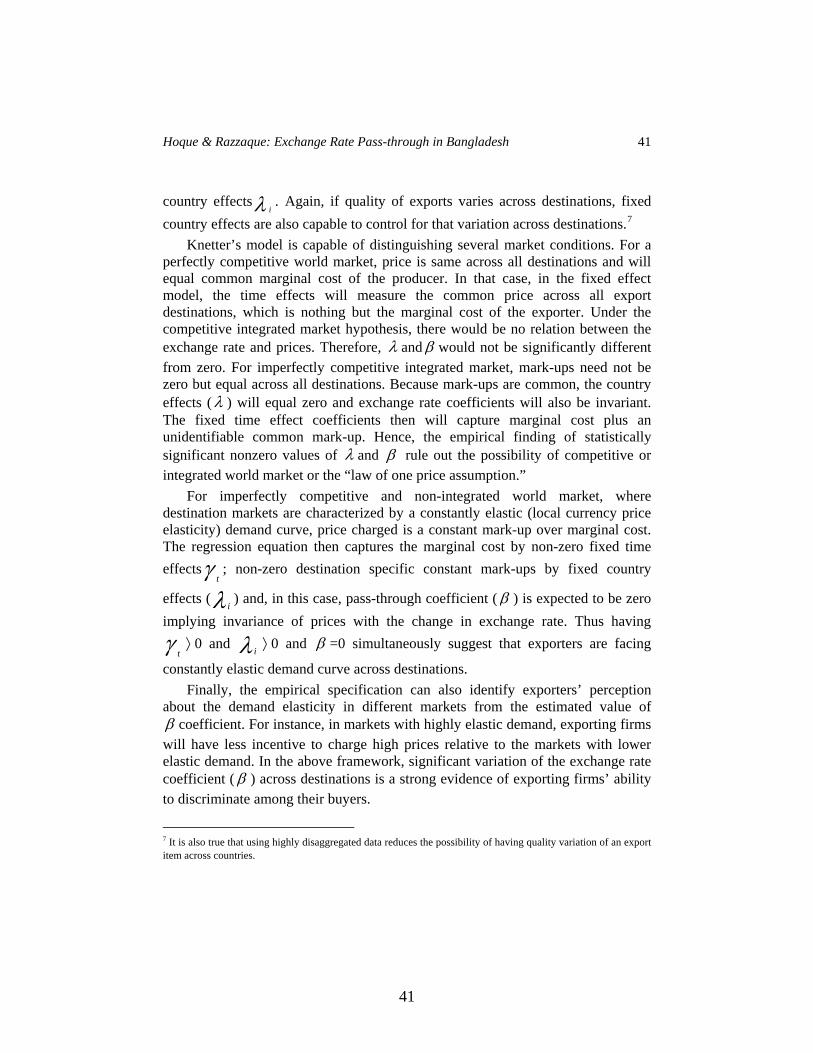
country effectsλ i. Again, if quality of exports varies across destinations, fixed
country effects are also capable to control for that variation across destinations.7
Knetter’s model is capable of distinguishing several market conditions. For a perfectly competitive world market, price is same across all destinations and will equal common marginal cost of the producer. In that case, in the fixed effect model, the time effects will measure the common price across all export destinations, which is nothing but the marginal cost of the exporter. Under the competitive integrated market hypothesis, there would be no relation between the exchange rate and prices. Therefore, λ and β would not be significantly different from zero. For imperfectly competitive integrated market, mark-ups need not be zero but equal across all destinations. Because mark-ups are common, the country effects (λ ) will equal zero and exchange rate coefficients will also be invariant. The fixed time effect coefficients then will capture marginal cost plus an unidentifiable common mark-up. Hence, the empirical finding of statistically significant nonzero values of λ and β rule out the possibility of competitive or integrated world market or the “law of one price assumption.”
For imperfectly competitive and non-integrated world market, where destination markets are characterized by a constantly elastic (local currency price elasticity) demand curve, price charged is a constant mark-up over marginal cost. The regression equation then captures the marginal cost by non-zero fixed time effectsγ t
; non-zero destination specific constant mark-ups by fixed country
effects (λ i ) and, in this case, pass-through coefficient ( β ) is expected to be zero implying invariance of prices with the change in exchange rate. Thus having
γ t⟩ 0 and λ i ⟩ 0 and β =0 simultaneously suggest that exporters are facing
constantly elastic demand curve across destinations. Finally, the empirical specification can also identify exporters’ perception
about the demand elasticity in different markets from the estimated value of β coefficient. For instance, in markets with highly elastic demand, exporting firms will have less incentive to charge high prices relative to the markets with lower elastic demand. In the above framework, significant variation of the exchange rate coefficient ( β ) across destinations is a strong evidence of exporting firms’ ability to discriminate among their buyers.
7 It is also true that using highly disaggregated data reduces the possibility of having quality variation of an export item across countries.
41

The Bangladesh Development Studies 42
III. DATA
The model is estimated for some selected export items using data from the “Foreign Trade Statistics of Bangladesh” published by the Bangladesh Bureau of Statistics (BBS) and exchange rate data from the International Financial Statistics published by IMF. The sample period is 1989-2001. The sample period is chosen up to 2001 because the latest issue of FTS is available only up to 2001. Export Categories are chosen in such a way so that top most commodities (in terms of export revenues) are considered. Unit values are tabulated at the highest possible disaggregated level (seven digit level as available in the FTS). Most export earnings of Bangladesh come from raw jute and jute products, frozen fish, tea, fertilizer, leather and leather goods, knit and woven garments. Since seventy six percent of the country’s export earnings come from the readymade garments (RMG) sector, ten out of eighteen in the export sample are chosen from garments products. Data were not sufficiently available for tea and fertilizers to meet at least five destinations for each product category to provide cross section variation in the sample. Description of the chosen commodities along with their selected destinations is given in Appendix (Table A.1). The price data used in this study are unit export values constructed by dividing the value of shipments by quantity of shipments to various export destinations where each commodity has at least five destinations. Destinations are chosen such that each has continuous import record from Bangladesh for the whole sample: 1989 - 2001.
Destination specific unit values are calculated by using appropriate exchange rate of that particular destination currency with taka. Exchange Rate data are in nominal terms and are taken from various issues of International Financial Statistics published by IMF.
IV. ESTIMATION AND RESULTS
ERPT coefficients for several export categories from Bangladesh are estimated by using the following empirical specification:
itititiit uInEInP +++= βγλ (4a) where P is the export price in terms of destination market currency, E is the exchange rate of taka against per unit of destination market currency and others have similar notational explanation as given before. To explain exporters’ price discriminating abilities across destinations, the following model is estimated:
42

Hoque & Razzaque: Exchange Rate Pass-through in Bangladesh 43
ititiitiit uEDInInP +++= )(βγλ (4b)
where, D i= DD 21 , ……………………………… D N 1−
and D stands for country
dummies, while DE denotes country interaction effects. One country interaction dummy is excluded to avoid singularity effect. Significant variation of β s’ across i = 1,2,3…………N will strongly suggest variation in prices charged to different import destinations for the same commodity, which is surely an indication of Bangladeshi exporters’ capacity to exhibit PTM behavior.
Specification (4a) and (4b) are estimated for selected export categories from Bangladesh, as described in the previous section, to several destination markets by using the Least Square Dummy Variable (LSDV) or Fixed Effect Model (FEM) which includes both time effects and fixed country effects. The Lagrange Multiplier (LM) Test is conducted for every export commodity selected for this study to make a choice between FEM and the simple OLS regression on pooled data. The results are in favor of the FEM.
IV.1 Commodity Specific Simple Pass-through Results Eight of the export categories out of the eighteen chosen in this sample are
mainly primary or semi-finished processed primary products. Estimated ERPTs, as reported in Table 1, fall between -0.782 and -1.03. Except for jute cordage, ropes and twines (HS-560710) with a pass-through coefficient of -0.782, all other categories exhibit complete pass-through. The signs of the ERPT coefficients are negative as expected. All the estimated pass-through coefficients are significant at less than one percent level. The fit of the model is quite good for all the categories of exports. The F- test, as reported in the last column of Table I, shows that the models are significant in all the cases.
For HS-560710 (jute cordage and rope), the pass-through coefficient is –0.782 and it is significant at less than one percent level. This estimate implies degree of pass-through to be less than complete and for a one percent depreciation of taka against importer’s currency, price in importer’s currency fall by less than one percent. Incomplete pass-through, after having depreciation, results in an increase of export prices in taka for this particular jute item.
Complete pass-through results as obtained for different export categories from Bangladesh, except HS-560710 (jute cordage and ropes), reveal zero bargaining power of Bangladeshi exporters with international buyers, which requires exporters to pass-through the full amount of depreciation to importer’s own currency prices. High degree of ERPT for Bangladeshi primary exports may arise from falling international prices of primary commodities, low demand of these commodities in
43

The Bangladesh Development Studies 44
international market, extensive competition arising from other outside export sources or presence of large number of close substitutes in the destination markets. Recent experience shows that world prices of jute goods, frozen food items, raw and semi-finished leather and jute carpets are having downward trends (Razzaque et al. 2004, UNCTAD 2003) and, therefore, to maintain compatibility in international markets, exporters of these items are to reduce prices in destination markets. Again, if importing market is extremely competitive then Bangladeshi exporters will have high incentives to reduce the local currency prices to maintain existing market share or to raise the quantity sold, and thus offsetting the fall in export revenue from declining prices.
TABLE I
PASS-THROUGH COEFFICIENTS FOR PRIMARY, SEMI-PROCESSED PRIMARY AND PROCESSED PRIMARY EXPORT CATEGORIES FROM
BANGLADESH
Commodities Pass-through Coefficient
t-statistic (p value) Adjusted-R 2 Model Test: F-
Statistic HS 030613 -0.9765*** -2.65
(.009) 0.960 F [23, 106]
=136.03(.000) HS 410429 -1.01*** -29.2
(.000) 0.99 F [24, 118]
=468.18(.000) HS 410612 -1.002*** -26.3
(.000) 0.99
F [19, 58]
=285.81(.000) HS 530310 -0.9712*** -14.99
(.000) 0.98 F [24,118]
=341.10(.0000) HS 530710 -0.979*** -69.03
(.000) 0.99 F [23,106]
=5139.04(.000) HS 531010 -1.02*** -22.88
(.000) 0.99 F [23, 106]
=511.51(.000) HS 560710 -0.78*** -3.67
(.0004) 0.81 F [21, 82]
=21.54(.000) HS 630510 -1.03*** -24.18
(.00) 0.99 F [24, 118]
=395.98(.0000) Notes: *** and ** indicate the coefficients are significant at less than 1 percent and 10 percent level. Results are
obtained from heteroscedasticity adjusted variance-covariance matrix. Heteroscedasticity adjusted estimated autocorrelation coefficient is checked. In almost all the cases autocorrelation coefficient is found to be very low which confirms that d is very close to 2.This has eliminated the possibility of getting serially correlated error structure in the estimated regression equations.
In addition, Bangladeshi primary export categories are homogenous in nature
and they have large number of close substitutes in international markets. For example, jute and jute products such as HS-530310 (jute cuttings), HS-530710
44

Hoque & Razzaque: Exchange Rate Pass-through in Bangladesh 45
(jute yarns), HS-531010 (jute fabrics, jute-made hessian cloth, jute bags and sacks) have very close substitutes of different polypropylene products in international markets which are exerting an increased pressure on Bangladeshi suppliers (Ministry of Commerce 2004). Consequently, whenever there is any depreciation of taka, exporters transmit the full changes in the exchange rate to foreign currency import prices to ensure a lower local currency prices in destination countries. But, for HS-560710, the degree of pass-through is found to be incomplete (-0.78), indicating some market power of Bangladeshi exporters over their counterpart in destination markets. For this export category, sellers can take up some portion of changes in exchange rate and thus increase home-currency export price after a depreciation of taka.
TABLE II PASS-THROUGH COEFFICIENTS FOR KNIT AND WOVEN GARMENT
EXPORT CATEGORIES FROM BANGLADESH
Commodities Pass –through Coefficient
t-statistic (p value)
Adjusted-R 2 Model Test: F-statistic
HS 610910 -1.066** -1.70 (.092)
0.96 F [21, 82] =121.52(.000)
HS 610990 1.69** 1.78 (.079)
0.81
F [19, 58] =18.51(.000)
HS 611020 1.89 1.06 (.29)
0.43
F [18, 46] =3.67(.00019)
HS 620333 0.224 0.39 (0.69)
0.18
F [21, 82] = 2.13(.00835)
HS 620342 -0.753*** -3.70 (.0003) 0.99
F [26, 141] =692.14(.000)
HS 620349 0.142 0.419 (0.68) 0.97
F [22, 94] =199.90(.000)
HS 620439 -0.502 -1.148 (0.25) 0.94
F [21, 82] =71.87(.000)
HS 620462 -0.839*** -2.710 (.008) 0.95
F [19, 58] =72.81(.000)
HS 620520 -0.844*** -4.44 (.000) 0.99
F [29, 178] =571.39(.000)
HS 620590 -0.744*** -9.08 (.000)
0.99
F [30, 190] =942.82(.000)
Notes: *** and ** indicate the coefficients are significant at less than 1 percent and 10 percent level. Results are obtained from heteroscedasticity adjusted variance-covariance matrix. Heteroscedasticity adjusted estimated autocorrelation coefficient is checked. In almost all the cases autocorrelation coefficient is found to be very low which confirms that d is very close to 2. This has eliminated the possibility of getting serially correlated error structure in the estimated regression equations.
45

The Bangladesh Development Studies 46
The simple pass-through coefficients for ten sewed garment items are estimated and reported in Table II. The results are completely different from those of primary export categories and pass- through coefficients for the RMG items are mixed: complete, incomplete and even zero. The pass-through coefficients for different garment export categories lie in the range of -1.066 to 1.69. For most of the items, exporters of Bangladesh show zero pass-through. Zero pass-through implies that Bangladeshi exporters absorb the full change in the exchange rate and keep importers’ own-currency price constant. In the following pages, the results are described in detail.
For HS- 610910 (T-shirt knitted from cotton), ERPT coefficient is significantly complete (-1.06 here). HS-610990 (T-shirt made from textiles other than cotton), HS-620342 (cotton made men’s/boy’s trousers), HS-620462 (cotton made women’s/girls trousers), HS-620520 (men’s/boy’s cotton shirt), HS-620590 (men’s/boy’s shirts made from silk or textile materials other than cotton and synthetic fiber) are exhibiting incomplete (less than one) pass-through coefficient.
The most interesting finding of zero ERPT coefficients is obtained for five items of this sample - HS-611020 (cotton made sports jersey, pullover and cardigan), HS-620333 (men’s/boy’s jacket and blazer made from synthetic fiber), HS-620349 (men’s/boy’s trousers made from textile materials other than cotton), HS-620439 (women’s/girls’ jacket made from textile materials other than cotton and synthetic fiber). For HS-610990 (T-shirt knitted from textiles other than cotton), the estimated pass-through coefficient is positive (1.69) and significant as well. This gives us a completely different picture since the estimate implies that exporters, after facing depreciation, do not transmit any change to importers’ prices rather increase the buyer’s price and enjoy a big upward change in their own currency price which can only be possible if they have strong market power in the destination places.
Incidence of zero ERPT for low skill-intensive garments items can be due to several factors. All items chosen in the sample had enjoyed quota for about a decade in the United States. The export commodities subject to quantitative restrictions benefit from a kind of assured market. Since in the presence of operational quantity constraints foreign sales cannot be increased, the optimal strategy of exporters in response to a depreciation of taka would be to adjust their profit margins upward in order to keep importers’ currency prices stable to clear the market. But for some products that are also quantitatively restricted in the US
46

Hoque & Razzaque: Exchange Rate Pass-through in Bangladesh 47
market, incomplete pass-through coefficient (0<β <1) is obtained which may seem to be dubious after the aforementioned analysis. The fact is: incomplete pass-through coefficient can be obtained even after having quota if they are underutilized. So, for HS-610990, HS-620342, HS-620462, HS-620520 and HS-620590 estimates of incomplete pass-through may be the result of underutilized quota. Again, for HS-610910, complete pass-through may reveal severely underutilized quota, which compel exporters to cut prices significantly to maintain the market. These findings will further be examined in the following section.
IV.2 Destination Specific Pass-through Results: Pricing Behavior of Exporters
In this section, specification (4b) is estimated by using the Least Squares Dummy Variable (LSDV) method with country interaction effects to capture the difference, if there is any, in the prices charged by exporters to various destinations. The USA is taken as the base country for every commodity because in the sample it is a common destination market for each category.
In the previous section, the analysis was based on a simple pass-through model’s results, where the ERPT for a particular export commodity was found without any country specific estimates. In other words, although in the static model the magnitude of the pass-through by Bangladeshi exporters was observed but it could not be said whether in all the destinations the degree of pass-through was the same. Pricing strategy might be different for the same commodity across destinations because of differences in market conditions and demand patterns. If significantly different pass-through coefficients across destinations are observed for the same export category, it will have greater implications for exporter’s behavior in response to exchange rate changes.
Country specific ERPT results for HS-030613 (shrimps and prawns) are given in Table III to facilitate the pricing behavior analysis. For shrimps and prawns, the ERPT estimates for Canada, Germany, the UK and the USA are significantly different from zero. The most interesting finding is that for the UK where the direction of pass-through estimate is completely reverse compared to that in Canada, Germany and the USA. Higher demand of this item in the UK may be due to the fact that a large number of Bangladeshi immigrants are living there who might have a strong preference for home-country fish items.
As the demand for shrimps mainly comes from Bangladeshi migrants there, it might be insensitive to prices and, accordingly, shrimp exporters may enjoy the
47

The Bangladesh Development Studies 48
benefit of a relatively less elastic demand curve.8 It should also be noted that fixed country effects (reported in Tables A2 and A3 at appendix) for Canada, Germany and the UK reveal that market conditions and demand patterns in these countries are significantly different from the base USA and other countries in the sample. Pass-through coefficients for export destinations other than the above three i.e. Belgium- Luxemburg, Denmark, France, Japan, Malaysia, the Netherlands are not significantly different from zero.
Although complete pass-through was observed for leather items in the previous analysis, the results obtained from destination specific estimation (given in Table III) are quite striking, as export prices to Brazil, China, Hong Kong and Korea for HS-410429 (raw/semi-finished leather and bovine hides) exhibit different patterns compared to those of other countries. In addition, significant country effect for Hong Kong may reveal its distinct characteristics relative to others in the sample and tends to support the argument for sellers’ market power. Another leather item HS-410612 seems to exhibit complete pass-through in the US market without showing any significant discrepancy among other markets.
Discriminatory pricing across importers is also obtained for jute and jute goods –another major primary export item of the country. Results for all the jute items are reported in Table IV. It is observed that for every category, exporters are clearly displaying pricing to market (PTM) phenomenon. Exporters of the HS-530310 (raw jute and jute cuttings) have different pricing strategies in Iran, Ivory Coast and Pakistan while for HS-530710 (jute yarn), exporters show discriminatory behavior in the market of Japan, Korea, the Netherlands, the UK and the USA.
For the other three jute items, HS-531010, HS-560710 and HS-630510, discrepancy in pricing among importing countries has also been detected and notably, for all of these jute-good items, the US market exhibits complete pass-through. In fact, Iran, Japan and Pakistan are the three main jute importers from Bangladesh. But in the face of declining world demand for jute and jute items with
TABLE III
8Although there is no micro study on the demand pattern for Bangladeshi shrimps in the UK, but informal discussions with people exposure to the UK living styles confirm that Bangladeshi migrants in the UK have a very strong preference for Bangladeshi fish and shrimps.
48
Hoque & Razzaque: Exchange Rate Pass-through in Bangladesh 49
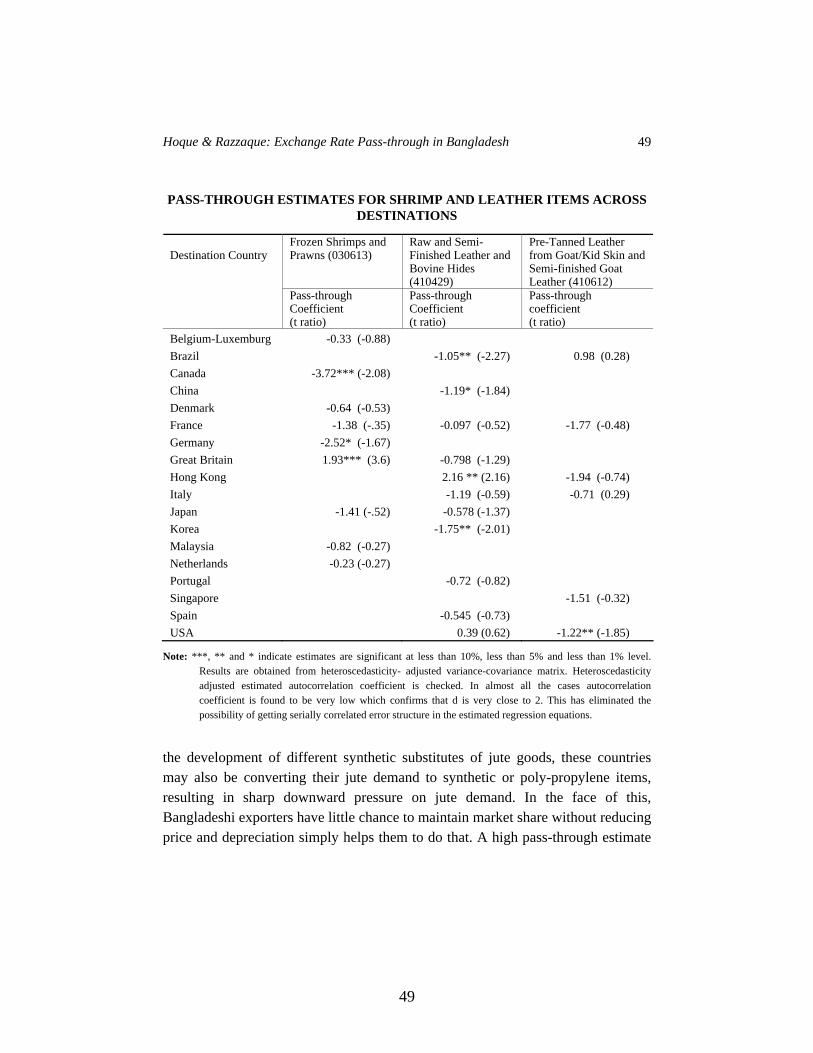
PASS-THROUGH ESTIMATES FOR SHRIMP AND LEATHER ITEMS ACROSS DESTINATIONS
Frozen Shrimps and Prawns (030613)
Raw and Semi-Finished Leather and Bovine Hides (410429)
Pre-Tanned Leather from Goat/Kid Skin and Semi-finished Goat Leather (410612)
Destination Country
Pass-through Coefficient (t ratio)
Pass-through Coefficient (t ratio)
Pass-through coefficient (t ratio)
Belgium-Luxemburg -0.33 (-0.88) Brazil -1.05** (-2.27) 0.98 (0.28) Canada -3.72*** (-2.08) China -1.19* (-1.84) Denmark -0.64 (-0.53) France -1.38 (-.35) -0.097 (-0.52) -1.77 (-0.48) Germany -2.52* (-1.67) Great Britain 1.93*** (3.6) -0.798 (-1.29) Hong Kong 2.16 ** (2.16) -1.94 (-0.74) Italy -1.19 (-0.59) -0.71 (0.29) Japan -1.41 (-.52) -0.578 (-1.37) Korea -1.75** (-2.01) Malaysia -0.82 (-0.27) Netherlands -0.23 (-0.27) Portugal -0.72 (-0.82) Singapore -1.51 (-0.32) Spain -0.545 (-0.73) USA 0.39 (0.62) -1.22** (-1.85)
Note: ***, ** and * indicate estimates are significant at less than 10%, less than 5% and less than 1% level. Results are obtained from heteroscedasticity- adjusted variance-covariance matrix. Heteroscedasticity adjusted estimated autocorrelation coefficient is checked. In almost all the cases autocorrelation coefficient is found to be very low which confirms that d is very close to 2. This has eliminated the possibility of getting serially correlated error structure in the estimated regression equations.
the development of different synthetic substitutes of jute goods, these countries may also be converting their jute demand to synthetic or poly-propylene items, resulting in sharp downward pressure on jute demand. In the face of this, Bangladeshi exporters have little chance to maintain market share without reducing price and depreciation simply helps them to do that. A high pass-through estimate
49

The Bangladesh Development Studies 50
of nearly two for Pakistan supports the above statement. Positive pass-through coefficients obtained in the cases of Korea and the Netherlands imply some sort of necessary usage of jute yarn that might not be substituted and, thus, relatively inelastic demand for exports, which let exporting firms to reduce their export price less than proportionately in the event of own currency depreciation.
Selected countries in the sample for knit and woven-garment items comprise essentially the USA and the EU members since these items are mainly exported to these places. Results of knit items are presented in Table V while that for woven items are in Table VI. Simple pass-through estimates are mixed - for HS-610910 (cotton T-shirt) pass-through is complete but for HS-610990 (T-Shirt Knitted from Other Textiles) and HS-611020 (Cotton-made Sports Jersey, Pullover and Cardigan) ERPT are positive and zero respectively. Interestingly, for the second item, HS-610990, all pass-through coefficients are positive but none of the destination specific estimates could register statistical significance even at the 10 percent level.
For woven items, discriminatory pricing is seen for all commodities in the sample except for HS-620349 (Men’s trouser made from textile materials other than cotton). Discrepancy in pricing between European Union countries and the USA is clearly demonstrated by the results given in Table VI. Outcome of this extensive form country based pricing analysis for woven exports gives wider view than that of aggregate analysis given in the previous part, where incomplete pass-through (less than one) is found for the second and last three items in the sample while zero pass-through is observed for the other three sample items. Most salient country specific pricing pattern is seen for the Netherlands that exhibits significantly different pricing for three of the seven sample-items compared to other countries in the sample which could be because of distinct demand pattern or availability of substitutes i.e. highly elastic demand for this commodities, but it needs further investigation which is beyond the scope of this paper.
TABLE IV
50

Hoque & Razzaque: Exchange Rate Pass-through in Bangladesh 51
DESTINATION SPECIFIC PASS-THROUGH COEFFICIENTS FOR JUTE AND JUTE-GOODS ITEMS
Raw Jute and Jute Cuttings (530310)
Jute Yarn (530710)
Jute Fabric, Jute-made Hessian Cloth, Sacking Cloth, Wool Pack and Black Cloth Jute Carpet (531010)
Jute Twines, Cordage and Ropes (560710)
Jute-made Sack And Bags used for Packing Goods (630510)
Destination
Country
Pass-through Coefficient (t ratio)
Pass-through Coefficient (t ratio)
Pass-through Coefficient (t ratio)
Pass-through Coefficient (t ratio)
Pass-through Coefficient (t ratio)
Australia -0.40 (-0.41) -1.03 (-0.12) Belgium- Luxemburg
-0.79 (-1.04) -0.95(-0.95) -1.05 (-0.98) -5.31 (-0.76) -0.92(-0.61)
China -0.63 (-0.91) Egypt -0.97 (-1.55) -0.73 (-0.56) -1.03(-0.64)France -1.69 (-0.39)Germany 0.44 (0.25) -0.82(-1.34) -1.40(-0.23)Great Britain -1.01(-1.27) -0.08*** (-3.86) -0.674** (-1.72) -2.66(-0.78)Greece -1.57 (-0.25) 0.97 (0.97)Iran -1.01*(-1.82) -1.03(-0.94) 1.01 (0.29) -0.63*** (-2.089) -1.07(-0.68)Ivory Coast -1.22* (-1.79) Japan -0.80**(-1.87) -1.60 (-0.44)Korea 0.42*** (2.27)ARE -2.69 (-0.09)Netherlands 0.31***(3.0)New Zealand -1.21 (-0.02)Pakistan -1.85***(-2.31) Papua New Guinea
-0.97(-0.68)
Saudi Arabia -1.06 (-0.69)Spain -0.99(-0.58) -1.74 (-0.26)Sudan -1.001 (0.75)Syria -0.61 (-0.97)Tanzania -1.36 (-0.33)Tunisia -1.41(-0.97) Turkey -0.97(1.22) -1.01 (-0.29) -1.001(-0.75)USA 0.20(0.29) -1.24***(-5.84) -1.23***(-2.03) -2.95***(-3.15) -1.69**(-1.88)Note: ***, ** and * indicate estimates are significant at less than 1%, less than 5% and less than 10% level.
Results are obtained from heteroscedasticity- adjusted variance-covariance matrix. Heteroscedasticity adjusted estimated autocorrelation coefficient is checked. In almost all the cases autocorrelation coefficient is found to be very low which confirms that d is very close to 2. This has eliminated the possibility of getting serially correlated error structure in the estimated regression equations.
51

The Bangladesh Development Studies 52
TABLE V DESTINATION SPECIFIC PASS-THROUGH ESTIMATES FOR KNIT-
GARMENT ITEMS
T-Shirt Knitted from Cotton (610910)
T-Shirt Knitted from Other Textiles
(610990)
Cotton-made Sports Jersey, Pullover and Cardigan
(611020)
Destination country Pass-through
coefficient (t ratio)
Pass-through coefficient
(t ratio)
Pass-through coefficient (t ratio)
Belgium-Luxemburg
0.83(0.45)
Canada -2.61(-1.43) Denmark -0.93(0.22) 1.51(-0.64) France 0.14 (1.00) Germany -0.35 (0.64) 1.394(0.11) 2.17(-0.36) Great Britain 0.16 (1.06) 3.75(1.32) -2.29*** (-2.13) Italy -2.94 (-0.89) Norway -0.65 (0.32) 0.57(0.45) Sweden -4.58* (-1.76) 0.54(0.87) USA -1.22(-1.31) 1.59 (1.29) 3.13 (1.47)
Note: ***, ** and * indicates estimates are significant at less than 1%, less than 5% and less than 10% level. Results are obtained from heteroscedasticity- adjusted variance-covariance matrix. Heteroscedasticity adjusted estimated autocorrelation coefficient is checked. In almost all the cases autocorrelation coefficient is found to be very low which confirms that d is very close to 2.This has eliminated the possibility of getting serially correlated error structure in the estimated regression equations.
General finding of destination specific pass-through estimation for knit and
woven items suggests none of these items have statistically significant pass-through coefficient in the US market, which actually reveals the fact that exporters of these items are completely unwilling to pass-through any change in the exchange rate to the US market. The US market subjects all these RMG items to quantitative restriction, and although the EU did not have any quota for Bangladesh but they imposed stringent “Rules of Origin” criterion for export of clothing items from Bangladesh.9 This information can explain to some extent the differences in pricing observed between the USA and the EU countries. In the former, the market is relatively certain due to quotas that give exporters some room to enjoy stable dollar export price whereas in the EU market, zero tariff 9 This restriction was active during the whole sample period chosen here i.e. 1989-2001 and, therefore, results obtained are not subject to biases arising from policy change or variation over time in the destination countries.
52

Hoque & Razzaque: Exchange Rate Pass-through in Bangladesh 53
TABLE VI DESTINATION SPECIFIC PASS-THROUGH ESTIMATES FOR WOVEN
GARMENTS ITEMS Men/Boys
Jacket /Blazer Made from
Synthetic Fiber (620333)
Cotton Made Men/Boys Trousers (620342)
Men’s Trouser Made from
other Textile Materials (620349)
Women/ Girls’ Jacket Made
from Textile Materials other than Cotton and Synthetic
Fiber (620439)
Cotton Made Women/ Girls’
Trousers (620462)
Men/Boy’s Cotton Shirt
(620520)
Men/Boy’s Shirts Made from Silk or Textile Materials other than Cotton/
Synthetic Fiber (620590)
Destination Country
Pass-through coefficient
(t ratio)
Pass-through coefficient
(t ratio)
Pass-through coefficient
(t ratio)
Pass-through coefficient
(t ratio)
Pass-through coefficient
(t ratio)
Pass-through coefficient
(t ratio)
Pass-through coefficient
(t ratio) USA 1.27
(1.49) -0.56
(-1.50) 0.112
(0.213) -0.24
(-0.43) -0.292 (-0.79)
-0.49 (-1.19)
-0.09 (-0.27)
Austria -0.48 (0.14)
-1.52 (-1.66)
-1.11** (-1.90)
Belgium-Luxemburg
0.50 (-0.62)
0.45** (1.83)
-0.42 (0.01)
-0.94 (-1.62)
Canada 1.92 (0.36)
0.51 (1.297)
1.19 (0.95)
0.94 (1.004)
1.11** (1.83)
-0.66 (-0.19)
-0.35 (-0.33)
Denmark -1.23 (-1.23)
-1.04*** (-2.41)
Germany -0.73 (-1.60)
-0.78 (-0.37)
-0.12 (-0.29)
-1.15 (-1.14)
-1.39*** (-2.09)
-0.81 (-0.53)
-0.69 (-0.77)
Great Britain
-1.49 (-1.69)
-0.14 (-0.34)
1.16** (1.82)
-0.24 (0.40)
-0.71 (-1.17)
France 0.30 (-0.77)
0.22 (1.39)
0.62 (0.66)
-0.53 (-0.36)
-1.042 (-1.43)
-0.71 (-0.35)
-1.45*** (-2.52)
Finland -2.27*** (-2.13)
-1.38** (-1.79)
Hong Kong -0.38 (0.19)
Italy -0.11 (-0.77)
-2.04** (-1.87)
-0.76 (-0.32)
-0.70) (-0.81)
Korea 0.71 (1.37)
Mexico -0.75** (-1.73)
Netherlands -2.12*** (-2.72)
-0.35 (0.37)
-0.37 (-0.62)
-2.63*** (-3.02)
-1.54*** (-2.41)
-0.58 (-0.16)
-0.89 (-1.49)
Norway
-1.60 (-1.41)
1.42 (1.29)
-0.89 (-0.62)
0.39
(1.09) 0.176 (0.39)
Sweden 0.49 (-0.44)
-0.102 (0.59)
-0.86 (-0.89)
-0.15 (0.08)
-1.19 (-1.21)
(-1.81) (-1.54)
-0.85 (-1.02)
Singapore -0.90 (-0.75)
-1.26 (-1.56)
-0.36 (-0.62)
Spain -1.56 (-1.34)
1.15 (1.00)
-0.45 (0.039)
-1.12 (-1.45)
N.B. ***, ** and * indicate estimates are significant at less than 1%, less than 5% and less than 10% level. Results are obtained from heteroscedasticity- adjusted variance-covariance matrix. Heteroscedasticity adjusted estimated autocorrelation coefficient is checked. In almost all the cases autocorrelation coefficient is found to be very low which confirms that d is very close to 2. This has eliminated the possibility of getting serially correlated error structure in the estimated regression equations.
53
The Bangladesh Development Studies 54
access under “Everything but arms” act renders exporters some privileges over giant competitors such as China and India but the Rules of Origin (RoO) criterion restricts exporters’ advantages.
Woven items have very low domestic value addition compared to the knit garments and, therefore, exporters of these items face serious competition from other external suppliers in those markets. Discriminatory pricing among destinations observed for woven items in the above table may be an indication of lower competitiveness of Bangladeshi exports. For woven exports, one additional point is its high degree of import dependence, which results in an increase in import cost in the face of depreciation of home currency and gives exporters little room to reduce prices by taking advantage of the changes in the exchange rate. The above stated reasons for different pricing strategies cannot be specified for any particular market and requires individual importer’s demand analysis, which is beyond the scope and objective of this paper.
Findings of discrepancy in pricing among buyers for different export items justify the extensive and market based analysis rather than relying simply on aggregate commodity based analysis. Country-specific estimation demonstrates discriminatory pricing among importers even for a commodity that exhibits zero pass-through in the aggregate analysis.
IV.3 Structure of Export Markets and Marginal Cost IV.3.1 Export Market Structure
For any export category, the destination market structures can be inferred by carefully investigating the fixed country effects and the exchange rate coefficients obtained during the estimation of ERPT to export prices.10 By using previous analysis and findings of regression models, several conclusions can be drawn about the export market structure for various commodities in the sample:
(a) Competitive and integrated export markets leading to the law of one price among the export destinations are to be ruled out for all export categories with the exception of HS410612 (pre-tanned leather from Goat kid and semi-finished Goat leather). For seventeen export categories in the sample, most of the fixed country effects are significantly different from zero, implying that mark-ups are nonzero with significant variation among destinations. For goat leather item, none of the destination country fixed effects are found to be statistically significant. In addition, at the aggregate level, the pass-through coefficient for this item seems to
10 Comments on destination market structure are based on fixed country effects found during simple commodity-specific pass-through analysis that are not reported here but available on request.
54

Hoque & Razzaque: Exchange Rate Pass-through in Bangladesh 55
be one, although during the destination specific pass-through estimation, no evidence of significant pass-through variation across destinations is found. This finding indicates that only for goat leather items the assumption of equal export pricing and thus integrated and perfectly competitive export market assumption may hold. For all other items, destination markets are neither integrated nor competitive.
(b) Another concern might be the demand elasticity that exporters of a particular commodity face across destinations. If the destination markets are imperfect and each of them is characterized by a constantly elastic demand curve, then price would be a constant mark-up over marginal cost in every destination although the magnitude of mark-up might differ between destinations. With a constantly elastic demand pattern, mark-up is irresponsive to prices and, as a result, exporters have no incentive to change the price. Consequently, in order to hold the imperfectly competitive market with constant elasticity hypothesis for an export destination, findings of zero β values along with the significant fixed country effects will be sufficient. In the estimated export pass-through model, 78 out of a total of 173 export markets simultaneously satisfy invariance of export prices with changes in the exchange rate and statistically significant country fixed effects. This implies that these markets are not competitive and changes in the exchange rate can have no impact on export prices.
(c) If the demand pattern in an export destination is less convex than a constantly elastic demand curve, elasticity increases with price such that mark-up decreases with the rise in price. In this case, exporters can increase their mark-ups by reducing prices and own currency depreciation gives them the opportunity to cut prices in the destination markets. Thirty export markets with statistically non-zero exchange rate coefficients and negative sign are identified to violate the constant elasticity hypothesis implying that a depreciation of taka leads to reduced export prices in these markets.
(d) Ten export markets in the sample display positive and statistically significant pass-through coefficients indicating that these markets are featured with demand pattern more convex than a constantly elastic demand curve. Here, demand patterns are such that the elasticity decreases with the rise in price, which necessarily implies that mark-ups can be increased by charging higher prices. Therefore, exporters’ increase price there in the face of depreciation.
IV.3.2 Estimated Time Effects Capture Changes in Marginal Costs Since the panel data framework with fixed time effects and country effects has
been used to analyze the pass-through behavior of Bangladeshi exporters, marginal
55

The Bangladesh Development Studies 56
Figure 4.1: estimated time effects as a measure of marginal cost for some primary and semi-
processed primary products
-0.8
-0.6
-0.4
-0.2
0
0.2
0.4
0.6
0.8
1989 1991 1993 1995 1997 1999 2001Frozen f ish and shrimp
Raw leather
pre-tanned goat leather
jute yarn
Figure 4.2: estimated time effects as a measure
of marginal cost for some Knit and Woven Categories
-0.6
-0.5
-0.4
-0.3
-0.2
-0.1
0
0.1
0.2
0.3
0.4
0.5
1989 1991 1993 1995 1997 1999 2001
610910620342620520620590
56

Hoque & Razzaque: Exchange Rate Pass-through in Bangladesh 57
cost variable is not required to be included explicitly in the model as time dummies control for the change in marginal cost over time. The basic idea is that a change in marginal cost is common across all export destinations and does not generate any idiosyncratic effects for any particular destination market. Figures 1 and 2 show the changes in estimated time effects for some commodities in the sample. The estimated time effects actually represent the changes in marginal costs of exporting firms over time. In both of the figures, the time effects trend upward over the sample period, which is the evidence of rising marginal cost. There are occasional yearly large shifts in marginal cost, especially for primary and semi-processed primary products. Time effects are represented here only for some commodities, but the general trend of the unreported commodities is also upward.
V. CONCLUDING REMARKS
This paper attempted an empirical investigation into the responsiveness of export prices to changes in the exchange rate for a wide variety of highly disaggregated export commodities of Bangladesh using a panel data framework. The findings in general reveal that the pass-through to export prices is commodity specific. With the exception of jute rope and cordage, for all other primary or processed primary export commodities in the sample, the exchange rate pass-through is complete. For the country’s dominant export item – RMG, the findings are mixed giving complete, incomplete and zero pass-through results. Commodity specific analysis does not reveal market specific actions of the exporters that might rather be accomplished by the destination specific analysis. Destination specific analysis shows that exporters of a commodity actually display distinctive pass-through behavior in various export markets. Even exporters of an item in some markets may not show any response to changes in the exchange rate despite the fact that at the commodity specific analysis, the commodity in question exhibits complete pass-through. Market specific pass-through estimates suggest that Bangladeshi exporters are capable of pricing according to market and price setting is mainly guided by their perception about demand pattern in the destination markets. In markets with a constantly elastic demand pattern, exporters are found not to response to exchange rate changes, while in the cases of relatively less elastic demand patterns, exporters seem to display complete pass-through behavior. However, for demand pattern with high elasticity relative to the constant case, exporters are strikingly observed to increase destination currency export prices, which are at odds with the small country assumption.
57

The Bangladesh Development Studies 58
In the US market, the largest single RMG export market of Bangladesh, exporters appear to be totally insensitive to changes in the exchange rate. The US market for RMG has long been subjected to quota restrictions. Under such quantitative restrictions, with the prevailing high quota utilization rate, exporters have no incentive to cut prices to clear the market. Therefore, the zero pass-through evidence for RMG in the US market could be attributed both to a constant elastic demand pattern and quantitative restrictions.
Despite the findings of complete pass-through in cases of commodity specific analysis, the evidence of exporters’ pricing to market behavior found in destination specific analysis implies that exporters consider depreciation as an incentive for competitive pricing in most of the cases, which makes their argument for devaluation justified to some extent.
Last but not the least, in interpreting the findings and in deriving the policy implications thereof, we must remember the “Lucas Critique.” The main argument of this critique is that econometric estimates must be treated cautiously when there is a major change in the policy regime from the period based on which the econometric work is done. Bangladesh has recently experienced two major regime changes. The first one is the shift from the managed exchange rate regime to a fully-floating exchange rate regime, which implies that currency depreciations are likely to be market phenomenon rather than policy decision. The other shift in the regime is the abolition of the MFA quantitative restrictions on the imports of textiles and clothing items from developing countries (including Bangladesh) to developed country markets.11 It is in this context the findings of this paper must be used carefully, especially if interpretation and policy implications in a forward-looking manner are to be drawn.
11 Bangladesh’s export of RMG was subject to MFA quotas mainly in the US market. Under the EU-GSP scheme Bangladesh has enjoyed duty-free and quota-free access to the EU market since the late 1980s. After the abolition of MFA quota from the beginning of 2005, Bangladesh has quota-free access to the US market, but, unlike the EU market, MFN duties are still applicable to Bangladesh’s exports.
58

Hoque & Razzaque: Exchange Rate Pass-through in Bangladesh 59
REFERENCES Athukorala 1991: P. Athukorala, “Exchange Rate Pass-Through: The Case of Korean
Exports of Manufactures,” Economics Letters, Vol. 35(1), pp.79-84. Athukorala & Menon 1994: P. Athukorala and J. Menon, “Pricing-to-Market Behavior and
Exchange Rate Pass-Through in Japanese Exports,” Economic Journal, Vol. 104, pp.271-81.
Feenstra 1989: Robert. C. Feenstra, “ Symmetric Pass-Through of Tariffs and Exchange Rates Under Imperfect Competition: An Empirical Test,” Journal of International Economics.
Froot, Kim & Rogoff 1995: Kenneth A Froot, Michael Kim and Kenneth Rogoff, “The Law of One Price Over 700 Years.” NBER Working Paper No. 5132.
Froot & Klemperer 1989: Kenneth A Froot and Paul P Klemperer, “Exchange Rate Pass-Through When Market Share Matters,” American Economic Review.
Knetter & Goldberg 1997: Pinelopi K. Goldberg and Michael. M Knetter, “Goods Prices and Exchange Rates: What Have We Learned?” Journal of Economic Literature, Vol. 35.
Gagnon & Knetter 1995: Joseph E. Gagnon and Michael M Knetter, “Markup Adjustment and Exchange Rate Fluctuations: Evidence from Panel Data on Automobile Exports,” Journal of International Money and Finance.
Gosh & Holger 1994: R. W. Gosh and C. Holger, “Pricing in International Markets: Lessons from The Economists,” NBER Working Paper No. 4806.
Goldberg & Knetter 1995: Pinelopi. K. Goldberg and Michael Knetter, “Measuring The Intensity of Competition in Export Markets,” NBER Working Paper. No.5226.
Hooper & Mann 1989: P Hooper and C Mann, “Exchange Rate Pass-Through in the 1980s: The Case of U.S Imports of Manufactures,” Brookings Pap. Econ. Act.
Han & Suh 1996: Han Sung-Shin and Suh Hwan Seoung, “Exchange Rate Pass-Through And the J-curve: An Analysis of the Korean Case,” Journal of Policy Modeling, Vol. 18(1), pp. 69-86.
Knetter 1993: Michael M. Knetter, “International Comparison of Pricing-To-Market Behavior,” American Economic Review, Vol. 83, pp. 473-86.
Knetter 1989: Michael M. Knetter 1989: “Price Discrimination by U.S and German Exporters,” The American Economic Review, Vol.79 (1).
Kasa 1992: Kenneth Kasa, “Adjustment Costs and Pricing to Market: Theory and Evidence,” Journal of International Economics.
Krenin 1977: Mordechai E. Krenin, “The Effect of Exchange Rate Changes on the Price and Volume of Foreign Trade,” International Monetary Fund Staff Papers.
59

The Bangladesh Development Studies 60
Krugman 1987: Paul Krugman, “Pricing to Market When the Exchange Rate Changes,” in Real-financial Linkages Among Open Economies, Eds: Sven W. Arndt and J. David Richardson, Cambridge: MIT Press.
Marston 1990: Marston Richard, “Pricing to Market in Japanese Manufacturing,” Journal of International Economics.
Ministry of Commerce 2004: Ministry of Commerce, GOB, “Trade Liberalization and Export Response: Post-MFA Policy Implications for Bangladesh,” Study Prepared for an Input for the Preparation of the Poverty Reduction Strategy Paper (PRSP) June, 2004.
Pareja 2000: Salvador G. Pareja, “Exchange Rate and European Countries’ Export Prices: An Empirical Test for Asymmetries in Pricing to Market Behavior,” Weltwirtschaftliches Archiv, Vol. 136(1).
Razzaque, Osafa-Kwaako & Grynberg 2004: Mohammad A. Razzaque, Philip Osafa-Kwaako & Roman Grynberg, “Commodity Prices, Aid and Debt: Implications for LDCs, Small Vulnerable States and HIPCs,” Commonwealth Economic Paper Series, Economic Affairs Division, Commonwealth Secretariat.
Swift 1998: Robyn Swift, “Exchange Rate Pass-Through: How Much Do Exchange Rate Changes Affect the Prices of Australian Exports?” Australian Economic Papers.
Takagi & Yoshida 1999: Shinji Takagi and Yushi Yoshida, “Exchange Rate Movements and Tradable Goods Prices in East Asia: An Analysis Based on Japanese Customs Data, 1988-98,” IMF Working Paper.
Toshiko 1997: Tange Toshiko, “Exchange Rates and Export Prices of Japanese Manufacturing” Journal of Policy Modeling, Vol. 19(2), pp. 195-206.
UNCTAD 2004: United Nations Conference on Trade and Development, “The Least Developed Countries Report 2004 - Linking International Trade with Poverty Reduction,” United Nations Publication, Geneva.
60

Hoque & Razzaque: Exchange Rate Pass-through in Bangladesh 61
APPENDIX
TABLE A.1 DESCRIPTION OF EXPORT COMMODITIES IN THE SAMPLE
Commodity Code Description of the Commodity HS 030613 Frozen Shrimps and Prawns HS 410429 Raw and Semi-finished Leather and Bovine Hides HS 410612 Pre-Tanned Leather from Goat/Kid Skin and Semi-Finished Goat Leather HS 530310 Raw Jute and Jute Cuttings HS 530710 Yarn of Jute (Single, Multiple or Cable) HS 531010 Jute Fabric, Jute-made Hessian Cloth, Sacking Cloth, Wool Pack and
Black Cloth Jute Carpet HS 560710 Jute Twines, Cordage and Ropes HS 610910 T-Shirt Knitted from Cotton HS 610990 T-Shirt Knitted from Other Textiles HS 611020 Cotton-made Sports Jersey, Pullover and Cardigan HS 620333 Men/Boys Jacket Blazer made from Synthetic Fiber HS 620342 Cotton Made Men/ Boys Trousers HS 620349 Men’s Trouser made from other Textile Materials HS 620439 Women/Girls’ Jacket made from Textile Materials other than Cotton and
Synthetic Fiber HS 620462 Cotton Made Women/ Girls’ Trousers HS 620520 Men/Boy’s Cotton Shirt HS 620590 Men/Boy’s Shirts Made from Silk or Textile Materials other than Cotton
and Man-Made Fiber HS 630510 Jute-made Sack And Bags Used for Packing Goods
61

The Bangladesh Development Studies 62
TABLE A.2 FIXED COUNTRY EFFECTS FOR PRIMARY AND SEMI-PROCESSED PRIMARY GOODS FROM DESTINATION SPECIFIC PASS-THROUGH
ANALYSIS
HS 030613
HS 410429
HS 410612
HS 530310
HS 530710
HS 531010
HS 560710
HS 630510
Fixed Country Effect (t ratio) Australia Austria 0.85
(0.79) 0.32
(0.28)
Belgium-Luxemburg 9.22 (1.77)
-0.38 (0.22)
-0.19 (0.17)
-0.28 (-0.16)
-2.81 (-0.69)
0.69 (0.14)
Brazil 1.39 (0.71)
0.22 (0.11)
Canada 5.00 (1.74)
China 1.86 (0.89)
0.48 (0.36)
Denmark 0.61 (0.32)
Egypt 1.18 (0.35)
-3.32 (-0.84)
6.16 (0.96)
France -12.62 (-3.44)
0.19 (0.04)
0.51 (0.32)
1.54 (0.40)
Germany -0.89 (-0.52)
0.89 (0.57)
0.31 (0.46)
-0.70 (-0.31)
Great Britain -0.65 (-0.37)
-4.37 (-2.42)
1.27 (1.18)
0.16 (0.44)
-0.42 (-0.24)
-1.20 (-1.03)
Greece 0.44 (0.38)
-1.48 (-0.63)
Hong Kong 3.11 (0.48)
-0.07 (-0.02)
Iran 1.21 (1.06)
0.76 (1.53)
-0.19 (-0.13)
-1.95 (-0.45)
-1.09 (-0.40)
Italy 0.83 (0.57)
0.51 (0.24)
Ivory Coast -3.57 (-1.33)
Japan -1.35 (-0.48)
-1.27 (-0.34)
2.18 (1.89)
1.20 (0.40)
Korea 1.49 (0.54)
-1.74 (-1.59)
Malaysia 0.75 (0.27)
Netherlands 0.23 (0.09)
0.46 (1.27)
New Zealand 0.29 (0.27)
Pakistan 2.52 (0.42)
Papua New Guinea -1.96 (-0.81)
Portugal -3.86 (-1.09)
62

Hoque & Razzaque: Exchange Rate Pass-through in Bangladesh 63
(TABLE A.2 Continued) HS
030613 HS
410429 HS
410612 HS
530310 HS
530710 HS
531010 HS
560710 HS
630510 Fixed Country Effect (t ratio) Saudi Arabia 5.05
(0.75)
Singapore -0.42 (-0.15)
Spain -0.76 (-0.30)
-3.40 (-2.32)
-0.56 (-0.12)
Sudan -3.74 (-1.47)
-1.45 (-0.83)
Syria -0.87 (-0.73)
Tanzania 1.82 (0.39)
Tunisia
Turkey 1.17 (1.09)
1.34 (0.46)
-1.72 (-1.28)
USA -0.30 (-0.21)
1.37 (1.09)
-0.75 (-0.42)
-1.47 (-0.30)
0.27 (0.74)
0.60 (0.11)
2.15 (0.49)
-0.66 (-0.56)
63
The Bangladesh Development Studies 64
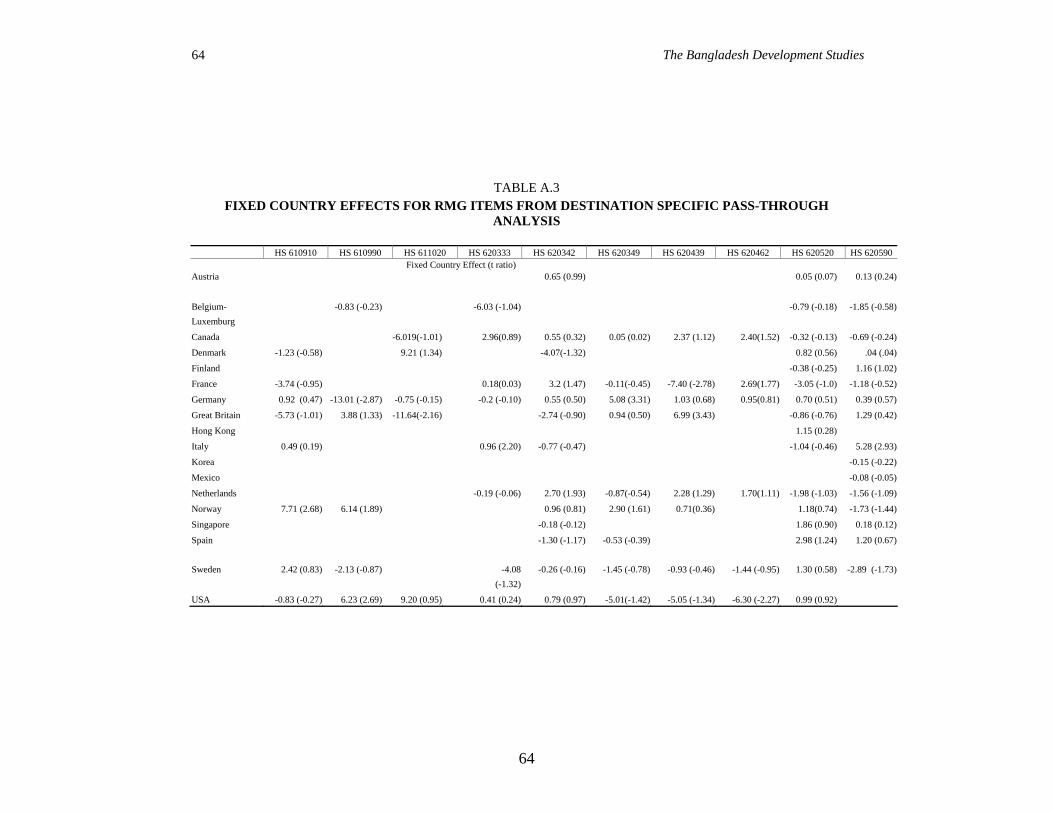
TABLE A.3
FIXED COUNTRY EFFECTS FOR RMG ITEMS FROM DESTINATION SPECIFIC PASS-THROUGH ANALYSIS
HS 610910 HS 610990 HS 611020 HS 620333 HS 620342 HS 620349 HS 620439 HS 620462 HS 620520 HS 620590 Fixed Country Effect (t ratio) Austria 0.65 (0.99) 0.05 (0.07) 0.13 (0.24)
Belgium-Luxemburg
-0.83 (-0.23) -6.03 (-1.04) -0.79 (-0.18) -1.85 (-0.58)
Canada -6.019(-1.01) 2.96(0.89) 0.55 (0.32) 0.05 (0.02) 2.37 (1.12) 2.40(1.52) -0.32 (-0.13) -0.69 (-0.24)
Denmark -1.23 (-0.58) 9.21 (1.34) -4.07(-1.32) 0.82 (0.56) .04 (.04)
Finland -0.38 (-0.25) 1.16 (1.02)
France -3.74 (-0.95) 0.18(0.03) 3.2 (1.47) -0.11(-0.45) -7.40 (-2.78) 2.69(1.77) -3.05 (-1.0) -1.18 (-0.52)
Germany 0.92 (0.47) -13.01 (-2.87) -0.75 (-0.15) -0.2 (-0.10) 0.55 (0.50) 5.08 (3.31) 1.03 (0.68) 0.95(0.81) 0.70 (0.51) 0.39 (0.57)
Great Britain -5.73 (-1.01) 3.88 (1.33) -11.64(-2.16) -2.74 (-0.90) 0.94 (0.50) 6.99 (3.43) -0.86 (-0.76) 1.29 (0.42)
Hong Kong 1.15 (0.28)
Italy 0.49 (0.19) 0.96 (2.20) -0.77 (-0.47) -1.04 (-0.46) 5.28 (2.93)
Korea -0.15 (-0.22)
Mexico -0.08 (-0.05)
Netherlands -0.19 (-0.06) 2.70 (1.93) -0.87(-0.54) 2.28 (1.29) 1.70(1.11) -1.98 (-1.03) -1.56 (-1.09)
Norway 7.71 (2.68) 6.14 (1.89) 0.96 (0.81) 2.90 (1.61) 0.71(0.36) 1.18(0.74) -1.73 (-1.44)
Singapore -0.18 (-0.12) 1.86 (0.90) 0.18 (0.12)
Spain -1.30 (-1.17) -0.53 (-0.39) 2.98 (1.24) 1.20 (0.67)
Sweden 2.42 (0.83) -2.13 (-0.87) -4.08(-1.32)
-0.26 (-0.16) -1.45 (-0.78) -0.93 (-0.46) -1.44 (-0.95) 1.30 (0.58) -2.89 (-1.73)
USA -0.83 (-0.27) 6.23 (2.69) 9.20 (0.95) 0.41 (0.24) 0.79 (0.97) -5.01(-1.42) -5.05 (-1.34) -6.30 (-2.27) 0.99 (0.92)
64