“exchange plaza”,
TRANSCRIPT
Adani Green Energy Limited Tel +91 79 2555 5555 Adani Corporate House, Shantigram, Fax +91 79 2555 5500 Nr Vaishno Devi Circle, S G Highway [email protected] Khodiyar, Ahmedabad 382 421 www.adanigreenenergy.com Gujarat, India CIN: L40106GJ2015PLC082007
Registered Office: Adani Corporate House, Shantigram, Nr. Vaishno Devi Circle,
S G Highway, Khodiyar, Ahmedabad – 382 421, Gujarat, India
Date: October 11, 2021
To
BSE Limited The National Stock Exchange of India Limited
P J Towers, “Exchange Plaza”,
Dalal Street, Bandra – Kurla Complex,
Mumbai – 400 001 Bandra (E), Mumbai – 400 051
Scrip Code: 541450 Scrip Code: ADANIGREEN
Dear Sir,
Sub: Intimation under Regulation 30 of the SEBI (Listing Obligations and
Disclosures Requirements) Regulations, 2015 – Provisional operational update:
Q2 - FY22
Pursuant to Regulation 30 of the SEBI (Listing Obligations and Disclosure
Requirements) Regulations, 2015, provisional operational update of the
Company for the Q2 of the Financial Year 2021-22 is attached herewith.
You are requested to take the same on your record.
Thanking You
Yours Faithfully,
For, Adani Green Energy Limited
Pragnesh Darji
Company Secretary

Consolidated
Adani Green Energy Limited
Provisional Operational Update(Consolidated)
Q2 FY22
CONTENTS
1 Adani Portfolio
2 AGEL: Company Profile
3 AGEL: Operational Update for Q2 FY22
Annexure - AGEL (incl. RG1 & RG2) : Operational Update - H1 FY22

Renewables
Adani Portfolio
3

4
Adani
• Marked shift from B2B to B2C businesses–
• ATGL – Gas distribution network to serve key geographies across India
• AEML – Electricity distribution network that powers the financial capital of India
• Adani Airports – To operate, manage and develop eight airports in the country
• Locked in Growth –
• Transport & Logistics -Airports and Roads
• Energy & Utility – Water andData Centre
Adani Group : A world class infrastructure & utility portfolio
1 . As on Sep 14, 2021, USD/INR – 73 | Note - Percentages denote promoter holding & Light blue color represent public traded listed verticals
2. NQXT – North Queensland Export Terminal | 3. ATGL – Adani Total Gas Ltd | 4. Data center, JV with EdgeConneX
Transport & LogisticsPortfolio
APSEZPort & Logistics
100% 60.2%63.8% 75%
75%
100% 75% 37.4%
ATLT&D
APL IPP
NQXT2 AGELRenewables
ATGL3
Gas DisCom
Energy & UtilityPortfolio
SRCPLRail
AELIncubator
~USD 123 bn1
Combined Market Cap
AAHLAirports
100% 100%100% 50%
AWLWater
ARTLRoads
AdaniConneX4
Data Centre
Opportunity identification, development and beneficiation is intrinsic to diversification and growth of the group.

5
Adani Group : Decades long track record of industry best growth rates across sectors
25%
132%
Industry AGEL
30%
45%
Industry AGL
7%
20%
Industry ATL
Port Cargo Throughput (MMT)
Renewable Capacity (GW) Transmission Network (ckm) CGD7 (GAs8 covered)
Adani Adani
2016 320,000 ckm 6,950 ckm
2021 441,821 ckm 18,801 ckm
2014 972 MMT 113 MMT
2021 1,246 MMT 247 MMT
2016 46 GW 0.3 GW
2021 140 GW9 19.3 GW6
2015 62 GAs 6 GAs
2021 228 GAs 38 GAs
Transformative model driving scale, growth and free cashflow
3x 5x 3x 1.5x
Note: 1 Data for FY21; 2 Margin for ports business only, Excludes forex gains/losses; 3 EBITDA = PBT + Depreciation + Net Finance Costs – Other Income; 4 EBITDA Margin represents EBITDA earned from power supply 5 . Operating EBITDA margin of transmission business only, does not include distribution business. 6. Contracted & awarded capacity 7. CGD – City Gas distribution 8. GAs - Geographical Areas - Including JV | Industry data is frommarket intelligence 9. This includes 17GW of renewable capacity where PPA has been signed and the capacity is under various stages of implementat ion and 29GW of capacity where PPA is yet to be signed’
Highest Margin among
Peers globally
EBITDA margin:70%1,2
Next best peer margin: 55%
World’s largest solar
power developer
EBITDA margin: 91%1,4
Among the best in Industry
APSEZ ATLAGEL ATGL
Highest availability
among Peers
EBITDA margin: 92%1,3,5
Next best peer margin: 89%
India’s Largest private CGD
business
EBITDA margin: 41%1
Among the best in industry
4%
12%
Industry APSEZ

6
Adani Group: Repeatable, robust & proven transformative model of investmentA
cti
vit
yP
erf
orm
an
ce
OperationsDevelopment Post Operations
• Analysis & market intelligence
• Viability analysis
• Strategic value
• Site acquisition
• Concessions and regulatory agreements
• Investment case development
• Engineering & design
• Sourcing & quality levels
• Equity & debt funding atproject
• Life cycleO&M planning
• Asset Management plan
• Redesigning the capital structure of assets
• Operational phase funding consistentwith asset life
Site Development Construction Operation Capital MgmtOrigination
India’s Largest Commercial Port (at Mundra)
Longest Private HVDC Line in Asia
(Mundra – Mohindergarh)
Energy Network Operation Center (ENOC)
Centralized continuous monitoring of solar and wind plants across India on a single cloud based platform
648 MW Ultra Mega Solar Power Plant
(at Kamuthi, Tamil Nadu)
Highest Margin among Peers
Highest lineavailability
Constructed and Commissioned in ninemonths
March 2016 March 2021
55%31%
14%
Phase
PSU Pvt. Banks Bonds
Revolving project finance facility of$1.35Bn at AGEL – fully funded projectpipeline
First ever GMTN1 of USD 2Bn by anenergy utility player in India - an SLB2 inline with COP26 goals - at AEML
Issuance of 20 & 10 year dual tranchebond of USD 750 mn - APSEZ the onlyinfrastructure company to do so
Green bond issuance of USD 750 mnestablishes as India’s leading credit inthe renewable sector
Debt structure moving from PSU banks to Bonds
30%
20%
50%
1. GMTN – Global Medium Term Notes 2. SLB – Sustainability Linked Bonds

7
AGEL : Replicating Group's Simple yet Transformational Business Model
1. Excluding a small merchant solar capacity of 50 MW2. Average tariff for locked-in growth of 19.8 GW3. EBITDA margin from power supply in FY214. As per ranking by Mercom Capital
PPA - Power Purchase Agreement ; ENOC: Energy Network Operations Centre ; EBITDA: Earnings before Interest, tax, depreciation & amortization; IG: Investment Grade
World's largest solar power developer 4, well positioned for industry leading growth
Development
Operations
Value Creation
91% 3
PPA life: 25 years Tariff profileFixed tariff
Access to International marketsDiversified sources of funding
Elongated maturities up to 20 years
100% Contracted Capacity 1
Efficient Capital Management Investment Grade (IG) Ratings
Average Portfolio tariff : INR 3.14/unit 2
First IG rated Issuance At OPCO level
Broaden capital pools - 144A, REG S, REG D, Indian bond markets
Secure Sites & Connectivity
200,000 acres
Resource rich Sites in strategic locations
~ 31 GW potential 85+ Wind data locations
Solar resource assessment completed
Resource Assessment Construction Readiness
Geotechnical studies and detailed design planning,
simulations completed
ENOC
Technology enabled O&M
Analytics driven O&M with AI based technology to
maximize generation and perform predictive
maintenance
Industry leading EBITDA margin
Sweat assets to its fullest (Highest Generation) +
Lowest Operating Costs = Highest EBITDA per MW
US$ 1.35bn
Fully Funded Growth
Revolving construction facility from international banks to fully fund under construction pipeline
US$ 750 mnHoldCo green bonds to meet funding needs at SPVs

8
Adani TotalEnergies Renewable Partnership
– Amongst Largest infrastructure and real asset platform in India
– Deep expertise and experience in developing large scale infrastructure projects in India
– Fully integrated energy player in India
– Deep capital management capabilities in the platform across other infrastructure sub sectors
– Strong supply chain integration
– Entered renewable sector in India through AGEL in 2015 and setup the then largest solar power project in the world as its first project
– Ambition to add 25 GW by 2025
– One of the largest energy players in the world & a leading liquefied natural gas player globally
– Presence across 130 countries
– Huge focus on adding renewable energy footprint, target to add 35 GW renewable capacity by 2025
– Operating renewable projects all over the world
– Deep focus on new renewable energy technology R&D to reduce cost of energy and assist in grid adoption
– Adani and TotalEnergies have formed a “strategic alliance” across renewables, city gas distribution, LNG terminals.
– TotalEnergies owns 20% stake 1 in AGEL and 50% Stake 2 in Adani Green Energy Twenty-Three Limited
TotalEnergies has board representation in AGEL and is present on Audit Committee of AGEL
Adani Group and TotalEnergies have a long-term partnership and commitment to expanding the renewable footprint through AGEL
Embedded Teams in micro plant O&M and development for exchanging ideas and best practices
Adani and TotalEnergies jointly working to achieve global best practices of governance
R&D: Research & Development; O&M: Operations and Management; LNG: Liquified Natural Gas1. Through Total Renewables SAS 2. Total Solar Singapore Pte Ltd

Renewables
Adani Green Energy LimitedCompany Profile
9

10
AGEL: Transformational Renewable Company
1. The capacities include 150 MW operational wind assets under acquisition from Inox2. Letter of Award received and PPA to be signed3. Excluding a small merchant solar capacity of 50 MW
4x Locked-in Growth 1
Wind Solar
Solar-Wind Hybrid
130
1,220
885
20
1,085
12
100
650
225
648
395
9,470
4,080
250
324
Operational Under exec../ Near Const.
Ranked as Largest Solar Power Developer in the World by US based MERCOM Capital
Pan India Presence
300
Operational - Jul 2021 Locked-in Growth
Existing
Operational Locked-In Growth
5,410
19,834
Renewable Capacity (in MW)
4,763
647
15,393
1,701
2,740
Solar Wind Hybrid
5,410 MWOperational
19,834 MW Locked-in
Growth
Source-wise Capacity Breakup (in MW)
100% Contracted portfolio 3
87% Sovereign/ sovereign equivalent rated Counterparties
Portfolio spread across 11 resource-rich states18 different counterparties
5,410 MW – Operational
5,724 MW – Under execution
8,700 MW – Near Construction 2
19,834 MW - Locked-in Growth
40

11
Adani Green Energy LimitedOperational Update

12
AGEL: Operational Highlights – Q2 FY22
• Total Operational Capacity nearly doubles to 5,410 MW on YoY basis
• Added SB Energy’s well-maintained high quality operational solar portfolio of 1,700 MW having Plant availability of ~ 100%, Grid availability of near 100% and High CUF of 26.4%
Continued Robust Operational performance backed by adoption of latest technology & analytics driven O&M
• Sale of Energy up by 61% YoY at 1,901 mn units in Q2 FY22 vs. 1,182 units in Q2 FY21
• 70 bps YoY improvement in Solar portfolio CUF at 21.4% with ~ 100% plant availability
• 1,260 bps YoY improvement in Wind portfolio CUF at 42.9% with 97% plant availability
Capacity Addition
Operational Performance 1
1. The operational performance reported above does not include performance of 1,740 MW operational solar assets acquired at the end of Sep 2021 and 150 MW operational wind assets under acquisition from Inox.

10171430
165
471
Q2 FY21 Q2 FY22
Sale of Energy YoY
Wind
Solar
AGEL: Operational Capacity Addition & Sale of Energy
1. Includes 150 MW operational wind plants under acquisition from Inox.
13
✓ Operational Capacity increases by 2,610 MW on YoY basis
❑ 725 MW Green field commissioning:
- 475 MW solar plants
- 250 MW wind plants
❑ 1,885 MW inorganic addition operational solar capacity
✓ Out of the above, 1,740 MW Operational Capacity added on Sep 30, 2021:
- Completed acquisition of SB Energy’s 4,954 MW Indiarenewable portfolio including 1,700 MW operational solarassets from SoftBank and Bharti group
- Completed acquisition of 40 MW operational solar assets inOdisha from Essel Green Energy
Operational Capacity and Sale of Energy continue to grow exponentially
2,403
4,763397
647
Q2 FY21 Q2 FY22
Operational Capacity YoY (in MW AC)Wind
Solar93% `
15,410
2,8001
1,182
1,901`61%

AGEL: Solar Portfolio Performance in Q2 FY22 YoY
• Sale of Energy up by 41% on the back of:
- Capacity increase from 2,403 MW to3,023_MW YoY (1)
- 70 bps improvement in CUF
• Improved CUF performance backed by:
- Consistently high plant availability
- 390 bps improvement in grid availability
Solar portfolio continues its robust performance backed by ~ 100% plant availability
99.6% 99.5%
Q2 FY21 Q2 FY22
Plant Availability
14
1. The operational performance reported above does not include performance of 1,740 MW operational solar assets acquired at the end of Sep 2021.
Note: Operational performance stated above includes 4 mn units for non-capitalized plants
94.9% 98.8%
Q2 FY21 Q2 FY22
Grid Availability
20.7% 21.4%
Q2 FY21 Q2 FY22
CUF (AC)
1017
1430
Q2 FY21 Q2 FY22
Sale of Energy (mn units)
`41%

AGEL: Wind Portfolio Performance in Q2 FY22 YoY
• Sale of Energy up by 185% YoY backed by:
- Capacity increase from 247 MW to 497_MW YoY (1)
- 1,260 bps improvement in CUF
• Improved overall CUF performance backed by
- Technologically advanced and more efficient newlyadded Wind Turbine Generators (WTGs)
- 210 bps improvement in plant availability
- Improved wind speed
Significant improvement in Wind CUF with technologically advanced WTGs & improved plant availability
15
1. The operational performance reported above does not include performance of 150 MW under acquisition from Inox.
Note: Operational performance stated above includes 105 mn units for non-capitalized plants
WTG: Wind Turbine Generator
94.9% 97.0%
Q2 FY21 Q2 FY22
Plant Availability
99.9% 100.0%
Q2 FY21 Q2 FY22
Grid Availability
30.3%
42.9%
Q2 FY21 Q2 FY22
CUF (AC)
165
471
Q2 FY21 Q2 FY22
Sale of Energy (mn units)
`185%

AGEL: Historical Performance of recently acquired SB Energy Portfolio
• Successfully closed acquisition of SB Energy that houses 4,954 renewable assets, including 1,700 MW operational assets in Sep 2021.
• Addition of a well-maintained high quality renewable portfolio would lead to value creation for AGEL:
- Plant availability maintained at ~ 100%
- Grid availability at near 100%
- High annual CUF of 26.4%
Value accretive addition of a high quality operational solar portfolio
16
99.9% 99.7%
FY21 H1 FY22
Plant Availability
99.8% 99.2%
FY21 H1 FY22
Grid Availability
26.4% 26.2%
FY21 H1 FY22
CUF (AC)
3233
1823
FY21 H1 FY22
Sale of Energy (mn units)

Thank You
17

Renewables
18
AnnexureAGEL (incl. RG1 & RG2): Operational Update - H1 FY22

AGEL: Solar Portfolio Performance in H1 FY22 YoY
• Sale of Energy up by 40% on the back of:
- Capacity increase from 2,403 MW to3,023_MW YoY (1)
- 50 bps improvement in CUF
• Improved CUF performance backed by:
- Consistently high plant availability
- 230 bps improvement in grid availability
Solar portfolio continues its robust performance backed by ~ 100% plant availability
19
99.6% 99.6%
H1 FY21 H1 FY22
Plant Availability
96.1% 98.4%
H1 FY21 H1 FY22
Grid Availability
22.7% 23.2%
H1 FY21 H1 FY22
CUF (AC)
2203
3080
H1 FY21 H1 FY22
Sale of Energy (mn units)
`40%
1. The operational performance reported above does not include performance of 1,740 MW operational solar assets acquired at the end of Sep 2021.
Note: Operational performance stated above includes 4 mn units for non-capitalized plants
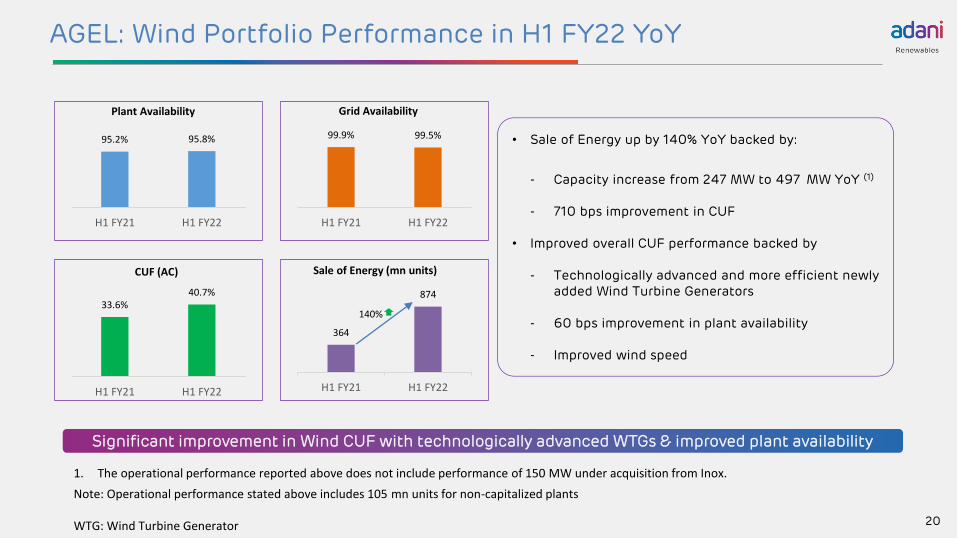
AGEL: Wind Portfolio Performance in H1 FY22 YoY
• Sale of Energy up by 140% YoY backed by:
- Capacity increase from 247 MW to 497_MW YoY (1)
- 710 bps improvement in CUF
• Improved overall CUF performance backed by
- Technologically advanced and more efficient newlyadded Wind Turbine Generators
- 60 bps improvement in plant availability
- Improved wind speed
Significant improvement in Wind CUF with technologically advanced WTGs & improved plant availability
20
95.2% 95.8%
H1 FY21 H1 FY22
Plant Availability
99.9% 99.5%
H1 FY21 H1 FY22
Grid Availability
33.6%40.7%
H1 FY21 H1 FY22
CUF (AC)
364
874
H1 FY21 H1 FY22
Sale of Energy (mn units)
`140%
1. The operational performance reported above does not include performance of 150 MW under acquisition from Inox.
Note: Operational performance stated above includes 105 mn units for non-capitalized plants
WTG: Wind Turbine Generator

AGEL: 930 MW RG1 Portfolio Performance in H1 FY22 YoY
• Sale of Energy up by 1% on the back of 20bps improvement in CUF
• Improved CUF performance backed by:
- 20 bps improvement in plant availability
- Consistent grid availability
- Consistent solar irradiation
Plant availability improves to 99.7% demonstrating the O&M excellence through ENOC
21
99.5% 99.7%
H1 FY21 H1 FY22
Plant Availability
99.1% 99.1%
H1 FY21 H1 FY22
Grid Availability
23.3% 23.5%
H1 FY21 H1 FY22
CUF (AC)
952 958
H1 FY21 H1 FY22
Sale of Energy (mn units)
ENOC: Energy Network Operation Center

AGEL: 570 MW RG2 Portfolio Performance in H1 FY22 YoY
• Plant availability improves from 99.8% to 99.9%demonstrating the O&M excellence
• Plant availability improvement compensates fordecrease in grid availability to maintain consistentsale of energy
Plant availability improves to 99.9% demonstrating the O&M excellence through ENOC
22
99.8% 99.9%
H1 FY21 H1 FY22
Plant Availability
99.1% 98.7%
H1 FY21 H1 FY22
Grid Availability
26.4% 26.2%
H1 FY21 H1 FY22
CUF (AC)
661 656
H1 FY21 H1 FY22
Sale of Energy (mn units)
ENOC: Energy Network Operation Center