examples of use of local ecological knowledge in greenland 1
Post on 20-Dec-2015
217 views
TRANSCRIPT

Examples of use of Local Ecological Knowledge in Greenland
1

2
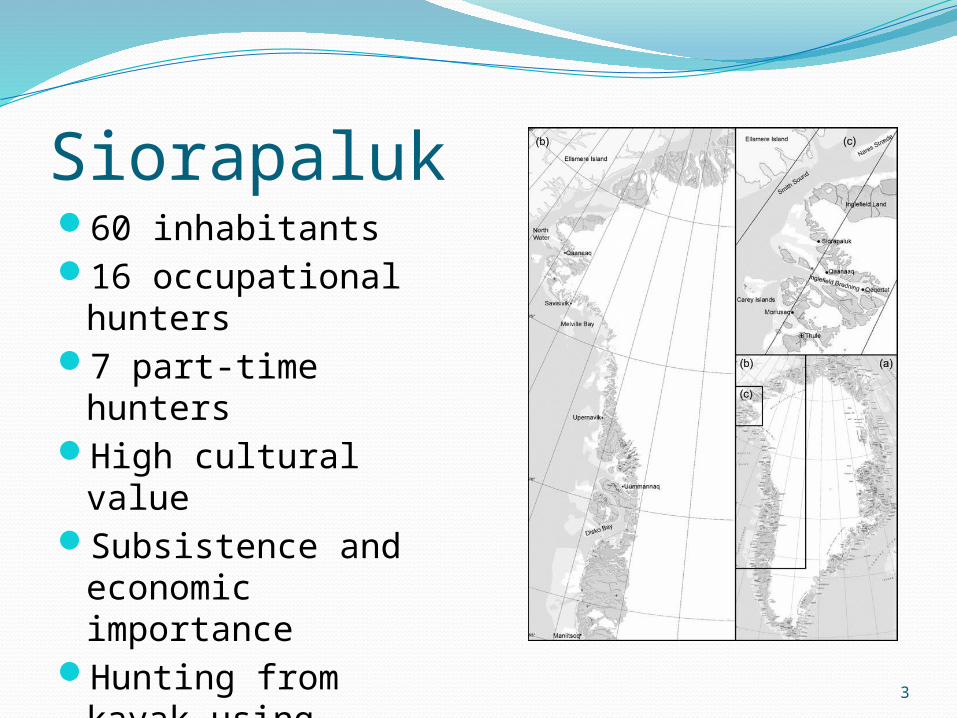
Siorapaluk60 inhabitants16 occupational
hunters7 part-time huntersHigh cultural valueSubsistence and
economic importance
Hunting from kayak using harpoons
3
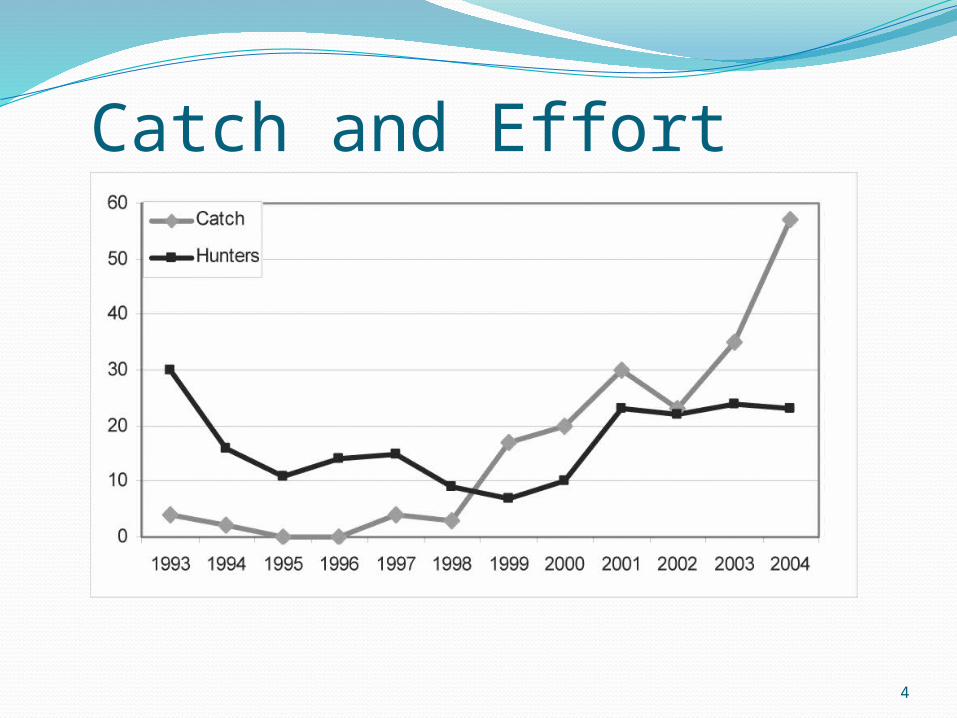
Catch and Effort
4

Distribution of the catch
5

Trends in narwhal (Monodon monoceros) stocks and options for co-management in East Greenland: An investigation of CPUE and potential impacts of quotas on Inuit communities
Martin R. Nielsen & Henrik Meilby
6

East Greenland• Little knowledge on abundance and stock deliniation• Cultural implications of quotas and regulation meassures
7

Climate variations
8
Ice cover trends
Year
1993 1994 1995 1996 1997 1998 1999 2000 2001 2002 2003 2004
Me
an a
nn
ual
ice
co
ver
0.0
0.2
0.4
0.6
0.8
1.0
IttoqqortormiitIce cover = 25.9 - 0.0126 YearR2 = 0.53
AmmassalikIce cover = 28.0 - 0.0138 YearR2 = 0.46
Fig. 2. Data and variation of mean annual ice cover in Ittoqqortormiit (filled circles) and Ammassalik (open circles) and linear regressions with 95% confidence intervals (dashed) of the expected value.

Tab. 2. Regression coefficients with standard errors in brackets of the model (see text) describing the variation in ice cover including trend and lag effect. *, ** and *** signify statistical significance at 0.1, 0.05 and 0.01 levels, respectively.
Variable Statistics
Ittoqqortormiit*January 60.69 (20.36)*** Ittoqqortormiit*February 60.82 (20.36) *** Ittoqqortormiit*March 60.59 (20.36) *** Ittoqqortormiit*April 60.77 (20.32) *** Ittoqqortormiit*May 60.28 (20.29) *** Ittoqqortormiit*June 59.77 (20.25) *** Ittoqqortormiit*July 59.32 (20.22) *** Ittoqqortormiit*August 59.04 (20.20) *** Ittoqqortormiit*September 59.04 (20.21) *** Ittoqqortormiit*October 59.98 (20.24) *** Ittoqqortormiit*November 61.34 (20.28) *** Ittoqqortormiit*December 60.65 (20.33) *** Ammassalik*January 60.06 (20.28)*** Ammassalik*February 60.32 (20.28)*** Ammassalik*March 60.42 (20.29)*** Ammassalik*April 60.89 (20.27)*** Ammassalik*May 61.05 (20.26)*** Ammassalik*June 59.61 (20.25)*** Ammassalik*July 59.30 (20.21)*** Ammassalik*August 59.29 (20.19)*** Ammassalik*September 59.21 (20.20)*** Ammassalik*October 58.71 (20.21)*** Ammassalik*November 59.58 (20.22)*** Ammassalik*December 60.15 (20.24)*** Year -0.03 (0,01)*** Average temperature -0.05 (0.02)** Average wind speed -0.11 (0.04)*** Ice cover (month-1) 0.52 (0.05)**** N 278 R-square 0.89 Root MSE 0.526
9
Slight but significant negative trend in ice cover

Climate variations
10
IttoqqortormiitIc
e c
ove
r
0.0
0.2
0.4
0.6
0.8
1.0 PredictedObserved
Ammassalik
Year
1993 1994 1995 1996 1997 1998 1999 2000 2001 2002 2003 2004 2005
Ice
co
ver
0.0
0.2
0.4
0.6
0.8
1.0 PredictedObserved
Fig. 3. Observed versus predicted ice cover (model in Tab. 2) in Ittoqqortormiit and Ammassalik municipalities in the period 1993- 2004.

Catch per unit effort
11
Tab. 3. Poisson regression model (see text) describing the variation of quarterly catch per unit effort as a function of municipality, quarter of the year, hunter status (part time, full time or inactive), year, ice cover and number of active hunters (part- and full-time altogether). Regression coefficients with standard errors in brackets. *, ** and *** signify statistical significance at 0.1, 0.05 and 0.01 levels, respectively; NS = not significant.
Variable Statistics Ittoqqortormiit*1st.quarter -9.05 (1.17)*** Ittoqqortormiit*2nd.quarter -8.74 (1.06) *** Ittoqqortormiit*3rd.quarter -9.47 (1.02) *** Ittoqqortormiit*4th.quarter -10.07 (1.05) *** Ammassalik*1st.quarter -13.61 (1.16)*** Ammassalik*2nd.quarter -12.33 (1.15)*** Ammassalik*3rd.quarter -10.84 (1.12)*** Ammassalik*4th.quarter -13.67 (1.14)*** Part time hunters 6.23 (1.00)*** Full time hunters 7.74 (1.00)*** Inactive hunters 0.00 (0.00) (Year-1990)* Ittoqqortormiit 0.041 (0.02)** (Year-1990)*Ammassalik 0.165 (0.02)*** (Ice cover)3 -4.09 (0.67)*** Number of active hunters -0.0008 (0.0008)NS N 69184 Deviance 5627.75 Scaled deviance 5627.75 Pearson Chi-squared 86305.81 Scaled Pearson X2 86305.81 Log likelihood -2645.87
The results indicate a positive trend considering effort and climate

Catch per unit effort
12
Ammassalik
Year
1993 1994 1995 1996 1997 1998 1999 2000 2001 2002 2003 2004 2005
To
tal c
atc
h
0
20
40
60
Ittoqqortormiit
To
tal c
atc
h
0
20
40
60 Predicted, All huntersObserved total catch
Fig. 4. Observed versus predicted catch (model in Tab. 3) in Ittoqqortormiit and Ammassalik municipalities in the period 1993- 2004.

Catch per unit effort
13
Harvest trends
Year
1993 1994 1995 1996 1997 1998 1999 2000 2001 2002 2003 2004
To
tal a
nn
ua
l ca
tch
10
100
Ittoqqortormiitln(Catch) = -44 + 0.022 YearR2 = 0.08
Ammassalikln(Catch) = -120 + 0.062 YearR2 = 0.51
Fig 6. Development in total annual catch, 1993-2004. Solid lines are predictions based on the model in Tab. 3. Broken lines are trend curves and dotted lines 95% confidence intervals for the predicted trend curves. NB: logarithmic scale on ordinate axis. The slope parameter of regressions indicate annual growth rates.
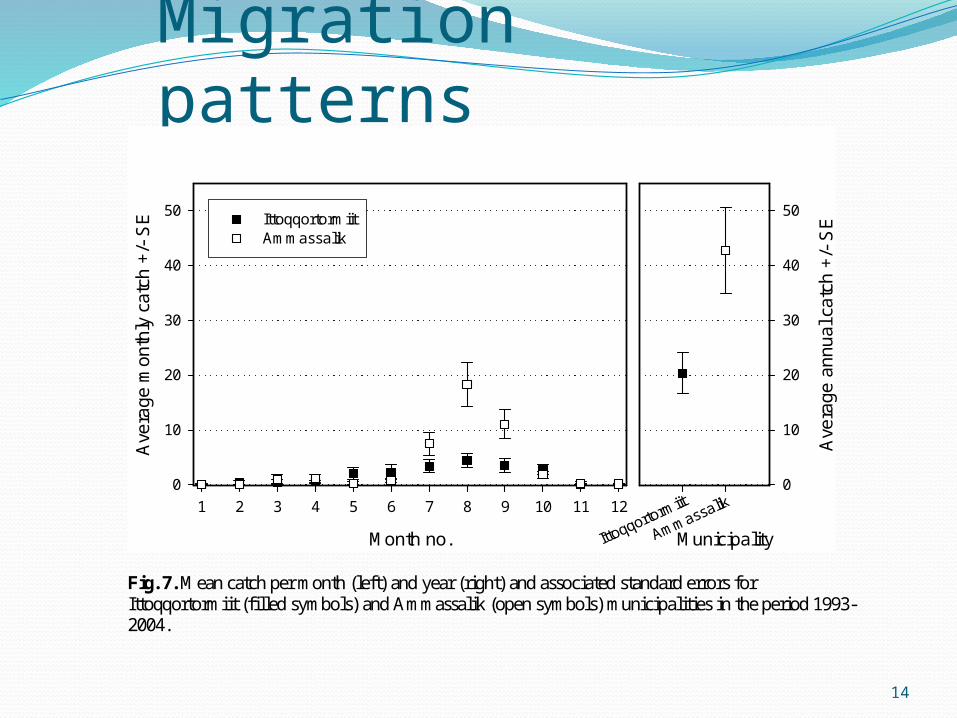
Migration patterns
14
Month no.
1 2 3 4 5 6 7 8 9 10 11 12
Ave
rage
mon
thly
cat
ch +
/- S
E
0
10
20
30
40
50IttoqqortormiitAmmassalik
MunicipalityIttoqqortormiit
Ammassalik
Ave
rage
ann
ual c
atch
+/-
SE
0
10
20
30
40
50
Fig. 7. Mean catch per month (left) and year (right) and associated standard errors for Ittoqqortormiit (filled symbols) and Ammassalik (open symbols) municipalities in the period 1993-2004.

Migration patterns
15
Tab. 4. Correlation between catch in one of the municipalities and catch in the other municipality until three months previously. *, ** and *** signify statistical significance at 0.1, 0.05 and 0.01 levels, respectively. Months previously in other municipality 0 1 2 3 Ammassalik 0.23*** (n=144) 0.22** (n=144) 0.22*** (n=143) 0.18** (n=141) Ittoqqortormit 0.23*** (n=144) 0.14* (n=143) 0.04 (n=142) -0.16* (n=141)

Attitudes towards regulationsWest Greenland• Applauded increased control
with allocation of occupational hunter permits, exclusion of people without appropriate equipment and experience, and further restrictions on part-time hunters’ access to quotas and proportion of the quota
• People above the official retirement age and people receiving disability retirement benefits should not be able to hold a occupational hunting license
East Greenland• Opposed to any
distinction between occupational and part time hunt
• Elder hunters have an important function in handing down experience and the suggestion was considered unacceptable.
16
LessonsLEK represents a largely untapped potential
in Greenland LEK could inform national and local
management decisionsTo fully integrate LEK in management
decisions co-management agreements should be established
Use the cost efficient data potential in systematically recorded observations by the hunters
Pay close attention to stakeholder incentives in the use of LEK
17