examples of practicable application - ground-zero … initial measurement of the subwoofer or...
TRANSCRIPT
Examples of practicable application
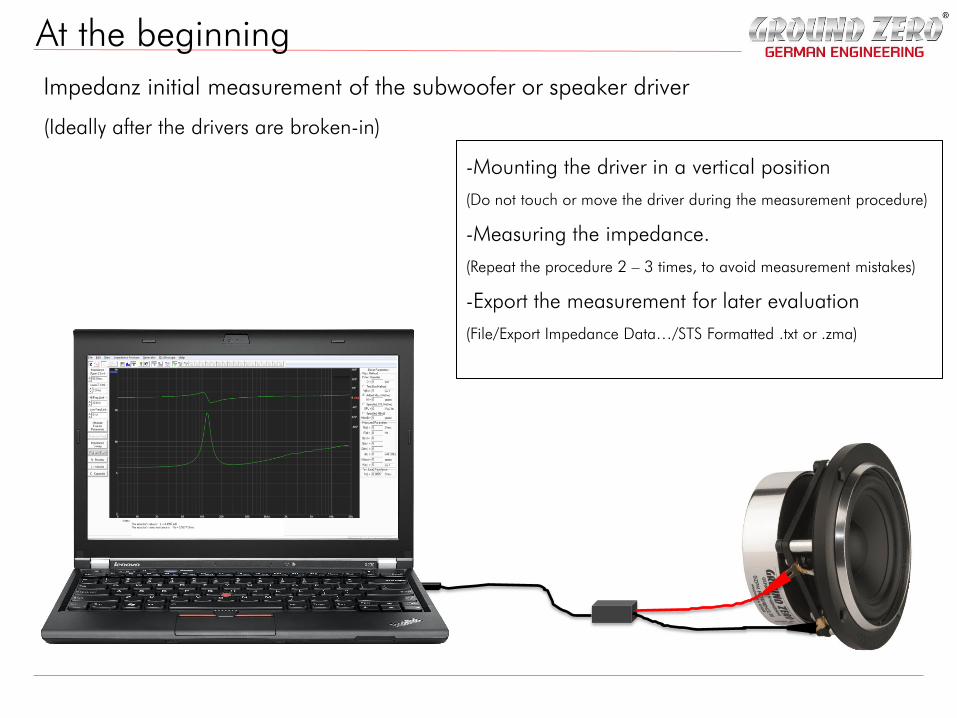
At the beginning
Impedanz initial measurement of the subwoofer or speaker driver
(Ideally after the drivers are broken-in)
-Mounting the driver in a vertical position
(Do not touch or move the driver during the measurement procedure)
-Measuring the impedance.
(Repeat the procedure 2 – 3 times, to avoid measurement mistakes)
-Export the measurement for later evaluation
(File/Export Impedance Data…/STS Formatted .txt or .zma)
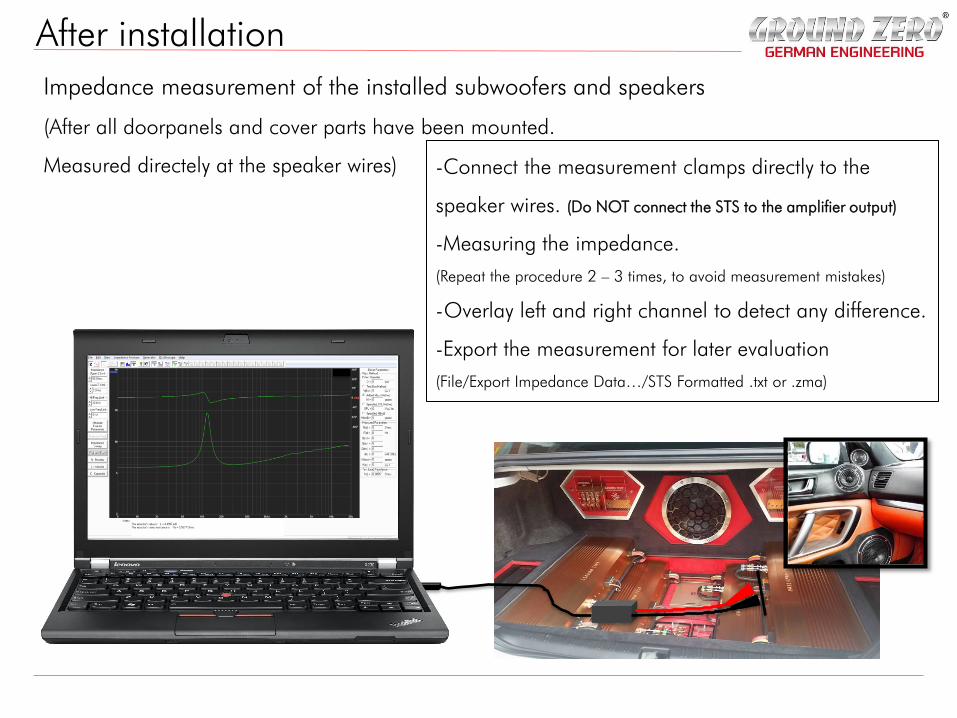
After installation
Impedance measurement of the installed subwoofers and speakers
(After all doorpanels and cover parts have been mounted.
Measured directely at the speaker wires) -Connect the measurement clamps directly to the
speaker wires. (Do NOT connect the STS to the amplifier output)
-Measuring the impedance.
(Repeat the procedure 2 – 3 times, to avoid measurement mistakes)
-Overlay left and right channel to detect any difference.
-Export the measurement for later evaluation
(File/Export Impedance Data…/STS Formatted .txt or .zma)
Interpretation
The measurement results will give important information -Defective drivers or wires (shortage, interruption, rubbing voice coils or similar defects)
-Faulty installation, like cover parts which touch speaker cone or surround.
-Wrong box tuning and leaky enclosures.
-Weak performance because of high impedance rise and wrong amplifier selection.
Interpretation
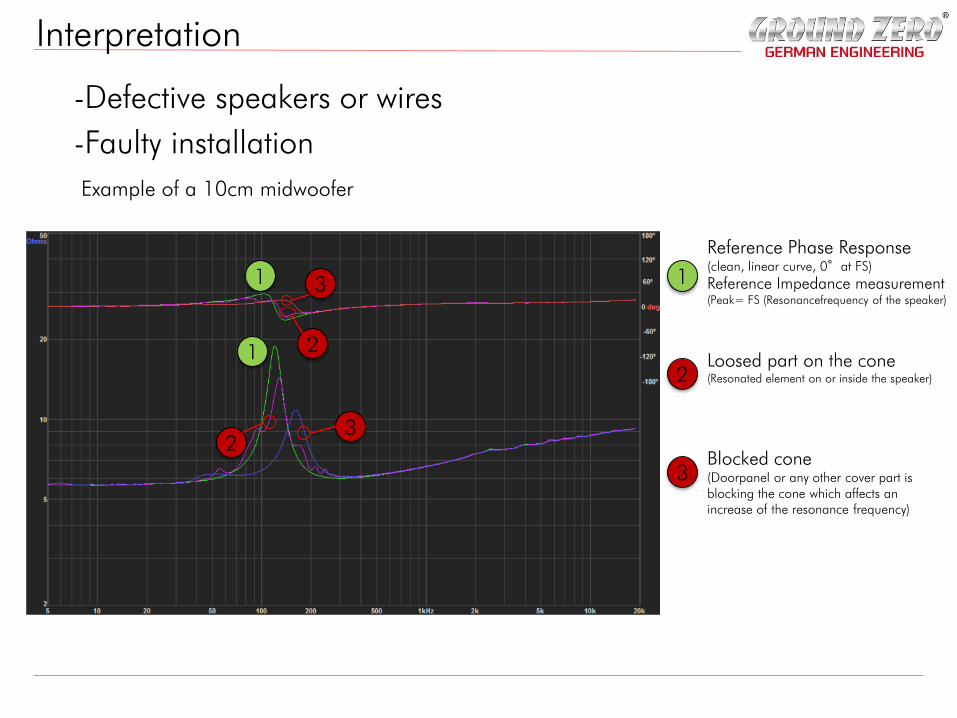
-Defective speakers or wires
Example of a 10cm midwoofer
Reference Impedance measurement (Peak= FS (Resonancefrequency of the speaker)
1
1
1
Reference Phase Response (clean, linear curve, 0°at FS)
2
2
3
3
2 Loosed part on the cone (Resonated element on or inside the speaker)
3 Blocked cone (Doorpanel or any other cover part is blocking the cone which affects an increase of the resonance frequency)
-Faulty installation
Interpretation
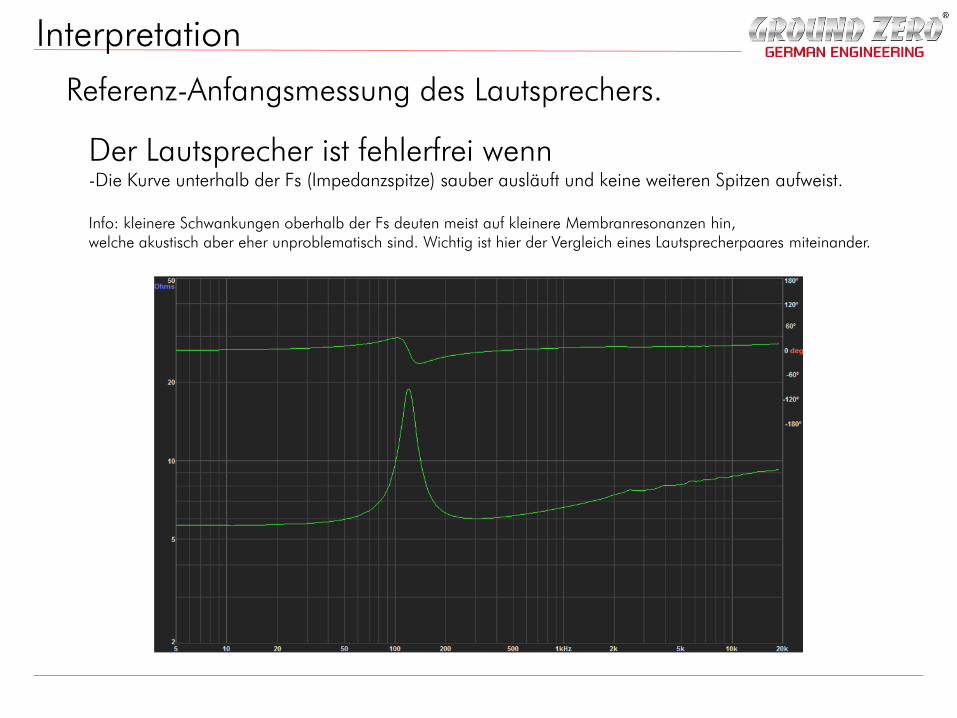
Referenz-Anfangsmessung des Lautsprechers.
Der Lautsprecher ist fehlerfrei wenn -Die Kurve unterhalb der Fs (Impedanzspitze) sauber ausläuft und keine weiteren Spitzen aufweist. Info: kleinere Schwankungen oberhalb der Fs deuten meist auf kleinere Membranresonanzen hin, welche akustisch aber eher unproblematisch sind. Wichtig ist hier der Vergleich eines Lautsprecherpaares miteinander.
Interpretation
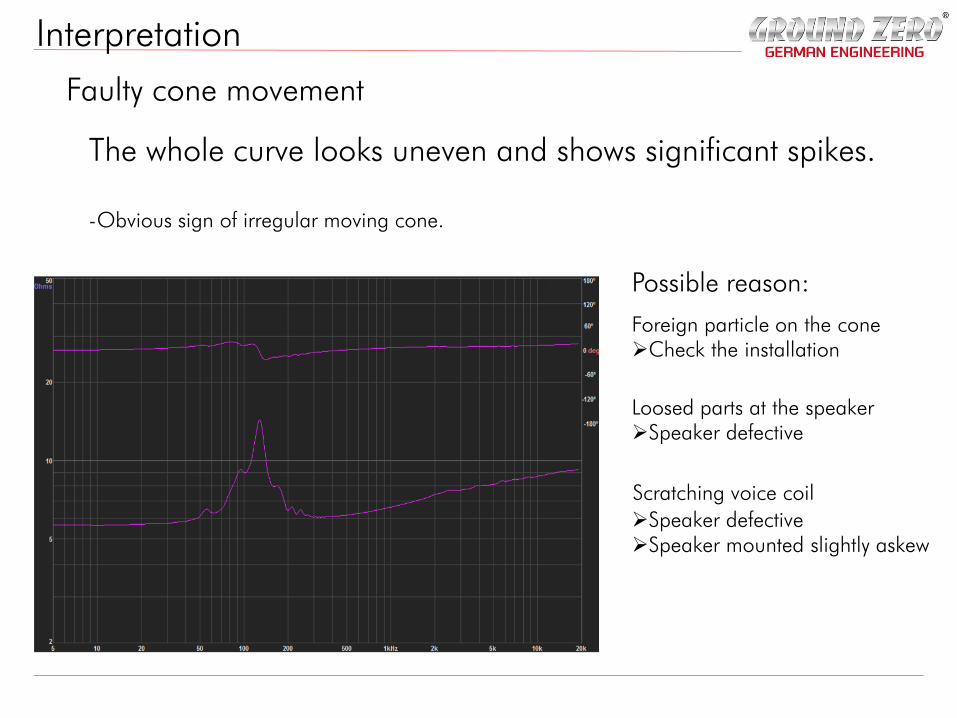
Faulty cone movement
The whole curve looks uneven and shows significant spikes. -Obvious sign of irregular moving cone.
Possible reason: Foreign particle on the cone
Scratching voice coil
Loosed parts at the speaker
Check the installation
Speaker defective
Speaker defective Speaker mounted slightly askew
Interpretation
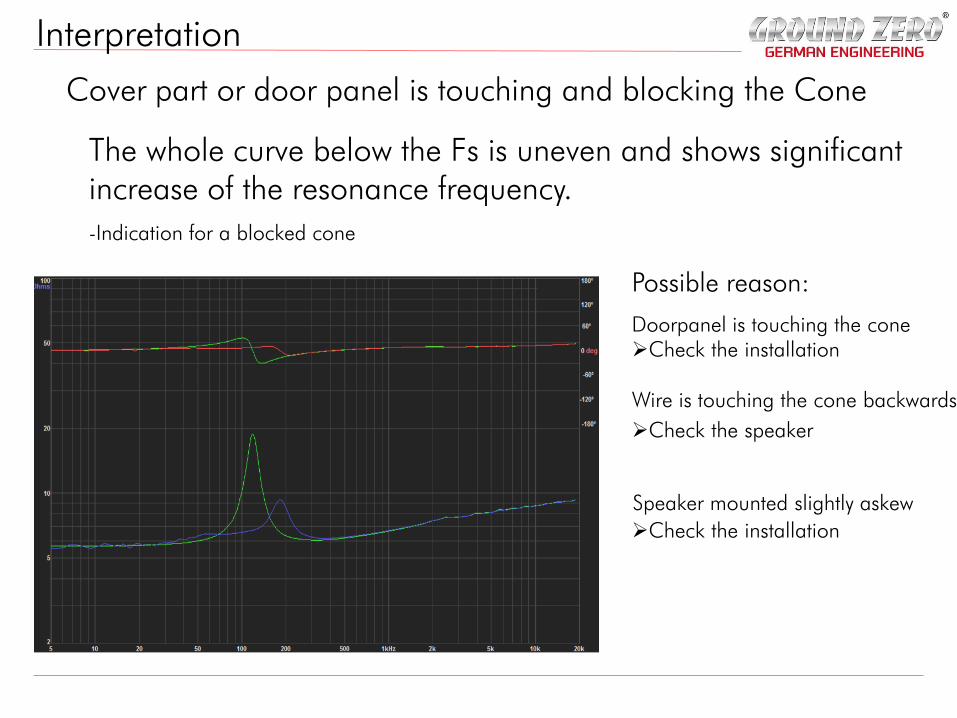
Cover part or door panel is touching and blocking the Cone
The whole curve below the Fs is uneven and shows significant increase of the resonance frequency.
-Indication for a blocked cone
Possible reason: Doorpanel is touching the cone
Speaker mounted slightly askew
Wire is touching the cone backwards
Check the installation
Check the speaker
Check the installation
Interpretation
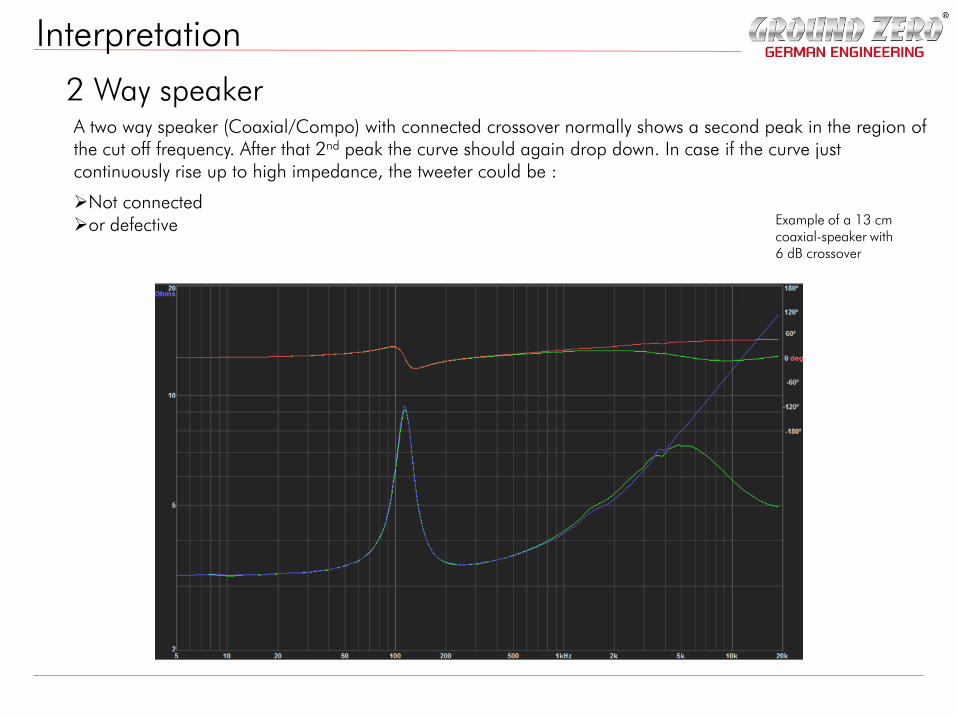
2 Way speaker A two way speaker (Coaxial/Compo) with connected crossover normally shows a second peak in the region of the cut off frequency. After that 2nd peak the curve should again drop down. In case if the curve just continuously rise up to high impedance, the tweeter could be :
Example of a 13 cm coaxial-speaker with 6 dB crossover
Not connected or defective
Interpretation
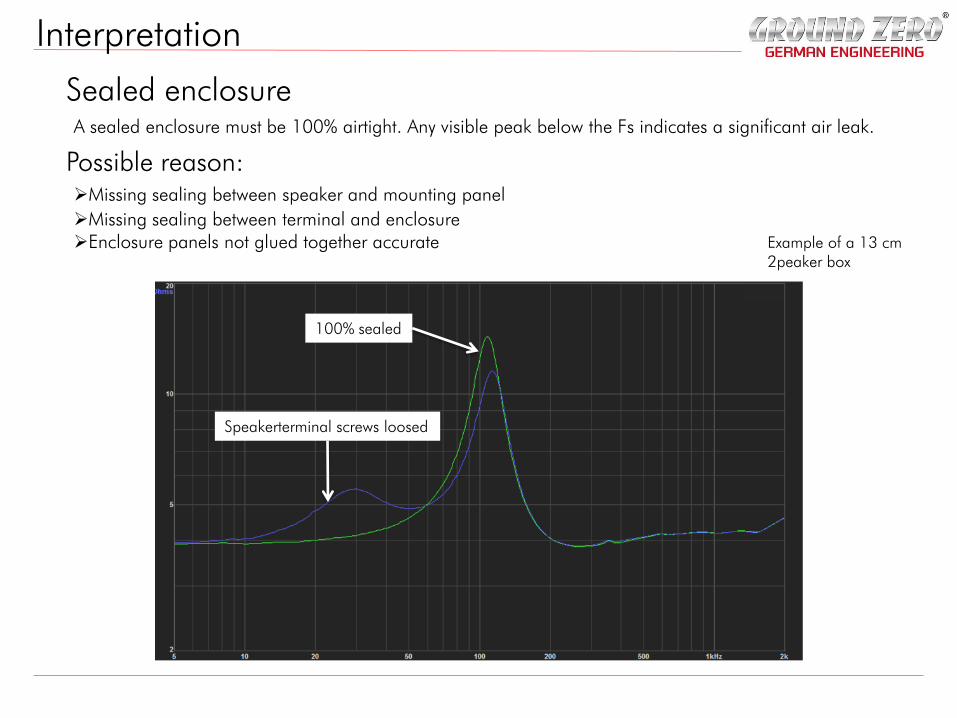
Sealed enclosure A sealed enclosure must be 100% airtight. Any visible peak below the Fs indicates a significant air leak.
Example of a 13 cm 2peaker box
100% sealed
Speakerterminal screws loosed
Missing sealing between speaker and mounting panel
Missing sealing between terminal and enclosure Enclosure panels not glued together accurate
Possible reason:
Interpretation
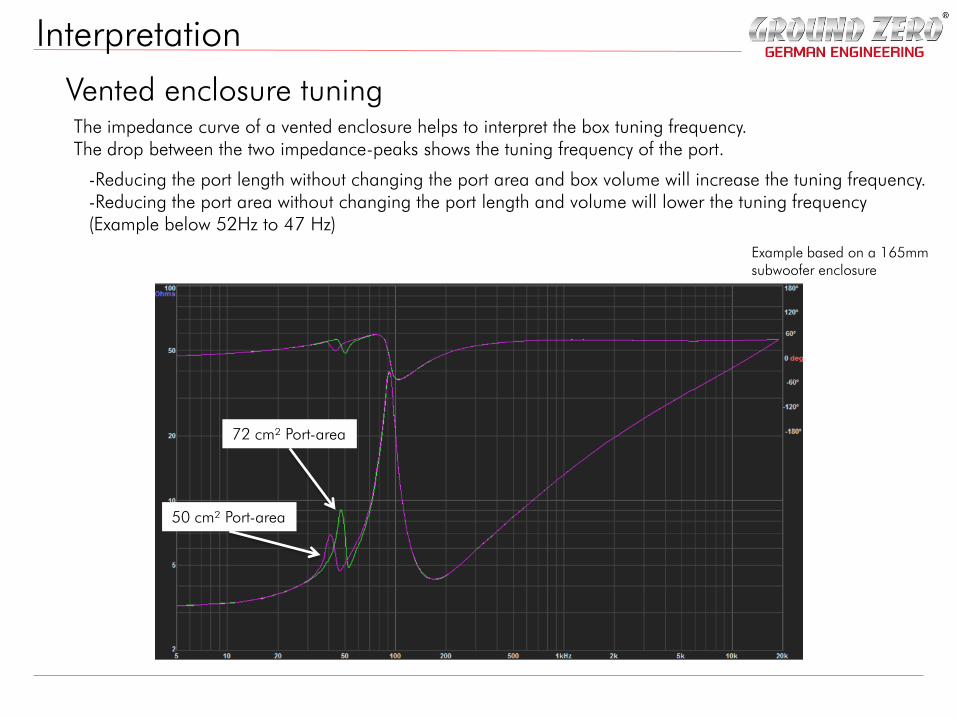
Vented enclosure tuning The impedance curve of a vented enclosure helps to interpret the box tuning frequency. The drop between the two impedance-peaks shows the tuning frequency of the port.
Example based on a 165mm subwoofer enclosure
50 cm² Port-area
72 cm² Port-area
-Reducing the port length without changing the port area and box volume will increase the tuning frequency. -Reducing the port area without changing the port length and volume will lower the tuning frequency (Example below 52Hz to 47 Hz)