examining the trends in building material prices: …examining the trends in building material...
TRANSCRIPT

Examining The Trends In Building Material Prices: Built Environment Stakeholders’ Perspectives
Abimbola Windapo ([email protected]) University of Cape Town, South Africa Keith Cattell ([email protected]) University of Cape Town, South Africa
Abstract
The paper investigates the trends in building material prices in South Africa. It examines whether there are differences in the perceptions held by built environment stakeholders, of the key factors that affect building material prices based on their profile, giving that there are various stakeholders in the built environment and their views may differ significantly. The rational for the examination stems from the lack of knowledge about the perspectives held by stakeholders as to what is responsible for the trends in the prices of building materials, and whether these can be benchmarked to actual economic indicators determined by statistical analysis. Knowledge of the key factors contributing to these trends is a step towards finding solutions to problems of project abandonment and gaps between the demand and supply of basic infrastructure prevalent in the industry. The paper provides information on building material price trends, and proposes a framework that will produce stable building material price levels.
Key Words: Building Material, Cement, Perception, Price, Steel and Volatility
187

1. Introduction
The 2010 soccer world cup was a milestone that brought about significant changes to the South African construction industry. The public and private sector made significant investments in major projects such as world-class stadiums, transport systems – roads and railways, and accommodation. However, at the helm of all these projects lie building materials and their costs. Generally, it has been estimated that building materials and building components constitute between 35-60% of total construction cost (Bourne, 1981; cidb, 2007; and Windapo and Cattell, 2010). The large proportion of building materials in construction project costs make it an important component which has an enormous effect on the cost of construction and essentially the affordability of newly proposed construction projects.
A study of built environment stakeholders in South Africa by Windapo and Cattell (2010) revealed that the key challenge perceived to affect the performance of the construction industry and projects in South Africa is primarily the increasing cost of building materials. Although, price increases are inevitable and will occur at some point, cidb (2007) observed that increases in the prices of some building material products are more rapid than that of others. If the price of material moves up and down rapidly over short time periods, it is said to have high volatility and if the price almost never changes, it has low volatility (Investor Words, 2004). According to Cross (n. d), volatility is the predictability of the price and availability of a construction material. Li (2001) noted that volatility pushes costs up and transfers major risk to all parties involved such as suppliers, contractors and clients, resulting according to Ashuri and Lu (2010) in building contract price fluctuation, changes in contractors’ profit margins in the absence of any provision in the contract (Chappell, Cowlin and Dunn, 2008) and major financial stress and difficulties within the project lifespan.
The cidb (2007) Report indicates that the volatile building materials in the South African construction industry are steel, cement, sand, copper, timber, PVC, bitumen and masonry blocks/bricks, which according to the Engineering News document cited within the cidb report, have increased up to 100% between October 2000 and October 2006. The questions therefore are is there a noticeable trend in changes in building material prices? What causes these price changes and why does the price of an item of building material rise more steeply or less steeply than other building material prices? In order to provide answers to these questions, the paper first presents the trends in prices of volatile building materials in South Africa within the last twenty years (1992-2011). Secondly, it identifies the materials, which have the most volatile prices. Thirdly, it examines whether there are differences in the perception held by different construction industry stakeholders of factors that affect building material prices based on their profile. Fourthly, it benchmarks the results of the perception survey of built environment stakeholders regarding the key factors responsible for the changes in building material prices with statistical evidence. Lastly, the paper makes proposals for an enabling environment that will promote stable building material price levels.
188

2. Tre
The grapmaterials1b.
Figure 1
Figure 1
Source:
ends in
phical repres in South A
1a: Trends in
1b: Trends in
Department
Building
sentation of Africa betwee
n Selected Vo
n Selected Vo
of Trade and
g Materi
f the trends en 1992 and
olatile Buildi
olatile Buildi
d Industry (d
al Prices
in the priced 2011 (a twe
ing Material
ing Material
dti) South Afr
s
s of cidb (2enty year pe
Prices Quar
Prices Quar
frica Online R
2007) identiferiod) is show
rterly Data (
rterly Data (
Resource (20
fied volatile wn in Figure
(1992-2011)
(1992-2011)
012)
building es 1a and
189

Visual inspection of Figures 1a and 1b show a definite increase in the cost of the identified building materials over the past two decades. It emerged that the building materials all increased consistently in year-on-year escalation up till 2001. After 2001, a distinct trend that can be seen is the volatility in the prices of reinforcing steel, cement, copper and galvanized roofing sheet, and the least increases in the price of sand.
Reinforcing steel, cement, copper, galvanized roofing sheet, crushed stone and cement blocks experienced the highest price increases when compared to the other building materials studied. For example, the price indices of reinforcing steel and cement increased in a space of ten years from 104.1 and 105.1 respectively in 2001, reaching a peak of 432.5 in 2008 for reinforcing steel, and a peak of 316.3 in 2010 for cement, before decreasing to current levels of 357.5 for reinforcing steel and 285.1 for cement. Representing 253%-328% and 180%-211% increases in the prices of steel and cement within the last ten years (2001-2011). Copper and galvanized roofing sheet increased from levels of 105.2 and 110.3 respectively in 2001, reaching peaks of 415.1 for copper and 299.5 for galvanized roofing sheet in 2008.
On the other side of the spectrum, it can be seen from Figures 1a and 1b that sand, aluminium roofing sheet and electrical materials in order of magnitude experience the least increase in price when compared to the other volatile building materials, increasing from an index of 109, 114.6 and 104.6 in 2001 to their current price index levels of 176.5, 213.3 and 226.5 respectively. The low increase in the index prices of sand should be expected because sand is a low value product that is characterized by its place value, which means the location of the deposit with reference to the market.
It can be gathered from the foregoing that there has been a definite increase in the prices of building materials over the past twenty years in South Africa, materials such as reinforcing steel, copper and cement increasing more rapidly and also more volatile in price changes than the other materials. Current levels of the price indices of the identified building materials show that apart from sand, aluminium roofing sheet and electrical materials, all the other materials including stock bricks, ceiling materials, SA pine-kiln dried wood and galvanized roofing sheet have all increased exponentially by at least 150% within the last ten years.
3. Review of Factors Contributing to Trends in Building Material Prices
The following are established economic factors that contribute to increases in building material prices:
• Supply and demand
According to Lipsey and Chrystal (2007), the demand for and the supply of building materials or lack thereof, can contribute to the trends in the prices of building materials, where the law of supply and demand can be related. Ortbals (2004) noted that cement and reinforcing steel feel the effect of demand rising with no matching supply the most.
190
The market conditions also bring about situations in which the effects of demand and supply may affect building material price levels. Rakhra and Wilson (1982) acknowledged that building material price increases are dependent on the market conditions under which they are produced. For example, they noted that material price increases would be more rapid and higher for materials produced by only one or two companies, compared to those for which many manufacturers compete for the same market.
• Transportation
Sinclair, Artin and Mulford (2002) noted that increased material cost is primarily due to increased transport charges. Further, high transport and freight costs have been identified as the factors responsible for building material price increases in African countries such as Nigeria, Uganda, and Kenya (Mathews, 2009; Mwijagye, 2010; and Editor, 2011).
• Energy Costs
According to Bureau of Economic Research (BER) (2008), high-energy costs have a knock-on effect on the production processes of most construction materials in South Africa, because manufacturers have to increase building material prices to wage off the increases in high-energy costs.
• Raw Materials and Input Costs
Prior (2011) and Iyengar (2011) acknowledged that rising raw materials costs along with other factors such as oil, gas and energy are the key causes of increases in the prices of building materials such as cement, roofing membranes and water proofing.
• Inflation
Inflation is the general upward trend of prices of goods and services within an economy, it is essentially a measure of how the prices of goods and services increase over time (Fichtner, 2011). The principle behind inflation and how it affects building material prices according to Rakhra and Wilson (1982) is that there is a time lag between an increase in inflation and the effective resulting increase in building material prices.
• Crude Oil Prices
Stats SA (2011) and the BER (2008), noted that the Production Price Index (PPI) of various materials rose together with increasing diesel costs in South Africa. Further, Anderson (2011) noted that the global crude oil price is the main driver behind the volatility of some building materials such as PVC, which is a polymer whose raw production material is crude oil.
191
• Exchange Rates
The exchange rate between two currencies is the amount for which one currency is exchanged for the other, and is used in determining the strength of one currency to another. The degree to which building material prices are affected by exchange rate movements depend on the types and quantities of materials being imported by a country at a specific time, the need to import the raw materials used in the production of building materials locally, and on whether local materials (such as copper, timber and steel) are internationally traded commodities (Busreport, 2006; Mohamed, 2006; and Anderson, 2011).
• Import Duties
Import duties are a charge on goods and products brought into South Africa and are put in place to protect local producers from clients trying to outsource cheaper goods from abroad (National Treasury of South Africa, 2008). Import duties on materials have been noted to affect the construction industry and building material prices in countries such as Malaysia, India, Uganda, Kenya and Oman (Editor, 2007; Al-Shaibany, 2008; Odhiambo, 2008; Master Builders Association of Malaysia (MBAM), 2011; Hamsawi, 2011).
4. Concept of the study
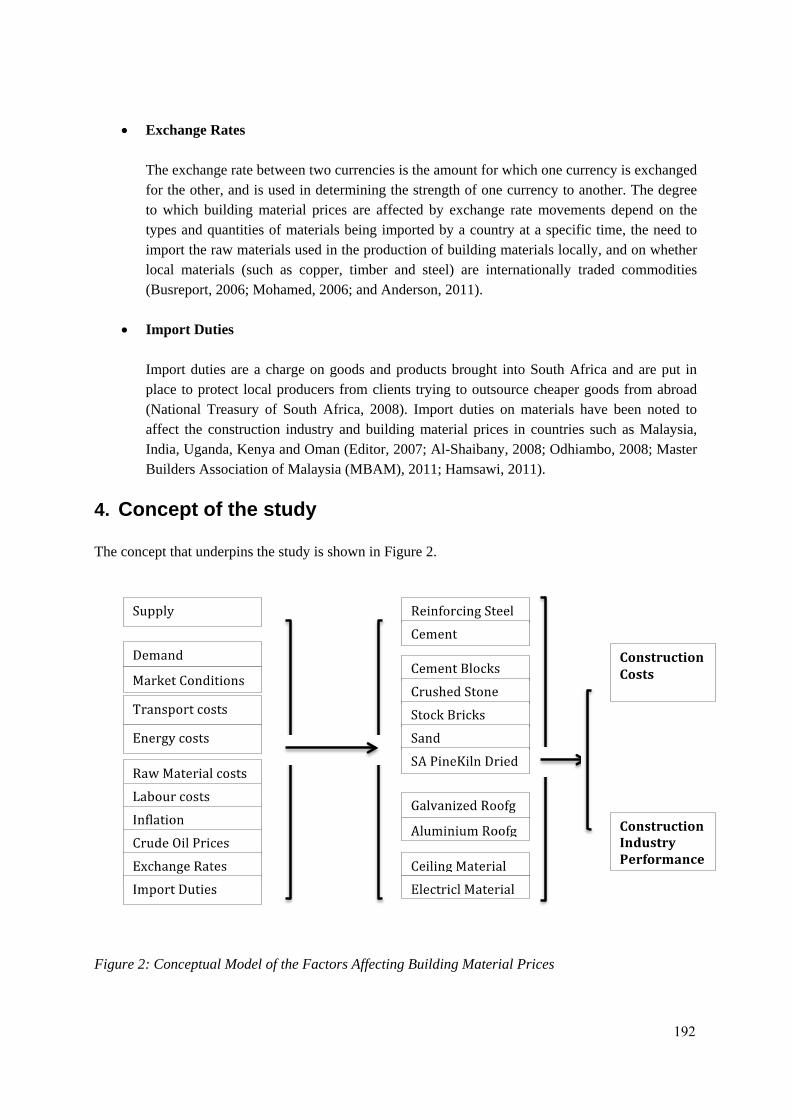
The concept that underpins the study is shown in Figure 2.
Figure 2: Conceptual Model of the Factors Affecting Building Material Prices
192

The conceptual model in Figure 2 shows the interrelationships between the economic factors identified in literature, the increasing levels in prices of selected volatile building materials and its resultant effect on construction costs and industry performance. The concept of the study is hinged on the basis that the increasing levels in the prices of building materials can be determined by factors such as energy costs, inflation, raw materials and input costs, transport costs, import duties, demand, supply, exchange rates, crude oil prices and market conditions. The model presupposes that increase in the prices of volatile building materials such as cement, steel, timber, copper, masonry, PVC, bitumen, aggregates and so forth, will invariably lead to an increase in construction costs and affect the performance of the construction industry.
The study will therefore test a proposition that there are key factors perceived by construction industry stakeholders to affect the prices of building materials and that these factors can be benchmarked to actual economic indicators using statistical analysis. The study will also test the hypothesis that there are differences in the key factors perceived by built environment stakeholders to affect the prices of building materials based on their various profiles. That is,
Ho (Null Hypothesis): U1 = U2 = U3; Ha (Alternative Hypothesis): U1, U2, U3 are not equal.
5. Research Method
The detail of the research problem is to examine whether there are differences in the perception held by different construction industry stakeholders of factors that affect building material prices based on their profile. The study made use of the survey approach in which information not available from other sources may be obtained, probability sampling may be executed, and where an unbiased representation of population may be realized. A questionnaire was thus used for this purpose. The questions were structured to elicit information about the background profile of the respondents presented in Table 3, information regarding the perspectives of the respondents of the factors that contribute to building material price increases was sought using a five point Likert scale (Table 2 and Table 3). Secondary data was obtained from three documented sources – BER Index, dti and Stats SA records. The index information was taken and not the real price information due to the fact that the index information is comparable and more accurate (the indices take into account a number of different rates and prices from suppliers and average them out to reach an index amount).
The survey population was construction industry specific focusing on contractors, quantity surveyors and building material suppliers. These three disciplines deal with building material prices within the industry, which will therefore imply accurate, reliable and valid responses. A population of 382 built environment stakeholders, was randomly selected from a list of cidb Registered Contractors, Quantity Surveyors and Building Material Suppliers, in order to obtain the required response rate and sample size, which is statistically acceptable. According to Ott and Longnecker (2001), the central limit theorem holds true when the sample size is equal to or greater than 30, and when other assumptions are also met. Table 1 shows the number of survey sent out between July and August 2011 (a six-week period), using the SurveyMonkey© web based survey tool and the response rate.
193

Table 1: Number Of Surveys Sent To Sectors Of The Construction Industry
Contractors Quantity Surveyors Material Suppliers Total
Number Sent 249 101 32 382
Responses 36 11 6 53
Response rate 14.5% 10.9% 18.8% 13.9% It can be seen from Table 1 that the study achieved an overall response rate of 13.9%. The highest response rate was obtained from the building material suppliers cohort. The combined response from the three groups within the South African construction industry eliminates any bias of opinion that would have emanated, if responses had been taken from one group.
The data obtained was analyzed using descriptive and inferential statistics. A mean item score (MIS) was used to calculate the mean results of the responses on a 5-point Likert scale. The results of the MIS score will present itself as a number ranging between 0 and 1. The ranges shown in Table 2 depict the specific measurements used in the Likert scale and in the interpretation of the MIS score.
Table 2: Mean Item Score (MIS) Grading Table (5 Scale)
Measurement Score
No Impact (M1) 0 to 0.19
Low (M2) 0.20 to 0.39
Medium (M3) 0.40 to 0.59
High (M4) 0.60 to 0.79
Very High (M5) 0.80 to 1.00
The formula used for the computation of the MIS score is as follows:
6. Data Presentation and Analysis
The data collected from survey responses related to both the stakeholders’ perception of factors contributing to the trends in building materials prices and what are the key volatile building materials. The results of the survey and data analysis performed are presented in this section.
6.1 Background Profile of Respondents
Table 3 presents the distribution of the stakeholder’s rank of factors perceived to affect building material prices, according to their company, position in the company and years of experience.
194

Table 3: Distribution of Respondents Rank of Factors Perceived to affect Building Material Prices by
Type of Company, Position in Company and Years of Experience
Profile
Rank of Factors (MIS Scores)
Tran
spor
t Cos
ts
Cru
de O
il Pr
ices
Labo
ur C
osts
Ener
gy C
osts
Infla
tion
Raw
Mat
eria
l Cos
t
Dem
and
Supp
ly
Man
ufac
ture
r’s
Prof
it
Mar
ket C
ondi
tion
Exch
ange
rate
Impo
rt D
utie
s
Rank (All Respondents) 1
(0.86) 2
(0.80)
3 (0.79)
4 (0.76)
4 (0.76)
6 (0.75)
7 (0.71)
7 (0.71)
9 (0.64)
10 (0.62)
11 (0.60)
12 (0.57)
Type of Company (N = 52)
Contractor (69.2%) 1
(0.86) 2
(0.81)
3 (0.79)
6 (0.75)
5 (0.76)
4 (0.78)
8 (0.68)
7 (0.71)
10 (0.62)
9 (0.65)
12 (0.59)
11 (0.61)
Quantity Surveyor (21.2%)
1
(0.84) 5
(0.75)
3 (0.76)
6 (0.73)
3 (0.76)
9 (0.65)
2 (0.78)
7 (0.72)
8 (0.69)
10 (0.62)
11 (0.58)
12 (0.52)
Material Supplier (11.5%)
1
(0.93) 3
(0.83)
4 (0.84)
2 (0.87)
7 (0.73)
6 (0.76)
5 (0.77)
8 (0.72)
10 (0.67)
12 (0.44)
9 (0.70)
11 (0.47)
Position in the Company (N = 51)
Owner (25.5%) 1
(0.92) 4
(0.80)
3 (0.82)
7 (0.74)
2 (0.87)
5 (0.77)
9 (0.72)
8 (0.73)
6 (0.77)
10 (0.68)
11 (0.63)
11 (0.63)
Director (51%) 1
(0.83) 3
(0.76)
2 (0.80)
6 (0.74)
3 (0.76)
3 (0.76)
7 (0.72)
8 (0.70)
10 (0.63)
9 (0.64)
12 (0.60)
11 (0.62)
Management Staff (25.5%)
1
(0.88) 2
(0.83)
4 (0.74)
3 (0.80)
8 (0.64)
4 (0.74)
7 (0.68)
6 (0.70)
11 (0.52)
9 (0.58)
10 (0.55)
12 (0.40)
Technical Staff (3.9%) 3 (0.80)
1 (0.93)
3 (0.80)
2 (0.86)
3 (0.80)
8 (0.67)
8 (0.67)
6 (0.73)
8 (0.67)
12 (0.40)
7 (0.70)
11 (0.60)
Years of Experience in the Construction Industry (N = 52)
Less than 10 years (15.4%)
2
(0.88) 1
(0.90)
5 (0.80)
2 (0.88)
4 (0.87)
7 (0.73)
10 (0.66)
8 (0.69)
12 (0.58)
11 (0.60)
6 (0.76)
9 (0.68)
B/w 10 & 20 years (36.5%)
1
(0.91) 3
(0.81)
2 (0.83)
5 (0.77)
7 (0.76)
4 (0.79)
8 (0.73)
5 (0.77)
9 (0.68)
9 (0.68)
11 (0.61)
12 (0.60)
More than 20 years (48.1%)
1
(0.83) 2
(0.75)
2 (0.75)
6 (0.72)
4 (0.73)
4 (0.73)
7 (0.70)
8 (0.68)
9 (0.63)
10 (0.58)
11 (0.56)
11 (0.54)
195
Table 3 shows that 69.2% of the respondents are contractors, 21.2% are quantity surveyors and 11.5% are material suppliers. Owners, directors and management staff completed the majority of the surveys, with 51% of the respondents being in the directorial cadre of their companies. Table 3 also reveals that built environment stakeholders with over 20 years’ experience answered more than 45% of the survey questionnaire and that more than 80% of the respondents have a minimum of 10 years experience. It can be inferred from Table 3 that the data collected from these cohort of respondents will provide reliable and valid information due to the sector of the construction industry in which they come from, position held in the company and number of years of work experience.
It also emerged from the data presented in Table 3 that all the factors identified in literature were perceived by the respondents to have an influence on the prices of building materials but to varying degrees. The key factors perceived by all the respondents to affect building material price increases are transport costs and crude oil prices with MIS scores of 0.86 and 0.80 respectively. Labour costs also emerged as the third key factor, with an MIS score of 0.79. Import duties were perceived to have the lowest impact with an MIS score of 0.57.
Further analysis of the results obtained in Table 3 using the Kruskal-Wallis k-test method of inferential analysis, to test the hypothesis that the perceptions of the respondents differ based on profile revealed that:
• The calculated k value (91.30) is higher than the significant level of 0.05 of the χ2 tabulated value (5.991) when the results are tested for difference in perception based on position held in the company. Hence, the test result is significant and the alternative hypothesis is accepted that there is a significant difference in the respondents perception of the key factors affecting the prices of building materials based on their position (owner, director or management staff) in the company. The results for the technical staff were excluded from the analysis because the sample size obtained was less than five (Levin and Rubin, 1990).
• The calculated values of k (-2.72 and 3.06) are less than the tabulated value of χ2 (5.991) for perceptions based on the type of company and the respondents’ years of experience in the construction industry respectively. Therefore, the samples’ lie within the acceptance region and the test result is not significant. Therefore, the null hypothesis is accepted that there is no difference in the perception of the respondents with regards to the key factors contributing to building material prices based on the type of company in which the respondent works, or based on the respondents’ years of experience in the construction industry.
6.2 Respondents’ Perception of Building Materials with Volatile Prices
The MIS scores of the perception held by respondents regarding the building material with volatile prices are presented in Table 4.
Table 4 shows that the building materials perceived by the respondents to have volatile prices are steel, copper, cement and bitumen in the order of volatility. When the respondents’ perceptions are
196

benchmarked to the actual price increases analyzed in Section 2, it emerged that steel, copper and cement, in order of volatility, which are perceived to be the high ranking volatile building materials, is comparable to the actual and that the stakeholders’ have an accurate knowledge of the volatile building materials in the construction industry.
Table 4: Perception of Building Materials with Volatile Prices
Building Material Scale Total Response
MIS Score
Rank
Highly Volatile (3) Volatile (2) Not Volatile (1)
Steel 36 14 1 51 0.90 1
Copper 23 21 4 48 0.80 2
Cement 21 21 9 51 0.75 3
Bitumen 14 28 8 50 0.71 4
Lumber 7 24 17 48 0.60 5
Masonry Bricks/Blocks 6 22 21 49 0.56 6
Sand 3 25 22 50 0.54 7
6.3 Benchmarking Respondents Perceptions against the actual
The study sought to benchmark the respondents’ perception against actual economic indicators that may affect future building material prices. The correlation coefficients computed for the economic indices between 2001 and 2011 fourth quarter and the building material price index (BMP), are presented in Table 5.
Table 5: Rank of Correlation Coefficients and Respondents’ Perception
Economic Indicators Correlation Coefficients
Level of Significance
Rank based on Correlation Coefficients
Rank based on Perception (Table 3)
Labour Cost 0.980** S 1 3
Inflation 0.973** S 2 4
Transport Cost 0.963** S 3 1
Electricity 0.850** S 4 4
Supply 0.805** S 5 7
Energy Cost 0.758** S 6 4
Oil Index 0.743** S 7 2
Demand 0.159 NS 8 7
Exchange Rate 0.112 NS 9 11 ** Correlation is significant at the 0.01 level (2-tailed) S = Significant NS = Not Significant Spearman’s Rho (2-tailed) = 0.570 (Not Significant)
197

Table 5 reveals that Labour cost had the highest correlation with building material prices, followed by inflation and transport cost. Further analysis of the data presented in Table 5, using the Spearman Rank Correlation analysis established that the calculated Rho value of 0.570 in the two-tailed test between the rank based on correlation coefficients computed using actual economic indicators, and the rank based on MIS scores computed from the perception survey, is not significant. The null hypothesis (Ho) is therefore accepted that there are no significant differences in the ranking of the actual and perceived factors that affect the prices of building materials. Based on these findings, it can be concluded that built environment stakeholders have an accurate knowledge and are aware of the factors that affect the prices of building materials and also knowledge of the materials, which are volatile.
7. Discussion of Findings
It emerged from the examination of the prices of building materials between 1992-2011 (a twenty year period) that there has been a definite increase of between 126% and 383% in the prices of building materials, and that reinforcing steel, copper and cement which were at the top of the spectrum experienced rapid changes and significant increase in prices within the last five years (2007-2011). Further, the study established that the respondents perceived the top three volatile building materials to be steel, copper and cement in order of volatility. It therefore appears that the respondents’ examined have an accurate knowledge of volatile building materials.
It also emerged from the study undertaken that the key factor perceived by the respondents to cause increases in building material prices is transportation followed by crude oil prices, while market conditions, manufacturers’ profiting, exchange rates and import duties were perceived to be of lower impact. However, further interrogation of the data suggests that there are differences in the perception held by the built environment stakeholders, based on their respective position in the company. Suggesting that company owners, directors and management staff in the construction industry, have differing opinions of the factors that affect price increases in the construction industry. That is, the factor considered to have very high impact on building material prices by the company owner is not viewed in the same category by the directors and managers, and vice versa.
The study also established that there are no differences in the opinions held by the respondents of the factors perceived to affect building material prices based on the type of company in which they work or on their years of experience in the construction industry. Implying that the respondents’ perceptions could not be differentiated on the basis of the company in which they work or, on their years of experience.
The study findings established that there is a correlation between the factors perceived by the built environment stakeholders to affect building material prices and the actual economic indicators determined by statistical analysis. Implying that built environment stakeholders apparently have an accurate knowledge and are also aware of the factors that affect the prices of building materials. It can be inferred from the study findings that the factors that cause the prices of volatile building materials such as steel, copper and cement to rise rapidly are transport costs, crude oil prices, labour and energy
198

costs. The identified materials minus copper are dense and therefore necessitate high freight costs. Also, these materials require and consume a lot of energy during their extraction and manufacturing processes.
8. Conclusions
It can be concluded that the prices of building materials specifically cement, copper and reinforcing steel are increasing rapidly in South Africa and that the built environment stakeholders are aware and are well-informed about the building materials that are subject to volatility, and the factors including transport costs, crude oil prices, labour costs and energy costs that affect building material prices. Suggesting that if the problems of increasing building material prices is going to be solved in the South African construction industry, particular attention has to be paid to factors such as transport costs, crude oil prices, labour costs and energy costs and also to highly volatile building materials such as steel, copper and cement.
In order to provide lasting solutions, and bring about stable building material prices and avoid a scenario of continuous price increases, the following measure is proposed to counter the problems of transportation and rising fuel prices, since transportation costs which include the transportation of raw materials to the factory and of the distribution of the finished products from the factory to the end user, it is recommended that the South African government develops existing infrastructure to include high-speed freight trains and durable highways, which would bring about the raw materials being transported to the factories efficiently and the effective distribution of the finished products to suppliers and end-users.
9. Acknowledgements
The authors acknowledge the contributions made by Mr. Peter Laing, Mr. Gavin Marcus and Mr. Abdul Dhansay graduate students of the Department of Construction Economics and Management, University of Cape Town to this paper.
10. References
Al-Shaibany, S. (2008) Oman mulls import duty cuts on building materials, available: www.arabianbusiness.com/ [accessed on 12 July 2011].
Anderson, J. A. (2011) 6 factors affect today's bid prices, Daily Journal of Commerce, 1, available: http://www.djc.com/news/co/12028676.html [accessed on: 14 July 2011].
Ashuri, B., & Lu, J. (2010) Time Series Analysis of ENR Construction Cost Index, ASCE Journal of Construction Engineering and Management, 136(11), 1227-1237.
Bourne, L. (1981) The Geography of Housing, Toronto: V. H. Winston and Sons.
199

Bureau of Economic Research (BER) (2008) Report on Building Costs – Third Quarter, BER, Stellenbosch.
Busreport (2006) Construction costs to soar with cement price increase, Daily Tenders available: www.dailytenders.co.za/Global/News/Article/Article.asp?ID=2442 [accessed on: 10 July 2011].
Chappel, D., Cowlin, M., & Dunn, D. (2010) Building Law Encyclopaedia, West Sussex: Wiley-Blackwell.
cidb, (2007) The Building and Construction Materials Sector, Challenges and Opportunities. Pretoria: cidb.
Cross, J. P. (n.d.) Construction Material Volatility: A Twelve-Month Perspective, AISC, available: www.aisc.org/ [accessed on: 2 July 2011].
Department of Trade and Industry (dti) (2012), Data, available: http://www.dti.gov.za/econdb/cssrap/ [accessed on: 01 March 2012].
Editor, (2007) To keep price and supply of cement on track, import duty scrapped, Indian Express, available: www.indianexpress.com/ [accessed on: 24 June 2011].
Editor, (2011) Cement Prices up due to rising transport costs, Construction Business Review, available: http://www.constructionkenya.com/ [accessed on: 07 July 2011].
Fichtner, P. (2011) Inflation and Solvency Models – Are We Missing Something? Deloitte.com, available: www.deloitte.com/assets/.../ch_en_Inflation_Solvency_Models.pdf [accessed on: 24 May 2011].
Hamsawi, R. (2011) Builders seek import duty cut, Vlex.com, available: my.vlex.com/vid/builders-seek-import-duty-cut-326516491 [accessed on: 11 July 2011].
Investor Words.com (2004) Volatility Definition, Investorwords.com, available: http://www.investorwords.com/5256/volatility.html [accessed on: 18 March 2011].
Iyengar, S. P. (2011) High raw material costs to hit Q4 profits of cement companies, BusinessLine.com, available: www.thehindubusinessline.com/ [accessed on: 07 July 2011].
Levin, R. I., and Rubin, D. S. (1990) Statistics for Management, 5th Ed., New Jersey: Prentice-Hall.
Li, C. K. (2001) Internet-based geographical information systems system for E-commerce application in construction material procurement’, ASCE Journal of Construction Engineering and Management, 129 (6), 689-697.
Lipsey, R. G., and Chrystal, K. A. (2007) Economics, 11th Ed., New York: Oxford University Press.
200
Mathews, S. (2009) Building material price increases expected in 2010, ConstructionWeek.com, available: www.constructionweekonline.com/ [accessed on: 02 April 2011].
MBAM (2011) Builders ask Govt to Liberalise Imports of Building Materials, Master Builders’ Association of Malaysia, available: http://www.niuzer.com/Malaysia/ [accessed on: 10 July 2011].
Mohamed, S. (2006) The costs of ongoing exchange-rate volatility, EngineeringNews.co.za, available: http://www.engineeringnews.co.za/article/the-costs-of-ongoing-exchangerate-volatility-2006-11-24 [accessed on: 10 July 2011].
Mwijagye, P. (2010) Building Materials in Uganda Prices up. Allafrica.com, available: allafrica.com/stories/201010041329.html [accessed on: 03 July 2011].
National Treasury of South Africa (2008) Customs/Import Duties, Pretoria, South Africa.
Ott, R. L. & Longnecker, M. (2001) An introduction to statistical methods and data analysis, California: Duxbury, Pacific Grove,
Odhiambo, A. (2008) Cement firms gear up for battle as import duty is cut, Allafrica.com, available; allafrica.com/stories/200806231611.html [accessed on: 03 July 2011].
Ortbals, A. J. (2004) Hurricane quartet expected to spike cost of home building materials, Illinois Business Journal, 1.
Prior, G. (2011) Icopal hikes prices by 10% as raw material costs soar, available: www.constructionenquirer.com/ [accessed on: 04 May 2011].
Rakhra, A. S. & Wilson, A. J. (1982) Inflation, Budgeting and Construction Costs, National Research Council Canada, available: www.nrc-cnrc.gc.ca/obj/irc/doc/pubs/brn/brn197/brn197.pdf [accessed on: 15 June 2011].
Sinclair, N., Artin, P., and Mulford, S. (2002) Construction Cost Data Workbook, Proceedings of Conference on the International Comparison Program, World Bank, March 11-14, 2002, Washington, D. C. USA.
Stats SA (2011) Producer Price Index, statssa.gov.za, available: http://www.statssa.gov.za/PublicationsHTML/P01421March2011/html/P01421March2011.html [accessed on: 05 May 2011]
Windapo, A. O., & Cattell, K. (2010). Perceptions of key construction and development challenges facing the construction industry in South Africa, Proceedings of the 5th Built Environment Conference of Association of Schools of Construction of Southern Africa (ASOCSA), July 2010, Durban, South Africa.
201